Article

Hybrid Systems Optimization: Application to Hybrid Systems Photovoltaic Connected to Grid. A Mali Case Study

by
Amadou Fousseyni Touré
1,2,
Sid Ali Addouche
1,
Fadaba Danioko
2,
Badié Diourté
2 and
Abderrahman El Mhamedi
1,*
1
Equipe MGSI, Laboratoire Quartz, IUT de Montreuil, 93100 Montreuil, France
2
Faculté des Sciences et Techniques de Bamako, Université des Sciences Techniques et Technologies de Bamako (USTTB), Bamako, Mali
*
Author to whom correspondence should be addressed.
Sustainability 2019, 11(8), 2356; https://doi.org/10.3390/su11082356
Submission received: 27 March 2019 / Revised: 11 April 2019 / Accepted: 15 April 2019 / Published: 19 April 2019
(This article belongs to the Special Issue Economic Evaluation of Renewable Energy Sources)

Abstract

:
Access to electricity and supplying reliable energy are the key elements that support local economic development and contribute to reducing poverty. Moreover, the problem of environmental protection can be considered as a factor of sustainable development. In response to these many challenges, appropriate national and regional policies, as well as mechanisms, have been implemented. In Mali, strong dependence on the importation of oil, growth in demand, and the low rate of electrification have pushed the highest authorities to think of diversified technological solutions like renewable energy for the satisfaction of energy demands, especially photovoltaics, for which the country has significant potential. The hybrid systems used is a compromise, because the emission rate of carbon dioxide emitted by thermal power plants must be reduced and limited to preserve supernatural disasters. For this, hybrid photovoltaic systems coupled to the grid increased, but the management of the production of these photovoltaics poses a lot of problem due to its intermittent status. It is in this context that we conducted an optimization study of a hybrid system photovoltaic connected to the grid. We applied our approach to the most extensive distribution post of Mali capital. For the simulation, we used the modeling and simulation tool named HOMER.

1. Introduction

1.1. General Introduction

The intense energy demand, as well as the instant consumptions, believe very quickly according to the seasons (winter and summer), the depletion and impact of fossil fuel deposits are becoming threatening [1]. However, the production of energy in quantity and quality is a challenge of great importance. Dependence on fossil fuels as a primary energy source will lead to the depletion of fuels, environmental pollution, and negative impacts on human health [1]. 
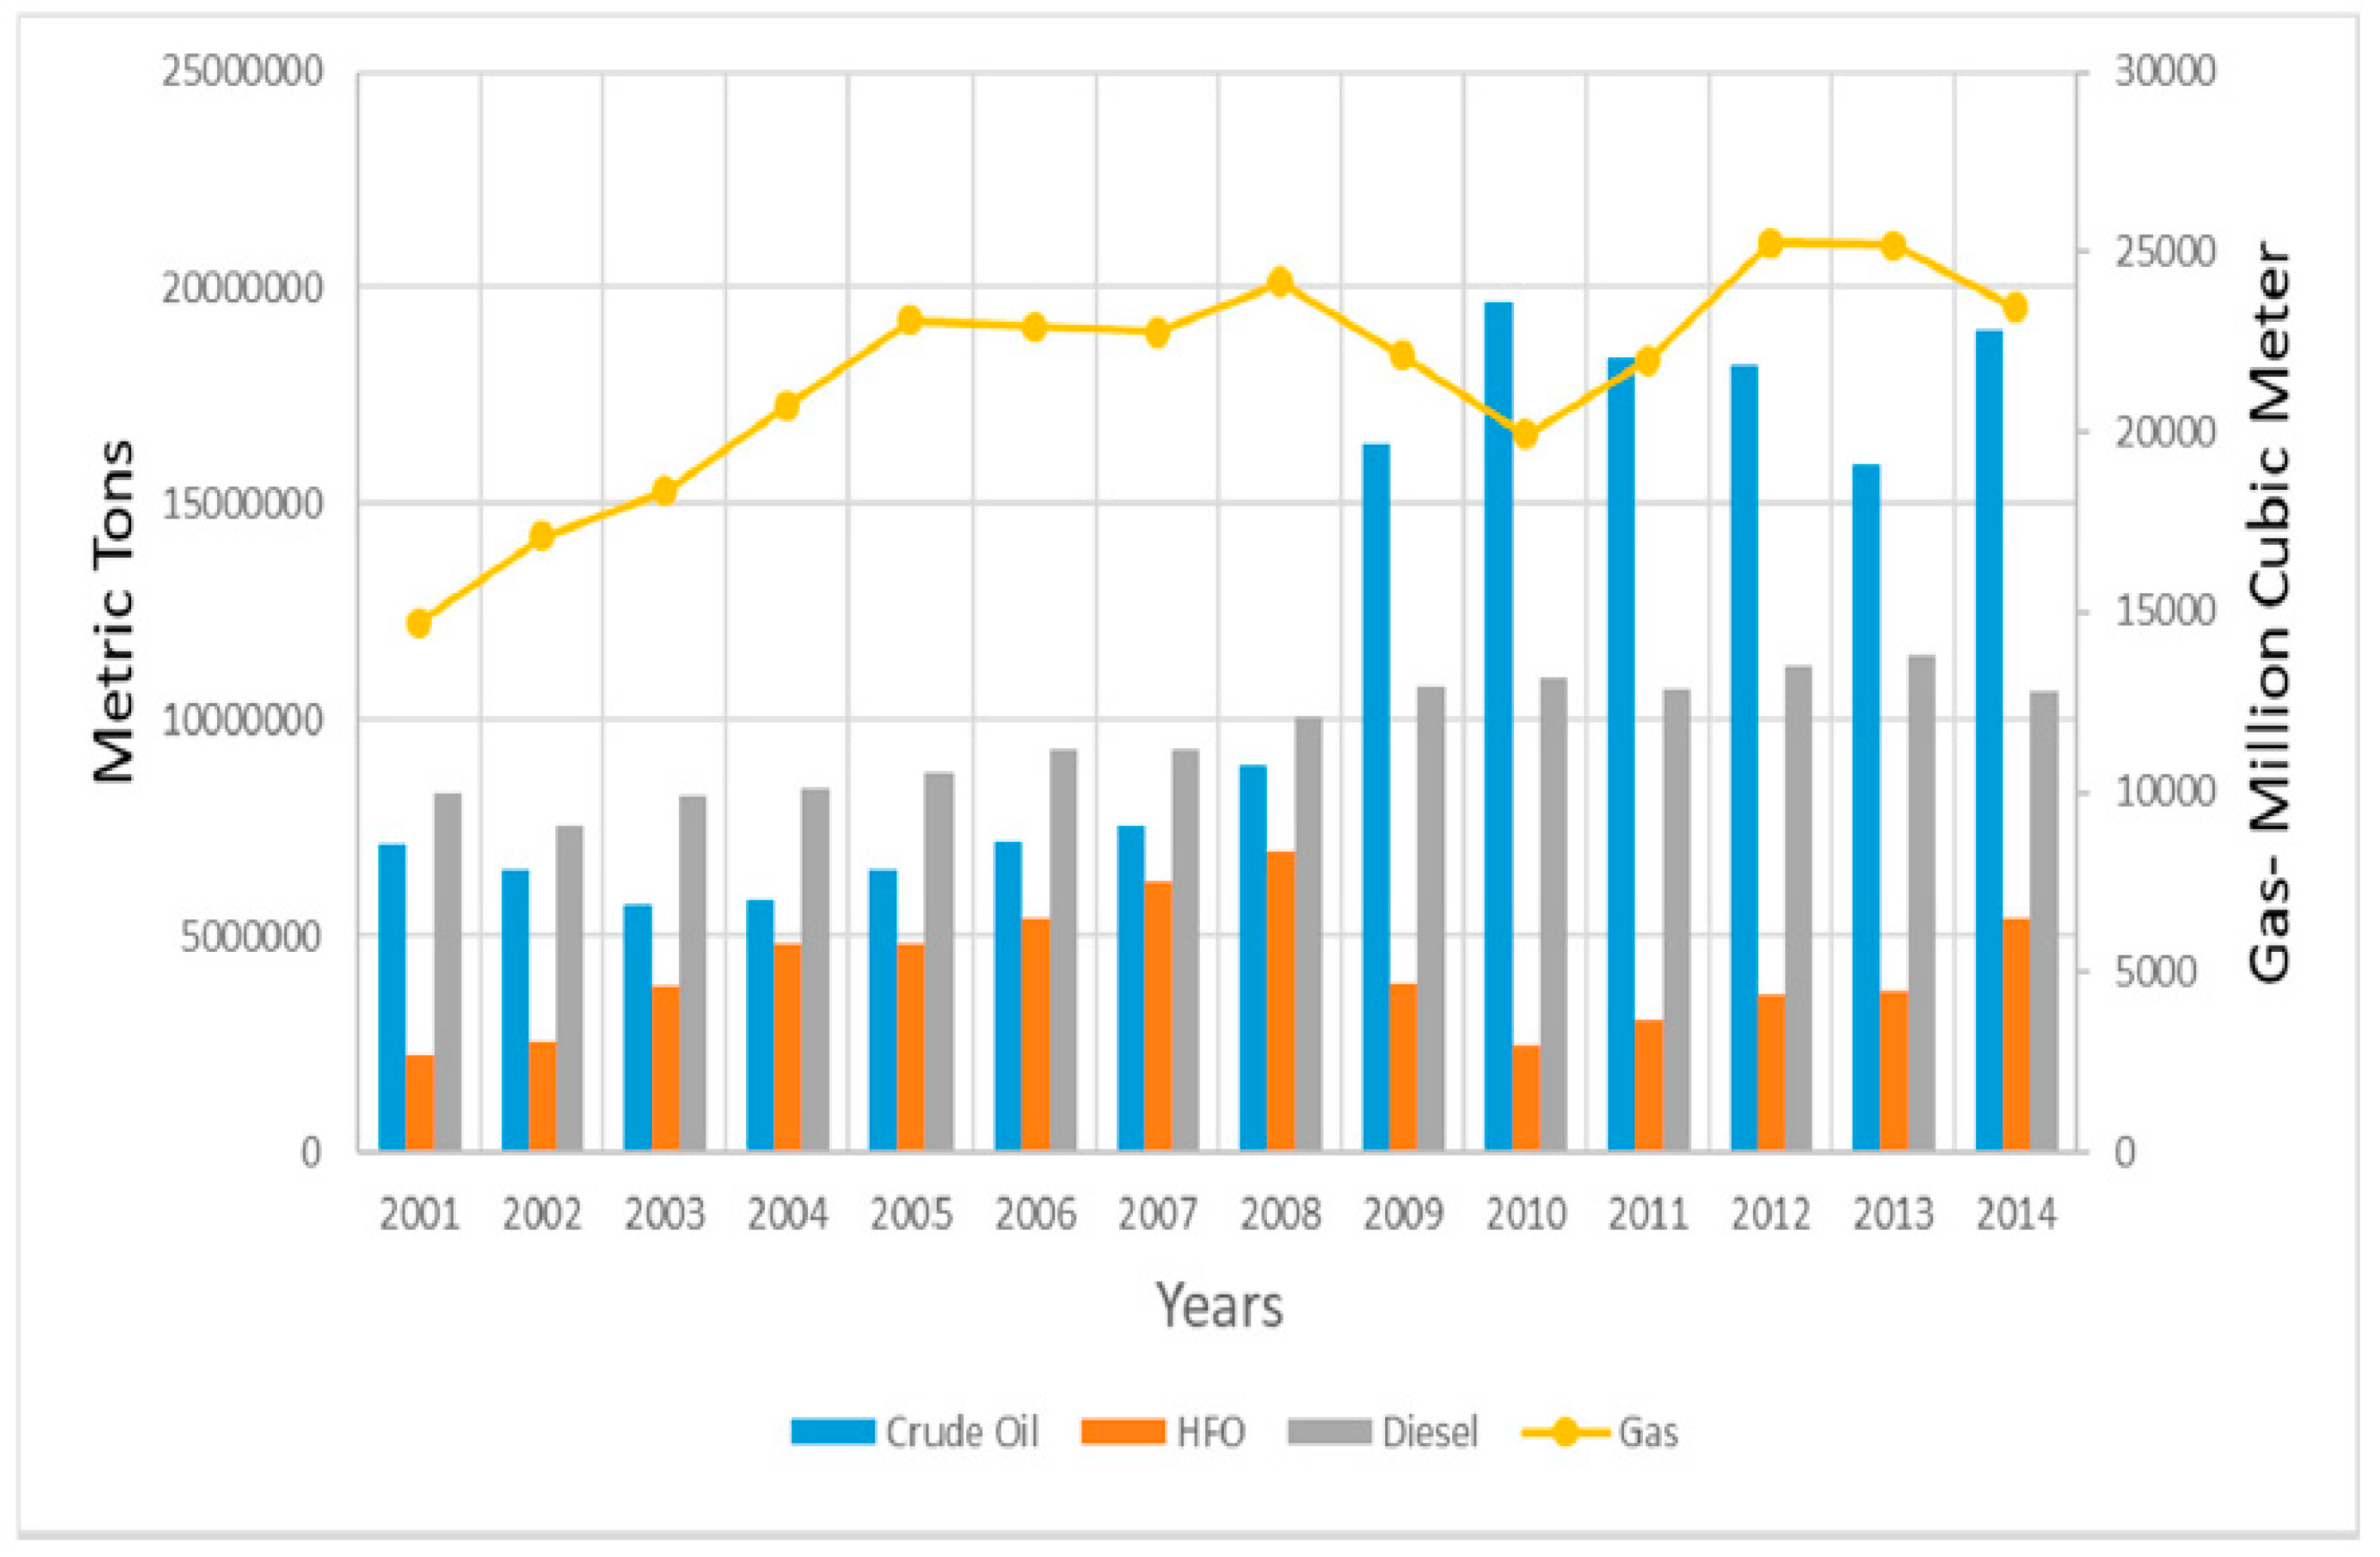
Figure 1 illustrates the evolution of fuel consumed for power generation from 2000 to 2014 [2]. Today, faced with the adverse consequences of climate change, it is essential to maintain the global temperature below 2 °C, a maximum increase of only 1.5 °C [3]. For it, the implementation of photovoltaic-grid hybrid power plants for the production of electricity will reduce the level of CO2 emissions, and contribute to increasing revenues [4]. To achieve these objectives and mitigate global warming, the use of renewable energies, which is an abundant resource accessible to all, is a sustainable solution. Therefore, many countries have begun to include solar energy programs in their planning to support sustainable development and environmental protection [5,6,7,8]. Between 1998 and 2008, the average annual generation of solar and wind sources rose by 29.6% and 29.4%, respectively [9]. An analytical study carried out to evaluate different renewable energy sources in Saudi Arabia has shown that photovoltaic (PV) energy, concentrated solar energy, and wind power are, respectively, the most efficient renewable energies [10]. The global capacity of integrated photovoltaic systems in 2016 was 106 GW from the European Union, 77.4 GW from China, 42.8 GW from Japan, and 40.9 GW from the United States of America [11,12]. In 2017, this capacity was increased to 131.1 GW in China, 108 GW in the European Union, 51 GW in the United States of America, and 49 GW in Japan [13].
The investment costs of photovoltaic (PV) technology are now near the lowest cost level, and the additional reduction can be achieved by discovering new raw products or by developing a cheaper materials manufacturing technology [14]. The leveled cost of electricity (LCOE) of PV panels with an installation size of 1 kW to 6 kW, under Italian conditions, was between 0.10 and 0.11/kWh, which is considered competitive with other green electricity technologies [15]. The amount of electricity produced by the PV modules depends mainly on the composition, type of the module, the combined effect of the installation, and the dominant natural factors [16]. Concerning the energy efficiency ratio of the photovoltaic technology, single-crystalline Si and multi-crystalline Si systems can provide a >90% net-to-gross energy return ratio, even when deployed in non-optimal locations, according to Leccisi et al. [17]. However, because of the photovoltaic module heating, its energy production decreases, affecting the total energy production of the PV system [18,19].
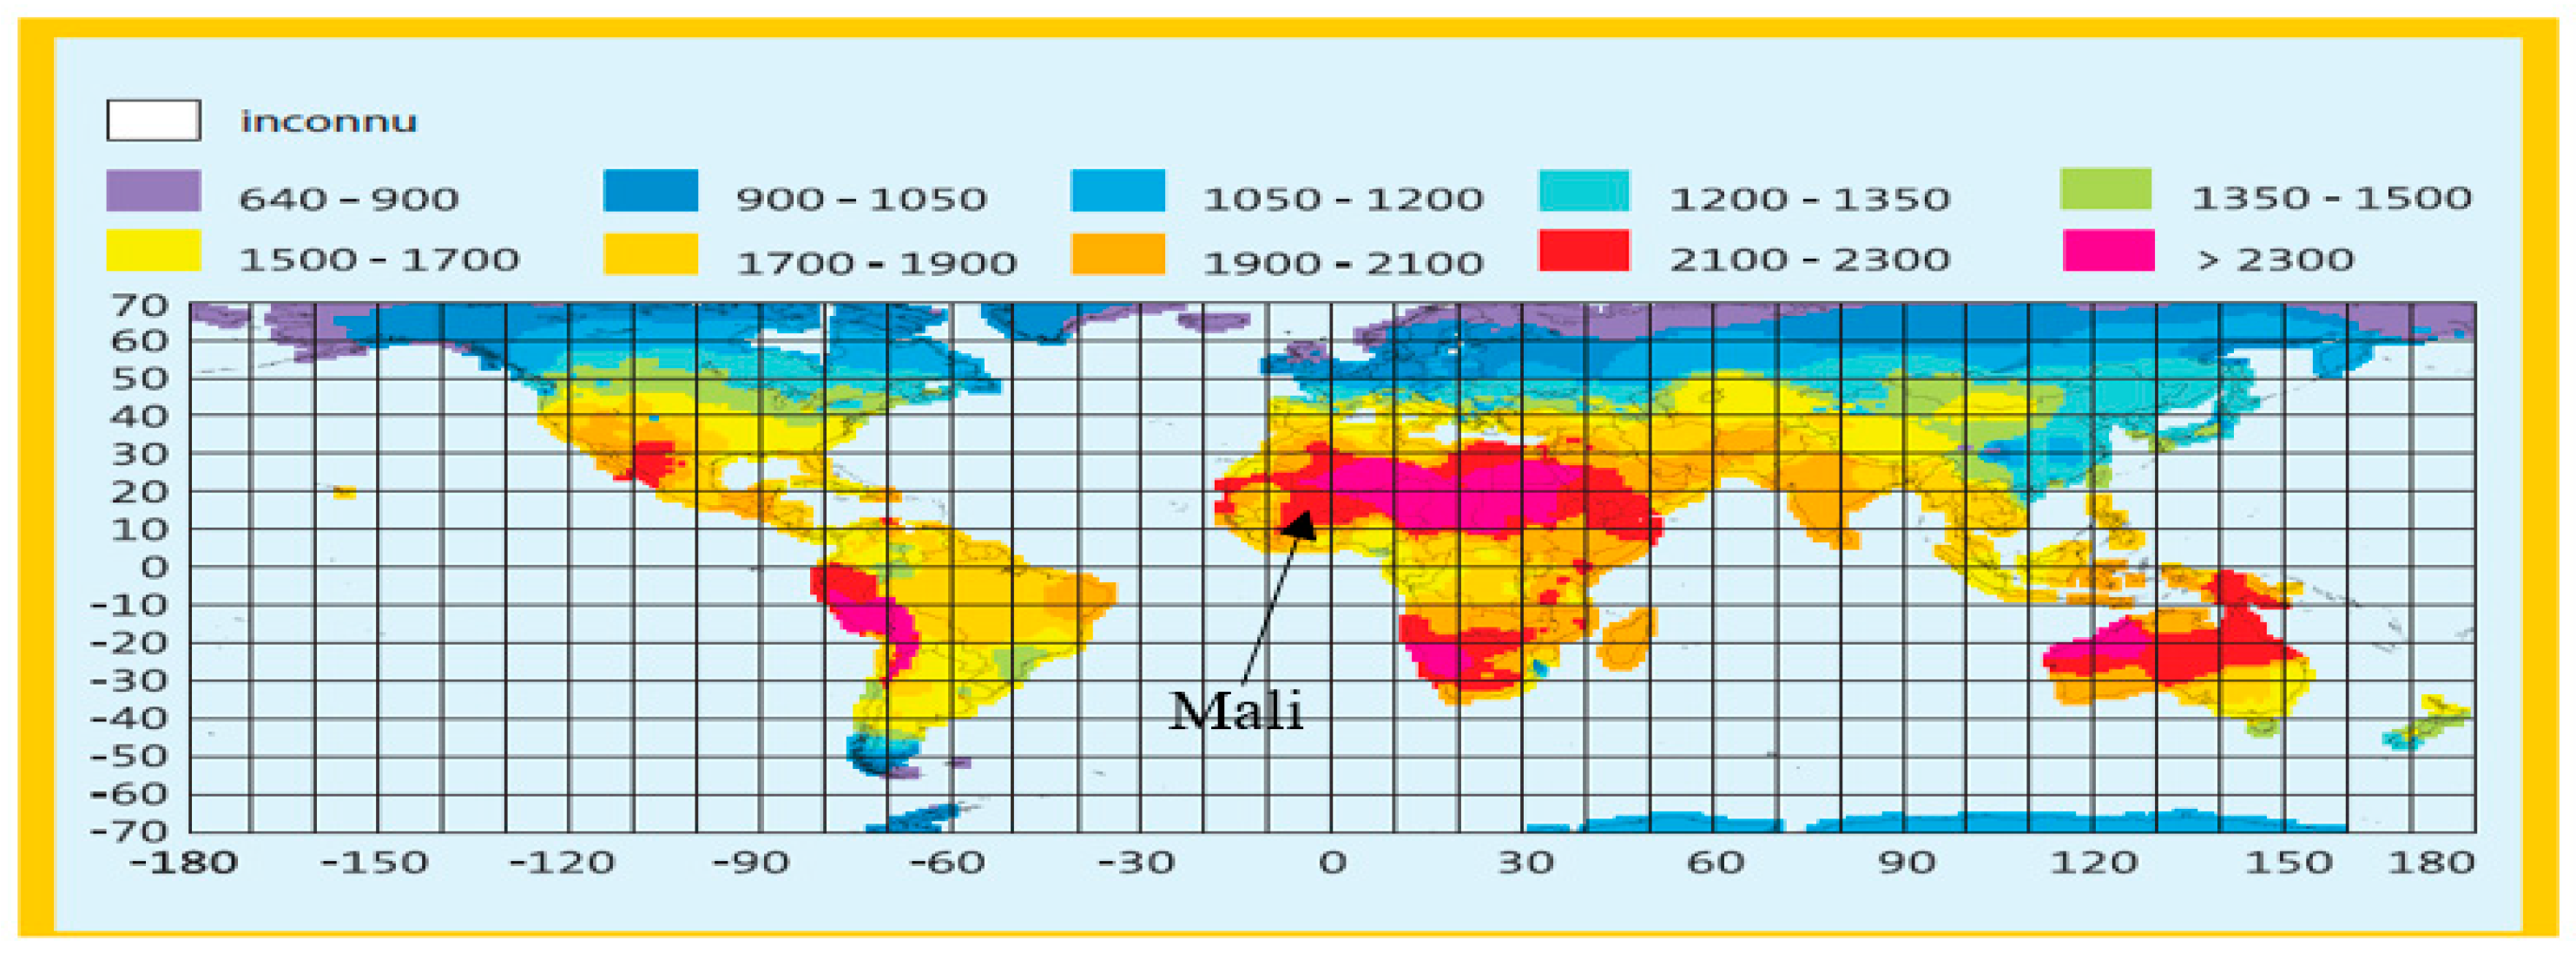
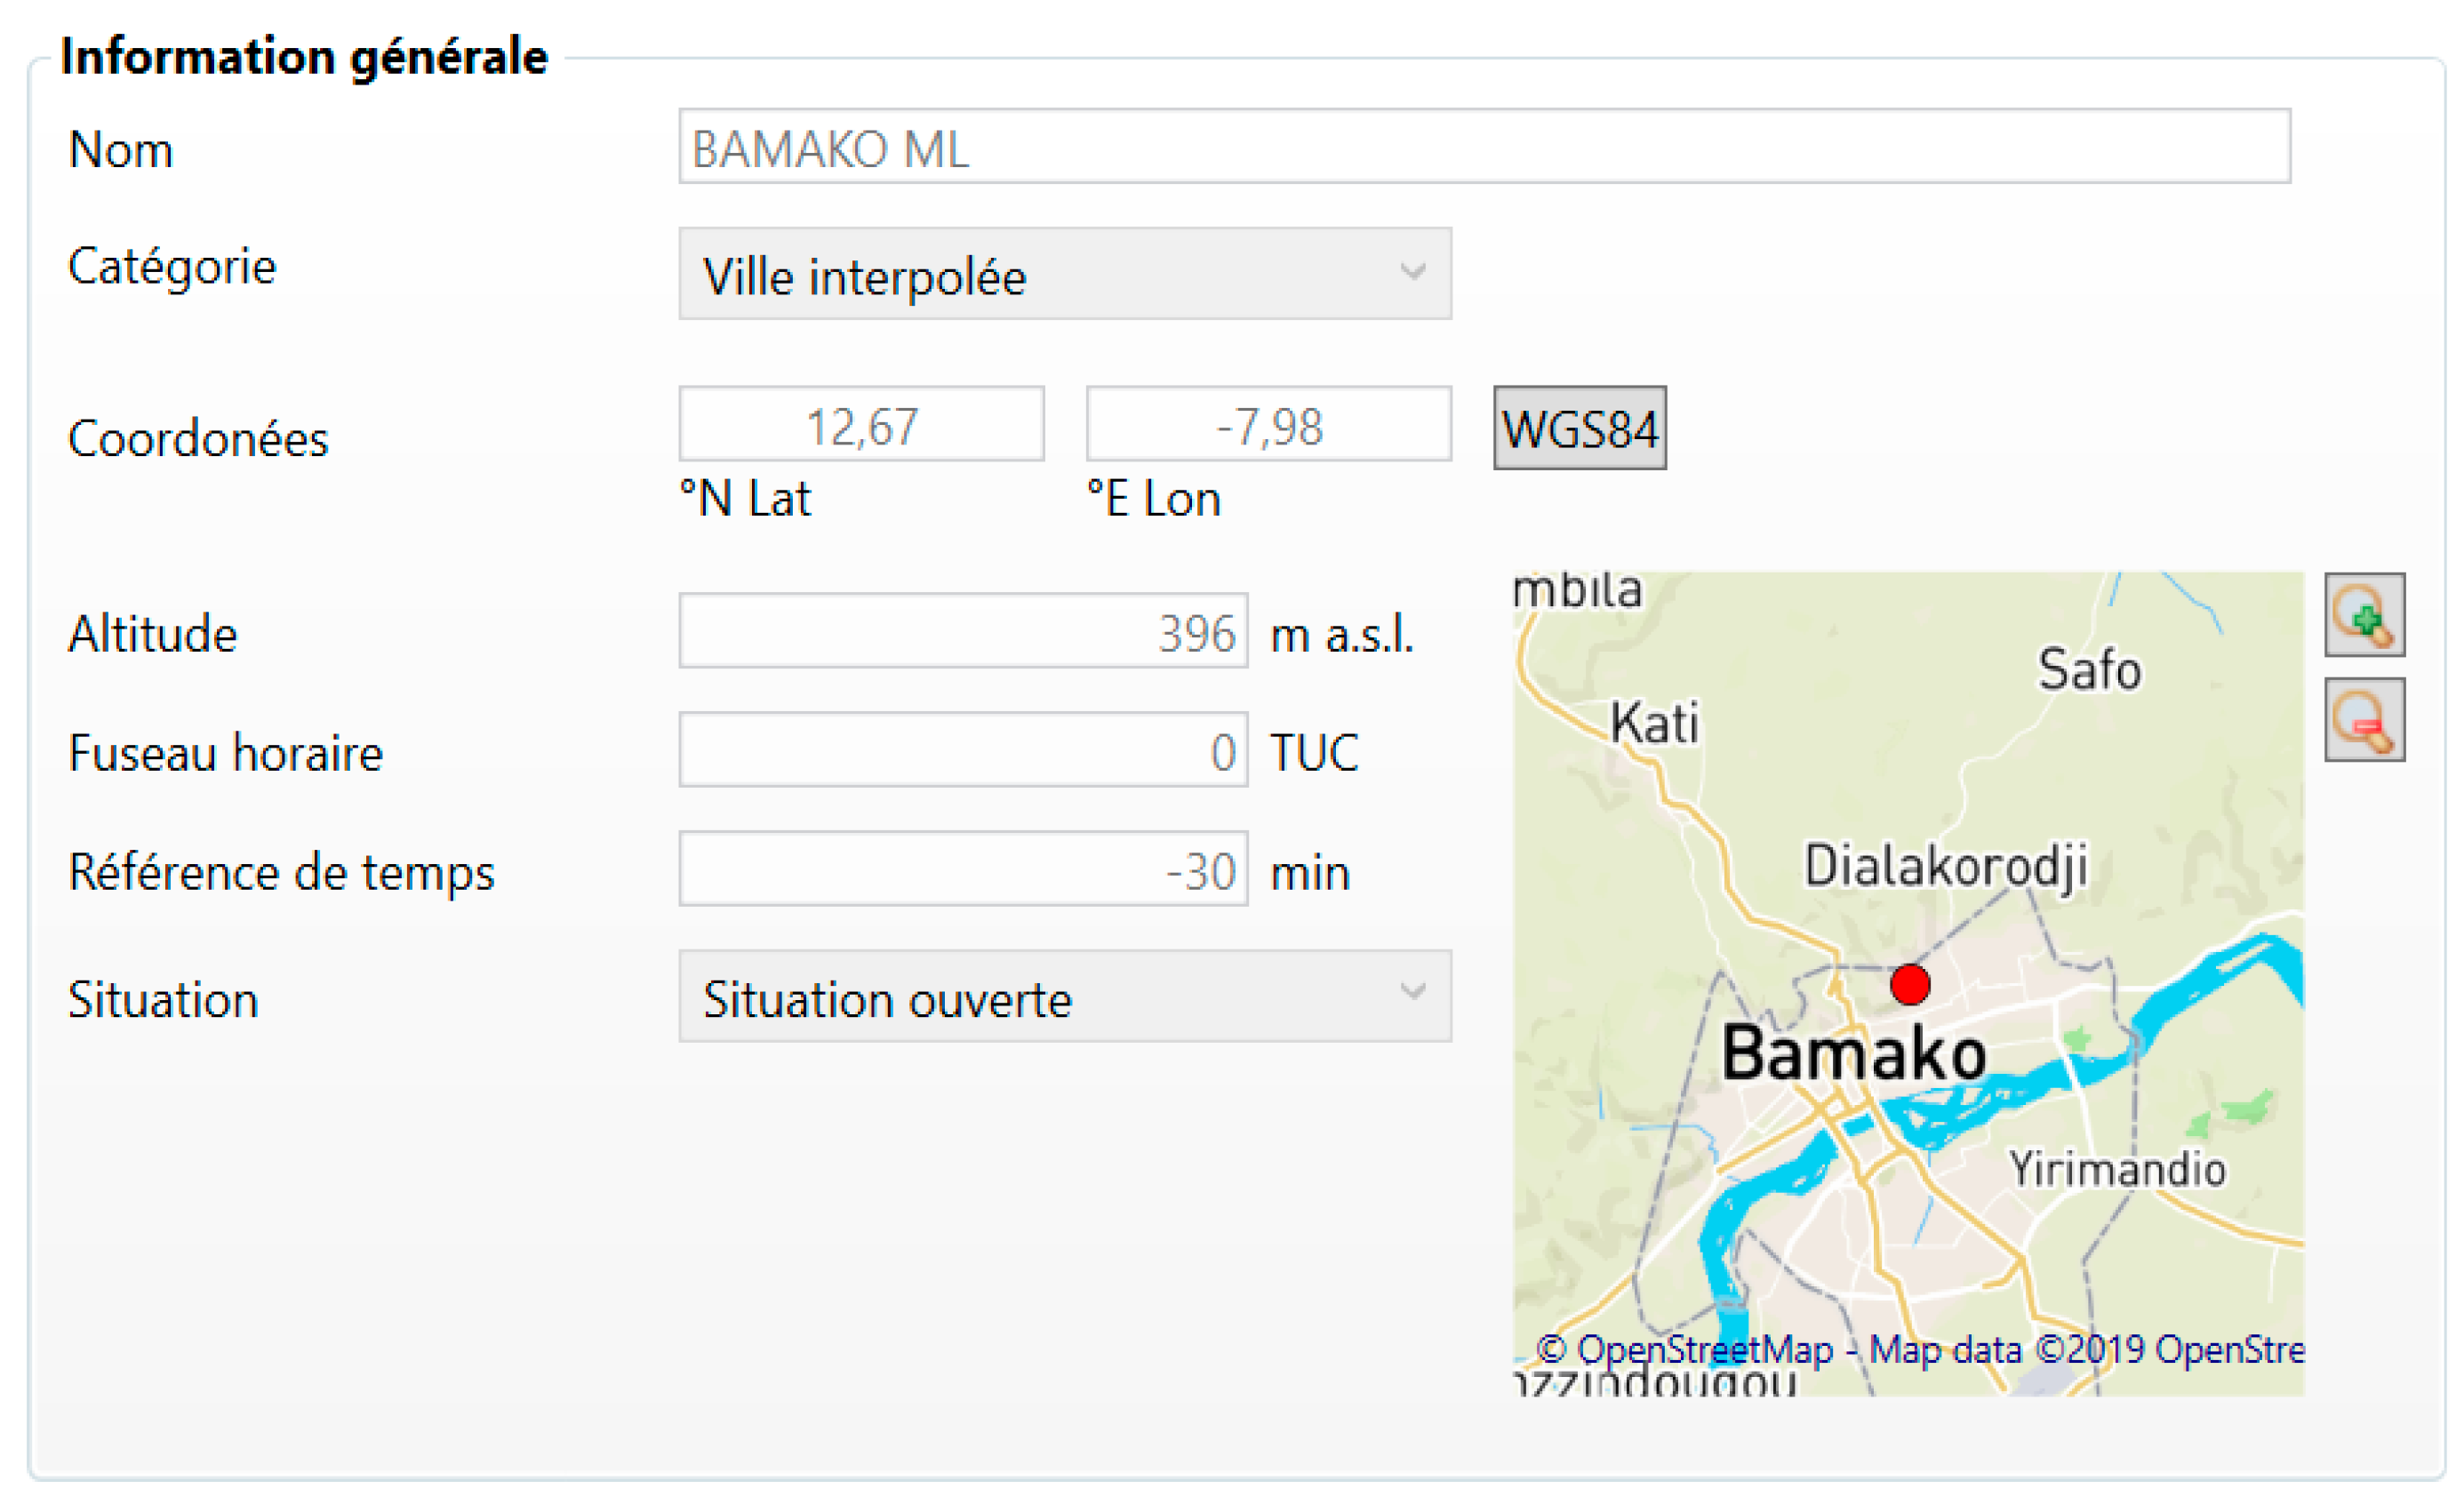
Based on the global distribution map of annual solar radiation, the average yearly amount of PV energy that can be generated is between 640–2400 kWh/m2 depending on the different geographical areas. In Mali, this is between 2100 to 2300 kWh/m2 (see Figure 2) [20]. In view of this, the potential of solar energy available to Mali, and the constant increase in the operating cost of thermal power stations, in 2006, the government of Mali adopted the renewable energy development strategy, whose primary objective is to sustainably increase the contribution of renewable energies in the overall energy balance of the country, from less than 1% in 2002 to 15% in 2020 [
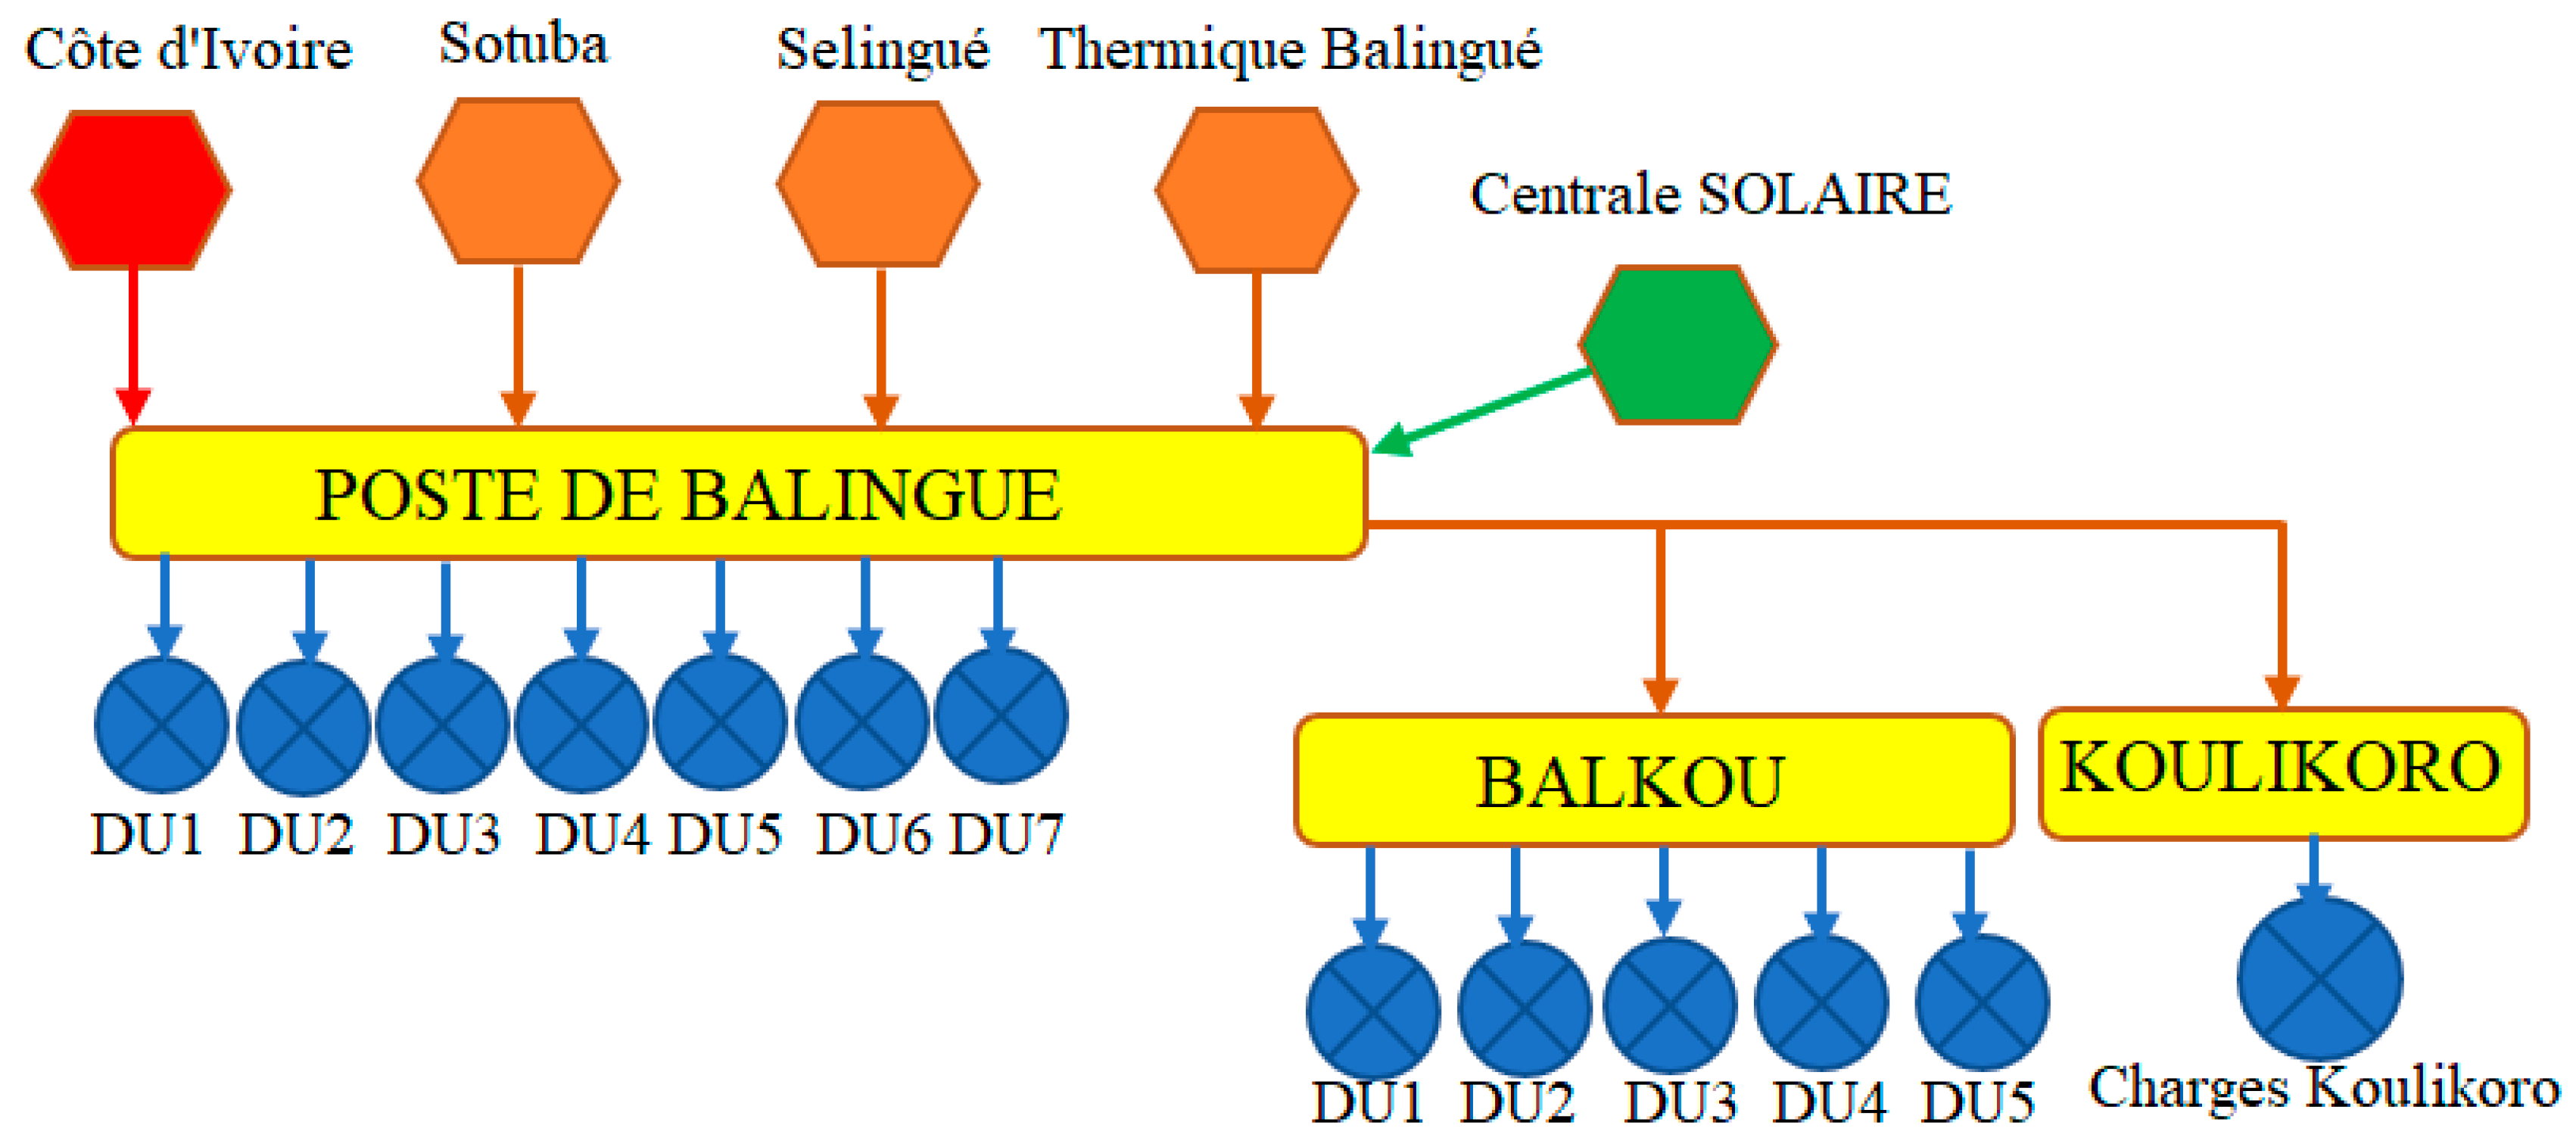
21]. The interconnected grid of EDM-SA (or Mali’s national electricity grid) has various production plants, basically divided between three technologies of the source of electrical energy: Thermal, hydroelectric (including purchases of hydroelectricity, and excluding other renewables), and regional interconnection power grids (Ivory Coast) [21]. In 2013, the total installed capacity of the national grid was 424.26 MW, of which 39.42% was for the clean structures (hydroelectric and thermal unit) of the EDM-SA and 60.58% was for the purchase of energy (hydroelectric and thermal unit) and regional interconnection (Ivory Coast). Facing these difficulties related to the energy production, the objectives fixed by the government of Mali concerning of renewable energies connected at the grid must pass from 6.3 MW in 2010 to 150.7 MW in 2020 and 201.8 MW in 2030 [21].
It is in this context that we will address “hybrid systems optimization: Application to hybrid systems photovoltaic connected to grid”. The objective is to allow better management of these hybrid systems and optimize the production of thermal energy according to the availability of solar productions.
Several works have been brought on PV solar plants installed in the world. A study on the performance analysis of a solar power plant connected to the 171.36 kW grid on the island of Crete in 2002 was done by Kymakis et al. in 2009 [22]. An evaluation of 13 different photovoltaic technologies in two localities (Nicosia, Cyprus and Stuttgart, Germany), all connected to the grid with a rated power of 1 kW was led by Makrides et al. in 2010 [23]. A study by V. Sharma et al. in 2013 focused on evaluating the performance of different rows of PV technologies consisting of polycrystalline silicon, thin film, and amorphous silicon at the Solar Energy Center in India [24]. The performance of a PV power plant connected to the network using the various methods was studied by Hassan et al. in 2014 [25]. Yang et al., in 2015, analyzed the reliability of a single-phase converter with reactive power injection at night by considering mission profiles [26]. A new approach to reliability was proposed by Huai et al. in 2016 [27]. Frede et al., in 2017, discussed the reliability of renewable energy systems [28]. A design study and selection of reliable converters for photovoltaic applications connected to the grid was carried out by Victor et al. in 2018 [29]. Sangwongwanich et al., in 2018, conducted an approach of the power control flexibility of solar systems [30]. A study on an autonomous photovoltaic system in an urban area of Mexico was led by Alberto et al. in 2018 [31]. Research on the reconfiguration of a multi-state converter was carried out by Chen et al. in 2018 [32].
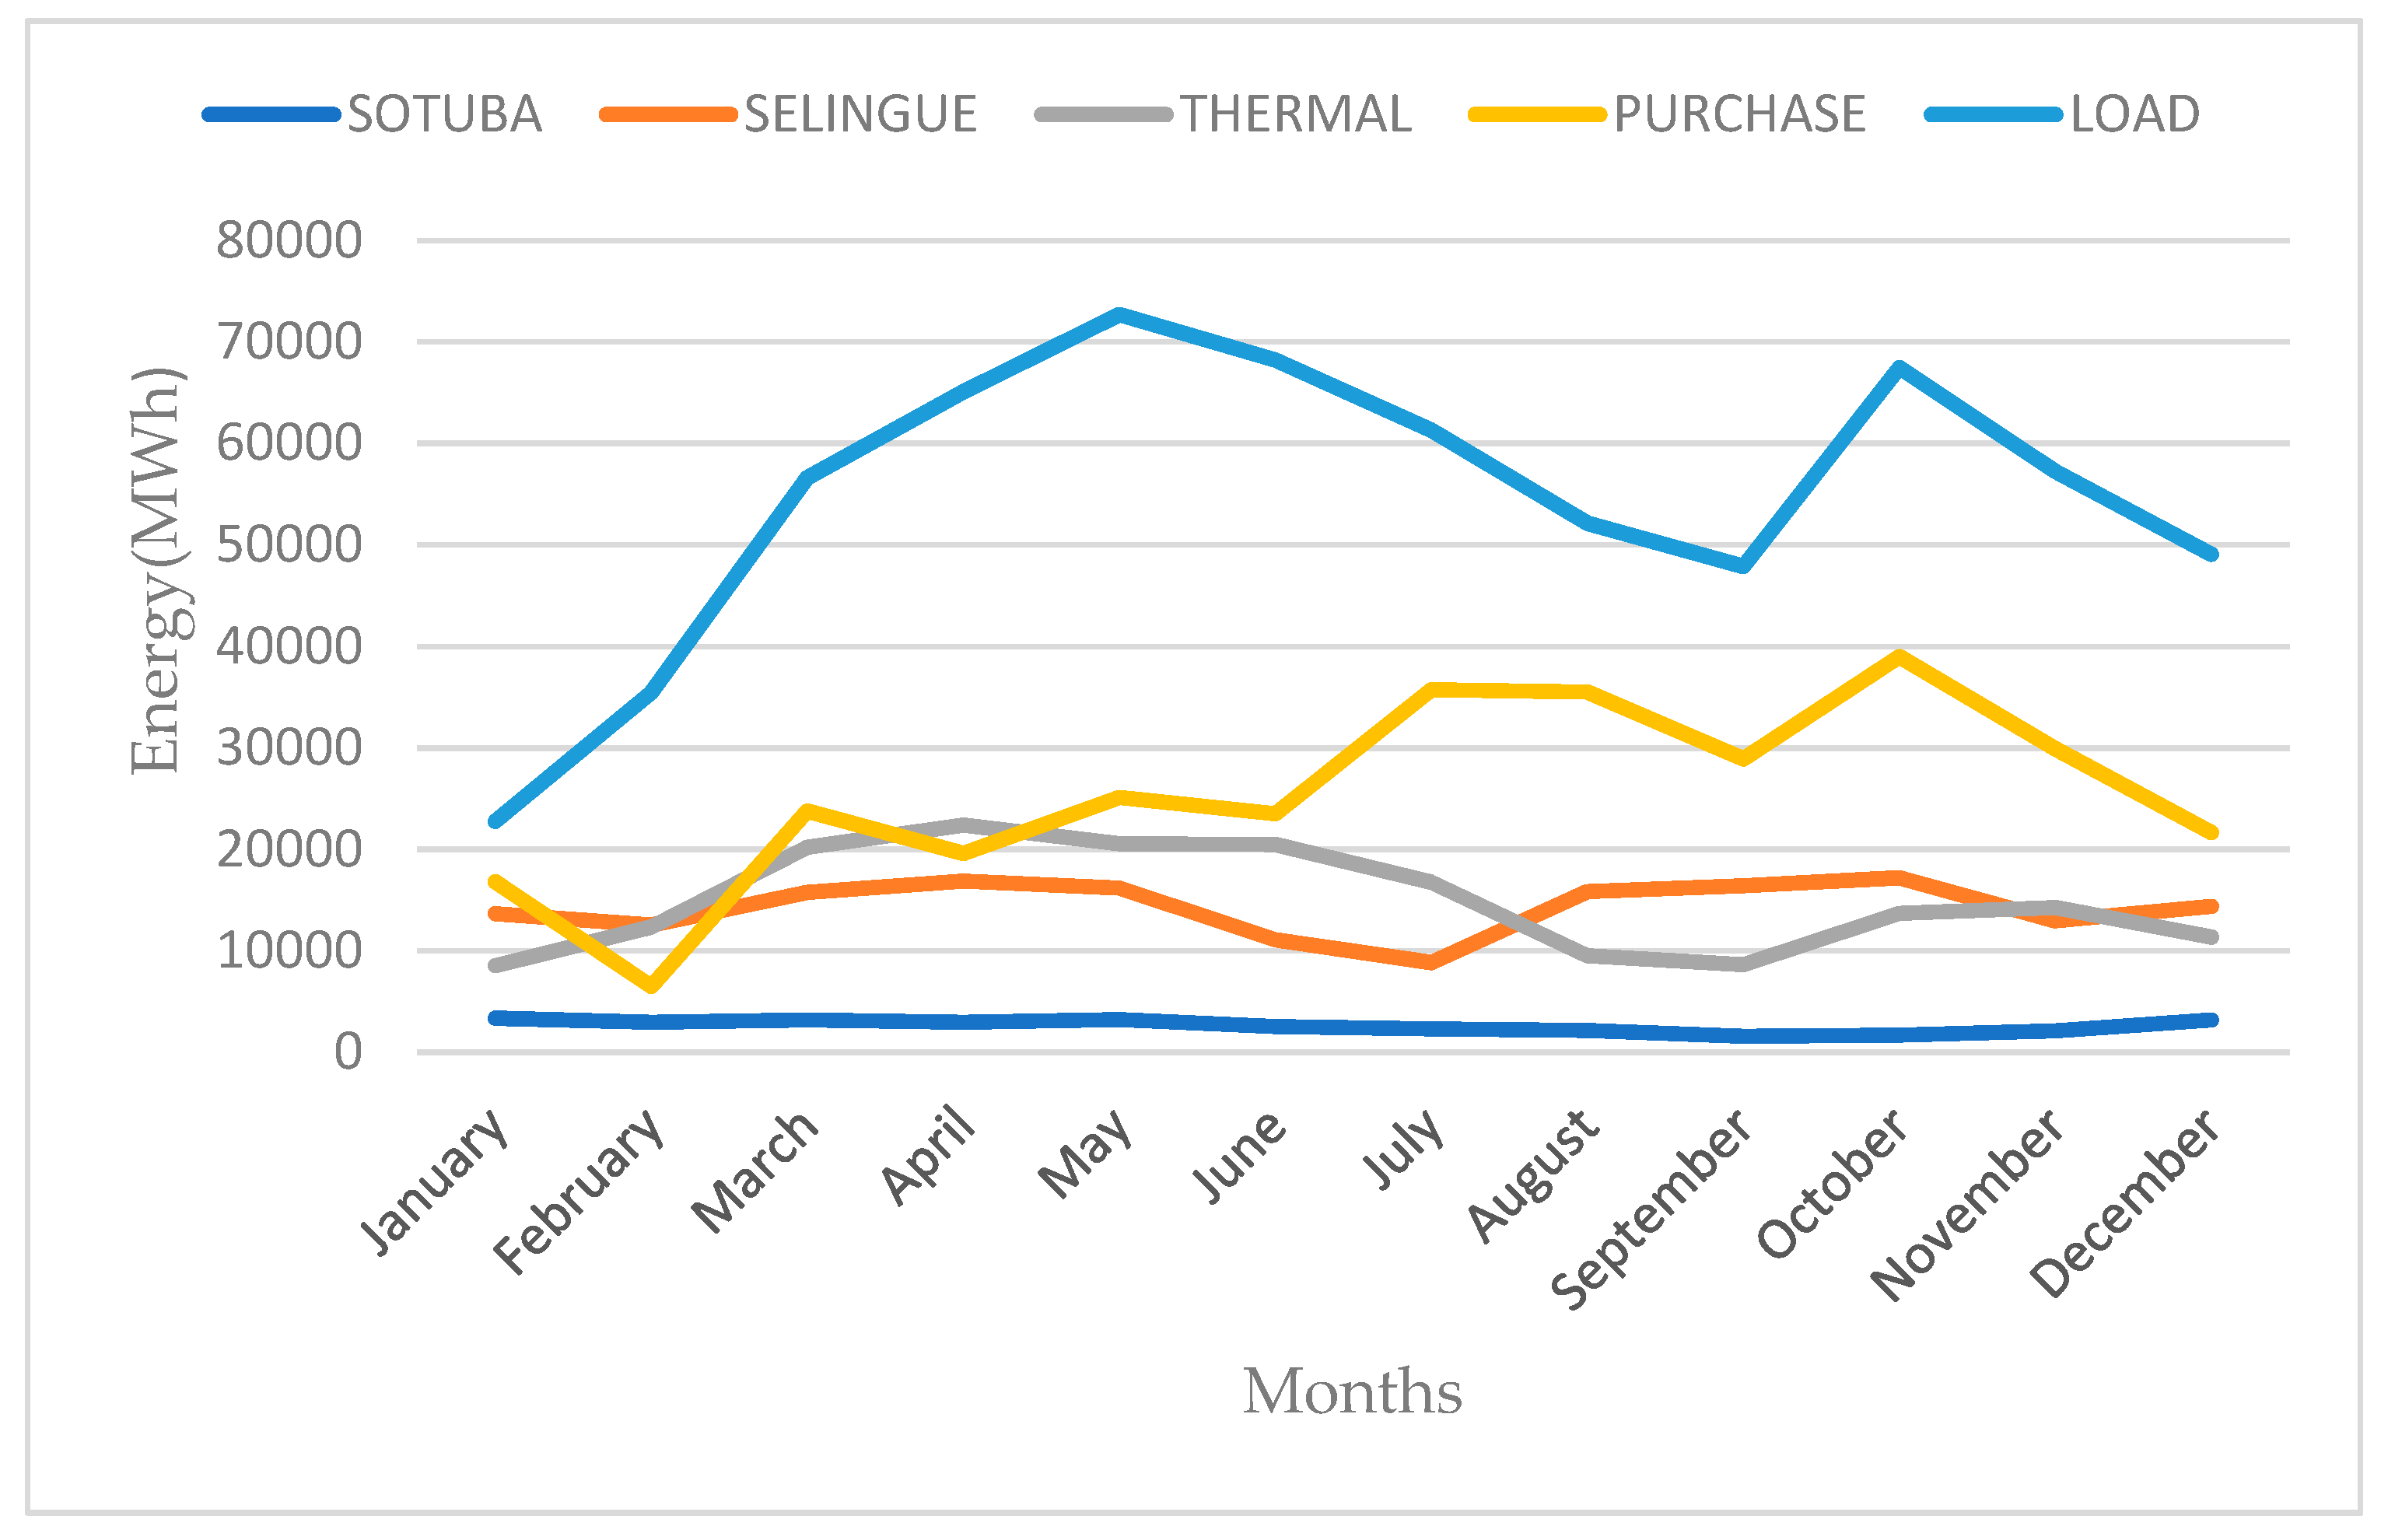
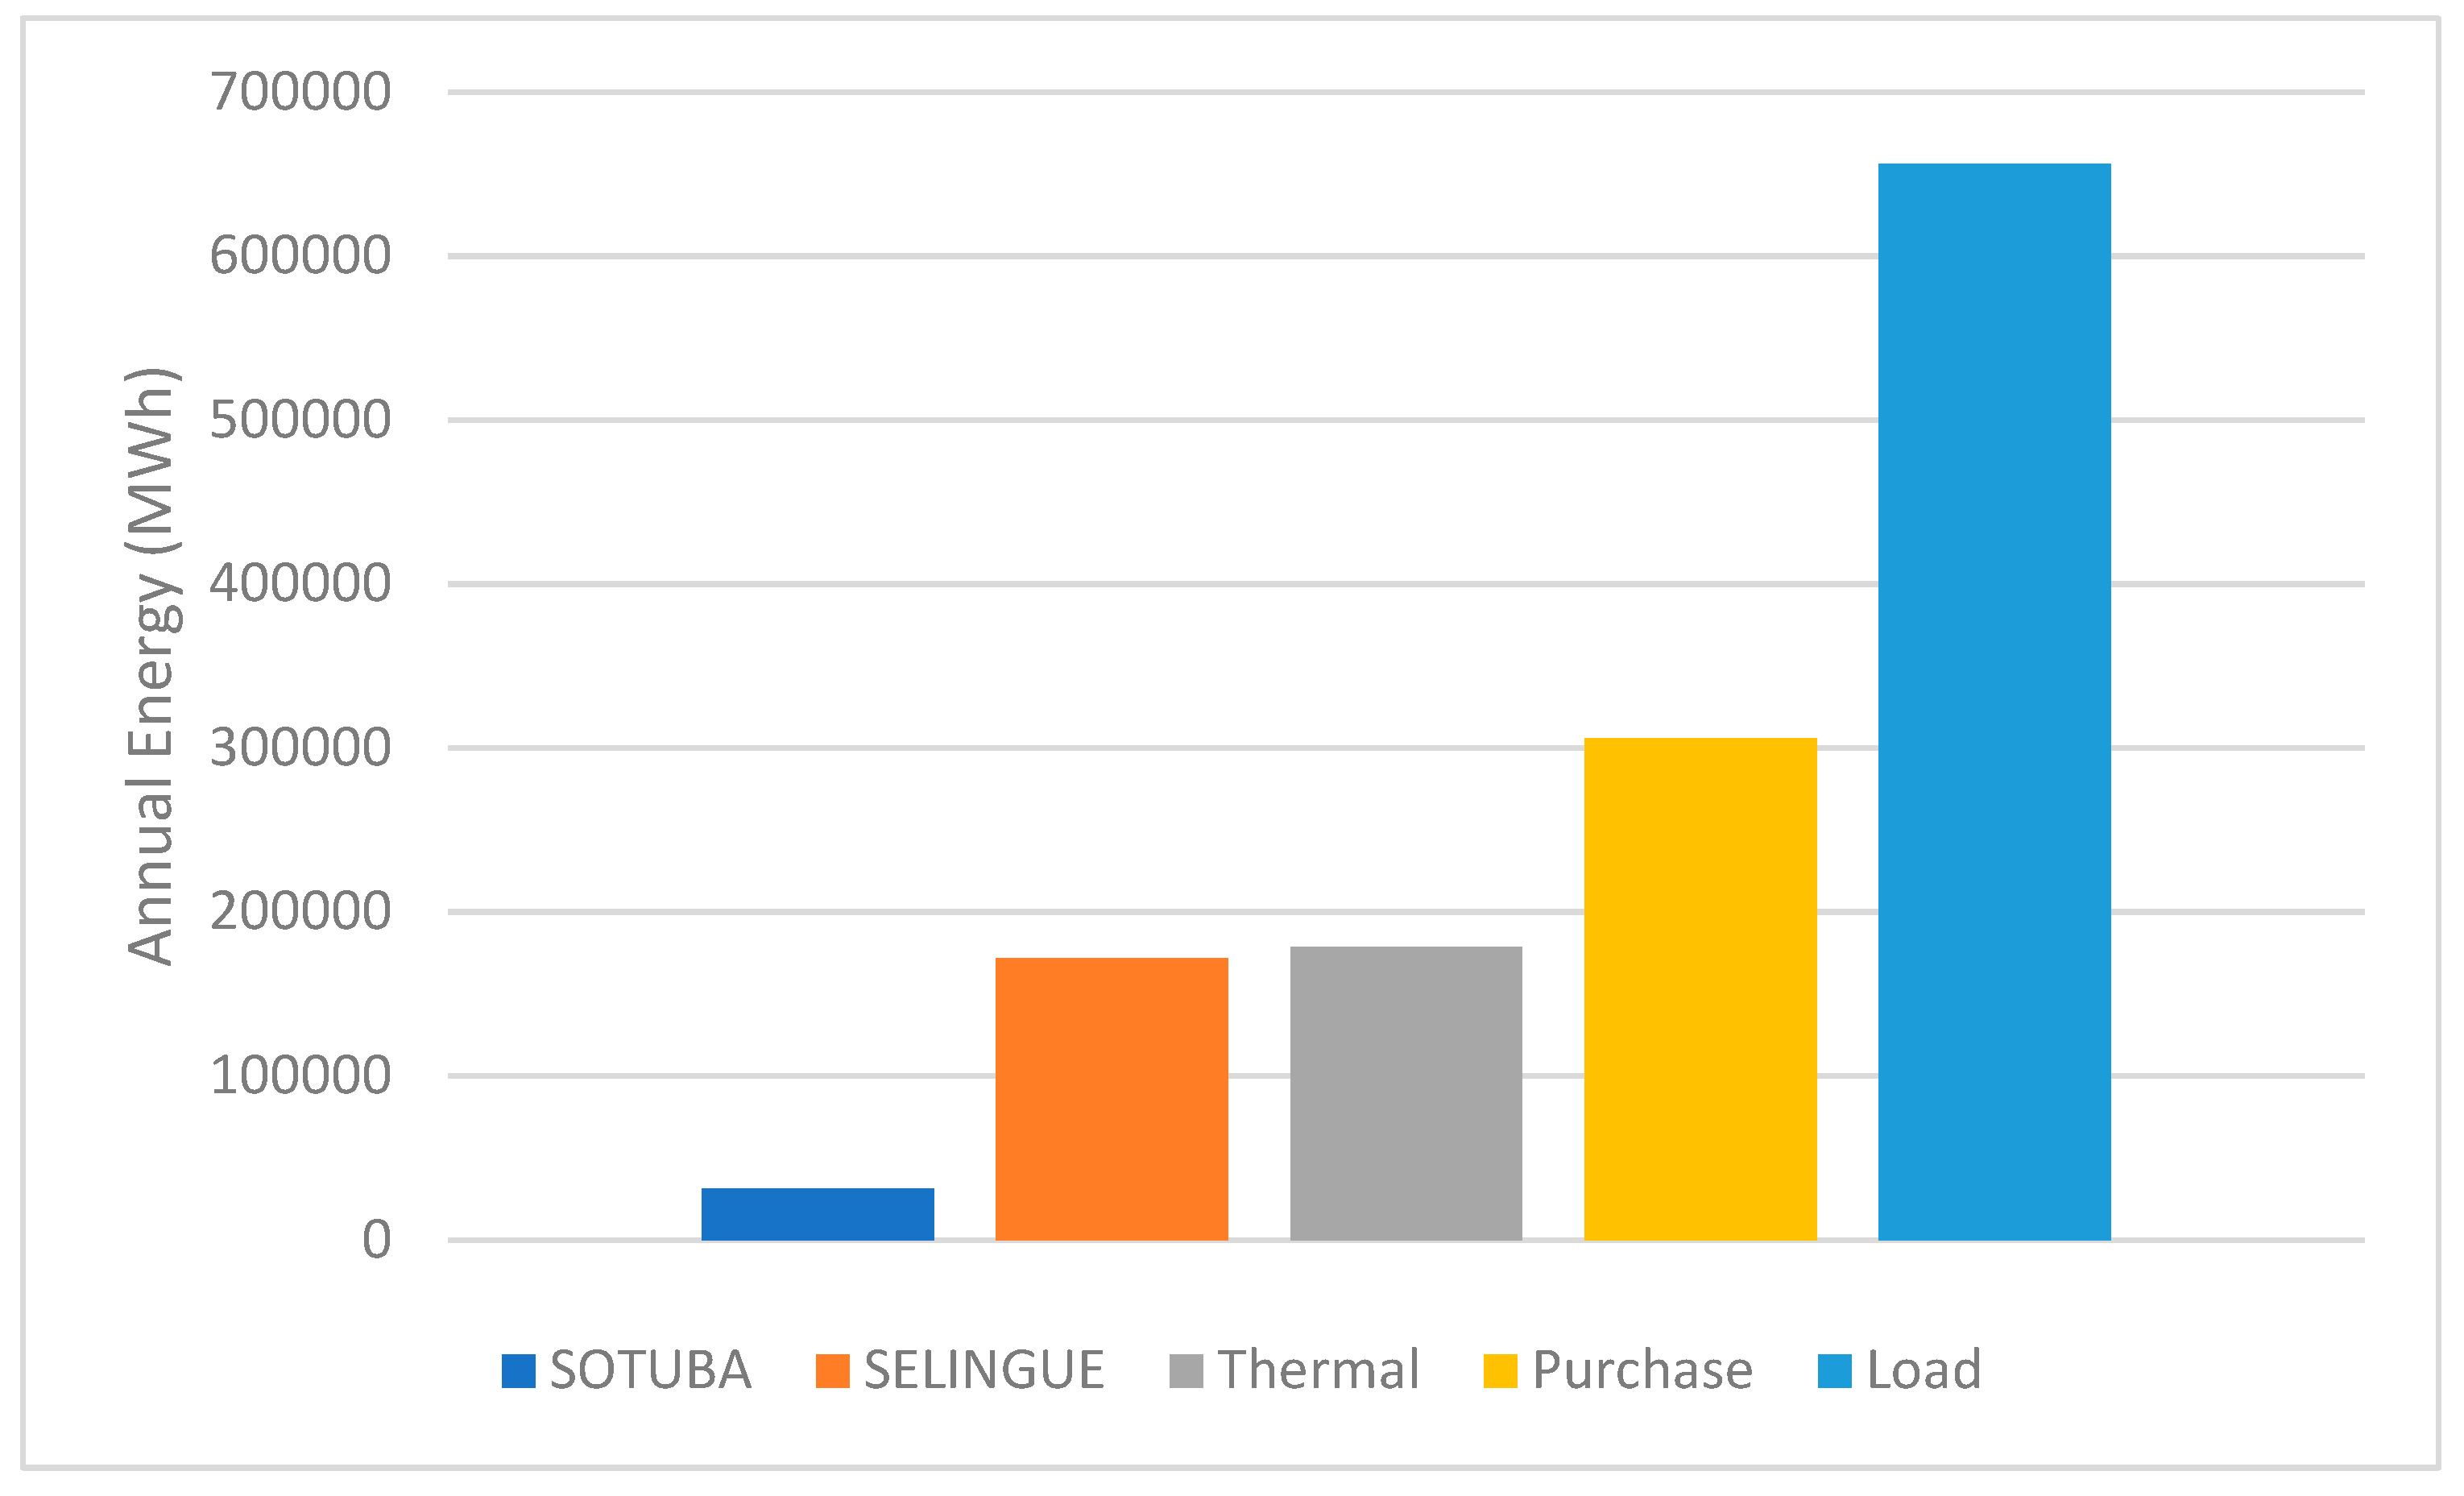
Most of the studies on hybrid systems photovoltaic connected to the grid have been based on solar power plant performance evaluation, reliability converter, and maximization of installed PV power output. However, renewable sources are intermittent sources, and managing its productions according to their availability remains a significant challenge.
This work will be focused on the optimization of thermal energy production, which is an undesirable source according to the availability of solar power generation, and on the other hand, allowing Mali’s electricity supplier (EDM-SA Energy of Mali) to have a reliable estimate of purchases from interconnection with a neighboring country (Ivory Coast).

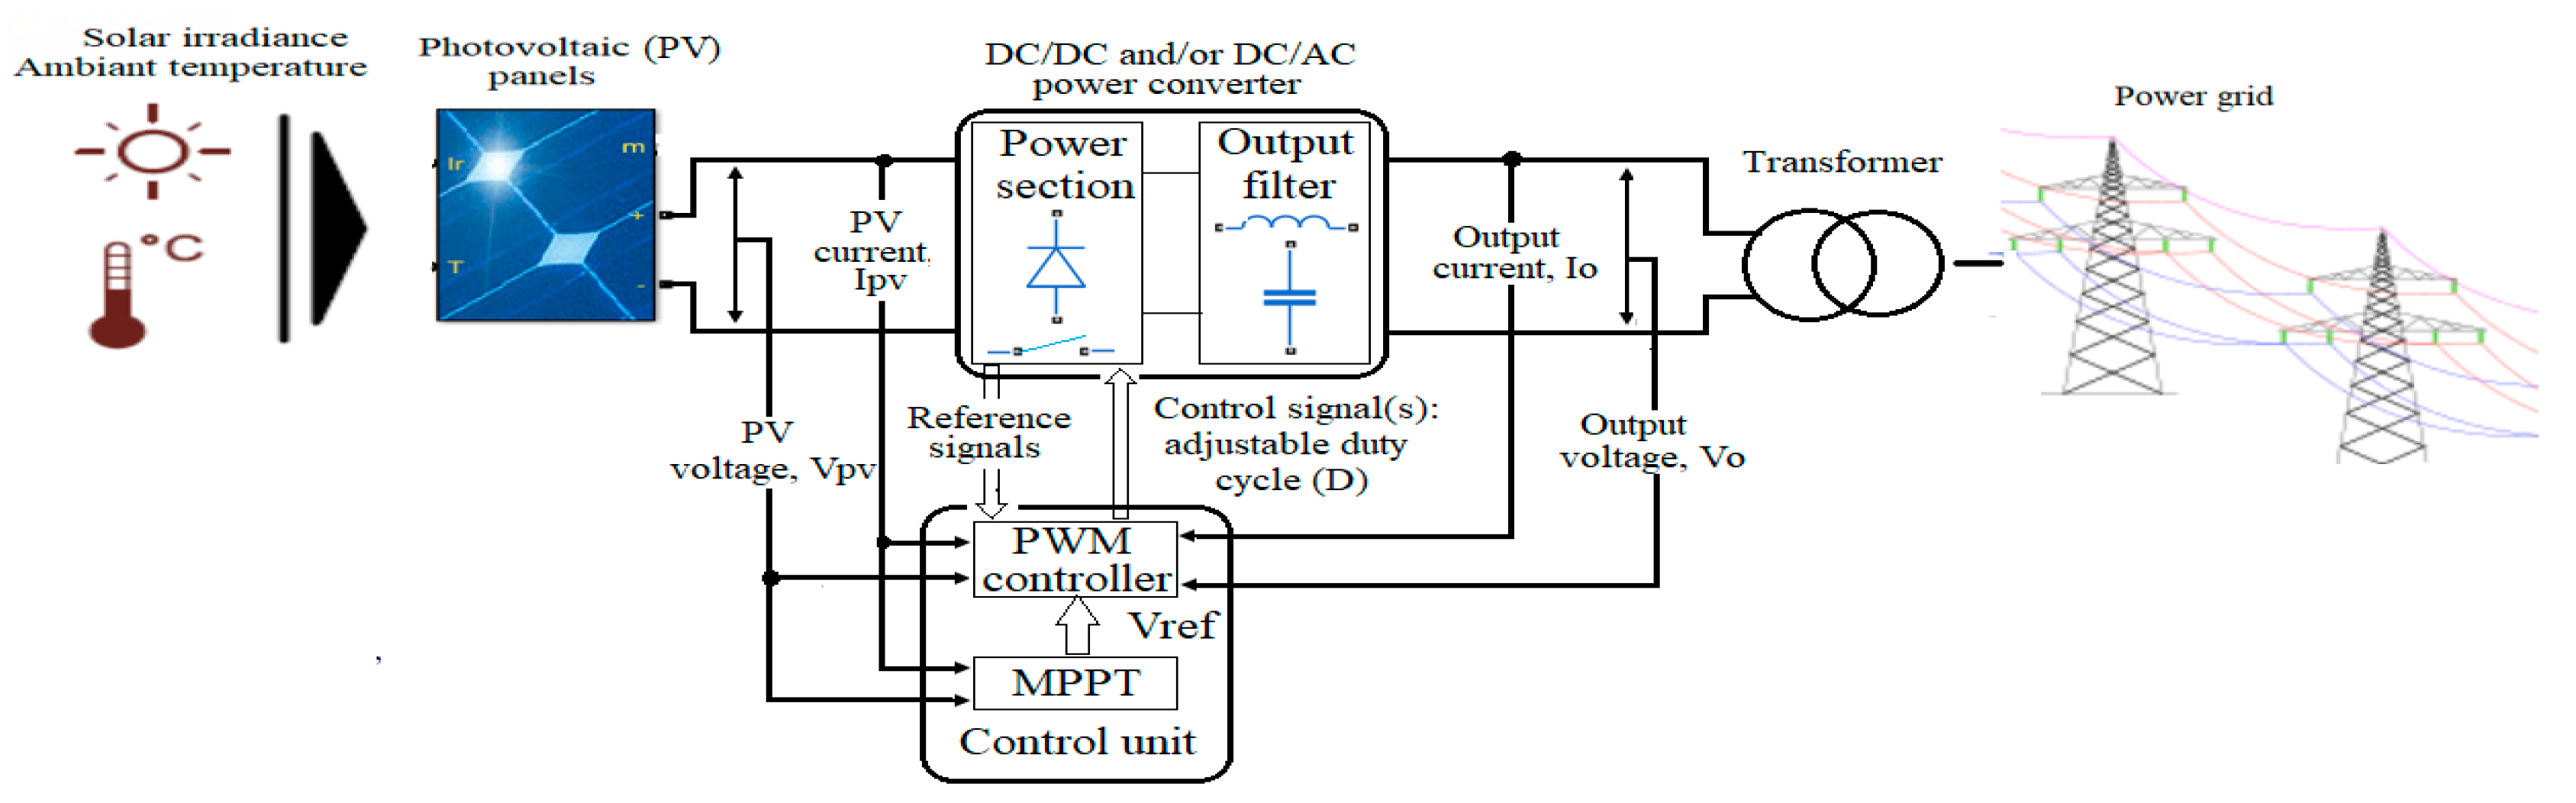
1.2. Characteristics of PV System

Among the many environmental factors that affect the operating characteristics of a photovoltaic cell and its energy production, the solar irradiation G measured in W/m2 and the temperature T measured in degrees Celsius (°C) are the two main factors [33].
The source of photocurrent Iph is expressed as follows in the following equation [34]; it depends on both irradiance and temperature.
I p h ( G , T ) = [ I s c n + K i ( T T n ) ] G G n
where I s c n is the rated short-circuit current, K i is the current temperature coefficient, G n is the rated solar radiation, which is distinctively 1000 W/m2, and T n is the rated cell temperature, which is distinctively 25 °C.
The values of G n and T n can be determined from the datasheet of cells or commercial PV panels.
Also, the current I d and the voltage V d of the diode are expressed by an exponential relationship and are represented by Equations (2) and (3) [34].
I d ( T , V d ) = I s ( T ) [ exp ( V P V + I P V · R s a V t ( T ) ) 1 ]
where I s is the saturation diode current, a is the ideality constant of the diode, V d is the voltage of the diode, and V t is the thermal voltage of the semiconductor junction.
The saturation current of the diode depends on the temperature and can be defined as:
I s ( T ) = I s c n + K i ( T T n ) exp ( V o c n + K v ( T T n ) a V t ( T ) ) 1
where V o c n is the open-circuit nominal voltage, and K v is the temperature coefficient of the voltage.
The diode voltage V d is the same as the PV voltage V P V of an ideal model. The thermal voltage V t depends on temperature T and is established in Equation (4) [34].
V t ( T ) = k T q N s
where k is the Boltzmann constant ( 1.3807 × 10 23 J · K 1 ), q is the electronic charge (1.60217662 × 10⁻¹⁹ C), and N s is the number of PV cells in series.
The intensity of the current at the output of the PV, I P V , and its power P P V , are given respectively by Equations (5) and (6) [35]:
I P V = I p h ( G , T ) I d ( T , V P V ) V P V + I P V · R s R p
P P V = V P V · I P V
R s , R p are respectively the series and parallel resistors of the PV source. Where the current I p h is defined in Equation (1) and the current of the diode I d in Equation (2).
From the equation of the current I P V given in Equation (5), it can be concluded that the output current of the PV depends on the solar irradiation G and temperature ambient T .
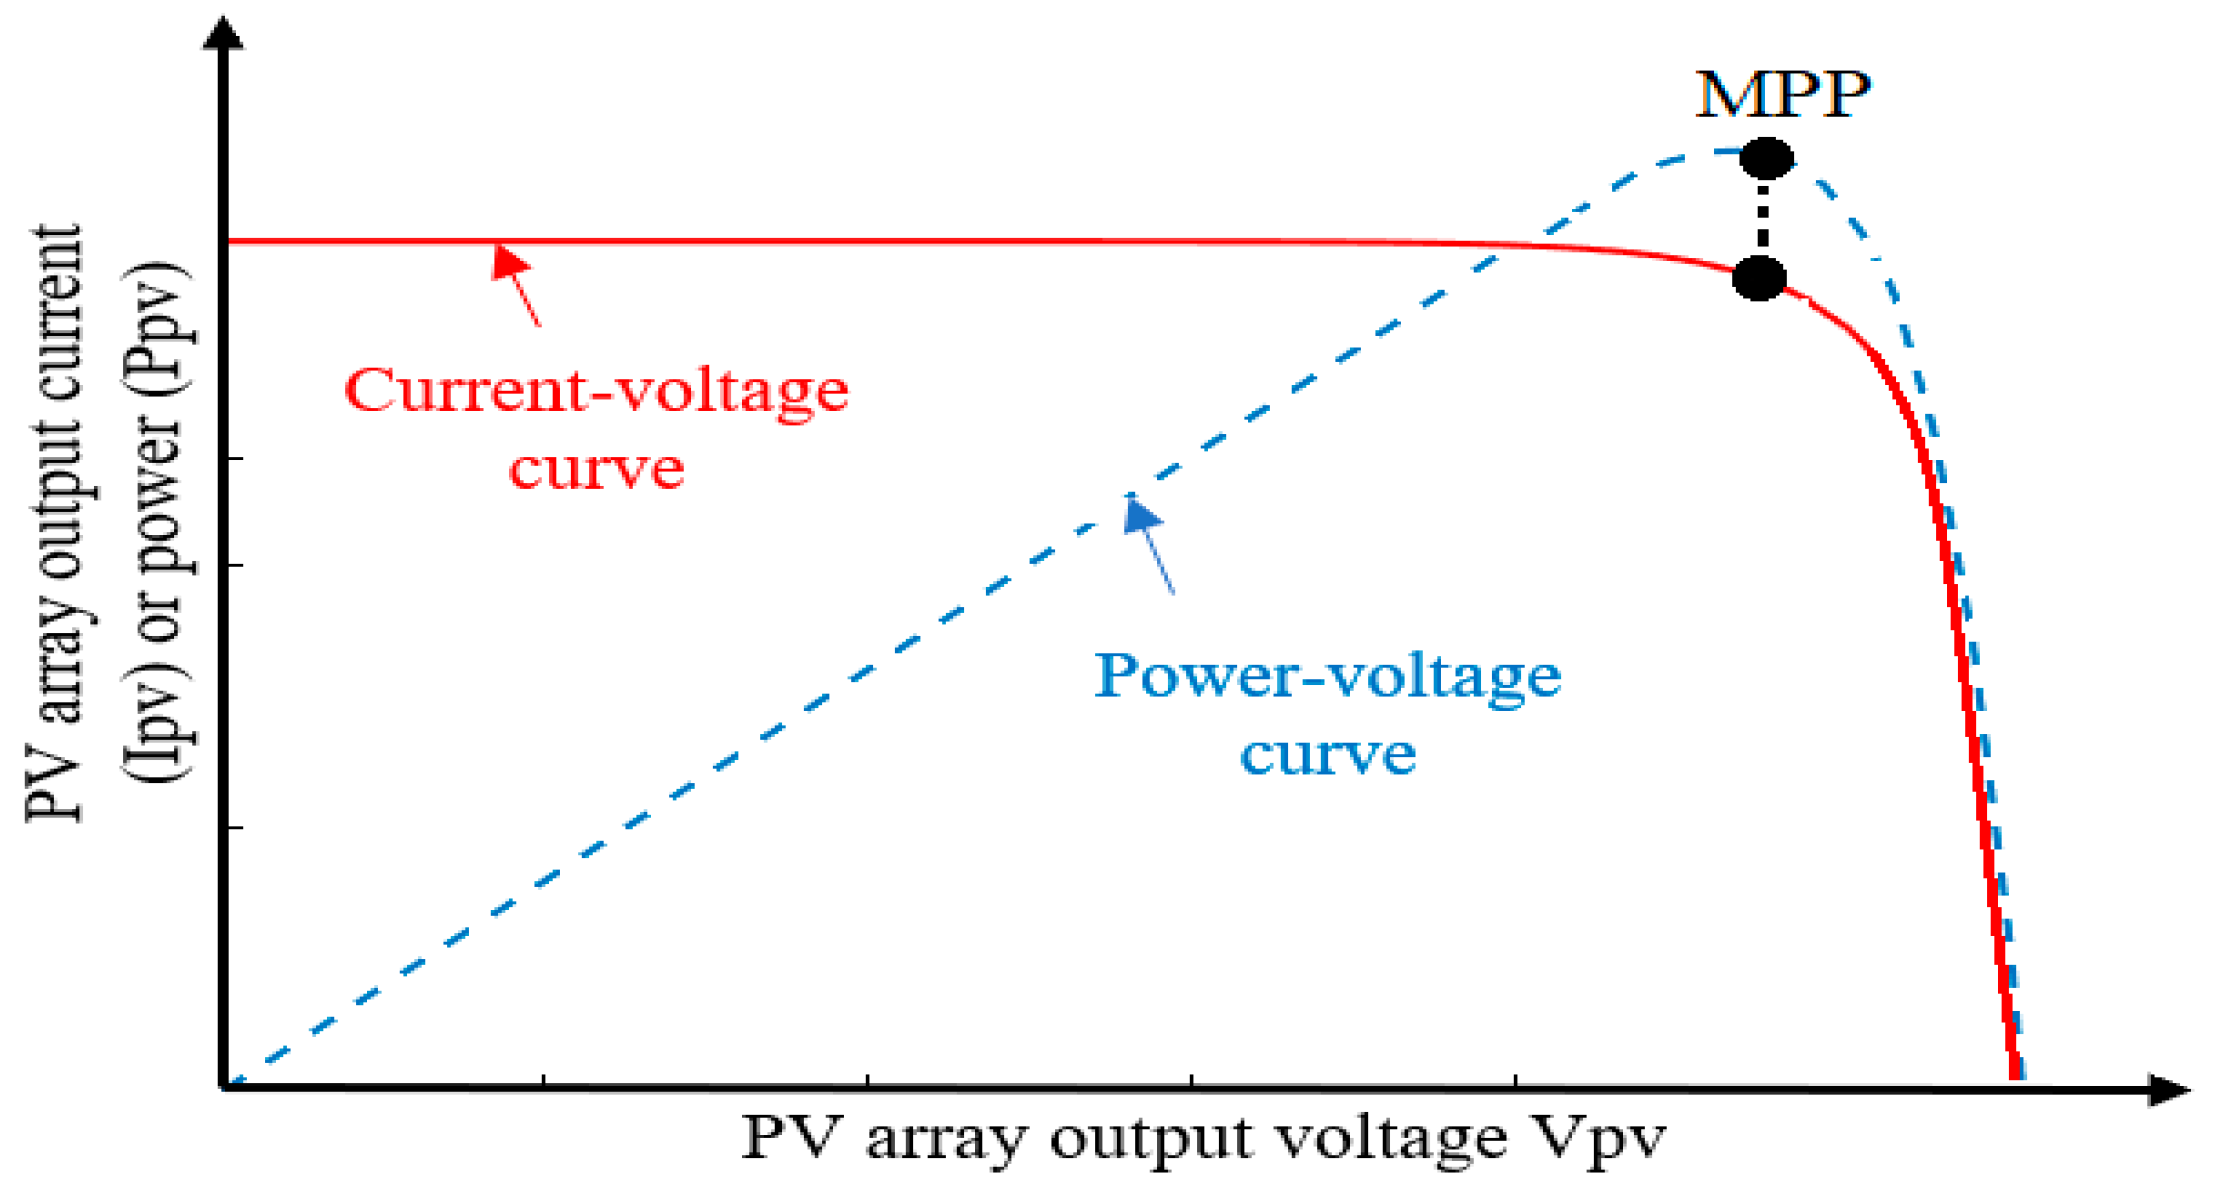
According to the variation of the solar irradiation and the temperature, Equation (5) can be used to determine the current and power characteristic curve of a PV for a given voltage Figure 3 [34].
Several factors affect the efficiency of a PV cell. Among these factors, the two significant factors are solar irradiation and temperature. The efficiency indicated on the datasheets of the modules is the efficiency in the standard conditions (solar irradiation G = 1000 W/m2 and temperature T = 25 °C AM = 1.5).
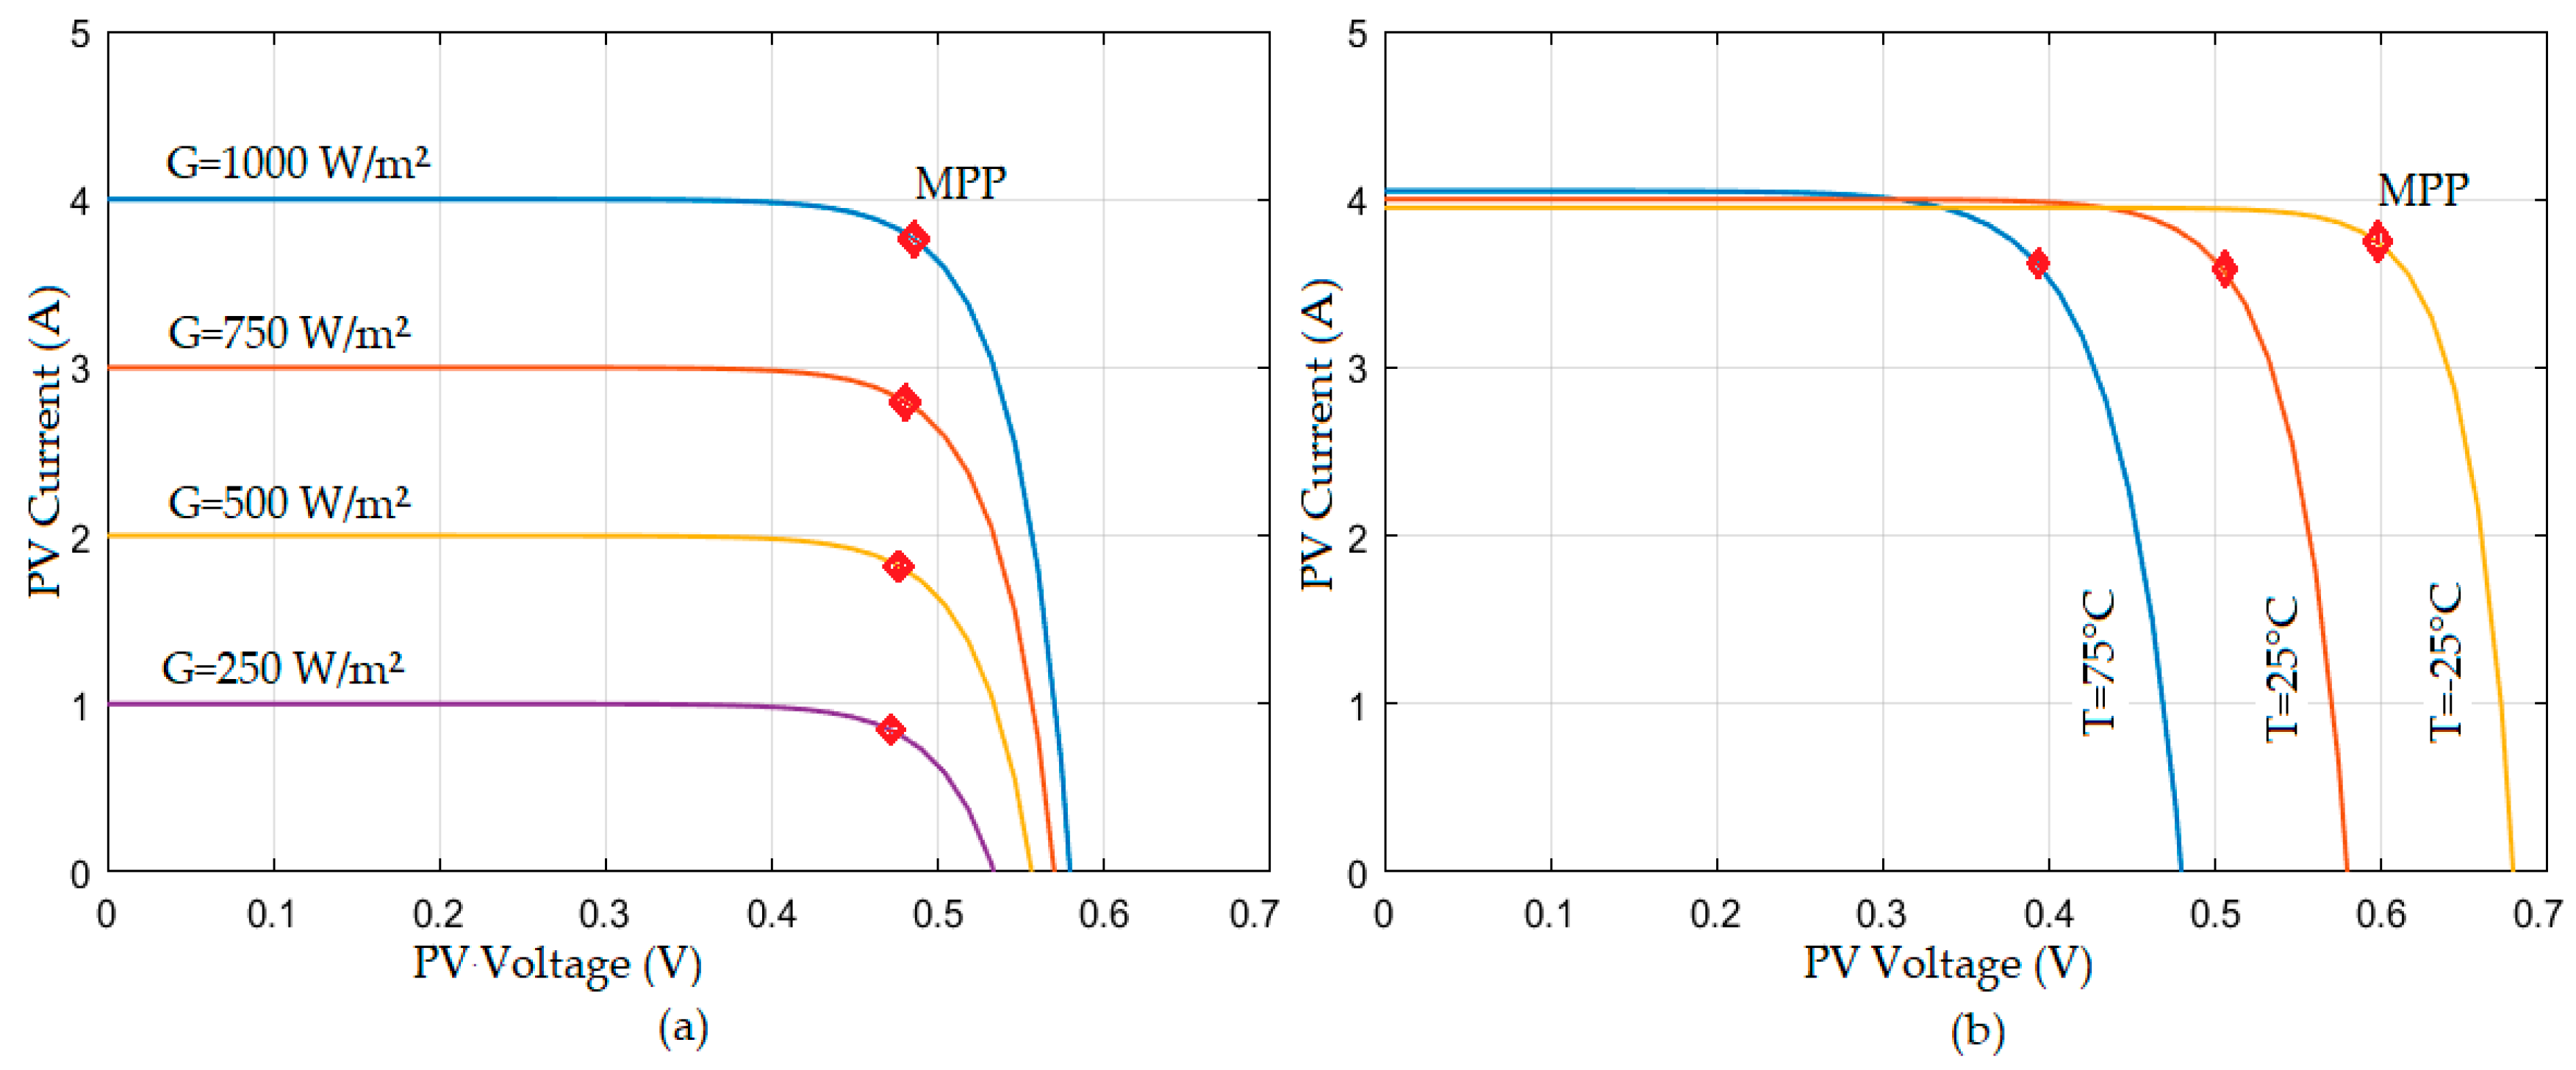
The voltage/current characteristics of a photovoltaic generator under different conditions of variation of solar irradiation and ambient temperature are illustrated in Figure 4 and Figure 5 [34].
When irradiation and temperature vary, the I-V curve will also change, as shown in Figure 4. Solar irradiation is directly proportional to current characteristics; if it increases, the short circuit current and the maximum power point (MPP) current also increase. Conversely, the temperature is inversely proportional to the characteristics of the voltage. When the temperature increases, the voltage open circuit (VOC) and the MPP voltage decrease. Therefore, a cell will produce the most power when the intensity of sunlight is high, but when the temperature is low (Figure 3). However, these types of environmental conditions are not common because the higher-intensity light striking an object tends to increase its heat at the same time.
Variety studies have confirmed these hypotheses. Zsiborács et al. [36] and Chandrasekar et al. [37] have shown that in crystalline solar modules, a 1 °C temperature increase will generally result in a 0.5% reduction efficiency. According to Skoplaki [18], the efficiency the crystalline modules can have a loss of 0.3% to 0.5% when the temperature increases by 1 °C. Krauter [19] establishes that the energy–temperature relationship varies between 0.4% and 0.5%/°C for the same technology. In the case of unglazed glazing of a photovoltaic, the decrease in electrical efficiency is linear and equal to 0.015 when the temperature was between 25 °C and 34 °C and the solar radiation increased from 100 to 1000 W/m2 [38]. According, Zsiborács et al. [39], with silicon photovoltaic cells, a decrease of 1 °C in temperature will result in an average increase of 0.27% in efficiency of energy production.
The rest of the paper is structured follows: In Section 2, materials and methods are discussed; in this section, an overview of the solar resources in Mali and how coupled a photovoltaic system to an electricity grid is discussed in Section 2.1 and Section 2.2; an application case is processed in Section 2.3. The results and discussions on the best optimization strategy are presented in Section 3, and a conclusion in Section 4.

2. Materials and Methods

2.1. Solar Resources in Mali

Before addressing the solar energy field in Mali, we recall some scientific concepts related to solar energy.
  • Global horizontal irradiance (GHI): Total amount of direct and diffuse radiation received on a horizontal surface expressed in Wh/m2.
  • Diffuse horizontal irradiance (DHI): Total solar radiation received in one hour on a surface directly exposed to solar radiation, in Wh/m2.
  • Global irradiation (G): Total solar radiation received in one hour from the sky, after deduction of direct radiation, expressed in Wh/m2.
Solar data in Mali are available through many sources. Here, we used the data climate variation conditions of Bamako (Figure 6), obtained on the Meteonorm© site.
In the graphs above, representing the solar radiation, the temperature, and the duration of insolation on the site of Bamako, we considered the average monthly data from Meteonorm©.

2.2. PV Systems Connected to a Grid

Satisfying energy needs, peri-urban, rural, and even urban areas have proved difficult in different conditions such as:
  • The electricity grid does not cover all the energy needs permanently (permanent load shedding).
  • The cost of electricity is high.
  • The reduction of the pollution rate due to the misuse of thermal energies, which becomes a daily threat (preservation of the environment).
  • Independence in electricity.
In Mali, we found a very high solar potential of 6   KWh / m 2 / day (February to May, see Figure 7) with a daily average sunshine duration between 7 to 9 h of sunshine (Figure 8) and an annual average solar energy, indicated on the map above, of 2190 KWh / m 2 / year [20].
Thus, hybridization of the existing sources of energy with photovoltaic sources in Mali may be a possible solution to meet the requirements mentioned above. The production of photovoltaic power (PV) connected to the electricity grid has increased considerably in recent times due to climate change conditions and the high demand for energy consumption.
A basic structure of a photovoltaic production system connected to the electricity grid is presented in Figure 9 [34]. It includes photovoltaic modules, a power converter, a control unit, and the grid.
The PV source is connected to a DC/DC and/or DC/AC power converter, which connects the PV generated power to the grid or operates in an autonomous mode (for example, a group of batteries) [40,41].
Photovoltaic systems connected to the grid multiply and can play a significant role in power generation [42,43]. Although the capacity of a photovoltaic system is still lower than that of a wind system, energy demands for PV systems are becoming increasingly important [44] for the fact that the number of photovoltaic systems with high power continually increases [45]. In contrast, the production of a photovoltaic system is strongly dependent on the different variations of the atmospheric conditions (solar irradiation and ambient temperature).
Therefore, it is necessary to maximize the output power of the PVs by a DC/DC converter controlled by a control unit known as the maximum power point tracking (MPPT). For this, the DC voltage at the output of the DC/DC converter must be maintained at a value acceptable by the inverter. Besides, PV supervision, diagnosis, and maintenance must be checked periodically for safety reasons (for example, fires) [46]. At the power grid for good power quality, the desirable total harmonic distortion (THD) of the output current must be achieved [47]. In the case of photovoltaic systems coupled to a high-voltage grid, photovoltaic systems must respect the voltage and the frequency of the grid, provide ancillary services (frequency regulation for example), and overcome grid failures (such as voltage drops and frequency variations) when a higher level of penetration becomes a reality [48].

2.3. Case Study Approach

We applied our approach to the energy distribution post of BALINGUE, which is the most extensive energy distribution post in Bamako (Mali’s capital city). The distribution post is supplied with energy produced by a thermal power station at BALINGUE itself; the energy production purchased on the interconnection network with a neighboring country (Ivory Coast), SELINGUE and SOTUBA hydro-electric production, are sources of energy specific to EDM. It supports seven urban departures (DU) of 15 KV and two departures of 30 KV, which supplies the city of KOULIKORO and the energy distribution post of BALKOU. Distribution post of BALKOU also has five urban departures (DU) of Bamako in 15 KV (Figure 10). Our objective is to minimize the purchase of energy and the production of thermal energy with the connection of a 30 MW solar plant.
For the work, we used the one-year database obtained at the distribution post level. Table 1 includes monthly and annual productions.
In this table, there is no production of the solar plant because it is not connected to the station at the moment.
The following figures (Figure 11 and Figure 12) represent the monthly and yearly productions of the different production points and the load that we did using the Excel tool.
The objective of the optimization will be to give priority to solar production when it is available and hydroelectric productions specific to EDM, which is SOTUBA and SELINGUE. If these productions are not sufficient to take charge, we proceed to the purchase of the interconnection network with a neighboring country (Ivory Coast), but with the idea of not exceeding a given threshold. We use the thermal power station, which is costly and fatal for climate change if there is no solution.
For the simulation, we modeled our system with the annual data collected by the agents of the distribution station by using the modeling and simulation tool HOMER. As the SOTUBA and SELINGUE hydroelectric power stations are clean sources of EDM, they were seen as permanent, according to the data that we have. The purchase on the interconnection grid and the operation of the thermal power station are automatic in case the two hydroelectric power stations and the production of the solar power station do not satisfy the energy demand.
For optimization, we considered two cases. In the first case, we set the purchase of energy at a maximum of 50 MW to see the impact of the use of the solar power station on the purchase of energy. In the second case, we increased the purchase of energy at a maximum of 100 MW to see the impact on thermal production. Then, we compared the two cases to estimate the cost of production and contribution to the pollution of the thermal power station. These values were chosen after analysis of the database whose peak power purchase was 96.90 MW in March.

3. Results and Discussion

3.1. For 50 MW Purchase Decision

The tables below summarize the simulation results when we decide not to exceed the purchase of energy with the neighboring country of 50 MW.
Looking at Table 1 and Table 2, we can see that the yearly energy purchase decreased sharply from 306,030.513 MWh to 153,778 MWh. However, the production of the thermal power station saw a small increase from 178,777,965 MWh to 211,537 MWh. Besides, when we look at Table 3, we find that the company managed to sell a little energy in case of overproduction of the solar plant that was even more important in January. The increase in thermal production can be compensated by this overproduction sold, but the climate impact is still adverse in this condition.

3.2. For 100 MW Purchase Decision

The results of the optimization of when it is decided to increase the purchase to a maximum of 100 MW have been summarized in the tables below.
In Table 1 and Table 4, we note that the purchase of energy increased with a difference of 71,568.49 MWh, but in reference to Table 5, this difference was reduced to 57,865.49 MWh, which is insignificant. However, the production of the thermal power station decreased considerably from 178,777.965 MWh to 20,240 MWh. Given this sharp fall, the 57,695.49 MWh surplus purchases are insignificant compared to the inconvenience of thermal production on climatic conditions.

3.3. Comparisons

In both cases, we saw the importance of solar production on both productions. In this section, we highlighted economic and ecological impacts, which are a current preoccupation for all nations, and especially Mali, which is a developing country.
The following tables summarize the statistics of the thermal power plant and its emission effects for both cases.
When we look at Table 6 and Table 7, we notice that for the decision to buy up to 50 MW on the interconnection network of the neighboring country, almost all the data were multiplied by 10. This is very important from the economic and climate change point of view. The number of startup groups increased from 168 to 338, which played significantly over its lifetime and reduced it considerably. Given these tables, it is evident that the optimal solution for this distribution station is the second case, which is the decision to purchase a maximum of 100 MW.
Figure 13 represents a comparison between the data of the database, the decision of a maximum purchase of 50 MW, and a maximum purchase of 100 MW. In Figure 14, we have fuel consumption for simulation cases. We can notice the net difference in these figures and conclude that the decision to buy a maximum of 100 MW is the best solution in economic and ecological terms.
The figures below represent time-series representations of the total load and the different productions for the case where it is decided to buy a maximum of 100 MW.
This curve allows us to see the evolution of consumption in terms of energy and the state of the different productions. Here, we randomly selected between 1 and 14 January to see its condition. At this time, even the solar power station alone can take charge, but the values of SOTUBA and SELINGUE are available because they were considered permanent for the simulation.
In Figure 15, we can see that consumption was high from 2 March and started to reduce from July; a further increase is observable in October and November. The month of January was observed as the lowest consumption month. It can also be noted that the thermal power plant was used a lot between April and July, as well as October when the energy demand was high.
From this curve, you can zoom to see a representation, on a quarter, a week, or a day.
By enlarging the curve (Figure 16), we see that the thermal power station was not used every day of June, which we can conclude by examining the representation on the year.
On the weekly curve (Figure 17), we can distinguish the different productions to satisfy the demand. In the first week of January, despite sometimes unstable solar production, energy was only paid a few hours, and the thermal power station was not used. However, in the third week of May, the thermal power plant was used almost every day for a few hours when the solar power station was not available or unstable.
On the daily representation (Figure 18), we can see the different productions and consumption over 24 h. On 1 January, we observe that from 1 h until 7 h, the energy demand is lower than the SELINGUE production. Around 7.5 h, it exceeded the SELINGUE production, and at that moment, the solar power plant production had already started. Despite the instability of the solar plant, the need to purchase was expressed only to 17 h, where the load has risen, and the solar power station was not available. The purchase lasted only from 17 h to 23 h and had an order inferior to 15 MW. The month of January almost functioned in this way, as it was the month where the energy sold was higher than the energy bought.
The day of 21 April was the day when demand was significant. All productions were used that day. At 10 h, despite the availability of the solar power station and the other three, the thermal power plant was used from 10 h to 16 h and from 17 h to 2 h.
It was also observed a short time of availability of the solar plant on 3 August. Practically, it was available only from 8 h to 14 h. The purchase of energy was increased from 14 h to 22 h, but without resorting to the thermal power station.

4. Conclusions

In Mali, energy production is based on production specific to EDM (thermal and hydro-electric) and the purchase of energy from private suppliers including the interconnection network (Ivory Coast). Among these particular production sources, the hydroelectric production is of the order of 35.8 MW (SOTUBA and SELINGUE) (Table 4), which is insignificant for demand energy that can reach up to 138.43 MW Figure 19. Therefore, thermal power plants will be the primary sources of electricity, and as a result, pollutant factors will increase (Table 5). In this work, we have shown the importance of the use of a PV solar power plant connected to the electricity grid, economically and ecologically. In different cases, we have seen the net contribution of solar production according to its availability.
If we decide to limit the purchase to a maximum of 50 MW, the energy purchased will decrease from 306,030.51 MWh/year to 153,778 MWh/year. However, the thermal production is a significant 211,537 MWh/year (Table 1 and Table 2). The energy bought decreases, but this solution is undesirable for the conditions of climatic variation.
By increasing the purchase to a maximum of 100 MW, the energy purchased increased a little from 306,030.51 MWh/year to 323,896 MWh/year, a difference of 17,865.49 MWh/year and 48.95 MWh/day, which is practically negligible (Table 1 and Table 4). However, the thermal production was reduced to 20,240 MWh/year (Table 4) and the total fuel consumed decreased from 74,303 L to 7141 L (Table 6).
Table 6 and Table 7 clearly show the impact of thermal energy generation in terms of production cost and contribution to climate change, which are two factors that preoccupy all nations today. In these tables, we note that the lifetime of the thermal power plant decreased from 29.6 years to 2.87 years, a difference of more than 25 years. Its consumption has also been multiplied by more than 10, which increases the cost of production tremendously.
The optimal solution is probably the decision to pay a maximum of 100 MW on the interconnection network of the neighboring country (Figure 14 and Figure 15). It was also observed throughout the year that one overproduction was sold back.
Based on the results of the different simulations, we can say that the objectives of this work have been achieved and help the Mali interconnection network by PV systems to better attain the stabilization objectives of the electricity grid and maintain continuity of service to satisfy consumer demand. It will significantly reduce the energy production of thermal power plants, which contributes positively to climate change, which is today a crucial issue for all of humanity.
But it leaves us many perspectives. Despite the lower production of the thermal power plant, CO2 emission other polluting factors are still important, at 232,055 kg/year (Table 7). Thus, in the future, we will see if it will cost less to use a storage system that will store overproduction and reuse, instead of thermal production. One can also see if a second solar power plant can be beneficial, considering that the lifetime of the thermal power plant will drop by more than 25 years, which corresponds to the minimum life of a solar system. Further, another alternative, renewable, and non-polluting source such as wind energy or biomass could be investigated.

Author Contributions

A.F.T. was mainly responsible for the technical aspects, conceived the methodology and designed the manuscript. S.A.A. and F.D. supervised and validated technical and economic issues. They helped with the calculations and analyzed the graphs and tables. B.D. and A.E.M. are projecting administrator, provided linguistic supervision and assistance.

Funding

This research received no external funding.

Acknowledgments

The authors acknowledge all those who helped to realize this work. Mainly M. Adama KEITA of the energy of Mali (EDM-Sa) for facilitating data access.

Conflicts of Interest

The authors declare no conflict of interest.

Nomenclature

ACAlternating Current
CO2Carbon dioxide
DCDirect Current
EDMEnergy of Mali
G n the rated solar radiation
GWGiga-Watt
hrs/yrHours per years
I d the current of the diode,
IphPhotocurrent
T n the rated cell temperature
I s c n the rated short-circuit current
I s the saturation diode current
kthe Boltzmann constant (1.3807 × 10⁻²³ J·K−1)
K i the current temperature coefficient
K v the temperature coefficient of the voltage
MPPTMaximum Power Point Tracking
MWh/yearMega-Watt Hours per years
N s the number of PV cells in series.
PVPhotovoltaic
qthe electronic charge (1.60217662 × 10⁻¹⁹ C),
THDTotal Harmonic Distortion
V d the voltage of the diode,
V t the thermal voltage of the semiconductor junction

References

  1. Almasoud, A.H.; Gandayh, H.M. Future of solar energy in Saudi Arabia. J. King Saud Univ. Eng. Sci. 2015, 27, 153–157. [Google Scholar] [CrossRef]
  2. Alharthi, Y.Z.; Siddiki, M.K.; Chaudhry, G.M. The New Vision and the Contribution of Solar Power in the Kingdom of Saudi Arabia Electricity Production. In Proceedings of the Ninth Annual IEEE Green Technologies Conference (GreenTech), Denver, CO, USA, 29–31 March 2017; pp. 83–88. [Google Scholar]
  3. Dominkovi’c, D.F.; Baˇcekovi’c, I.; Sveinbjörnsson, D.; Pedersen, A.S.; Krajaˇci’c, G. On the way towards smart energy supply in cities: The impact of interconnecting geographically distributed district heating grids on the energy system. Energy 2017, 137, 941–960. [Google Scholar] [CrossRef]
  4. Ramli, M.A.M.; Hiendro, A.; Al-turki, Y.A. Techno-economic energy analysis of wind/solar hybrid system: A Case study for the western coastal area of Saudi Arabia. Renew. Energy 2016, 91, 374–385. [Google Scholar] [CrossRef]
  5. Kordmahaleh, A.A.; Naghashzadegan, M.; Javaherdeh, K.; Khoshgoftar, M. Design of a 25 MWe Solar Thermal Power Plant in Iran with Using Parabolic Trough Collectors and a Two-Tank Molten Salt Storage System. Int. J. Photoenergy 2017, 2017, 1–11. [Google Scholar] [CrossRef]
  6. Noman, A.M.; Addoweesh, K.E.; Alolah, A.I. Simulation and Practical Implementation of ANFIS-Based MPPT Method for PV Applications Using Isolated C’ UK Converter. Int. J. Photoenergy 2017, 2017, 1–15. [Google Scholar] [CrossRef]
  7. Nengroo, S.; Kamran, M.; Ali, M.; Kim, D.-H.; Kim, M.-S.; Hussain, A.; Kim, H.; Nengroo, S.H.; Kamran, M.A.; Ali, M.U.; et al. Dual Battery Storage System: An Optimized Strategy for the Utilization of Renewable Photovoltaic Energy in the United Kingdom. Electronics 2018, 7, 177. [Google Scholar] [CrossRef]
  8. Sefa, İ.; Demirtas, M.; Çolak, İ. Application of one-axis sun tracking system. Energy Convers. Manag. 2009, 50, 2709–2718. [Google Scholar] [CrossRef]
  9. Available online: https://tel.archives-ouvertes.fr/tel-00635298/document (accessed on 5 April 2019).
  10. Al, H.; Kassem, A.; Awasthi, A.; Komljenovic, D.; Al-Haddad, K. A multicriteria decision-making approach for evaluating renewable power generation sources in Saudi Arabia. Sustain. Energy Technol. Assess. 2016, 16, 137–150. [Google Scholar]
  11. Fraunhofer Institute for Solar Energy Systems; ISE Photovoltaics Report; ISE: Freiburg, Germany, 2017; pp. 1–45.
  12. Sawin, J. Renewable Energy Policy Network for the 21st Century Renewables 2017 Global Status Report; REN21 Secretariat: Paris, France, 2017; pp. 1–302. [Google Scholar]
  13. Zsiborács, H.; Baranyai, N.H.; Csányi, S.; Vincze, A.; Pintér, G. Economic Analysis of Grid-Connected PV System Regulations: A Hungarian Case Study. Electronics 2019, 8, 149. [Google Scholar] [CrossRef]
  14. Bai, A.; Popp, J.; Balogh, P.; Gabnai, Z.; Pályi, B.; Farkas, I.; Pintér, G.; Zsiborács, H. Technical and economic effects of cooling of monocrystalline photovoltaic modules under Hungarian conditions. Renew. Sustain. Energy Rev. 2016, 60, 1086–1099. [Google Scholar] [CrossRef]
  15. Cucchiella, F.; D’Adamo, I.; Gastaldi, M. Economic Analysis of a Photovoltaic System: A Resource for Residential Households. Energies 2017, 10, 814. [Google Scholar] [CrossRef]
  16. Zsiborács, H.; Pintér, G.; Bai, A.; Popp, J.; Gabnai, Z.; Pályi, B.; Farkas, I.; Gützer, C.; Trimmel, H.; Oswald, S.; et al. Comparison of thermal models for ground-mounted south-facing photovoltaic technologies: A practical case study. Energies 2018, 11, 1114. [Google Scholar] [CrossRef]
  17. Leccisi, E.; Raugei, M.; Fthenakis, V. The Energy and Environmental Performance of Ground-Mounted Photovoltaic Systems—A Timely Update. Energies 2016, 9, 622. [Google Scholar] [CrossRef]
  18. Skoplaki, E.; Palyvos, J.A. Operating temperature of photovoltaic modules: A survey of pertinent correlations. Renew. Energy 2009, 34, 23–29. [Google Scholar] [CrossRef]
  19. Krauter, S. Increased electrical yield via water flow over the front of photovoltaic panels. Sol. Energy Mater. Sol. Cells 2004, 82, 131–137. [Google Scholar] [CrossRef]
  20. Available online: www.slideplayer.fr/slide/1162757/ (accessed on 20 March 2019).
  21. Available online: https://www.se4allafrica.org/fileadmin/uploads/se4all/Documents/Country_PANER/Mali_Plan_d_Actions_National_pour_les_Energies_Renouvelables_.pdf (accessed on 5 April 2019).
  22. Kymakis, E.; Kalykakis, S.; Papazoglou, T.M. Performance analysis of a grid-connected Photovoltaic Park on the island of Crete. Energy Convers. Manag. 2009, 50, 433–438. [Google Scholar] [CrossRef]
  23. Makrides, G.; Zinsser, B.; Norton, M.; Georghiou, G.E.; Schubert, M.; Werner, J.H. Potential of photovoltaic systems in countries with high solar irradiation. Renew. Sustain. Energy Rev. 2010, 14, 754–762. [Google Scholar] [CrossRef]
  24. Sharma, V.; Kumar, A.; Sastry, O.S.; Chandel, S.S. Performance assessment of different solar photovoltaic technologies under similar outdoor conditions. Energy 2013, 58, 511–518. [Google Scholar] [CrossRef]
  25. Daher, D.A.; Gaillard, L.; Amara, M.; Lips, B.; Ménézo, C. Suivi experimental des performances d’une centrale solaire photovoltaique a djibouti. Sci. Environ. 2014, 27, 16–22. [Google Scholar]
  26. Anurag, A.; Yang, Y.; Blaabjerg, F. Reliability analysis of single-phase PV inverters with reactive power injection at night considering mission profiles. In Proceedings of the 2015 IEEE Energy Conversion Congress and Exposition (ECCE), Montreal, QC, Canada, 20–24 September 2015; pp. 2132–2139. [Google Scholar]
  27. Ma, K.; Wang, H.; Blaabjerg, F. New approaches to reliability assessment: Using physics-of-failure for prediction and design in power electronics systems. IEEE Power Electron. Mag. 2016, 3, 28–41. [Google Scholar] [CrossRef]
  28. Blaabjerg, F.; Zhou, D.; Sangwongwanich, A.; Wang, H. Design for reliability in renewable energy systems. In Proceedings of the 2017 International Symposium on Power Electronics (Ee), Novi Sad, Serbia, 19–21 October 2017; pp. 1–6. [Google Scholar]
  29. De Nazareth Ferreira, V.; Cupertino, A.F.; Pereira, H.A.; Rocha, A.V.; Seleme, S.I.; de Jesus Cardoso Filho, B. Design and selection of high-reliability converters for mission-critical industrial applications: A rolling mill case study. IEEE Trans. Ind. Appl. 2018, 54, 4938–4947. [Google Scholar] [CrossRef]
  30. Blaabjerg, F.; Sangwongwanich, A.; Yang, Y. Flexible Power Control of Photovoltaic Systems. Adv. Renew. Energ. Power Technol. 2018, 207–229. [Google Scholar] [CrossRef]
  31. Perea-Moreno, A.J.; Hernandez-Escobedo, Q.; Garrido, J.; Verdugo-Diaz, J. Stand-Alone Photovoltaic System Assessment in Warmer Urban Areas in Mexico. Energies 2018, 11, 284. [Google Scholar] [CrossRef]
  32. Chen, W.; Hotchkiss, E.; Bazzi, A. Reconfiguration of NPC multilevel inverters to mitigate short circuit faults using back-to-back switches. CPSS Trans. Power Electron. Appl. 2018, 3, 46–55. [Google Scholar] [CrossRef]
  33. Serna, R.J.; Pierquet, B.J.; Santiago, J.; Pilawa-Podgurski, R.C.N. Field measurements of transient effects in photovoltaic panels and its importance in the design of maximum power point trackers. In Proceedings of the 2013 Twenty-Eighth Annual IEEE Applied Power Electronics Conference and Exposition (APEC), Long Beach, CA, USA, 17–21 March 2013; pp. 3005–3010. [Google Scholar]
  34. Blaabjerg, F.; Ionel, D.M. Renewable energy devices and systems with simulations in MATLAB and ANSYS; CRC Press, Taylor & Francis Group: Boca Raton, FL, USA, 2017; pp. 22–96. [Google Scholar]
  35. Cristaldi, L.; Faifer, M.; Rossi, M.; Toscani, S. An Improved Model-Based Maximum Power Point Tracker for Photovoltaic Panels. IEEE Trans. Instrum. Meas. 2014, 63, 63–71. [Google Scholar] [CrossRef]
  36. Zsiborács, H.; Pályi, B.; Pintér, G.; Popp, J.; Balogh, P.; Gabnai, Z.; Pető, K.; Farkas, I.; Baranyai, N.H.; Bai, A. Technical-economic study of cooled crystalline solar modules. Sol. Energy 2016, 140, 227–235. [Google Scholar] [CrossRef]
  37. Chandrasekar, M.; Rajkumar, S.; Valavan, D. A review on the thermal regulation techniques for non-integrated flat PV modules mounted on building a top. Energy Build. 2015, 86, 692–697. [Google Scholar] [CrossRef]
  38. Calise, F.; Figaj, R.; Vanoli, L. Experimental and Numerical Analyses of a Flat Plate Photovoltaic/Thermal Solar Collector. Energies 2017, 10, 491. [Google Scholar] [CrossRef]
  39. Zsiborács, H.; Pályi, B.; Baranyai, H.N.; Veszelka, M.; Farkas, I.; Pintér, G. Energy performance of the cooled amorphous silicon photovoltaic (PV) technology. Idojaras 2016, 120, 415–430. [Google Scholar]
  40. Koutroulis, E.; Kalaitzakis, K.; Voulgaris, N.C. Development of a microcontroller-based, photovoltaic maximum power point tracking control system. IEEE Trans. Power Electron. 2001, 16, 46–54. [Google Scholar] [CrossRef]
  41. Kjaer, S.B.; Pedersen, J.K.; Blaabjerg, F. A Review of Single-Phase Grid-Connected Inverters for Photovoltaic Modules. IEEE Trans. Ind. Appl. 2005, 41, 1292–1306. [Google Scholar] [CrossRef]
  42. Winneker, C. World’s Solar Photovoltaic Capacity Passes 100-Gigawatt Landmark after a Strong Year. 2013. Available online: http://pr.euractiv.com/pr/ (accessed on 4 April 2019).
  43. Yang, Y.; Enjeti, P.; Blaabjerg, F.; Wang, H. Wide-scale adoption of photovoltaic energy: Grid code modifications are explored in the distribution grid. IEEE Ind. Appl. Mag. 2015, 21, 21–31. [Google Scholar] [CrossRef]
  44. Renew Economy. Global utility-scale solar capacity climbs through 21 GW in 2013. 23 January 2014. Available online: http://reneweconomy.com.au/ (accessed on 4 April 2019).
  45. Spataru, S.; Sera, D.; Blaabjerg, F.; Mathe, L.; Kerekes, T. Firefighter safety for PV systems: Overview of future requirements and protection systems. In Proceedings of the 2013 IEEE Energy Conversion Congress and Exposition, Denver, CO, USA, 15–19 September 2013; pp. 4468–4475. [Google Scholar]
  46. Teodorescu, R.; Liserre, M.; Rodriguez, P. Grid Converters for Photovoltaic and Wind Power Systems; John Wiley & Sons: Hoboken, NJ, USA, 2011; Volume 29. [Google Scholar]
  47. Dotter, G.; Ackermann, F.; Bihler, N.; Grab, R.; Rogalla, S.; Singer, R. Stable operation of PV plants to achieve fault ride through capability-Evaluation in field and laboratory tests. In Proceedings of the 2014 IEEE 5th International Symposium on Power Electronics for Distributed Generation Systems (PEDG), Galway, Ireland, 24–27 June 2014. [Google Scholar]
  48. May, A.; McMillan, D.; Thöns, S. Integrating structural health and condition monitoring: A cost-benefit analysis for offshore wind energy. In Proceedings of the ASME 2015 34th International Conference on Ocean, Offshore and Arctic Engineering, St. John’s, NL, Canada, 31 May–5 June 2015. [Google Scholar]
Figure 1. Development of fuels consumed in Saudi Electricity Company (SEC) power plants from 2000 to 2014 [2].
Sustainability 11 02356 g001
Figure 2. Global distribution of annual solar radiation in kWh/m2 ©meteonorm.
Sustainability 11 02356 g002
Figure 3. Daily temperature maximum and minimum.
Sustainability 11 02356 g003
Figure 4. Curve of the characteristic of the power output and current output of the photovoltaic (PV) according to the output voltage.
Sustainability 11 02356 g004
Figure 5. Voltage/current characteristics of a photovoltaic generator under different conditions of variation of solar irradiation (a) and ambient temperature (b).
Sustainability 11 02356 g005
Figure 6. Bamako site coordinates under Meteonorm©.
Sustainability 11 02356 g006
Figure 7. Global radiation average monthly representation.
Sustainability 11 02356 g007
Figure 8. Insolation duration average monthly.
Sustainability 11 02356 g008
Figure 9. Structure of a photovoltaic power generation system connected to an electricity grid.
Sustainability 11 02356 g009
Figure 10. Structure of the energy distribution post of BALINGUE.
Sustainability 11 02356 g010
Figure 11. The curves of the variations of the different energies produced and load.
Sustainability 11 02356 g011
Figure 12. Annual energy obtained based on available data.
Sustainability 11 02356 g012
Figure 13. Annual production daily total of thermal, purchase energy, and PV system.
Sustainability 11 02356 g013
Figure 14. Annual fuel consumption for both decisions.
Sustainability 11 02356 g014
Figure 15. The curves of the powers over a year.
Sustainability 11 02356 g015
Figure 16. The power curves for a quarter.
Sustainability 11 02356 g016aSustainability 11 02356 g016b
Figure 17. Power curves over a week.
Sustainability 11 02356 g017
Figure 18. The curves of the powers on a day.
Sustainability 11 02356 g018
Figure 19. The model of the system under the simulation tool HOMER.
Sustainability 11 02356 g019
Table 1. Energy consumed, produced, and purchased per month for one year.
MonthSOTUBA (MWh)SELINGUE (MWh)BALINGUE (MWh)PURCHASE (MWh)LOAD (MWh)SELINGUE (MWh)BALINGUE (MWh)
January3354.9013,637.898541.9416,788.9322,762.6713,637.898541.94
February2942.6012,557.2012,363.086477.2035,456.5012,557.2012,363.08
March3188.3015,774.0320,215.9123,785.8256,631.1815,774.0320,215.91
April2940.1016,865.9022,394.8619,598.0265,099.2116,865.9022,394.86
May3222.6016,197.5220,540.3425,127.7372,716.5516,197.5220,540.34
June2528.1011,070.6020,493.3323,506.5568,205.7311,070.6020,493.33
July2320.508837.6916,769.4335,743.4461,288.138837.6916,769.43
August2154.0015,822.329502.3935,519.1952,150.1015,822.329502.39
September1563.1016,393.698640.8528,908.2047,898.3616,393.698640.85
October1671.0017,198.6013,674.9338,988.1367,466.4717,198.6013,674.93
November2125.1012,952.4014,275.0929,920.4157,232.3712,952.4014,275.09
December3186.3014,395.2611,365.8121,666.8949,074.7414,395.2611,365.81
Annual31,196.60171,703.10178,777.97306,030.51655,982.01171,703.10178,777.97
Table 2. Production summary for a maximum purchase of 50 MW.
ComponentRated Capacity (MW)Production (MWh/year)PercentHours of Operation (h/year)Maximum Power (MW)Minimum Power (MW)Mean Power (MW)
Generic flat plate PV30117,23417.1444828.5012.4
BALINGUE Thermal160211,53730.9521862.240.040.5
Grid Purchases50153,77822.4835750.038.847.97
SOTUBA5.831,1974.5586285.8003.56
SELINGUE30171,82825.1875129.7019.6
Total 685,573100
Table 3. Ivory Coast purchase for a maximum purchase of 50 MW per month.
MonthEnergy Purchased (MWh)Energy Sold (MWh)Net Energy Purchased (MWh)Peak Demand (MW)
January48417829−298838.8
February90202790623043.7
March12,944177411,17050.0
April14,665124913,41650.0
May17,63486016,77350.0
June16,98873616,25150.0
July15,965103614,92950.0
August11,971128210,68947.7
September10,8821690919250.0
October13,982131112,67150.0
November12,572136711,20550.0
December12,314180510,50943.4
Annual153,77823,729130,04850.0
Table 4. Production summary for a maximum purchase of 100 MW.
ComponentRated Capacity (MW)Production (MWh/year)PercentHours of Operation (h/year)Maximum Power (MW)Minimum Power (MW)Mean Power (MW)
Generic flat plate PV30114,54917.0444828.5012.4
BALINGUE Thermal16020,2403.0050640.040.040.0
Grid Purchases100337,59950.0835789.938.882
SOTUBA5.831,1974.6286285.8003.56
SELINGUE30171,82825.4875129.7019.6
Total 675,413100
Table 5. Ivory Coast purchase for a maximum purchase of 100 MW per month.
MonthEnergy Purchased (MWh)Energy Sold (MWh)Net Energy Purchased (MWh)Peak Demand (MW)
January48477689−284238.8
February13,715238711,32878.3
March29,05381228,24288.9
April33,43129233,13888.3
May39,9991.5439,99788.3
June39,73125.239,70689.9
July37,53610537,43189.8
August25,24219025,05287.7
September22,83590421,93177.9
October36,45239.636,41289.0
November32,47371.132,40289.1
December22,286118721,09978.0
Annual337,59913,703323,89689.9
Table 6. Diesel consumption and production statistics.
QuantityFor 100 MW of Purchase ForecastFor 50 MW of Purchase Forecast
Hours of Operation (h/year)5065218
Number of Starts (starts/ year)168338
Operational Life (year)29.62.87
Capacity Factor (%)1.4415.1
Total fuel consumed (L)714174,303
Avg fuel per day (L/day)19.6204
Avg fuel per hour (L/hour)0.8158.48
Specific Fuel Consumption (L/MWh)0.3530.351
Fuel Energy Input (MWh/ year)70,266731,142
Mean Electrical Efficiency (%)28.828.9
Electrical Production (MWh/ year)20,240211,537
Table 7. Statistical issues.
PollutantFor 100 MW of Purchase ForecastFor 50 MW of Purchase Forecast
Carbon Dioxide (kg/year)232,055291,684
Carbon Monoxide (kg/year)1181226
Unburned Hydrocarbons (kg/year)5.1453.5
Particulate Matter (kg/year)0.7147.43
Sulfur Dioxide (kg/year)971898
Nitrogen Oxides (kg/year)5631358

