Article

Economic Impacts of a Low Carbon Economy on Global Agriculture: The Bumpy Road to Paris †

1
Joint Research Centre, European Commission, 41092 Seville, Spain
2
Research and Analysis Directorate, Agriculture and Agri-Food Canada, Ottawa, ON K1A 0C5, Canada
3
Aragonese Agency for Research and Development (ARAID), Centre for Agro-Food Research and Technology, Instituto Agroalimentario de Aragón (IA2), Government of Aragón, 50059 Zaragoza, Spain
*
Authors to whom correspondence should be addressed.
Disclaimer: The views expressed are purely those of the authors and may not in any circumstances be regarded as stating an official position of the European Commission and Agri-Food Canada. The results of the analysis based on the use of the Aglink-Cosimo model are outside the responsibility of the OECD and FAO Secretariats.
Sustainability 2019, 11(8), 2349; https://doi.org/10.3390/su11082349
Submission received: 7 March 2019 / Revised: 5 April 2019 / Accepted: 16 April 2019 / Published: 19 April 2019
(This article belongs to the Special Issue Global Warming, Environmental Governance and Sustainability Issues)

Abstract

:
Limiting climate change below a 2 °C temperature increase this century will require substantial reductions of greenhouse gas emissions and the transition to a climate-friendly, low carbon society. In this paper, the economic impact of a less carbon-intensive economy on agricultural markets is estimated by means of an integrated modelling framework. First, the macroeconomic impacts of moving into a global low carbon economy are analysed by applying different carbon taxes in a general equilibrium modelling framework. Second, the potential adoption of emission mitigation technologies is quantified and used in the Aglink-Cosimo model to assess the impacts on agricultural markets of emission mitigation scenarios compatible with the 2.0 °C target prescribed in the Paris Agreement. Results for 2030 show reductions in global non-CO2 GHG emissions from agriculture (i.e., methane and nitrous oxide) by 10, 16 and 19% in 50, 100 and 150 USD/t CO2eq global carbon tax scenarios, respectively (Least Developed Countries excluded). Only between 0.6% and 1.3% of the global reduction is caused by indirect macroeconomic effects, although at the regional level they can cause up to 5.8% of the reduction in agricultural emissions. Results suggest that ambitious mitigation targets can provoke significant negative impacts on agricultural production and underline the importance of integrating GHG emission developments and impacts of related policies into agricultural market projections.

1. Introduction

The 21st Conference of the Parties of the United Nations Framework Convention on Climate Change (UNFCCC) in December 2015 resulted in the Paris Agreement, where parties agreed to take action to limit global temperature rise this century to well below 2 °C above pre-industrial levels [1], often referred as the “2 °C target”. Limiting climate change below 2 °C will require substantial reductions of greenhouse gas (GHG) emissions and the transition to a climate-friendly, low carbon economy. The European Commission’s report "Global Energy and Climate Outlook, Road from Paris" [2], provides an initial estimate of potential emission reductions by sectors in the global economy that are required to reach the 2 °C target. This estimation is done by comparing a business as usual reference scenario to a 2 °C target scenario for the world (Figure 1). The estimation indicates that the GHG emissions reduction required by 2030 could be achieved by the power sector (contributing 39% to the total mitigation effort), followed by “other energy” sectors (19%), industry (18%), agriculture (10%), buildings (6%), transport (4%) and waste (4%). These results exclude emissions and sinks for the “Land Use, Land Use Change and Forestry” sector (LULUCF). More precisely, global GHG emissions from the agriculture sector (i.e., only accounting for the agricultural non-CO2 emissions methane and nitrous oxide) are estimated to rise to 6.283 gigatonnes of carbon dioxide equivalents (GtCO2eq) by 2030 in the reference scenario, whereas they decline to 4.996 Gt CO2eq in the 2 °C scenario. This represents a 20% reduction in global agricultural sector emissions by 2030 [3].
Other model simulations identify similar reduction targets for agricultural non-CO2 emissions necessary to meet the objectives of the Paris Agreement. For example, the Integrated Model to Assess the Global Environment (IMAGE), the Global Change Assessment Model (GCAM) and the Model for Energy Supply Strategy Alternatives and their General Environmental Impact (MESSAGE) [4] calculated the need of global agricultural non-CO2 emissions mitigation in the range of 11–18% by 2030 compared to the reference emissions (a reduction of 0.92–1.37 GtCO2eq per year). The estimations in Kitous et al. [2] and Wollenberg et al. [4] are only two examples showing that the agricultural sector will be impacted both directly and indirectly by a low carbon economy. On the one hand, several studies point out that the agricultural sector has to directly contribute to emission reductions if the global climate change goals are to be met. This contribution has to come through direct emission reductions but also from increased land-use-based carbon dioxide removal [2,5,6,7,8,9], which will have a direct impact on agricultural production [10,11,12,13]. On the other hand, the agricultural sector will also be indirectly affected, as agricultural intermediate prices respond to the new economic environment. Given these foreseeable challenges, there is a need to adjust existing modelling tools, and eventually develop new ones, capable of analysing the economic impacts of a low carbon economy on agricultural markets in detail.
A variety of agricultural economic models are already equipped and utilized for the analysis of climate change mitigation on the agricultural sector [11,12,13]. However, the Aglink-Cosimo model [14,15], as one of the main partial equilibrium agro-economic models used to prepare medium-term agricultural market outlooks [16,17], is not yet prepared with all necessary features to account for agricultural emissions and respective mitigation efforts. Given that the agricultural projections produced annually by the OECD and FAO with the Aglink-Cosimo model establish the benchmark for many other agricultural economic models, it is specifically important that Aglink-Cosimo is able to transmit and measure the impact of a less carbon intensive economy on agricultural markets. Moreover, Aglink-Cosimo has important features that make it particularly suitable for analysing impacts on the agricultural sector of policies related to a movement towards a low carbon economy. For example, the model has a global coverage of the main agricultural commodities produced, consumed and traded, a detailed representation of domestic and trade-related agricultural policies, and accounts for substitution effects between agricultural commodities through explicit domestic price transmission equations [10,11]. Accordingly, enabling Aglink-Cosimo to transmit and measure the impact of a less carbon-intensive economy on agricultural markets is a major contribution to the future analysis of agricultural emission pathways and related impacts on agricultural market developments.
In this paper, the model adjustments necessary to enable Aglink-Cosimo to account for non-CO2 emissions and to reflect the impacts of a low carbon economy are briefly outlined. This updated model is then used to simulate the economic impacts on agricultural markets of a global 2 °C target that is compatible with the Paris Agreement. Since Aglink-Cosimo is a partial equilibrium model, this scenario analysis requires first capturing the macro-economic impacts in a general equilibrium model framework and transmitting these changes to the Aglink-Cosimo model. In a second step, the agricultural sector’s possible contribution to reductions in GHG emissions is analysed by implementing scenarios with a global GHG emission tax compatible with a 2 °C target. In addition, marginal abatement cost curves (MACC) for the main agricultural methane and nitrous oxide emission sources are introduced to capture the potential effects of technology development for mitigation (see methodological approach in Frank et al. [18]). This highlights the importance of technological progress for achieving a certain agro-environmental target, which is often neglected in the literature.

2. A Partial Equilibrium Modelling Framework

The Aglink-Cosimo model is a recursive-dynamic, partial equilibrium, multi-commodity market model of world agriculture. The model was developed by the OECD and FAO secretariats, with the double purpose of preparing medium-term (usually about 10 years) agricultural market outlooks [16,17], and to provide an economic simulation model for the assessment of policies [19,20,21] and economic changes related to the agricultural sector [22,23]. The model endogenously calculates the development of annual supply, demand and prices for the main agricultural commodities produced, consumed and traded worldwide. The present version of the model covers 82 individual countries and regions, 93 commodities and 40 world market clearing prices. Country and regional modules are developed and maintained by the OECD and FAO Secretariats, with important input in terms of data and analysis from country experts and national administrations. In a joint publication, the OECD and FAO provide annually a global outlook for the development of agricultural markets and prices. A large amount of expert knowledge is applied at various stages of the outlook process and Aglink-Cosimo is used to facilitate the consistent integration of this information from a markets intelligence perspective. Moreover, the outlook is built on the basis of specific assumptions on the short- and medium-term development of key macro-economic indicators (such as GDP, exchange rates, population, inflation and energy prices), which seem plausible at the moment of preparing the projections, given the current global environment [14,15]. For this paper, the model version released by the OECD-FAO with their 2017 agricultural market outlook was used. It includes market projections up to the year 2030 and a complete land allocation system introduced for 14 countries (Australia, Canada, Switzerland, Japan, South Korea, Mexico, Norway, New Zealand, United States of America, European Union, Argentina, Brazil, China and Russian Federation), taking into account double cropping systems in China, Brazil [24] and the United States [16]. Taking this initial model version and its underlying database, the following elements were added to analyse the impact of a less carbon intensive economy on the agricultural sector: (1) an enhanced land allocation system, (2) diminishing food demand elasticities with growing income, (3) increasing factor productivity and long run yield elasticities, (4) a module on GHG emission accounting (i.e., estimation of emission intensities per agricultural production activity), and (5) incorporation of technological progress for emission abatement (i.e., decomposition of technological, production and structural emission reduction effects). These model improvements are briefly outlined below.
First, a complete land allocation system was imposed for all single developing countries (Algeria, Angola, Bangladesh, Burkina Faso, Cambodia, Cameroon, Chad, Chile, Colombia, Congo, Côte d’Ivoire, Democratic Republic of the Congo, Egypt, Ethiopia, Gabon, Ghana, Haiti, India, Indonesia, Iran, Iraq, Israel, Kazakhstan, Kenya, Lao People’s Democratic Republic, Lebanon, Libyan Arab Jamahiriya, Madagascar, Malawi, Malaysia, Mali, Mauritania, Morocco, Mozambique, Myanmar, Nigeria, Pakistan, Paraguay, Peru, Philippines, Rwanda, Saudi Arabia, Senegal, Somalia, South Africa, Sudan, Thailand, Tunisia, Turkey, Uganda, Ukraine, United Republic of Tanzania, Uruguay, Viet Nam, Yemen, Zambia and Zimbabwe) and developing country regions (Other Sub-Saharan Africa, Least Developed Countries (LDC), Subsaharan Africa, Other Asia Developed, Other Asia, LDC Asia, Other Oceania, LDC Oceania, Other South America and Caribbean, Other Middle East, Other Western Europe, and Other Eastern Europe) specified in the model, where initially “pasture land” and “other crop land” (i.e. aggregate of the land used by all other crops not specifically included in Aglink-Cosimo) were exogenous. Incorporating a full land allocation system in the Aglink-Cosimo model is especially important in the context of emissions related to land use and land use change (LULUC). For this purpose, a full matrix of supply elasticities for crop land was estimated, specifically including pasture and other crop land, which, for example, allowed accounting for ruminant production returns on land allocation. Even though CO2 emissions related to land use changes are not yet considered in the emission accounting of the model, capturing changes in total land use gives an indication of the effects that policy changes can have on GHG emission developments.
Second, adjustments to the income, own food and cross food demand elasticities were made in the model for developing countries. In particular, these elasticities were transformed to become variables (as opposed to constants), allowing them to decrease in value as wealth increases over time. This adjustment, thus, enables the ability for developing countries to close income gaps with developed economies (i.e., allows developing countries to move along the Engel curve).
Third, another important issue to consider in medium- to long-term analysis is factor productivity, which is expected to increase over time. Therefore, a long-term crop yield response to movements in agricultural commodity prices and input costs, as well as to the share of labour. was also introduced into the model. This adjustment included: (i) the estimation of long-term elasticities responding to historical long-term crop prices and cost signals [25], (ii) changes in the share of labour in the total cost index, following changes in real GDP per capita [16], and (iii) a new input demand system, reflecting that the move to a low carbon economy will likely affect the prices of fertilisers, chemicals and energy, which in turn could lead to changes in the input mix.
Fourth, modelling the contribution of the agricultural sector to GHG emission reduction targets involves calculating GHG emissions per agricultural production activity (i.e., emission intensities) and allowing the model to react when GHG emission mitigation policies, such as carbon taxes, are imposed. Therefore, the model was improved to account for the agricultural non-CO2 emissions methane and nitrous oxide, which the UNFCCC attributes to the sector “agriculture”, differently than CO2 emissions and removals (LULUCF sector) and CO2 emissions related to energy consumption at the farm and the processing of agricultural inputs (other sectors). These were calculated following the IPCC [26] guidelines at the tier 1 level and using FAOSTAT data for the emission factors [27,28,29]. GHG emissions were then calculated in the model per country or region by multiplying the activity data (i.e., hectares of land and heads of livestock) by the calculated emission factors. In order to perform different policy scenarios, the non-CO2 emission inventories in Aglink-Cosimo were aggregated in CO2 equivalents.
The calculation of emission factors was based on historical emissions and production data from FAOSTAT, but in order to allow for emission efficiency improvements reflecting the dynamics of production systems, trend functions were estimated. These trend functions for emission intensities were estimated within a robust Bayesian estimation framework that combined data from FAOSTAT on production quantities and emission inventories. The approach is further outlined in Jansson et al. [30], Pérez Domínguez et al. [31,32], and Van Doorslaer et al. [33]. Regarding carbon taxes, the taxes on emissions were introduced in the individual area harvested and livestock production equations, which allowed the analysis of tax effects in terms of emission reductions and production impacts at the individual country level. The carbon tax was introduced on a “per tonne of carbon-equivalent” basis and was applied to each production activity in each region captured by the model, so that emission intensity across activities and regions was taken into account.
Finally, technological (i.e., technical and management-based) mitigation options are incorporated into the analysis in the (reduced) form of regional marginal abatement cost curves (MACC) for different agricultural non-CO2 emissions. These MACC are estimated ex-post based on information from Lucas et al. [34] and are depicted as the exponential function of the maximum potential degree of abatement given a certain carbon tax (i.e., the maximum emission reduction level to be reached when the cost of reducing the last tonne of emissions equals the price of the tax). With this it is possible to further disaggregate the changes in emissions and production related to different carbon taxes into: (a) production effects (i.e., reducing agricultural production), (b) structural effects (i.e., structural change in the agricultural sector due to trade or shifts in consumption preferences for agricultural commodities) and (c) technological effects (i.e., technological progress at the agricultural production level) [18].

3. Scenario Narratives and Design

This paper assesses the impact of a low carbon economy on the agricultural sector and focus on the potential contribution of the agricultural sector to global GHG emission reduction targets by means of global carbon tax scenarios. Currently, a large share of agricultural non-CO2 GHG emissions stem from bovine meat and dairy production. In the past, GHG intensities from these livestock production activities have been reduced due to the evolution from less to more intensive productions systems, resulting in increases in commodity output per animal that are larger than the corresponding increases in emissions per animal [28]. Similarly, agricultural yields have evolved towards more intensive and resilient crop production systems. Taking these past trends into account, the option of retiring land from agricultural production, creating potential carbon sinks, is one possible strategy to reduce CO2 emissions. This could be combined with changes in consumer’s preferences towards diets containing less animal protein [35]. A way to accomplish this strategy and to enforce the contribution of the agricultural sector to GHG emission mitigation is to introduce a carbon tax per tonne of GHG emissions. This would effectively target commodities with higher GHG intensities, which typically would be ruminant meat and milk from less intensive livestock productions systems. The resulting commodity price increase would give an incentive to consumers to change their consumption habits to less emission intensive products (e.g., eating less beef).
Following this underlying narrative, three global carbon tax scenarios are tested against a business-as-usual medium-term reference situation without a carbon tax (baseline). In the carbon tax scenarios (Tax50, Tax100 and Tax150) the macroeconomic effects inherent in moving to a global low carbon economy are specifically accounted for. Moreover, the potential incorporation over time of new mitigation technologies linked to the carbon price scenarios are taken into account. In practice three separate homogenous carbon price paths for all countries, with the exception of Least Developed Countries (LDCs), are introduced, with carbon prices gradually increasing from 0 in 2020 to, respectively 50, 100 and 150 USD/t CO2eq in 2030. With this scenario setting the impact that emission mitigation policies could have on agricultural production and consumer diets can also be highlighted. Mitigation policies in LDCs are not simulated, such as to avoid potential negative effects on regional production, aggravating food insecurity.
Given that Aglink-Cosimo is a partial equilibrium model, the total impact of a low carbon economy cannot be directly evaluated. The majority of emission reductions will have to be made by other sectors of the economy [2], and imposing a carbon tax on the global economy will induce macroeconomic effects (e.g., changes in prices for crude oil, fertilisers and pesticides, as well as changes in real GDP) that in turn will impact the agricultural sector. As macroeconomic variables are exogenous in the Aglink-Cosimo model, the macroeconomic impact of a low carbon economy has to be first captured and quantified in a Computable General Equilibrium (CGE) model and then transmitted to the agricultural economic model. For this, a set of carbon tax scenarios is simulated using the Modular Applied GeNeral Equilibrium Tool (MAGNET) model and the GTAP database version 9 with base year 2011 [36]. MAGNET is a multi-regional, multi-sectoral, applied general equilibrium model based on neo-classical microeconomic theory [37]. Two versions of this model were used for this paper. The first version was a standard model using the dynamic steering system to compile a GHG emissions model and associated databases. Adjustments were then made to this initial model so that the primary agricultural sector was excluded from carbon taxes in a second model version, i.e., the carbon tax was removed from equations modelling primary agricultural taxes within the model. The same baseline scenario was run on both model versions projecting the GTAP database over four time periods (2011–2017, 2017–2020, 2020–2025, and 2025–2030). Carbon tax scenarios were then imposed as counterfactual simulations in the years 2020, 2025 and 2030 in both models, where the respective nominal Aglink-Cosimo carbon taxes were deflated to real 2011 USD. The resulting percentage changes in the price of energy (i.e., aggregated price change of crude oil, gas, coal), as well as changes in the price of chemicals (i.e., proxy for mineral fertilisers and pesticides) were transmitted to the agricultural economic model. Since a carbon tax on crude oil and pesticides cannot be directly imposed in Aglink-Cosimo, the energy and pesticide price changes are taken from the first version of MAGNET (i.e., including carbon taxes on all economic sectors). Conversely, a carbon tax is directly imposed in the Aglink-Cosimo model for fertilisers by taking the price change from the second MAGNET model version (i.e., excluding carbon taxes for primary agriculture). For a more detailed description of the MAGNET model and its use for the scenario analysis presented in this paper, please see the Supplementary Materials.
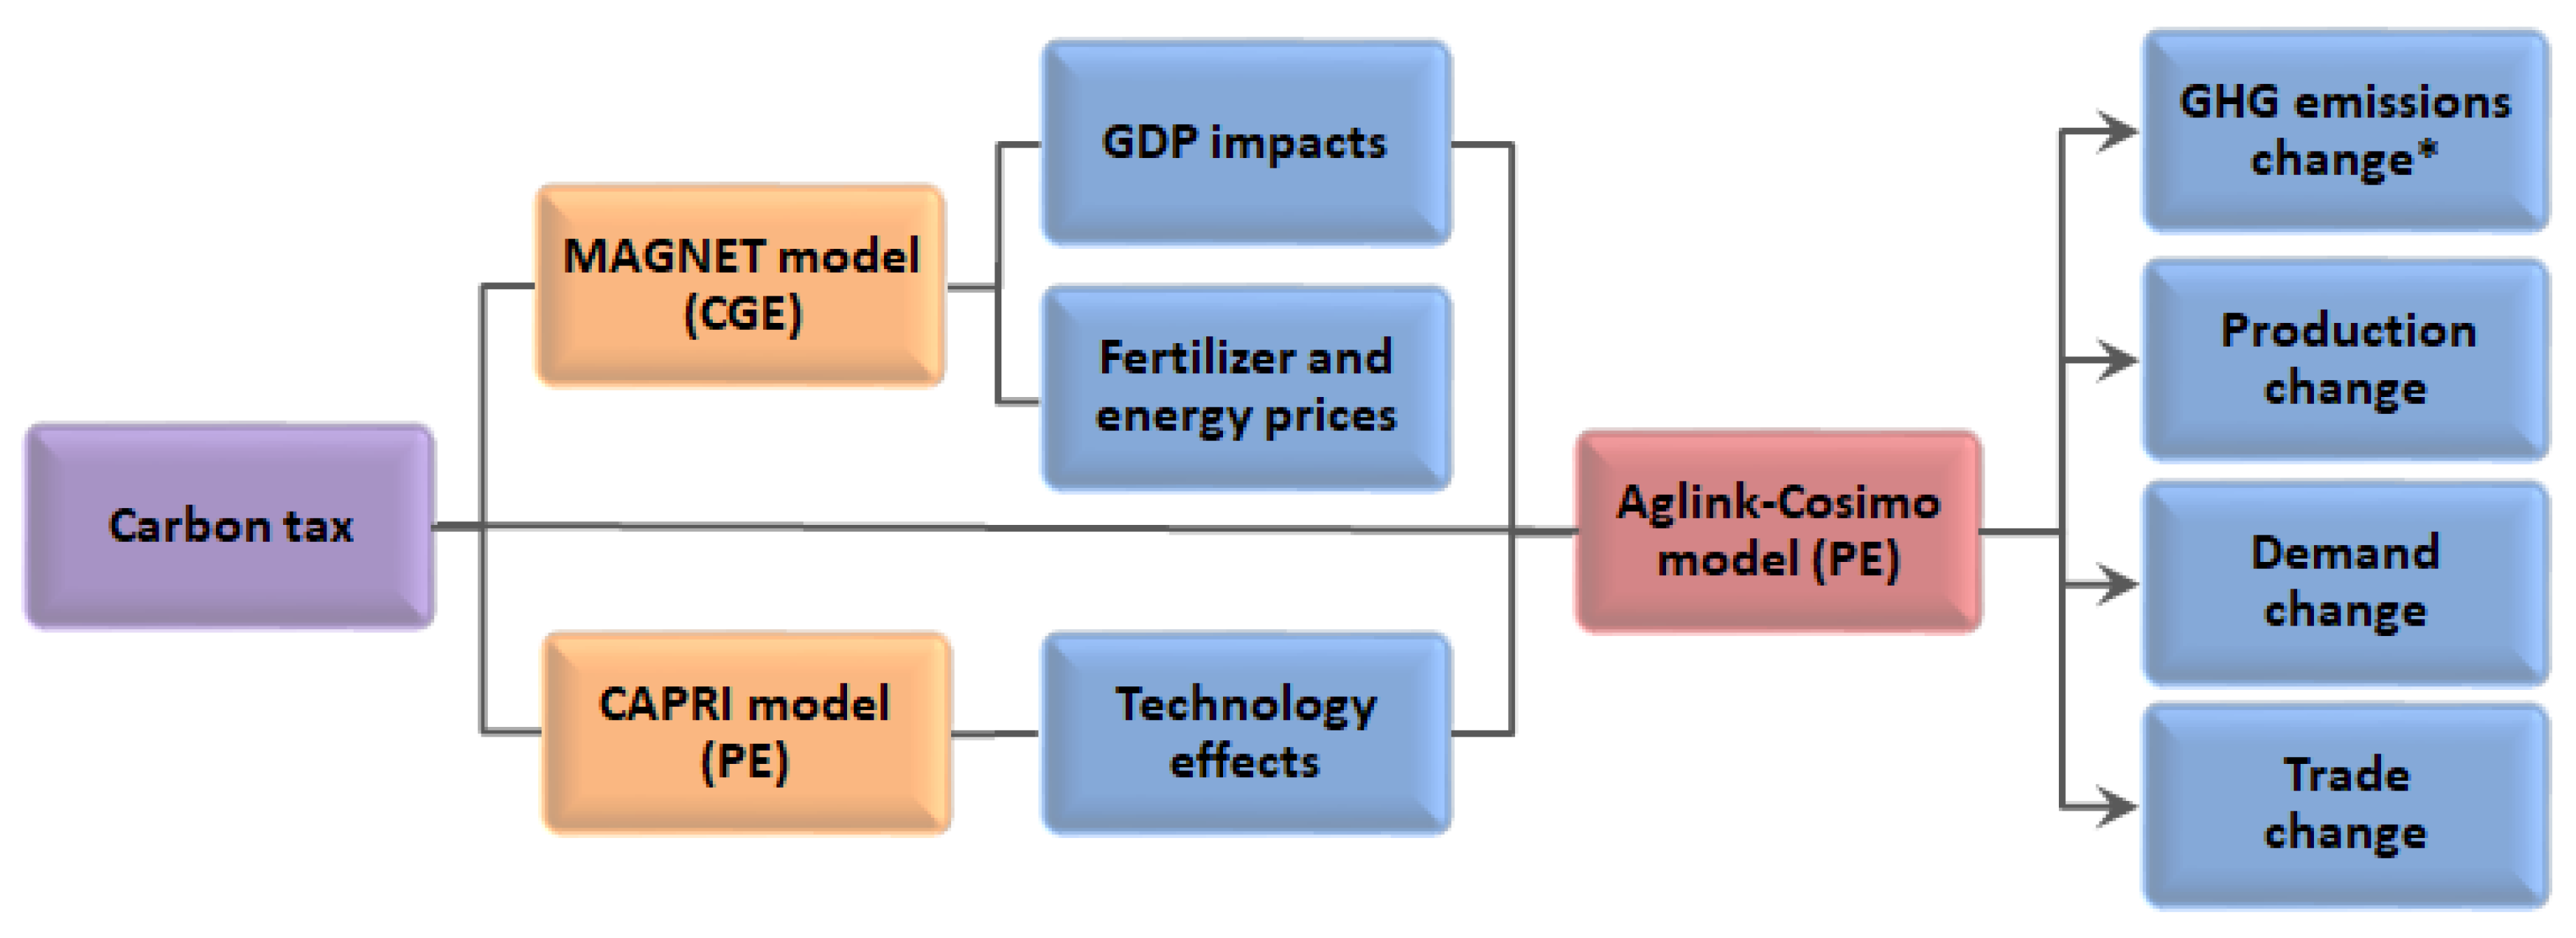
In a similar manner, the implementation of a carbon tax in Aglink-Cosimo does not capture any change in emission intensities per agricultural activity. Such a change will occur when cost-efficient mitigation technologies and management practices get adopted, as long as the carbon price exceeds their implementation costs. To capture this technological effect, the Common Agricultural Policy Regional Impact Analysis (CAPRI) model is employed, which is a partial equilibrium, large-scale economic, global multi-commodity, agricultural sector model [38]. The CAPRI model does not have the same detailed global agricultural coverage as the Aglink-Cosimo model, but is able to calculate global marginal abatement cost curves (MACC; [13]). Consequently, the three carbon tax scenarios are implemented in the CAPRI model to identify the mitigation potentials through increased adoption of technology by agricultural producers as carbon taxes change. The simulated emission mitigation in CAPRI was then decomposed into production, structural and mitigation technology effects, and the resulting changes in emission intensities were then transferred into the Aglink-Cosimo carbon tax scenarios to get a complete picture of the effects of a low carbon economy on the global agricultural sector. The methodological approach of the paper is illustrated in Figure 2.

4. Scenario Analysis and Discussion

4.1. Baseline

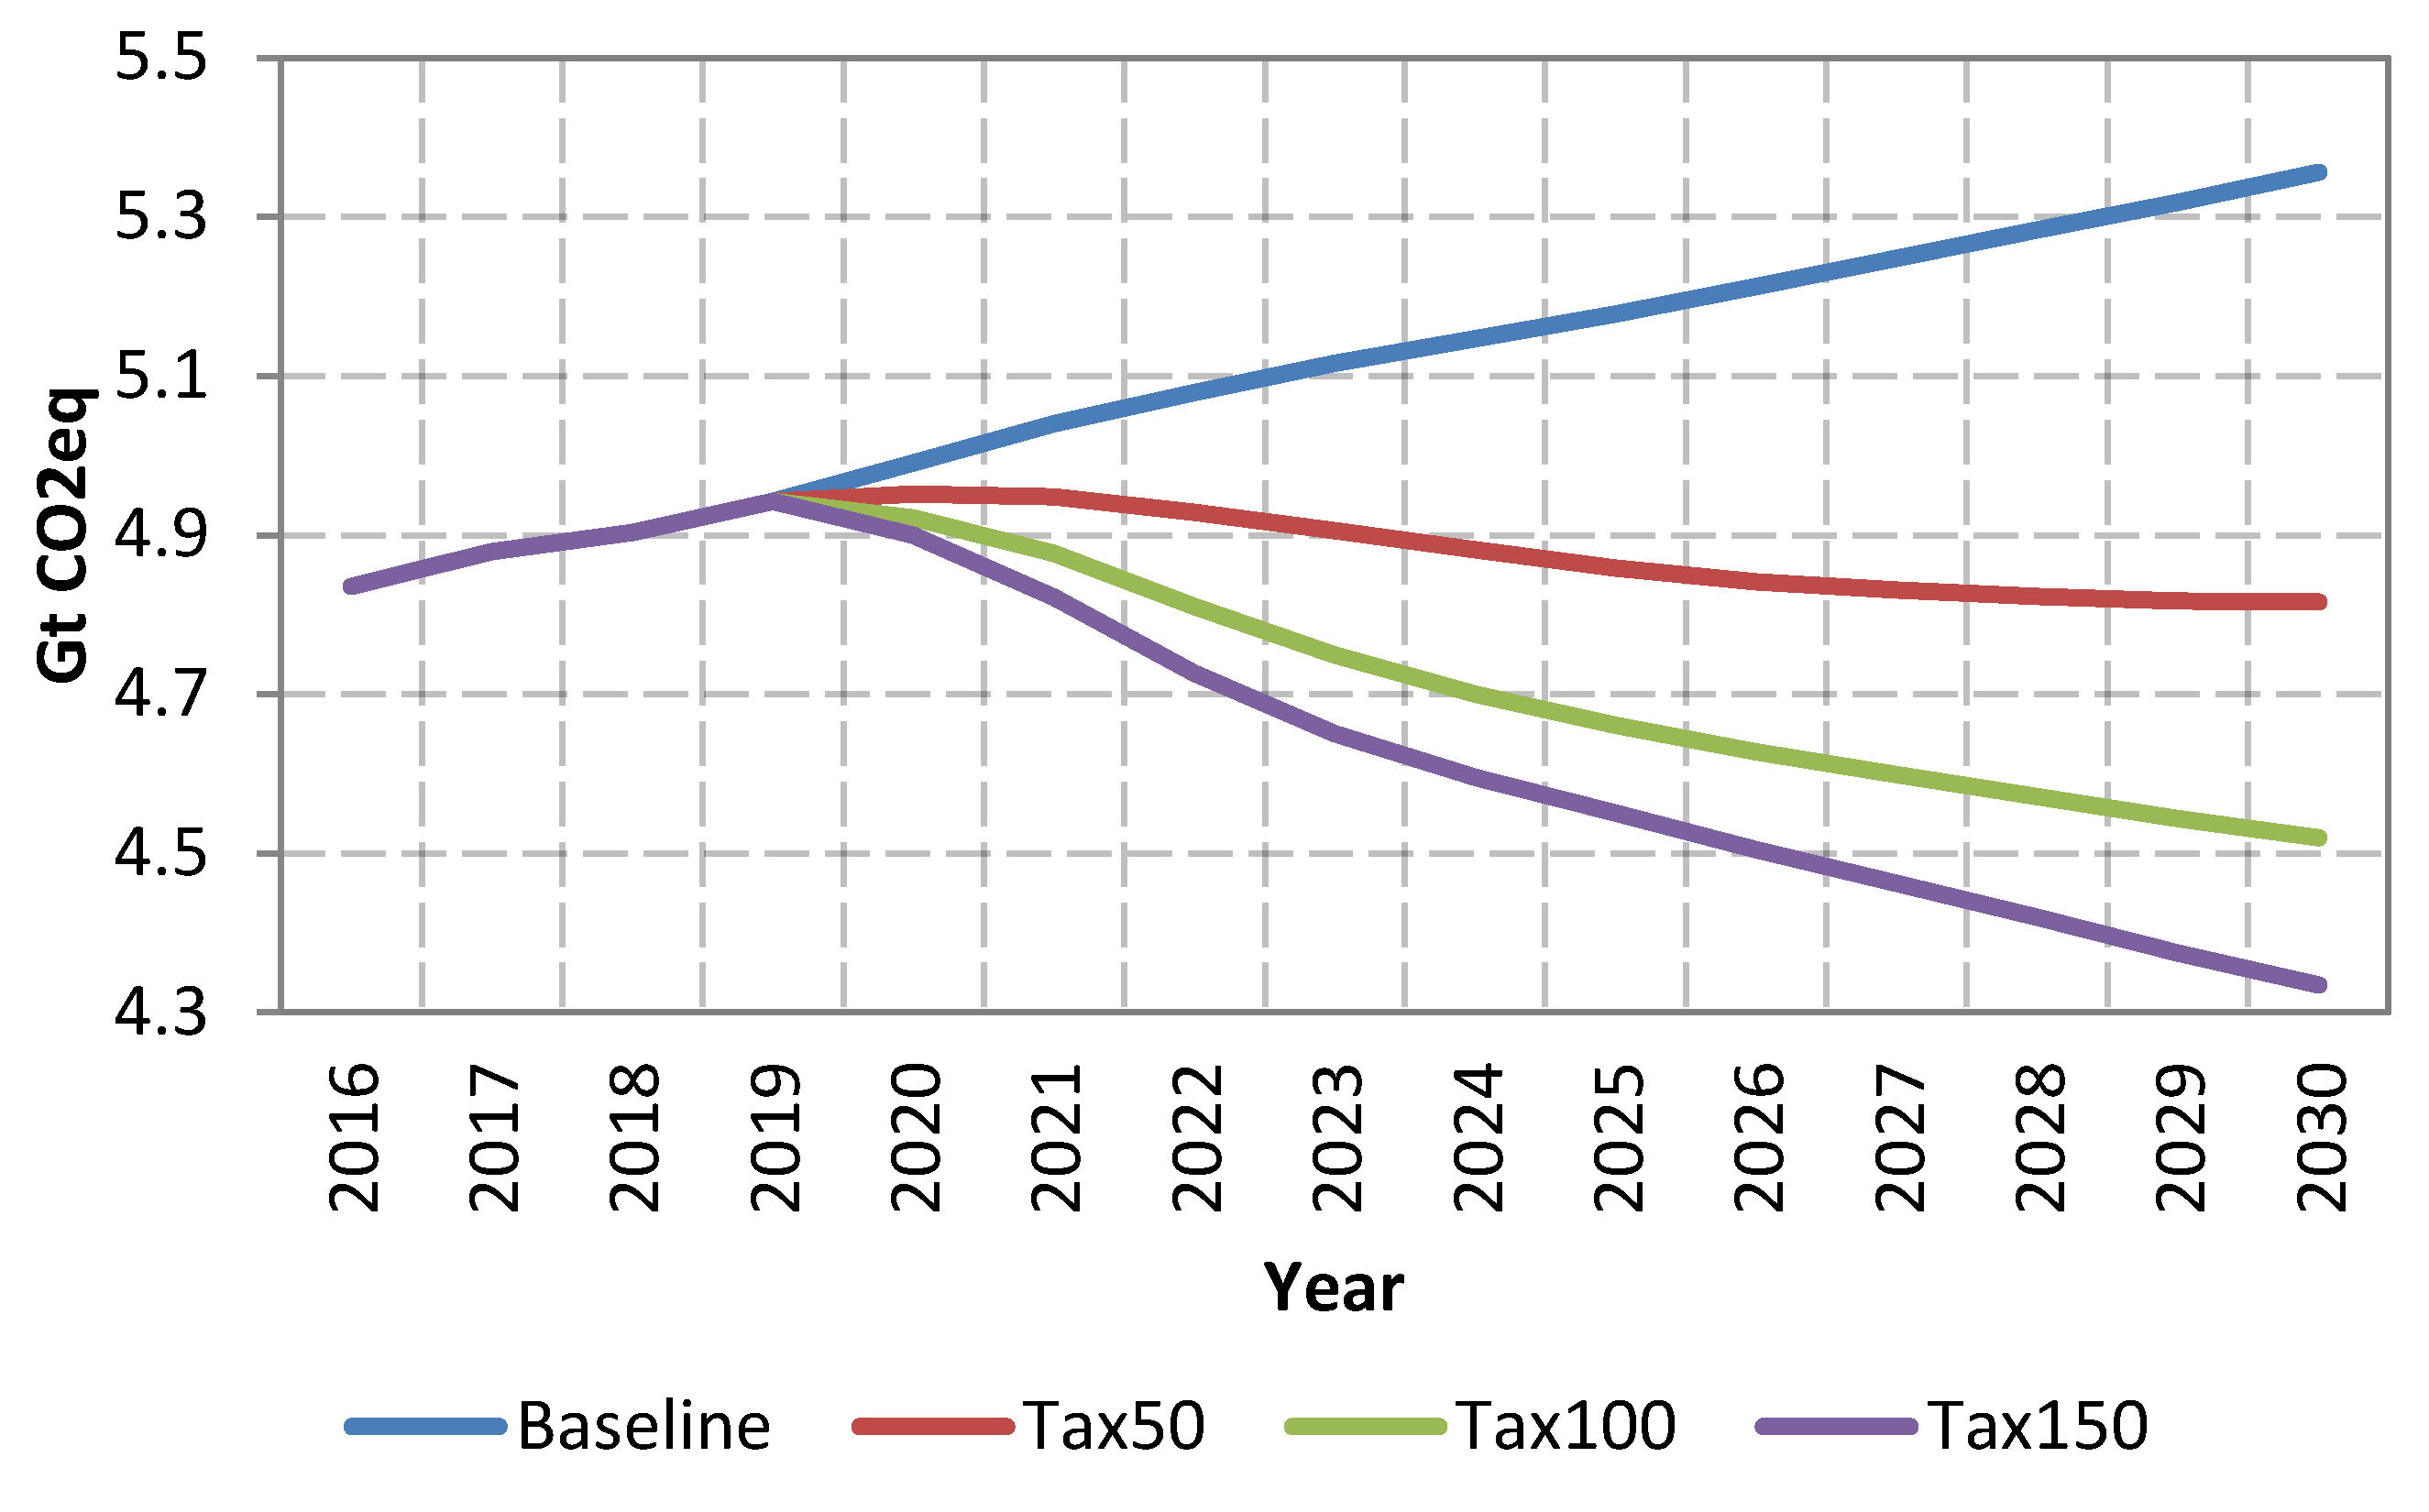
Baseline results show an increase in global agricultural non-CO2 GHG emissions from 4.8 GtCO2eq in 2016 to 5.4 GtCO2eq by 2030 (Figure 3, left panel). This is in line with the projected FAOSTAT estimate of 5.8 Gt CO2eq in 2030 [29] but well below other model (MAGNET, IMAGE) baseline projections of agricultural GHG emission [13]. In fact it is to be expected that the Aglink-Cosimo projected GHG emissions are lower than the ones estimated by the FAO, since the model does not include emissions from burning savannah and crop residues.
The projected increase in agricultural GHG emissions in the baseline is driven by increased demand for agricultural commodities by a growing population. However, due to yield gains per hectare of land and livestock head, global agricultural non-CO2 emissions per capita are declining over time. Not surprisingly, commodities with the highest GHG intensities (kg CO2eq/kg commodity) are cattle and sheep meat followed by chicken and pigmeat, whereas the lowest emission intensities are found in cereals, which is in line with Tubiello et al. [27]. This points the finger at animal husbandry as the main possible source of agricultural GHG mitigations. The Aglink-Cosimo baseline projects that about 76% of agricultural GHG emissions stem from animal husbandry, with enteric fermentation accounting for 50% of agricultural sector emissions. This falls in line with FAO estimates [29], which find that roughly 70% of agricultural GHG emissions stem from livestock.
Over the baseline period, average global meat (i.e., beef, pork, poultry, and sheep) consumption increases from 42.6 to 43.1 kg/capita/year in 2030, with notably poultry and sheep meat consumption increasing, while pork consumption declines and beef consumption per capita remains nearly unchanged. Even though the per capita consumption of bovine meat remains stable, an increasing population means increasing total demand for bovine meat, leading to an expansion of the global livestock inventories. The expected yield increases are not enough to meet the increased demand for food and feed, leading to an expansion of the global utilised agricultural area by 28 million hectares in 2030 compared to the base year 2016.

4.2. Macroeconomic Impacts on the Agricultural Sector

As shown in Figure 3, the introduction of carbon pricing reduces global agricultural non-CO2 GHG emissions by 2030 between 10% (−0.540 GtCO2eq) in Tax50 and 19% (−1.021 GtCO2eq) in Tax150. Of these agricultural emission reductions, the macroeconomic spill-over effect from the rest of the economy of imposing the equivalent carbon taxes accounts for between 0.6% (−0.003 GtCO2eq) in Tax50 and 1.3% (−0.013 GtCO2eq) in Tax150. The largest macroeconomic impact stems from reductions in GDP (i.e., lower global income), followed by changes in input prices. The largest impacts on real GDP by 2030 occur in China (2.7%), India (2.6%) and Russia (2.5%) with a tax of 150 USD/t°CO2eq. For a carbon tax of 50 USD/t (Tax50), crude oil, fertiliser, and pesticide prices are expected to, respectively, increase by 2.0–15%, 2.2–17% and 0.2–1.7% in the period 2020–2030. As the carbon tax increases to 150 USD/t CO2eq (Tax150), the price of crude oil, fertiliser, and pesticides are projected to increase by 43, 48, and 4.5%, respectively, in 2030. The increase of input prices for Tax100 are in corresponding ranges between the price increases of Tax50 and Tax150.
The macroeconomic spill-over effects account for only as much as 1.3% of global agricultural GHG emissions reduction, but at the country level contributions might vary significantly. For example, in Canada, the United States and China, macroeconomic spill-over effects of a 150 USD/t CO2eq tax account for 5.8, 4.6 and 3.3%, respectively, of total mitigation in their domestic agricultural sectors. Other regions and countries with less intensive agricultural production (i.e., relying less on the input use of fertiliser and fuel) are less affected by the macroeconomic changes induced by moving to a global low carbon economy. For instance, the macroeconomic impacts in the three scenarios actually lead to an increase in the agricultural emissions of countries like Argentina and Australia.

4.3. Decomposition of Mitigation and Production Impacts

The introduction of carbon taxes in the agricultural sector could reduce global agricultural non-CO2 GHG emissions by 2030 between 10% in Tax50 (0.540 Gt CO2eq) and 19% in Tax150 (1.021 Gt CO2eq). These declines, particularly those observed in Tax150, are fairly consistent with other studies aiming to estimate the efforts required to achieve the goal of the 2 °C scenario by 2030, such as the 20% (1.07 Gt CO2eq) reduction of agricultural GHG emissions estimated by Kitous et al. [2] and the 11–18% (0.92–1.37 GtCO2eq) identified by Wollenberg et al. [4]. Given our medium-term time horizon of implementing a carbon tax (2020–2030), and the phasing in of taxes over this period, a larger emission reduction is not likely. In other studies, typically with a longer time span, a 20-30% emission reduction is feasible. Frank et al. [13] compare the mitigation potential of imposing a homogenous carbon tax on the agricultural sector across four models, highlighting that the models already at a carbon price of 100 USD/t CO2eq show a significant potential for emission reductions of 1.6 to 2.6 Gt CO2eq/year by 2050, which is equivalent to a 20–35% reduction compared to the baseline (it should be noted that this study assumes a 20 year longer time span (2030–2050) and the carbon tax is in real USD, which in nominal prices would be equivalent to a tax of 200-250 USD in 2050, depending on the rate of inflation, when implemented in Aglink-Cosimo, which uses nominal USD). In the simulation exercise of Frank et al. [13], technical and structural changes account for 75–80% of agricultural emissions reduction, however, this is over a longer time horizon (100 USD/t CO2eq in 2050). The remaining mitigation of 20–25% is achieved through a reduction in domestic production. The decomposition of our scenario results are in line with the findings of Frank et al. [13], with the major mitigation contributions coming from technology and management options (74% by 2030 in Tax150). Structural adjustments contribute 16% to overall mitigation, i.e., changes in trade and production mix (e.g., switching from ruminant to non-ruminant products), whereas production reductions only contribute 10%. In this decomposition exercise countries and world production of commodities were aggregated into two categories—animal-based and crop-based production—using their relative dry matter content, as well as aggregating their carbon emissions. This enabled us to capture structural changes due to changes in yields and the dynamic effects of relative movement of production between sectors with varying carbon emission intensities, within the aggregated sectors.
The mitigation development presented in Figure 4 shows that mitigation from applying new technologies becomes more attractive as carbon prices increase. At low carbon prices, the cost-efficient mitigation approach is through commodity trade or shifts in consumption preferences for agricultural products, i.e., structural effects. Adoption of new technologies is often not attractive due to high implementation costs. However, as carbon taxes increase, technology application becomes more attractive and cost-efficient. The underlying logic is that the introduction of a carbon tax increases farmer’s incentives to adopt new mitigation technologies and management practices, as well as increases consumer’s incentives to change their consumption habits. The mitigation measures will be adopted as long as the carbon price exceeds the costs per tonne CO2eq saving of a mitigation option. Accordingly, as the carbon price increases, the share of the technological mitigation effect increases compared to the decreasing share of structural change mitigation effect (as shown in Figure 4). However, Frank et al. [13] show that there are limits to the emission mitigation that can be achieved by technology adoption and structural changes. Consequently, their mitigation share decreases the further carbon prices rise beyond the tax level in our analysis, and mitigation has to be achieved by reduction in agricultural production levels [13]. It has to be noted that the technology effect in our results is based on the work by Lucas et al. [34] and calculated by the CAPRI model (www.capri-model.org), which tends to have relatively small production effects (and hence higher technology and structural effects) compared to other models at high carbon prices. This is mainly because CAPRI has a detailed cross-price matrix, which allows for strong substitution between products (for example ruminant and non-ruminant products), leading to a stabilisation of consumption, and hence, production.
The decomposition of global mitigation mechanisms presented in Figure 4 is not always reflected at the individual country level (Table 1). For the understanding of country level results it is important to keep in mind that at the global level, trade falls under the structural effects. However, at the national (country) level, part of the global trade effect becomes a national production effect. For instance, total agricultural production in Brazil is decreasing, contributing to 26% of the total agricultural emissions mitigation (most of the adjustments in the beef sector). The European Union is characterized by a relatively emission-efficient agricultural sector (i.e., relatively low emissions per kg of commodity produced) compared to other countries. Accordingly, the simulated carbon taxes increase the European Union´s competitiveness, which leads to an increase in domestic production, and hence also to a 2% increase in the related emissions. LDCs are exempt from the simulated carbon tax in our scenarios. Accordingly, their production and related emissions are expected to increase, while at the same time they have no incentives to increase the adoption in mitigation technologies (Table 1).
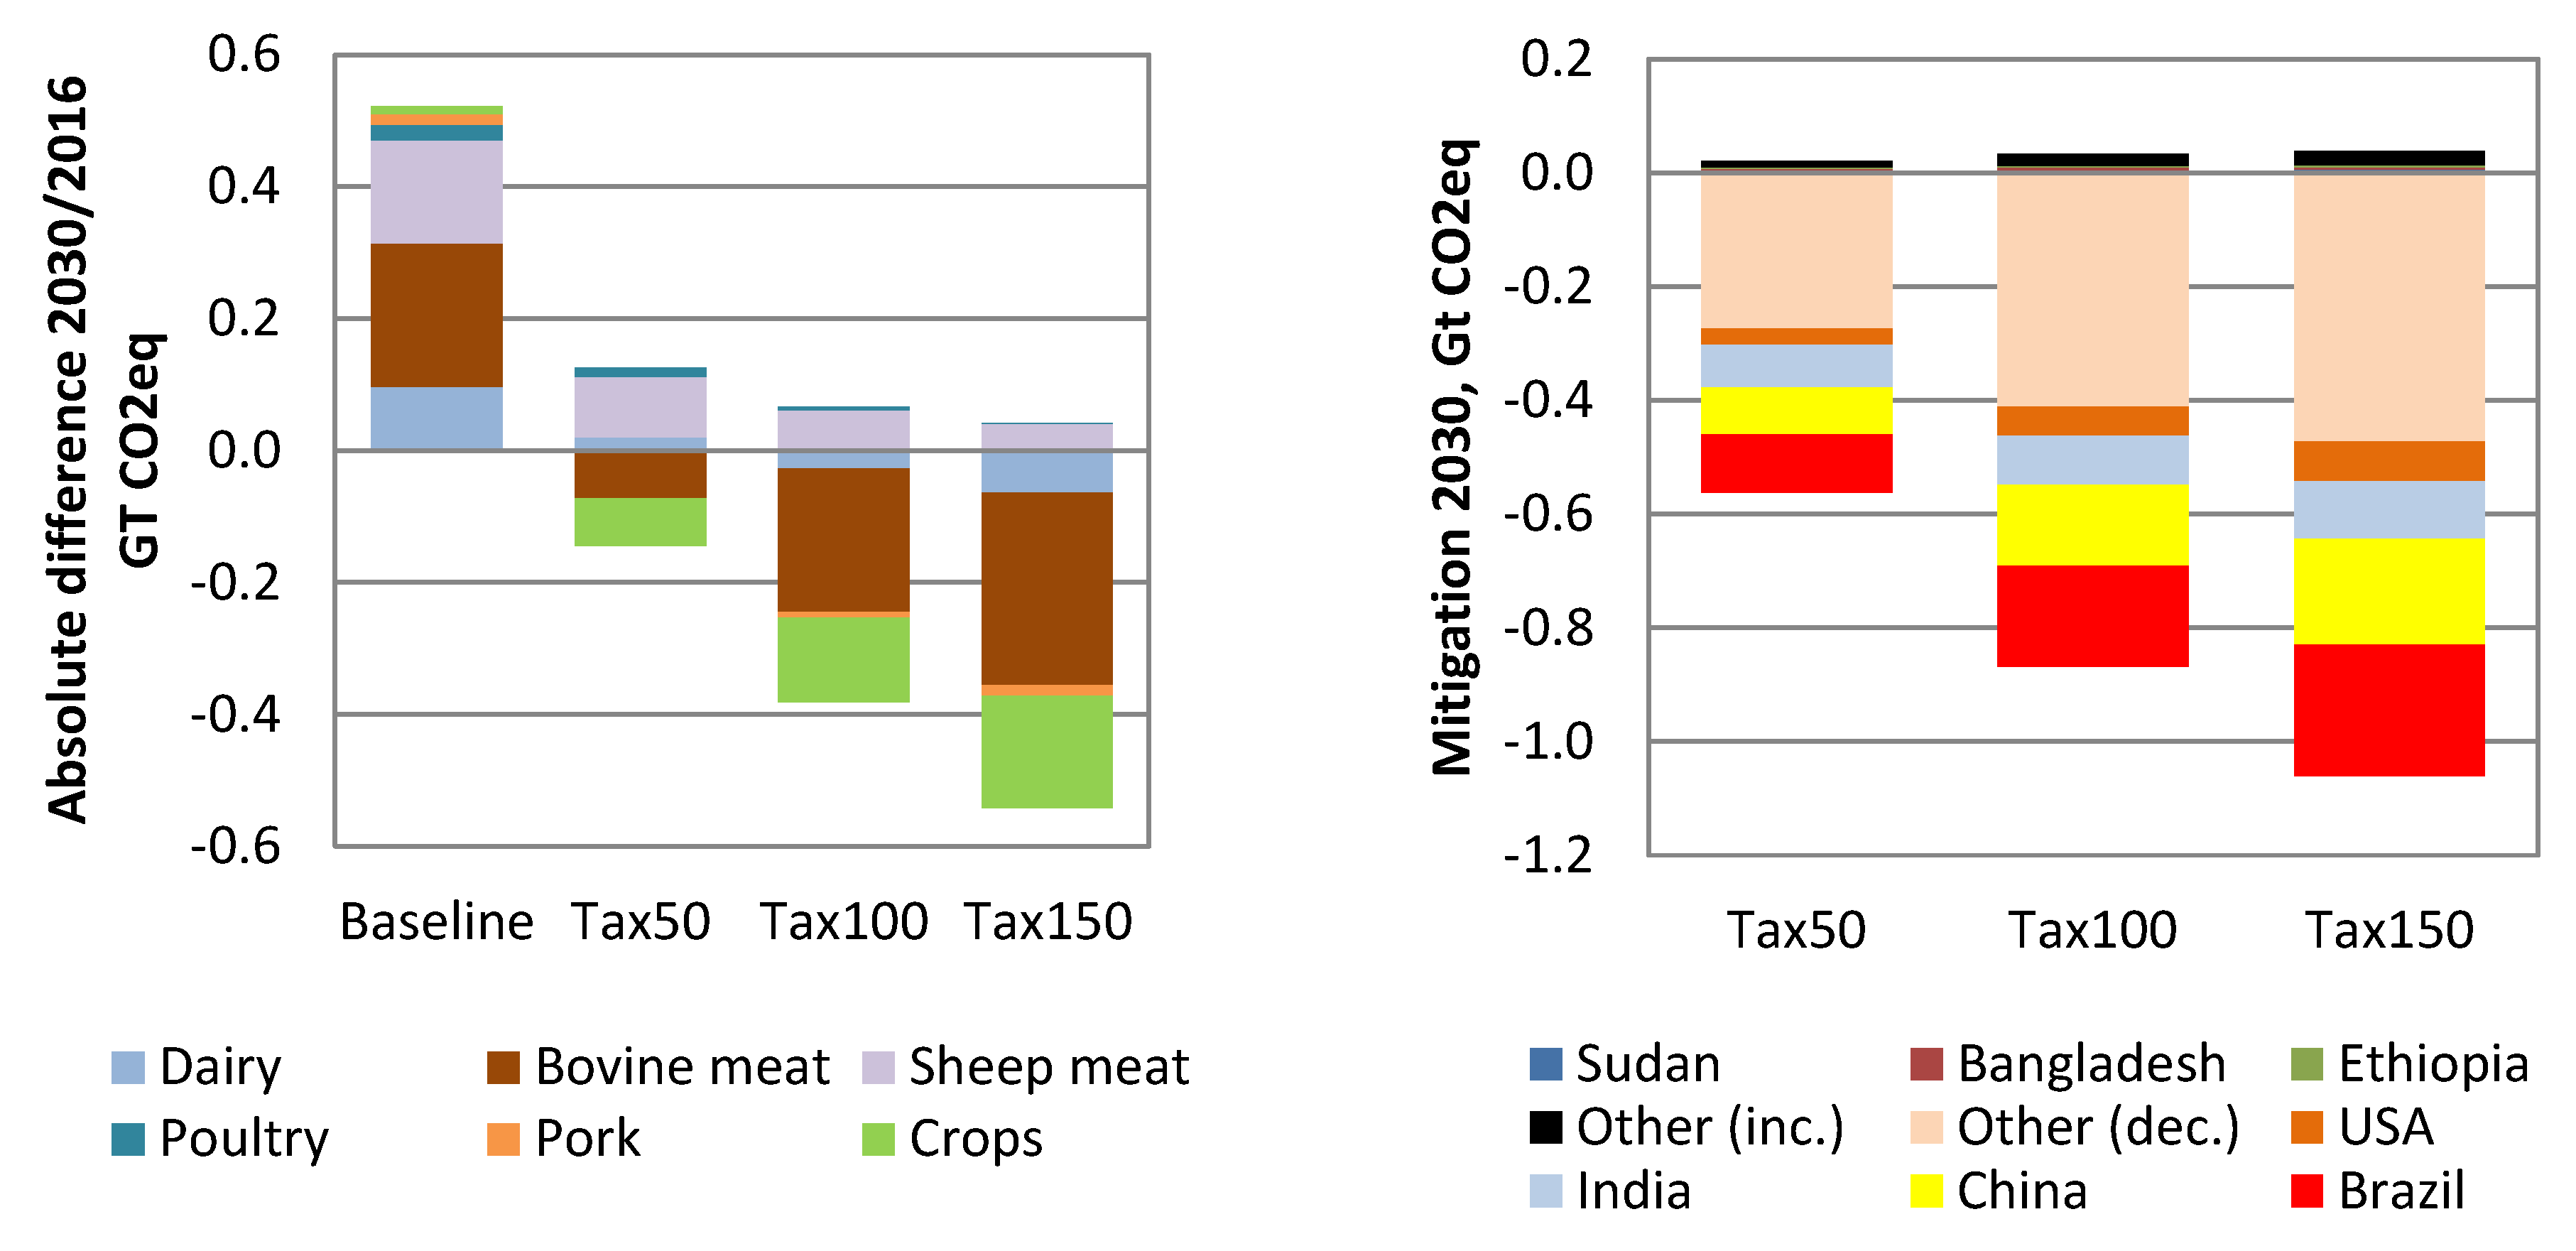
Looking closer at commodity and country level results, the impact of the carbon taxes are, not surprisingly, most pronounced in the livestock sector. Over the baseline period, agricultural sector emissions increase by 0.52 GtCO2eq, with the majority stemming from increased production of dairy products and bovine and sheep meat production. The introduction of a carbon tax mainly reduces the production of bovine meat and milk production (Figure 5, left panel), reducing total emissions by 0.50 GtCO2eq in Tax150 by 2030, which represents a total reduction of 1.02 GtCO2eq (Figure 5, right panel).
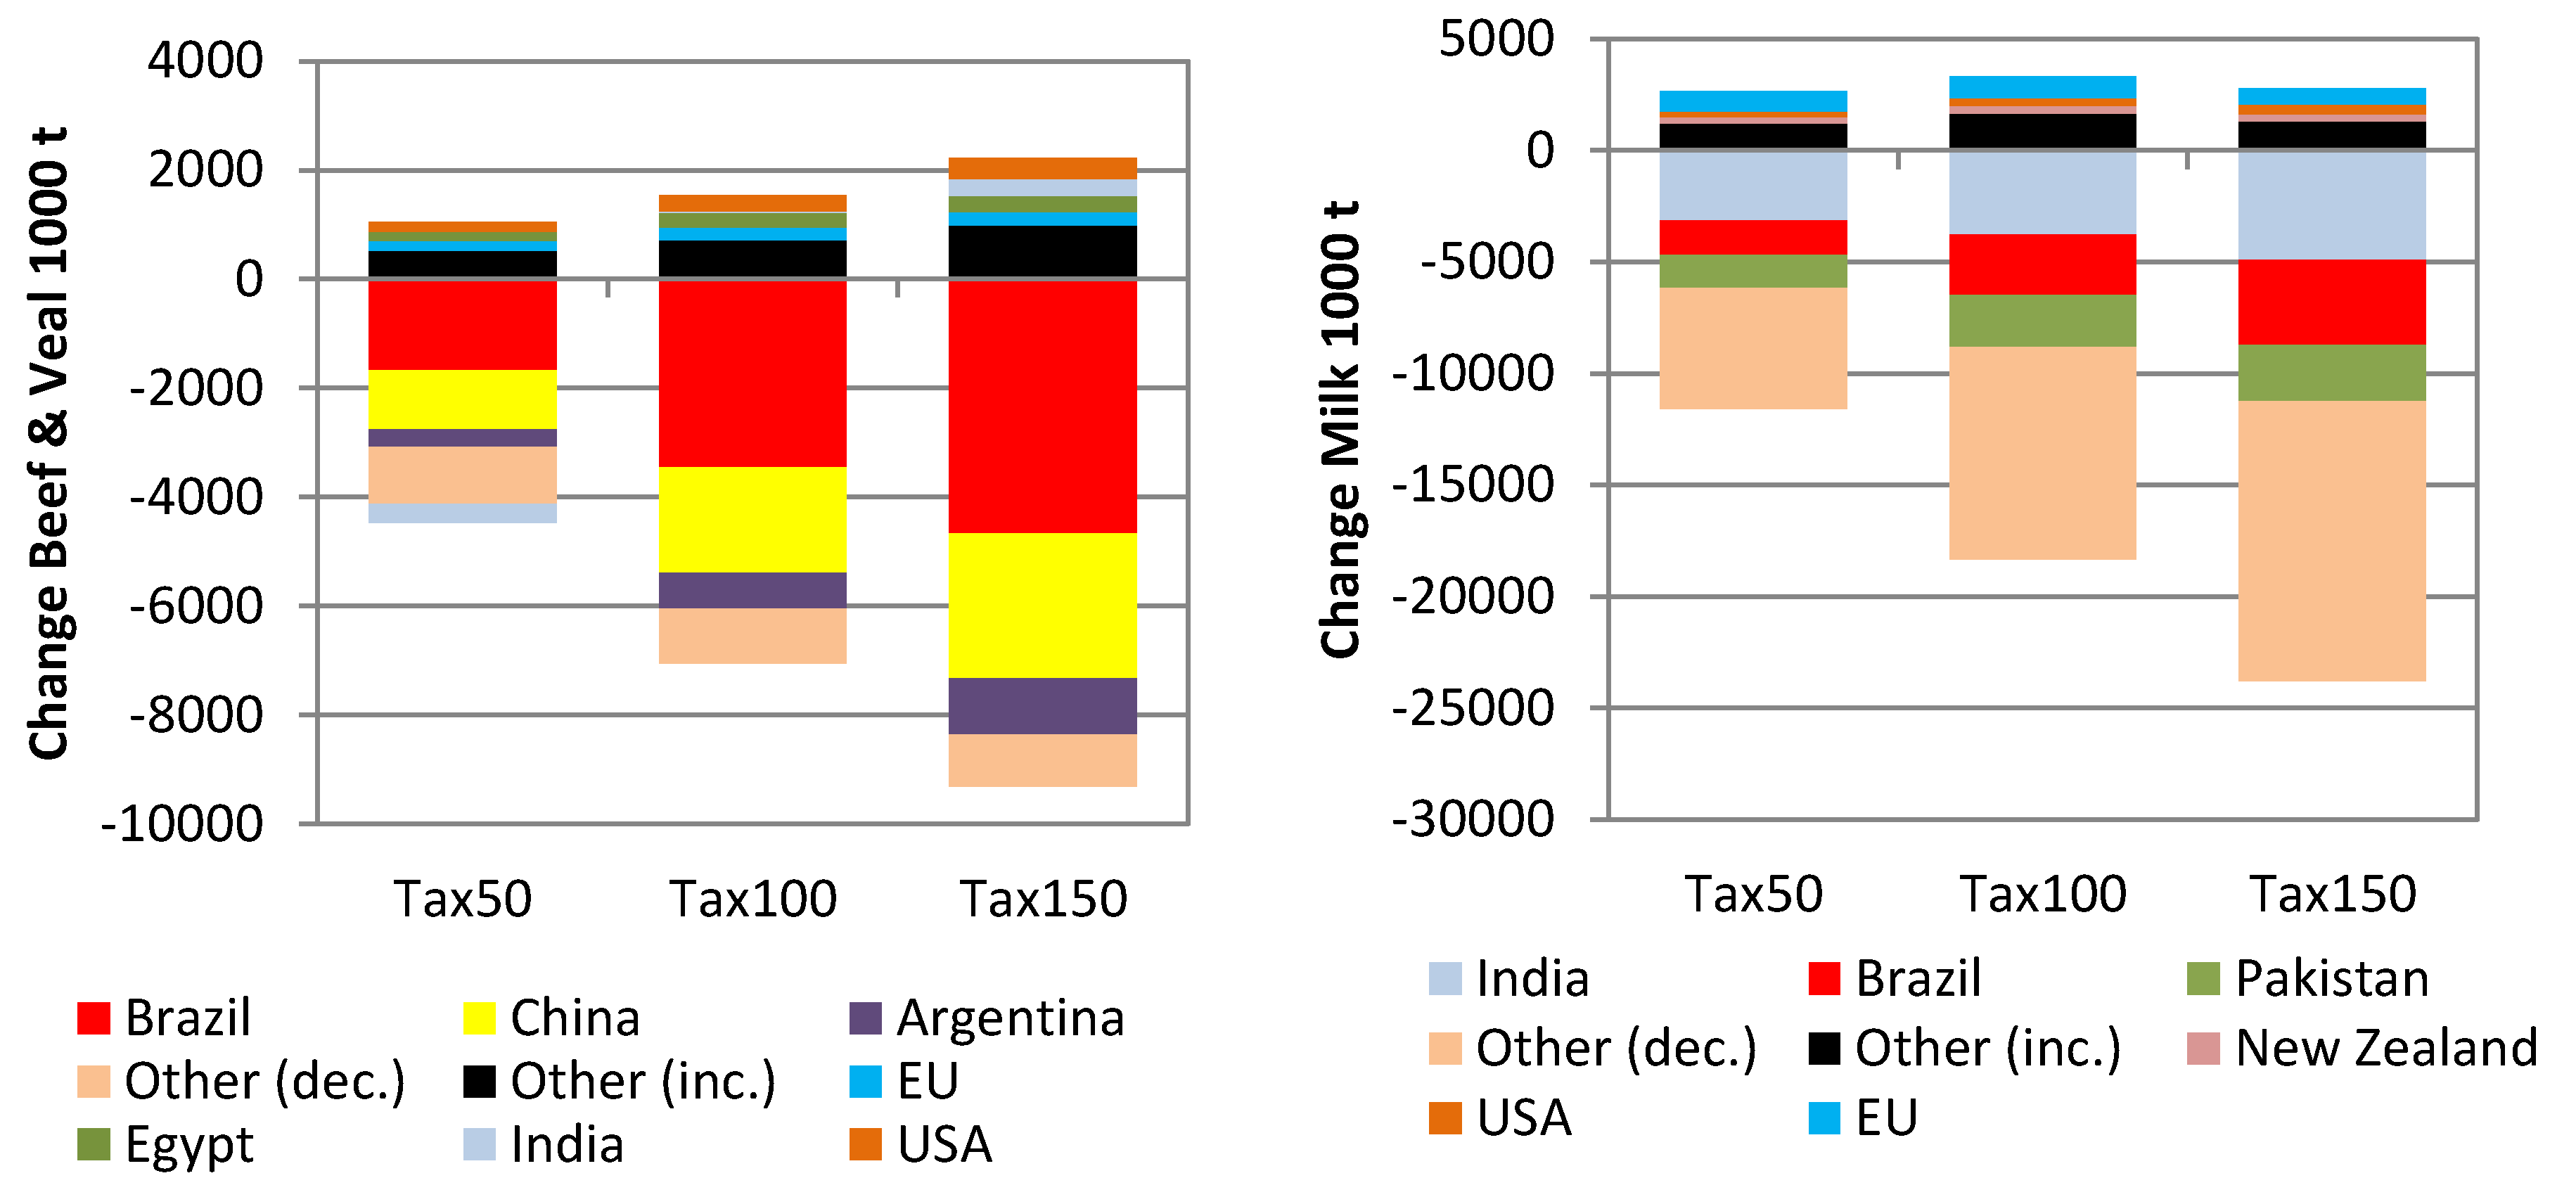
The changes in domestic production are driven by the relative impact of the carbon tax, where countries with relatively low GHG intensities (i.e., kg CO2eq/kg commodity) become more competitive on the world market and global exports increase (cheese 6% and butter 8% in Tax 150 by 2030). The carbon tax, however, also reallocates production between countries or regions. Notably, the production of milk and bovine meat increases in the United States and the European Union (Figure 6). At the same time, India increases its beef production and New Zealand sees its competitive dairy sector benefiting. At the other end, Brazil, China and Argentina reduce their beef production and India, Brazil, Pakistan have their milk production negatively affected.
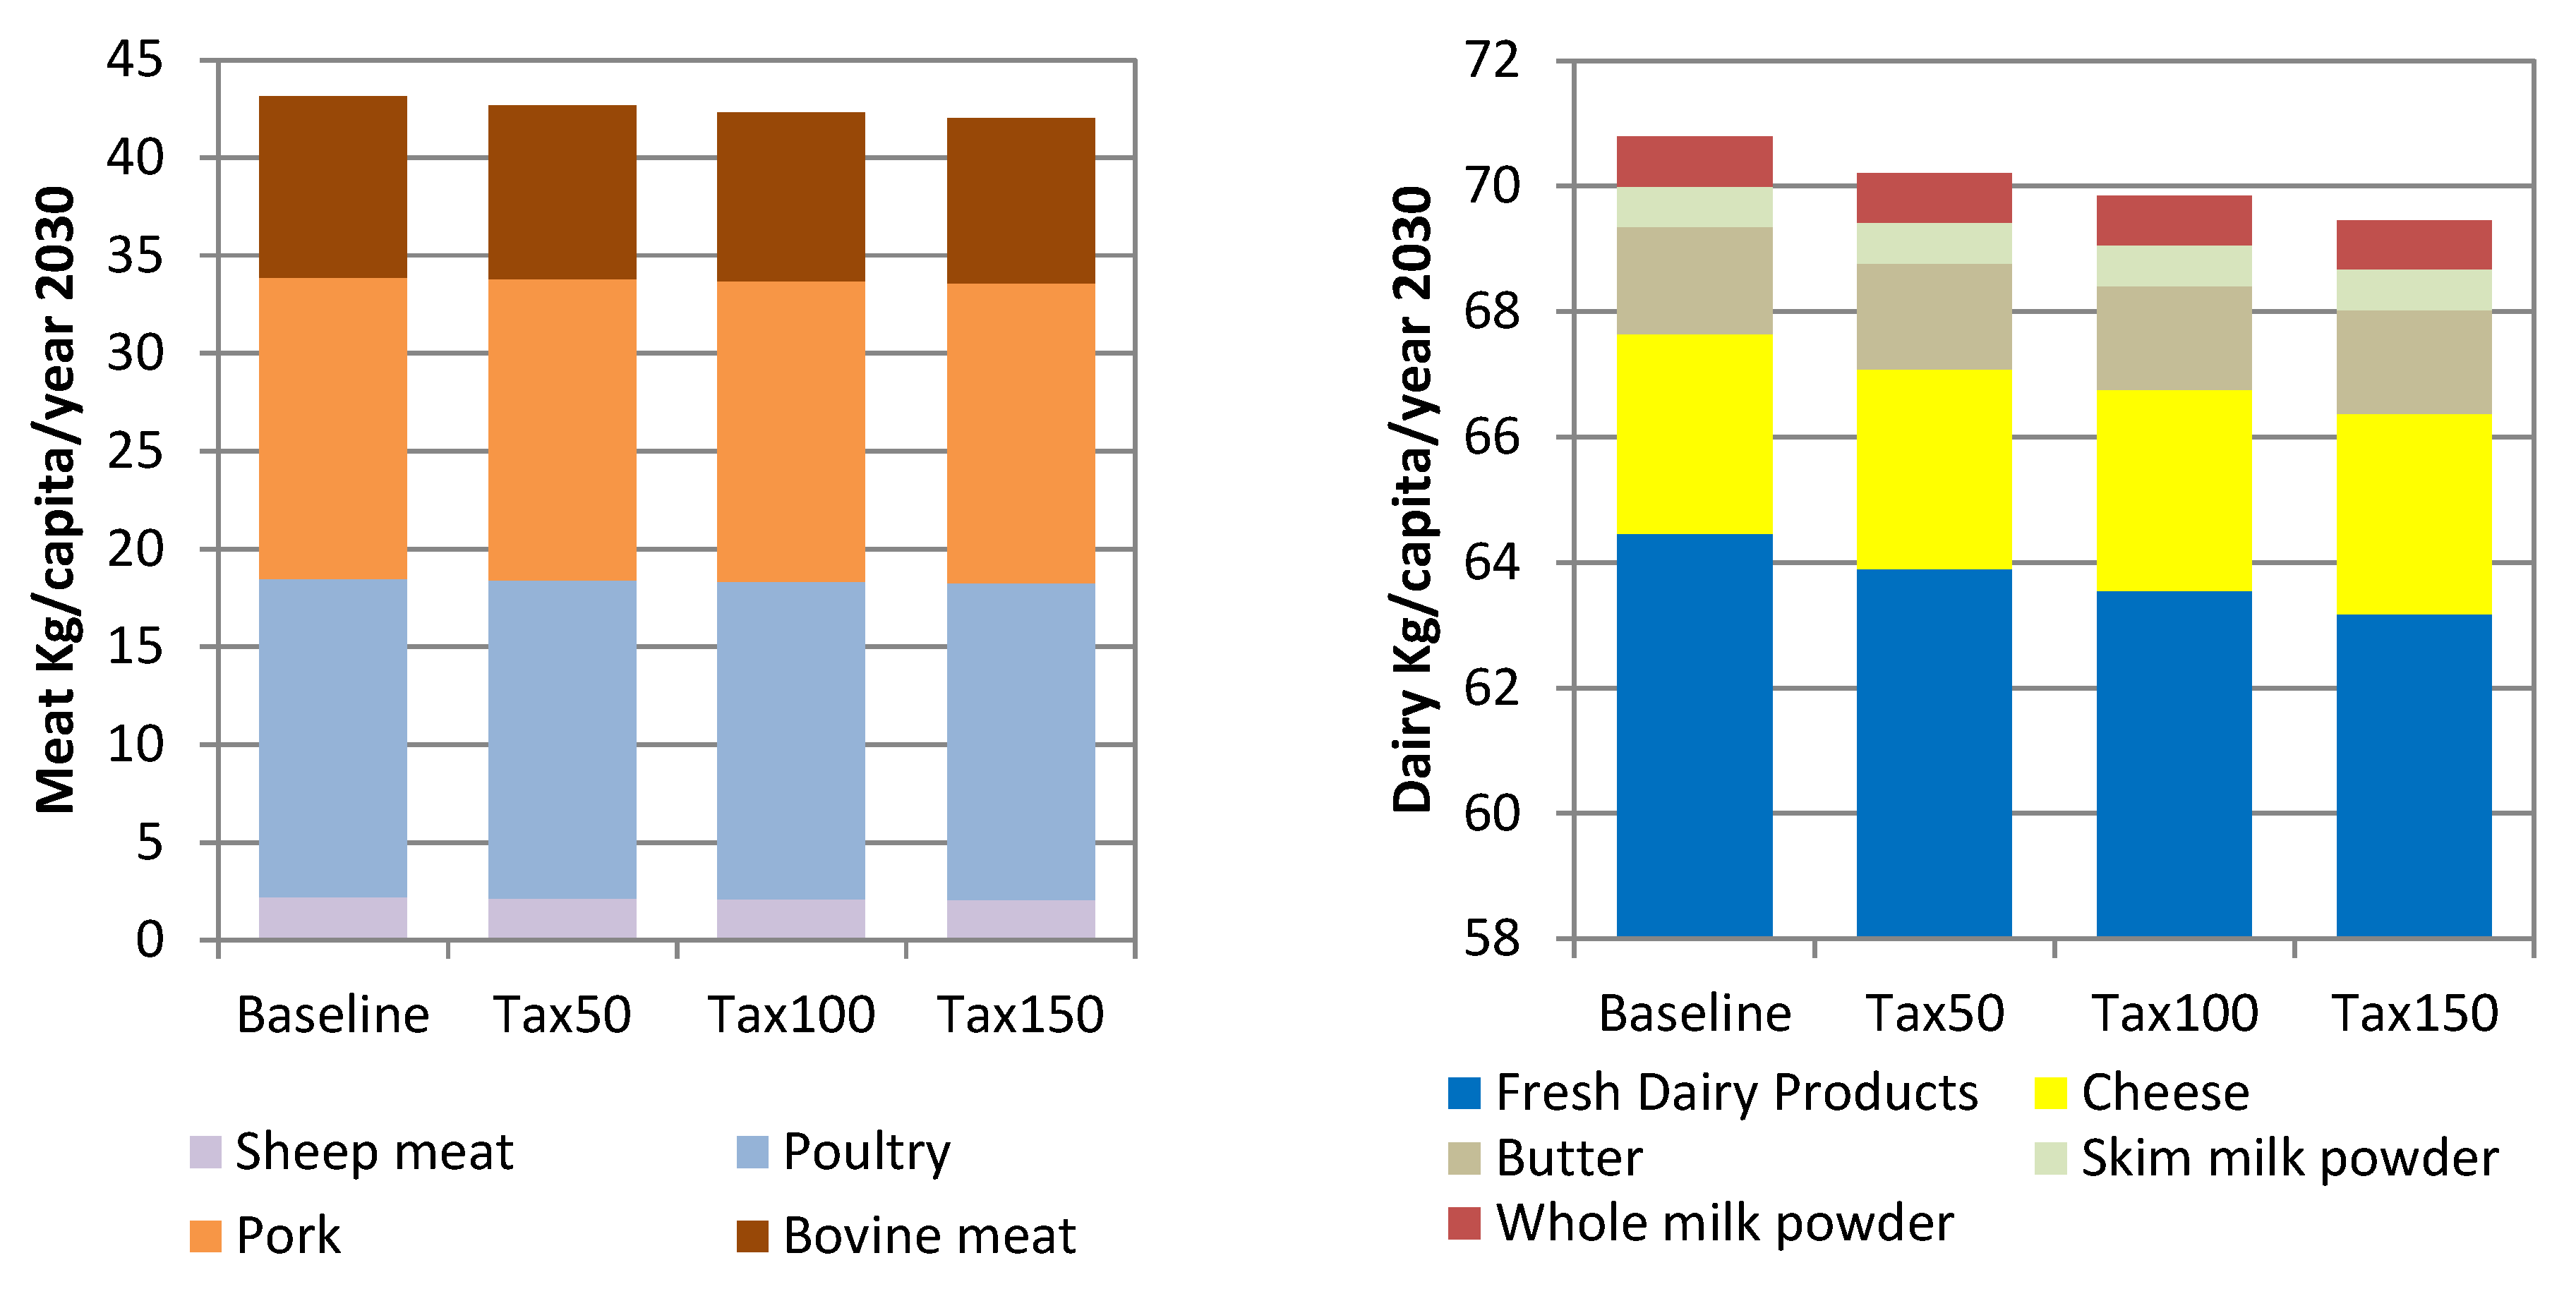
Global per capita consumption of bovine meat (−9%) butter (−3%) and fresh dairy products (−2%) declines (Figure 7) as domestic consumer prices increase. In the United States, for example, consumers reduce their average bovine meat consumption by 3%, consuming 2% more poultry and pork meat instead. Nonetheless, US bovine meat production increases by 3%, as exports expand by 44%, driven by the relatively more competitive production industry in the United States.

4.4. Impacts on Bovine Meat Production and Consumption Patterns

The impact of the carbon tax on production and consumption patterns is worth further examination, as a change in consumer diets is seen as a possibility to reduce the carbon footprint of the agricultural sector, especially if the diet favours eating less bovine meat. Switching from ruminant to non-ruminant meat consumption would reduce CO2eq emissions by 85% per kilocalorie [39]. Such a movement in consumer’s global preferences can be expected to have a large impact in countries where per capita consumption is high (e.g., the United States). In the baseline, 49% of the global bovine meat production is consumed in the United States, China, Brazil and the European Union (Table 2). By 2030, per capita consumption of bovine meat is projected to decline in these countries, with the exception of China, where per capita consumption of meat increases from 5.7 to 7.1 kg, which is still well below the projected consumption levels of the United States, Brazil and the European Union (35.8, 37.5, 14.5 kg per capita/year, respectively).
The introduction of a 150 USD/t CO2eq carbon tax and the resulting commodity price increase give an incentive to consumers to change their consumption habits to less emission-intensive products. In the United States, the farm gate price of bovine meat is projected to increase by 32%, while the consumer price increases by 10% (i.e., the initial farm gate price is roughly one-third of the consumer price). This increase in consumer prices leads to a reduction of bovine meat consumption in the United States by 3.2%, while pork and poultry meat consumption increases by 2.0%. In countries such as Brazil, where the farm gate price constitutes a larger share of the wholesale consumer price, the price signals are stronger and bovine meat consumption declines by 18%, with consumers switching their consumption habits to poultry and pork meat. This means that price signals in highly developed countries are weaker and changes in diets will perhaps have to come from changing preferences, for example increasing demand for meat substitutes driven by vegetarians and flexitarians. The introduction of the 150 USD/t CO2eq carbon tax only reduces bovine meat consumption by 9% (Table 3), so that further changes in diets could be required to meet the 2 °C scenarios of the Paris Agreement by 2050 (Figure 1).

4.5. Impacts on Land Use

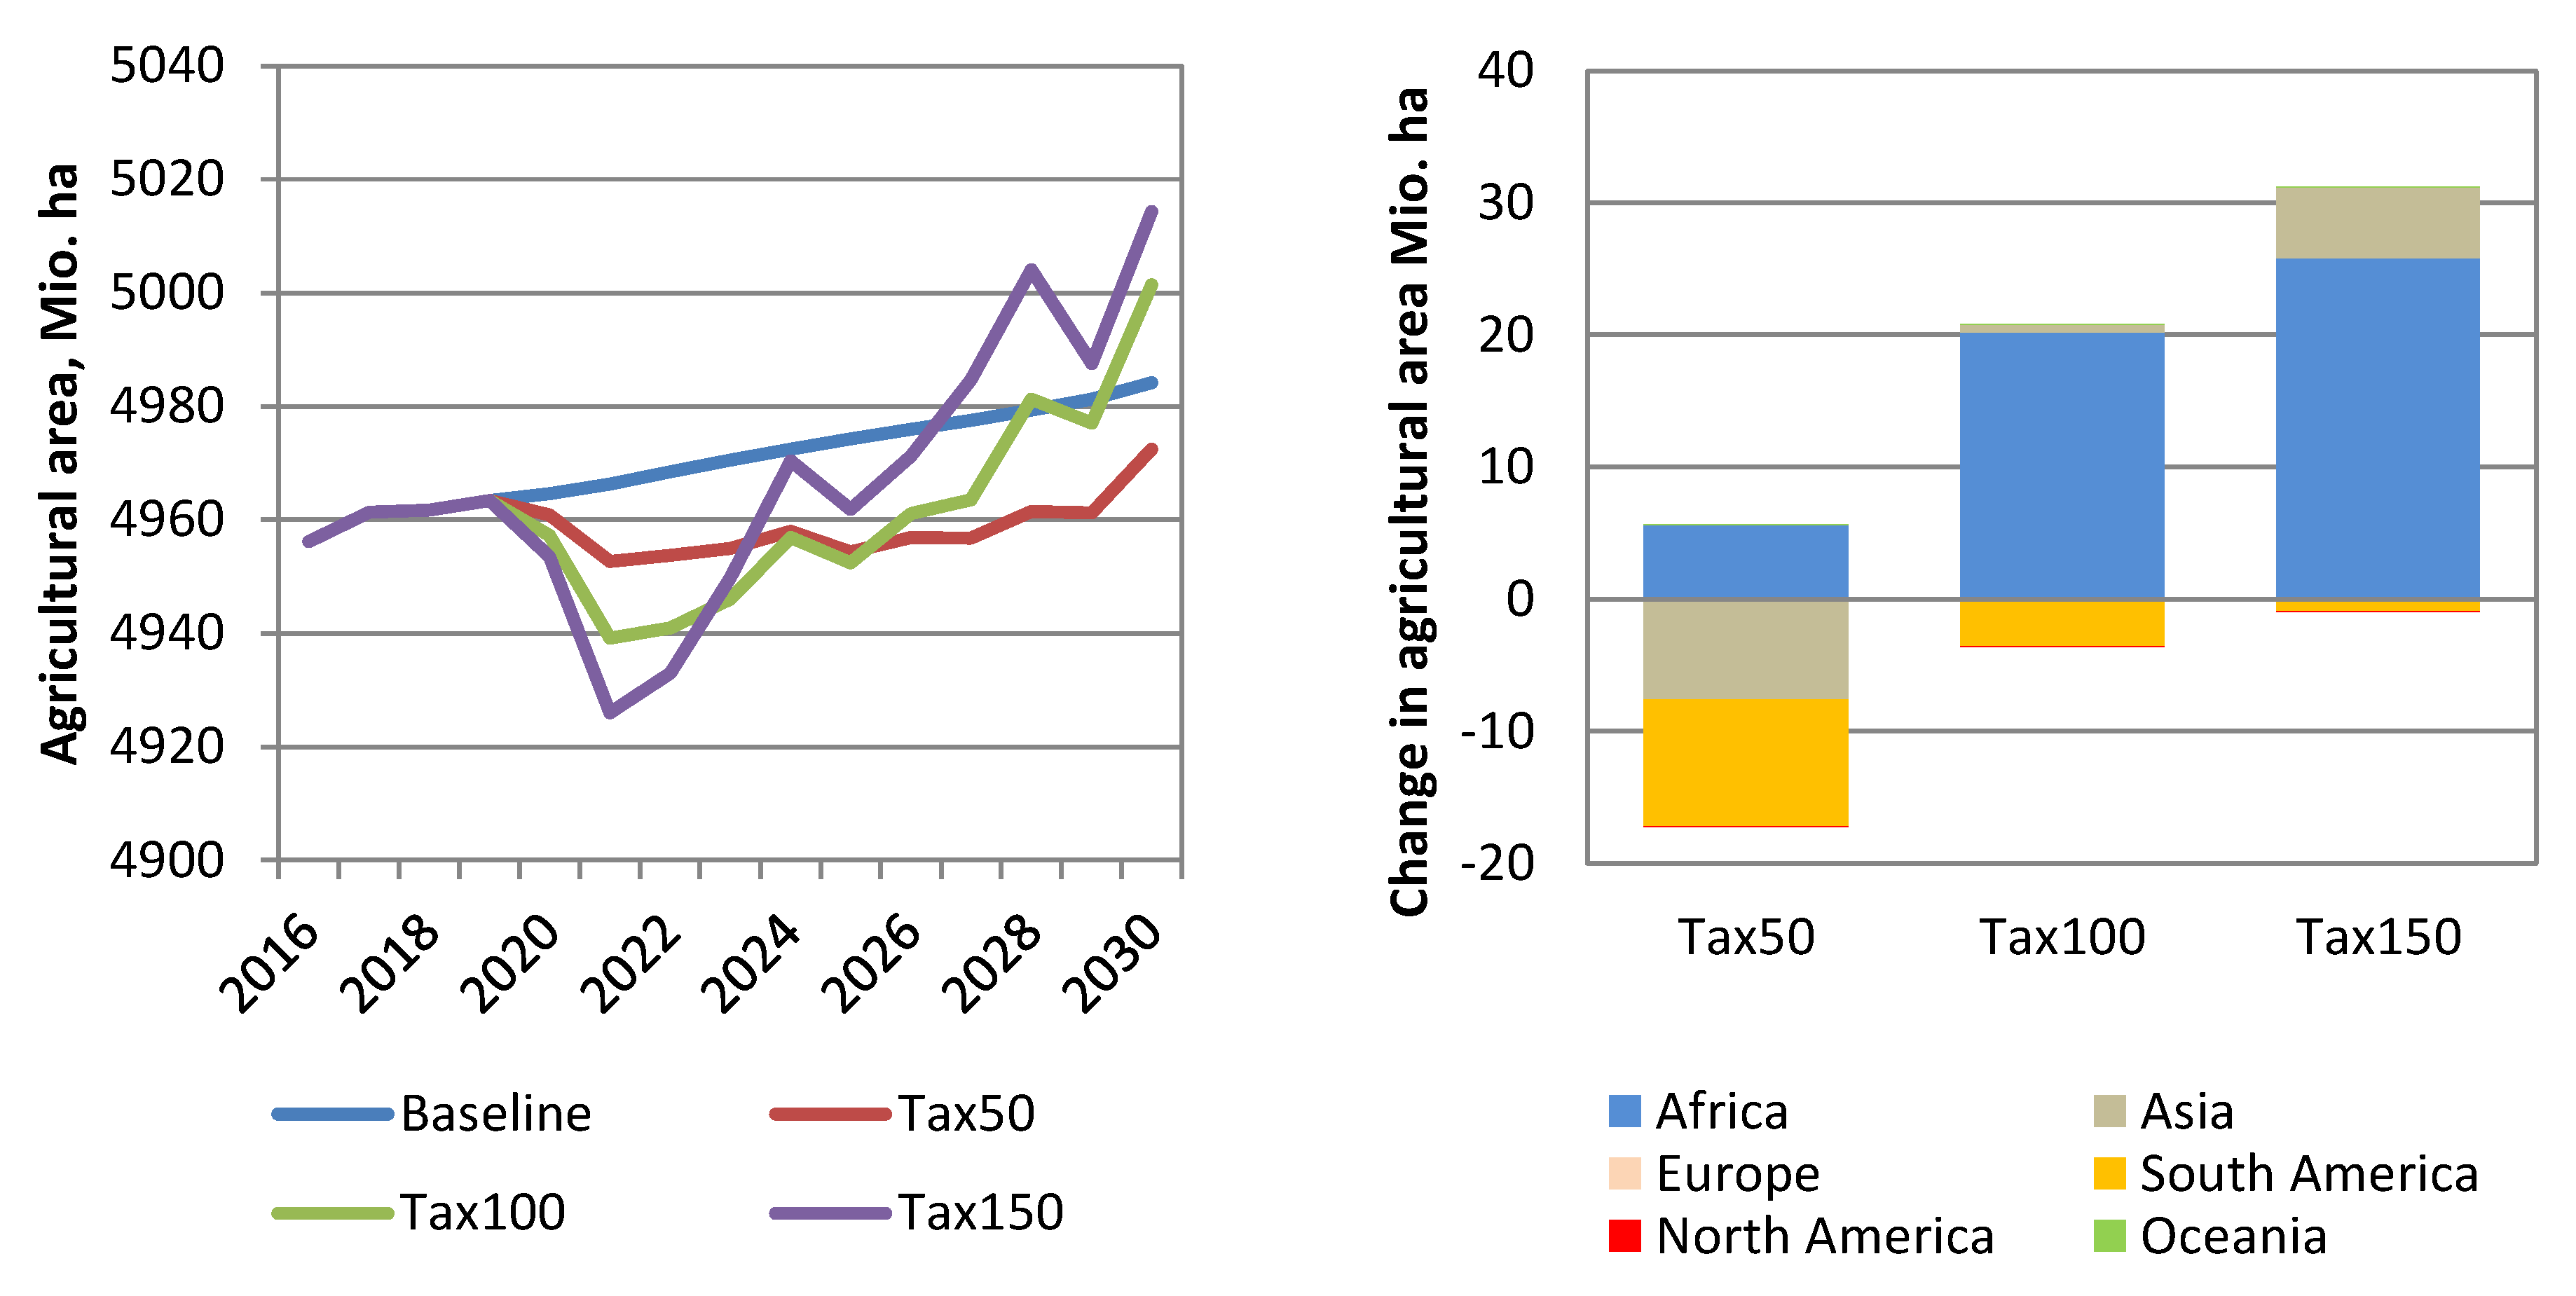
In the baseline, total utilised agricultural land (UAA) increases by 28 million hectares over the projection period, which is an average yearly increase of 0.04% (Figure 8, left panel). This does not consider any land use change from forestry and other land use into cropland or grassland, or the associated GHG emissions from net forest conversion (in the model used, LULUCF-related CO2 emissions and sinks form agricultural production are not accounted for; however, the model projects changes in land use, which already can give an indication on the related CO2 emissions). Nonetheless, scenario results suggest that imposing a carbon tax (Tax150) actually increases global UAA by an additional 30 million hectares, with pasture land expanding by 33 million hectares (i.e., 3 million ha of cropland is converted to pasture land). The main bulk of this increased pasture land is found in Africa, where bovine meat production increases by 8%.
Increasing UAA generally comprises CO2 emissions, whereas removing land from agricultural production and converting it to perennial plants, such as trees, grass or shrubs, is generally regarded as a positive contribution to climate change mitigation through carbon sequestration [40]. However, the net effect of the global increase or decrease in UAA on CO2 emissions and removals is not straightforward. For example, the reduction in UAA in the Tax150 scenario does not necessarily lead to a net decrease in global LUC-related CO2 emissions, as soil carbon emissions and removals depend on many factors, such as the management system and location [40,41,42]. Moreover, the decrease or increase in UAA is not universal in the scenarios, and while many countries reduce their agricultural land in the Tax150, the change in UAA in 2030 also comprises countries expanding their UAA, among others the African countries, namely Angola and Nigeria (Figure 8, right panel). This is not surprising, since these two countries are classified as LDCs, and therefore, are exempted from the simulated carbon tax. This makes their domestic agricultural production more competitive, which leads to production increases that also involve increasing UAA. Given the regional distribution of land moving in and out of agricultural production, it is difficult to quantify how large the net contribution of the change in land use to global GHG emissions mitigation is. Taking pasture land out of production in the outback of Australia compared to pasture land in the European Union does not imply the same reduction of GHG emissions per hectare (see the discussions and literature in Powlson et al. [40] and Oertel et al. [41]). Further work needs to be done to account for LULUCF emissions and get a clearer picture of the (potential) contribution of the agricultural, forestry and other land use sectors to GHG mitigation.

5. Conclusions

Limiting climate change to ensure global temperature increases remain 2 °C below pre-industrial levels by the end of the century requires substantial reductions of GHG emissions and the transition to a climate-friendly, low carbon economy. A transition to a lower carbon intensive economy has large implications from both regional and global perspectives. Moreover, it needs to consider not only the environmental dimension but also the economic and societal ones. Policies aiming at a decarbonized economy can have important collateral effects in terms of people’s discontentment, as, for example, recent movements in France have shown [43,44]. Furthermore, the increase of prices linked to discretionary climate change mitigation policies can have negative effects on poor economies, and could increase food insecurity [12] and migration flows [45]. These elements highlight how the necessary transition to a low carbon economy must be carefully designed. Accordingly, the implementation of GHG mitigation policies in a specific sector needs to be “fair” in the sense of not only taking into account the long-term benefits (i.e., the GHG mitigation goal and limiting climate change) but also short and medium-term costs (transition), and it should be global, such as to minimise emission leakage and effectively reduce GHG emissions [46].
Using the Paris Agreement as a framework for limiting global temperature rises, in this paper an empirical study is performed on how policies aiming at a global lower carbon intensive economy could be transmitted into agricultural markets. For the analysis, an updated version of the Aglink-Cosimo model is employed to simulate three carbon tax scenarios, specifically accounting for the macroeconomic and technological effects inherent in moving to a global low carbon economy (captured with the MAGNET and CAPRI models). Within this scenario design, homogenous taxes on agricultural non-CO2 emissions (i.e., methane and nitrous oxide) are implemented globally, with the exception of least developed countries, and increased progressively to 50 USD per tonne of CO2eq, 100 USD/t CO2eq, and 150 USD/t CO2eq, respectively, by 2030. Simulation results show that global GHG emissions from the primary agricultural sector are reduced by between 10% and 19% in 2030 compared to the baseline.
The analysis indicates that for the net mitigation of global agricultural GHG emissions, it specifically matters where (i.e., in which country or region) production is affected by climate change mitigation policies. Larger (lower) effects are expected in countries (and commodities) with relatively high (low) emissions per production unit. The results highlight the importance of GHG emission reduction policies on agricultural markets over a medium-term time horizon, as the sector is affected by both direct (i.e., through emission abatement commitments within the agricultural sector) and indirect (i.e., through changes in prices for fossil fuel intensive goods and macroeconomic variables) mitigation policies. For instance, it is shown how emission reductions compatible with the Paris Agreement can have significant effects on agricultural production, especially when looking at the regional impacts. These results also underline the importance of taking climate-change-related policies into account when producing agricultural market outlooks. In this respect, enabling Aglink-Cosimo to account for agricultural emissions and respective mitigation efforts is an essential development, especially considering that the model is used by the OECD and FAO to produce agricultural market projections that establish the benchmark for many other agricultural economic models. However, for future research the Aglink-Cosimo model needs to be further developed, for example to include the adoption of new GHG emission abatement technologies and the contribution of structural change within farming. Moreover, the model should be modified to account for CO2 emissions and removals related to land use and land use changes, to get a broader picture of the possible contribution (and resulting impacts) of the agricultural sector to a global low carbon economy. These aspects are important for the future assessment of both the full potential of the agricultural sector to contribute to achieving the goal of the Paris Agreement, as well as the related impacts to agricultural market developments and potential effects on food security.
Our results show that the technological development induced by the carbon tax can substantially help mitigate GHG emissions, and hence the need to reduce agricultural production levels globally. Technological development is especially important in some developing countries that would be relatively more affected by global carbon taxes, as they are usually characterised by higher emission intensities (kg CO2eq/kg commodity) and are less competitive on the global agricultural commodity markets. This points towards the importance of both (i) technology change and transfer, to reduce emission intensities especially in developing countries (i.e., need to modernize agricultural production systems), and (ii) more sophisticated and differentiated policy approaches for the agricultural sector, to achieve a significant contribution towards the move to a global low carbon economy.

Supplementary Materials

The following are available online at https://www.mdpi.com/2071-1050/11/8/2349/s1.

Author Contributions

Conceptualization, I.P.D. and H.J.; Methodology, I.P.D., H.J., P.L., J.H. and G.P.; Formal Analysis, H.J., T.F., I.P.D. and P.L.; Writing-Original Draft Preparation, H.J., T.F. and I.P.D.; Writing-Supplementary Material, G.P. and H.J.; Project Administration, I.P.D.

Funding

This research received no external funding.

Acknowledgments

This material is based upon work supported primarily by the Joint Research Centre of the European Commission under the specific contract 154208.X37. We would like to thank Pierre Charlebois for his contribution to improving the Aglink-Cosimo model, facilitating the analysis of the impacts of a less carbon intensive economy on the agricultural sector.

Conflicts of Interest

The authors declare no conflict of interest.

References

  1. UNFCCC. Adoption of the Paris Agreement. United Nations Framework Convention on Climate Change, FCCC/CP/2015/L.9/Rev.1. 2015. Available online: http://unfccc.int/resource/docs/2015//l09r01.pdf (accessed on 8 May 2018).
  2. Kitous, A.; Keramidas, K.; Vandyck, T.; Saveyn, B. GECO 2016—Global Energy and Climate Outlook, Road from Paris; JRC Science for Policy Reports, EUR 27952 EN; Publications Office of the European Union: Luxembourg, 2016. [Google Scholar]
  3. Kitous, A.; Keramidas, K. GECO 2016—GHG and Energy Balances; JRC Technical Reports, EUR 27976 EN; European Commission: Brussels, Belgium, 2016. [Google Scholar]
  4. Wollenberg, E.; Richards, M.; Smith, P.; Havlík, P.; Obersteiner, M.; Tubiello, F.N.; Campbell, B.M. Reducing emissions from agriculture to meet the 2 °C target. Glob. Chang. Biol. 2016, 22, 3859–3864. [Google Scholar] [CrossRef] [PubMed] [Green Version]
  5. Reisinger, A.; Havlik, P.; Riahi, K.; van Vliet, O.; Obersteiner, M.; Herrero, M. Implications of alternative metrics for global mitigation costs and greenhouse gas emissions from agriculture. Clim. Chang. 2013, 117, 677–690. [Google Scholar] [CrossRef]
  6. Gernaat, D.E.H.J.; Calvin, K.; Lucas, P.L.; Luderer, G.; Otto, S.A.C.; Rao, S.; van Vuuren, D.P. Understanding the contribution of non-carbon dioxide gases in deep mitigation scenarios. Glob. Environ. Chang. 2015, 33, 142–153. [Google Scholar] [CrossRef]
  7. Rogelj, J.; Popp, A.; Calvin, K.V.; Luderer, G.; Emmerling, J.; Gernaat, D.; Krey, V. Scenarios towards limiting global mean temperature increase below 1.5 °C. Nat. Clim. Chang. 2018, 8, 325. [Google Scholar] [CrossRef]
  8. Obersteiner, M.; Bednar, J.; Wagner, F.; Gasser, T.; Ciais, P.; Forsell, N.; Peñuelas, J. How to spend a dwindling greenhouse gas budget. Nat. Clim. Chang. 2018, 8, 7. [Google Scholar] [CrossRef]
  9. Van Vuuren, D.P.; Stehfest, E.; Gernaat, D.E.; Berg, M.; Bijl, D.L.; Boer, H.S.; Hof, A.F. Alternative pathways to the 1.5 °C target reduce the need for negative emission technologies. Nat. Clim. Chang. 2018, 8, 391. [Google Scholar] [CrossRef]
  10. Doelman, J.C.; Stehfest, E.; Tabeau, A.; van Meijl, H.; Lassaletta, L.; Gernaat, D.E.; van der Sluis, S. Exploring SSP land-use dynamics using the IMAGE model: Regional and gridded scenarios of land-use change and land-based climate change mitigation. Glob. Environ. Chang. 2018, 48, 119–135. [Google Scholar] [CrossRef]
  11. Van Meijl, H.; Havlik, P.; Lotze-Campen, H.; Stehfest, E.; Witzke, P.; Domínguez, I.P.; Humpenöder, F. Comparing impacts of climate change and mitigation on global agriculture by 2050. Environ. Res. Lett. 2018, 13, 064021. [Google Scholar] [CrossRef] [Green Version]
  12. Hasegawa, T.; Fujimori, S.; Havlík, P.; Valin, H.; Bodirsky, B.L.; Doelman, J.C.; Mason-D’Croz, D. Risk of increased food insecurity under stringent global climate change mitigation policy. Nat. Clim. Chang. 2018, 8, 699. [Google Scholar] [CrossRef]
  13. Frank, S.; Havlík, P.; Stehfest, E.; van Meijl, H.; Witzke, P.; Pérez-Domínguez, I.; Tabeau, A. Agricultural non-CO2 emission reduction potential in the context of the 1.5 °C target. Nat. Clim. Chang. 2019, 9, 66. [Google Scholar] [CrossRef]
  14. OECD-FAO. Aglink-Cosimo Model Documentation. A Partial Equilibrium Model of the World Agricultural Markets. 2015. Available online: http://www.agri-outlook.org/abouttheoutlook/Aglink-Cosimo-model-documentation-2015.pdf (accessed on 8 May 2018).
  15. Araujo Enciso, S.R.; Pérez-Domínguez, I.; Santini, F.; Helaine, S. Documentation of the European Commission’s EU Module of the Aglink-Cosimo Modelling System; JRC Science and Policy Reports; Publications Office of the European Union: Luxembourg, 2015; Available online: http://publications.jrc.ec.europa.eu/repository/bitstream/JRC92618/jrc92618%20online.pdf (accessed on 18 December 2017).
  16. OECD-FAO. OECD-FAO Agricultural Outlook 2017–2030; Organisation for Economic Cooperation and Development, Paris, and Food and Agricultural Organisation of the United Nations, OECD Publishing and FAO: Rome, Italy, 2017. [Google Scholar]
  17. European Commission. EU Agricultural Outlook. For the Agricultural Markets and Income 2017–2030; DG Agriculture and Rural Development, European Commission: Brussels, Belgium, 2017; Available online: https://ec.europa.eu/agriculture/sites/agriculture/files/markets-and-prices/medium-term-outlook/2017/2017-fullrep_en.pdf (accessed on 8 May 2018).
  18. Frank, S.; Beach, R.; Havlík, P.; Valin, H.; Herrero, M.; Mosnier, A.; Obersteiner, M. Structural change as a key component for agricultural non-CO2 mitigation efforts. Nat. Commun. 2018, 9, 1060. [Google Scholar] [CrossRef]
  19. Nekhay, O.; Fellmann, T.; Gay, S.H. A free trade agreement between Ukraine and the European Union: potential effects on agricultural markets and farmers’ revenues. Post-Communist Econ. 2012, 24, 351–363. [Google Scholar] [CrossRef]
  20. Fellmann, T.; Hélaine, S.; Nekhay, O. Harvest failures, temporary export restrictions and global food security: The example of limited grain exports from Russia, Ukraine and Kazakhstan. Food Secur. 2014, 6, 727–742. [Google Scholar] [CrossRef]
  21. Enciso, S.R.A.; Fellmann, T.; Dominguez, I.P.; Santini, F. Abolishing biofuel policies: Possible impacts on agricultural price levels, price variability and global food security. Food Policy 2014, 61, 9–26. [Google Scholar] [CrossRef]
  22. Kavallari, A.; Fellmann, T.; Gay, S.H. Shocks in economic growth = shocking effects for food security? Food Secur. 2014, 6, 567–583. [Google Scholar] [CrossRef] [Green Version]
  23. Santini, F.; Ronzon, T.; Dominguez, I.P.; Enciso, S.R.A.; Proietti, I. What if meat consumption would decrease more than expected in the high-income countries? Bio-Based Appl. Econ. 2017, 6, 37–56. [Google Scholar]
  24. Charlebois, P.; Kanadani Campos, S.; Pérez Domínguez, I.; Jensen, H. Enhancing the Brazilian Land Use Module in Aglink-Cosimo; EUR 28633 EN; European Commission: Brussels, Belgium, 2017. [Google Scholar]
  25. Thompson, W.; Dewbre, J.; Westhoff, P.; Schroeder, K.; Pieralli, S.; Pérez-Domínguez, I. Introducing Medium- and Long-Term Productivity Responses in Aglink-Cosimo; JRC Technical Reports, EUR 28560 EN; European Commission: Brussels, Belgium, 2017. [Google Scholar]
  26. IPCC. 2006 IPCC Guidelines for National Greenhouse Gas Inventories; Prepared by the National Greenhouse Gas Inventories Programme; IGES: Tokyo, Japan, 2006. [Google Scholar]
  27. Tubiello, F.N.; Salvatore, M.; Cóndor Golec, R.D.; Ferrara, A.; Rossi, S.; Biancalani, R.; Flammini, A. Agriculture, Forestry and Other Land Use Emissions by Sources and Removals by Sinks; Statistics Division, Food and Agriculture Organization: Rome, Italy, 2014.
  28. Tubiello, F.N.; Cóndor-Golec, R.D.; Salvatore, M.; Piersante, A.; Federici, S.; Ferrara, A.; Jacobs, H. Estimating Greenhouse Gas Emissions in Agriculture: A Manual to Address Data Requirements for Developing Countries; FAO: Roma, Italy, 2015. [Google Scholar]
  29. FAOSTAT. FAOSTAT Emissions Database; Food and Agriculture Organization of the United Nations (FAO): Roma, Italy, 2018; Available online: http://www.fao.org/faostat/en/#data/GT (accessed on 8 May 2018).
  30. Jansson, T.; Pérez Domínguez, I.; Weiss, F. Estimation of greenhouse gas coefficients per commodity and world region to capture emission leakage in European agriculture. Paper Presented at the 119th EAAE Seminar “Sustainability in the Food Sector”, Capri, Italy, 30 June–2 July 2010. [Google Scholar]
  31. Pérez Domínguez, I.; Fellmann, T.; Weiss, F.; Witzke, P.; Barreiro-Hurle, J.; Himics, M.; Jansson, T.; Salputra, G.; Leip, A. An Economic Assessment of GHG Mitigation Policy Options for EU Agriculture (EcAMPA 2); JRC Science for Policy Report; European Commission, Publications Office of the European Union: Luxembourg, 2016. [Google Scholar]
  32. Pérez Domínguez, I.; Fellmann, T.; Witzke, H.P.; Jansson, T.; Oudendag, D.; Gocht, A.; Verhoog, D. Agricultural GHG emissions in the EU: An Exploratory Economic Assessment of Mitigation Policy Options; JRC Scientific and Policy Reports; European Commission: Seville, Spain, 2012. [Google Scholar]
  33. Van Doorslaer, B.; Witzke, P.; Huck, I.; Weiss, F.; Fellmann, T.; Salputra, G.; Leip, A. An Economic Assessment of GHG Mitigation Policy Options for EU Agriculture (EcAMPA). JRC Science for Policy Report; European Commission, Publications Office of the European Union: Luxembourg, 2015. [Google Scholar]
  34. Lucas, P.L.; van Vuuren, D.P.; Olivier, J.G.; Den Elzen, M.G. Long-term reduction potential of non-CO2 greenhouse gases. Environ. Sci. Policy 2007, 10, 85–103. [Google Scholar] [CrossRef]
  35. Lamb, A.; Green, R.; Bateman, I.; Broadmeadow, M.; Bruce, T.; Burney, J.; Goulding, K. The potential for land sparing to offset greenhouse gas emissions from agriculture. Nat. Clim. Chang. 2016, 6, 488. [Google Scholar] [CrossRef]
  36. Aguiar, A.; Narayanan, B.; McDougall, R. An overview of the GTAP 9 data base. J. Glob. Econ. Anal. 2016, 1, 181–208. [Google Scholar] [CrossRef]
  37. Kavallari, A.; van Meijl, H.; Powell, J.; Rutten, M.; Shutes, L.; Tabeau, A. The MAGNET Model: Module Description; LEI Report 14-057; LEI Wageningen UR (University & Research Centre): Wageningen, The Netherlands, 2014. [Google Scholar]
  38. Britz, W.; Witzke, P. CAPRI Model Documentation 2014. University of Bonn. Institute for Food and Resource Economics, 2014. Available online: http://www.caprimodel.org/docs/capri_documentation.pdf (accessed on 8 May 2018).
  39. Girod, B.; van Vuuren, D.P.; Hertwich, E.G. Climate policy through changing consumption choices: Options and obstacles for reducing greenhouse gas emissions. Glob. Environ. Chang. 2014, 25, 5–15. [Google Scholar] [CrossRef]
  40. Powlson, D.S.; Whitmore, A.P.; Goulding, K.W. Soil carbon sequestration to mitigate climate change: A critical re-examination to identify the true and the false. Eur. J. Soil Sci. 2011, 62, 42–55. [Google Scholar] [CrossRef]
  41. Oertel, C.; Matschullat, J.; Zurba, K.; Zimmermann, F.; Erasmi, S. Greenhouse gas emissions from soils—A review. Chem. Der Erde-Geochem. 2016, 76, 327–352. [Google Scholar] [CrossRef] [Green Version]
  42. Thamo, T.; Pannell, D.J.; Kragt, M.E.; Robertson, M.J.; Polyakov, M. Dynamics and the economics of carbon sequestration: common oversights and their implications. Mitig. Adapt. Strateg. Glob. Chang. 2017, 22, 1095–1111. [Google Scholar] [CrossRef]
  43. Klenert, D.; Mattauch, L.; Combet, E.; Edenhofer, O.; Hepburn, C.; Rafaty, R.; Stern, N. Making carbon pricing work for citizens. Nat. Clim. Chang. 2018, 8, 669–677. [Google Scholar] [CrossRef]
  44. Nature. Wanted: A fair carbon tax. Nature Editorial. Nature 2018, 564, 161. [Google Scholar]
  45. Black, R.; Kniveton, D.; Schmidt-Verkerk, K. Migration and climate change: towards an integrated assessment of sensitivity. Environ. Plan. A 2011, 43, 431–450. [Google Scholar] [CrossRef]
  46. Domínguez, I.P.; Fellmann, T. The need for comprehensive climate change mitigation policies in European agriculture. EuroChoices 2015, 14, 11–16. [Google Scholar] [CrossRef]
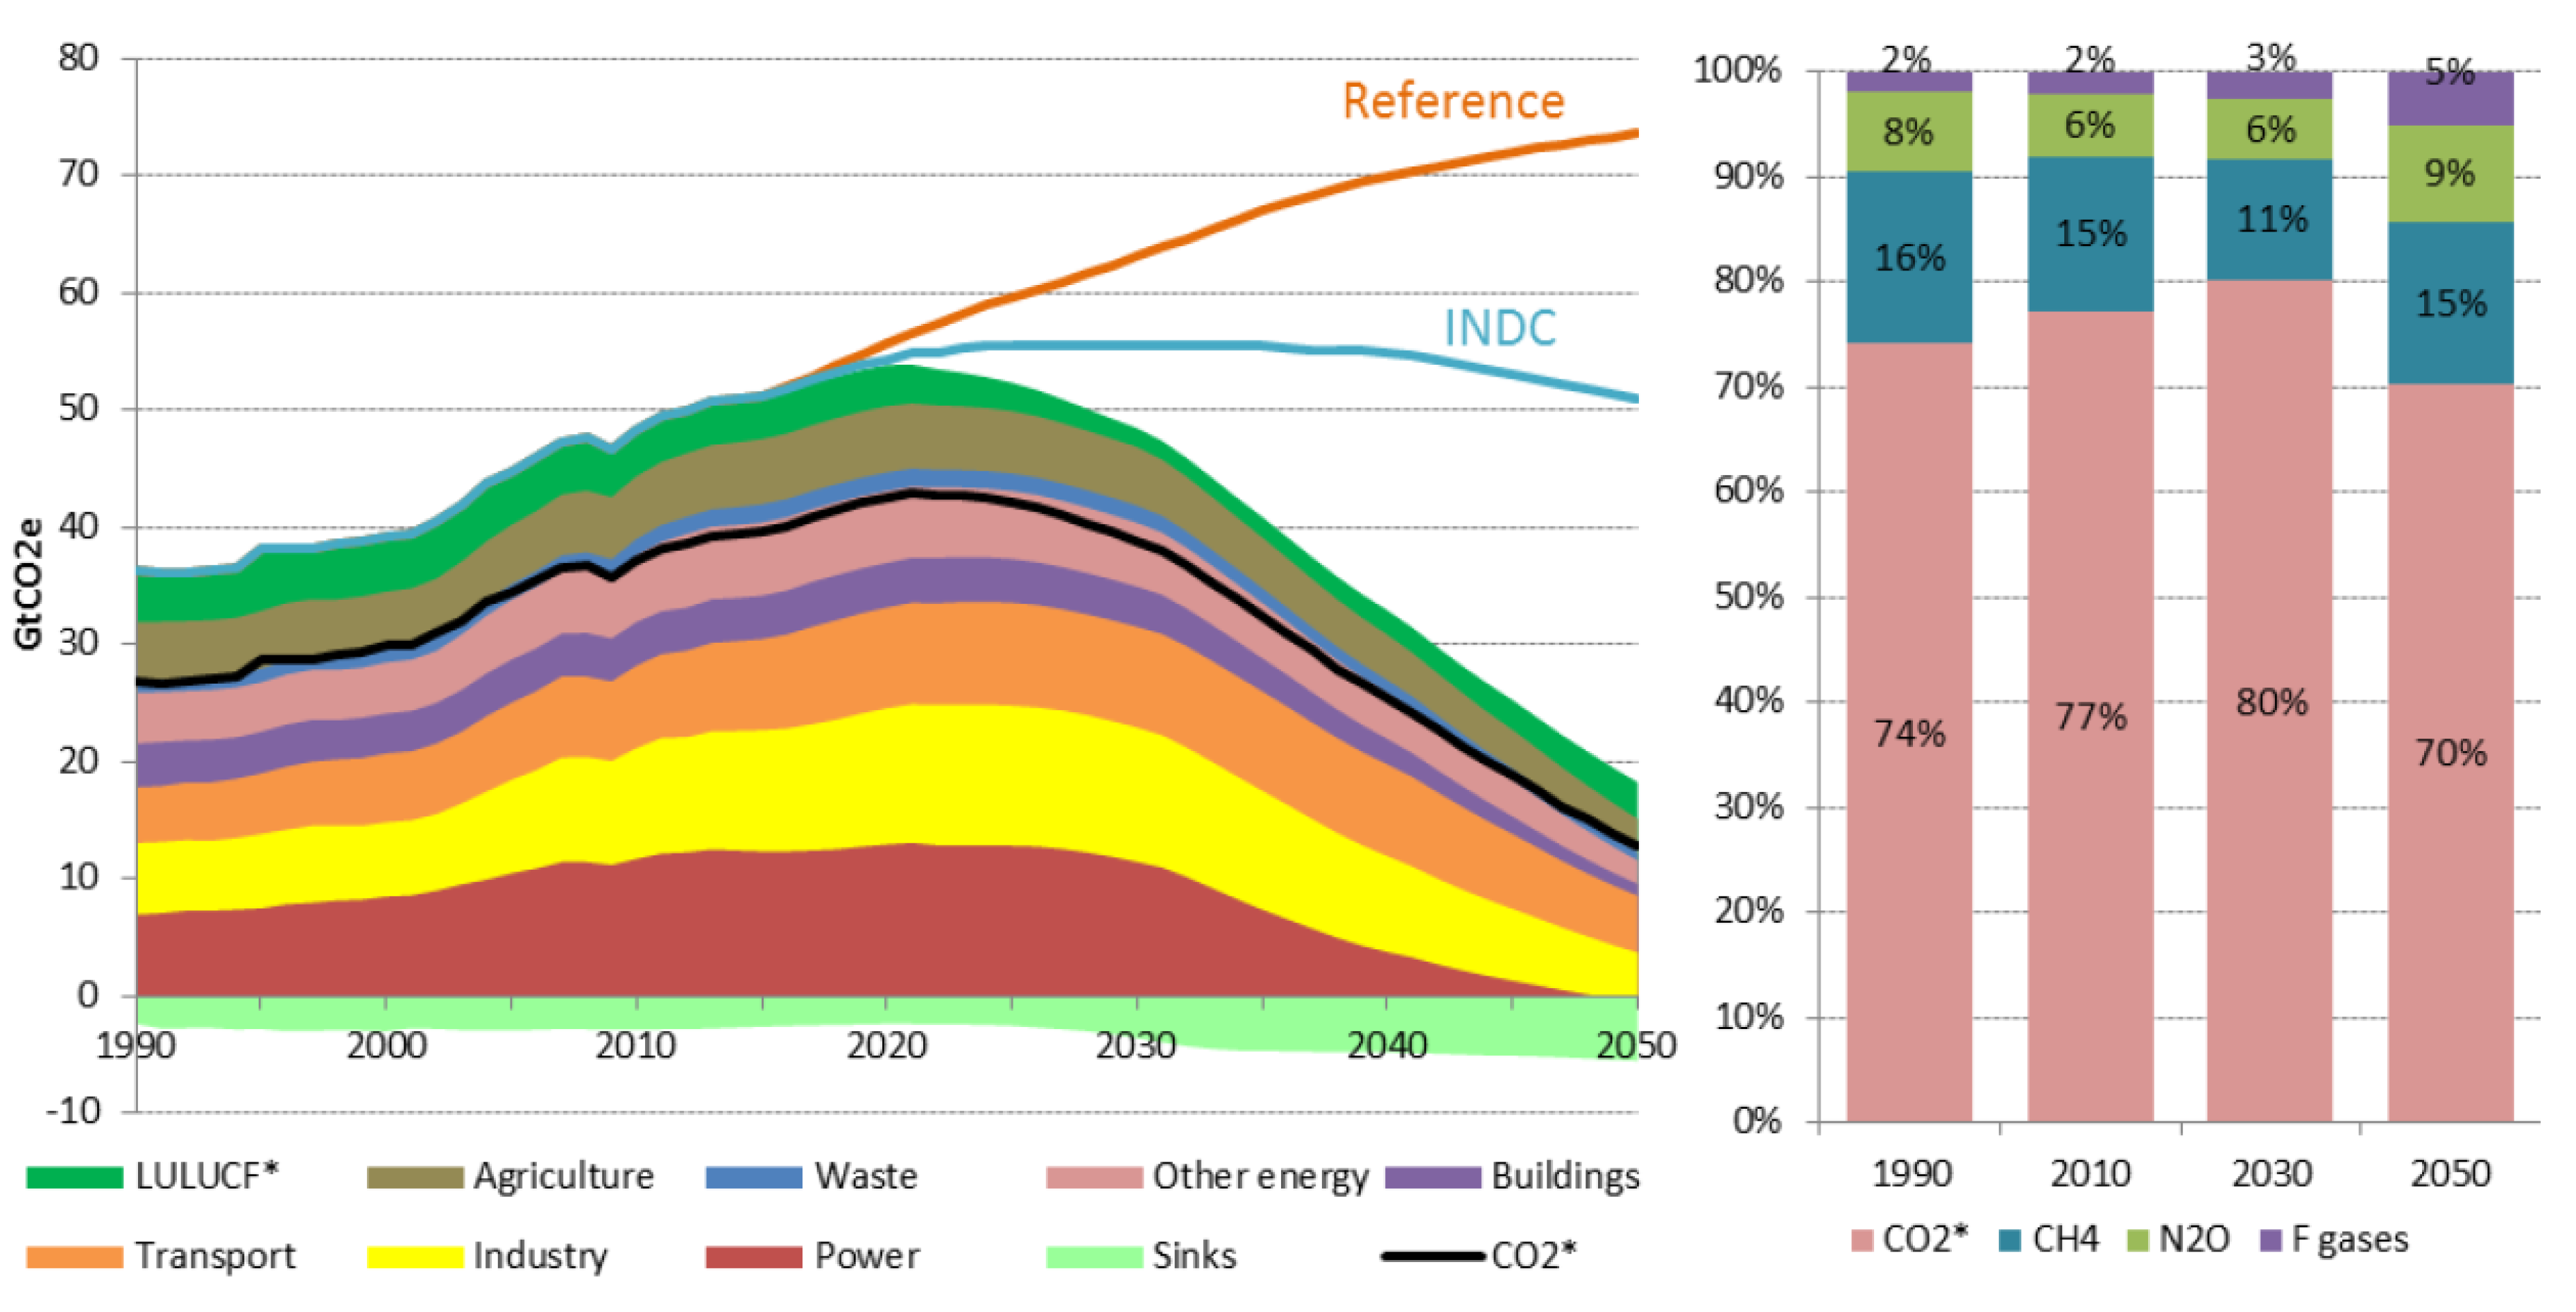
Figure 1. World GHG emissions in the 2030 reference, Intended Nationally Determined Contributions (INDCs) and 2 °C scenarios by sector (left) and by GHG (right). Source: [2]. Note: * CO2 sinks are singled out and, therefore, not included in the LULUCF and CO2 categories.
Sustainability 11 02349 g001
Figure 2. Methodological approach to estimating the effects of a low carbon economy on agriculture Note: * The change in GHG emissions is decomposed in production, structural and technology effects.
Sustainability 11 02349 g002
Figure 3. Global agricultural non-CO2 GHG emissions in the baseline and tax scenarios. Source: own elaboration, Aglink-Cosimo model.
Sustainability 11 02349 g003
Figure 4. Decomposition of mitigation effects for the period 2020–2030 for the carbon price trajectory underlying the scenario Tax150. Source: own elaboration, Aglink-Cosimo model.
Sustainability 11 02349 g004
Figure 5. Changes in agricultural non-CO2 GHG emissions by commodity (2030 compared to 2016, left panel) and by region (scenarios compared to baseline in 2030, right panel). Source: own elaboration, Aglink-Cosimo model. Note: other (dec.) refers to “other countries with decreasing emissions”, and other (inc.) refers to “other countries with increasing emissions”.
Sustainability 11 02349 g005
Figure 6. Changes in beef (left panel) and milk production (right panel) in 2030 compared to the baseline. Source: own elaboration, Aglink-Cosimo model. Note: other (dec.) refers to “other countries with decreasing emissions”, and other (inc.) refers to “other countries with increasing emissions”.
Sustainability 11 02349 g006
Figure 7. Global per capita consumption of meat (left panel) and dairy (right panel) in 2030. Source: own elaboration, Aglink-Cosimo model.
Sustainability 11 02349 g007
Figure 8. Development in global utilised agricultural area 2016–2030 (left panel) and its regional change in the scenarios compared to the baseline in 2030 (right panel). Source: own elaboration, Aglink-Cosimo model.
Sustainability 11 02349 g008
Table 1. Decomposition of mitigation effects in 2030 for selected countries, Scenario Tax150.
%-Share of Mitigation from Changes in
Mitigation (Gigatonnes of Carbon Dioxide Equivalents)Production LevelsTechnical OptionsStructural Adjustments
Brazil0.230263639
China0.185106623
United States0.06937225
Pakistan0.05415778
European Union0.053−2984
Indonesia0.0518848
Least Developed Countries−0.035 76
Source: own elaboration, Aglink-Cosimo model. Note: a negative value implies an increase in emissions.
Table 2. Bovine meat consumption, production, imports and exports, 2030 baseline.
ConsumptionProductionExportsImports
Relative share in global (%)
United States16.215.611.314.9
China12.711.40.38.7
Brazil10.914.320.40.4
European Union9.49.42.52.3
Australia1.13.917.30.1
India1.44.115.80.0
Vietnam2.00.50.09.9
Total53.859.167.736.3
Total global (1000 t)
World78623787471316713032
Source: own elaboration, Aglink-Cosimo model.
Table 3. Bovine meat production in 2030.
BaseTax50Tax100Tax150
1000 t% change compared to base
Africa7956468
China8939−12−22−30
Asia9813-4−12
Brazil11,211−15−31−42
Latin America9961−7−9−11
European Union7410233
Europa2804−4−21
North America13,768123
Oceania3641−2−4−6
World78,747−4−7−9
Source: own elaboration, Aglink-Cosimo model. Note: Asia: excluding China; Europe: excluding the European Union; Latin America: Middle and South America (excluding Brazil); North America: United States and Canada.