1. Introduction
The subject of the paper is the quantification of corporate value creation in relation to the level of the financial security of corporate functioning—the balancing and assessment of the effects of value creation and financial security sustainable management.
The measurement (quantification) is carried out in the context of a company’s financial performance: (1) its development, measured by two value creation processes—(a) for shareholders (internal value created), and (b) value added transferred to an economic system (external value created), which is close to the understanding of stakeholder value; and (2) financial security of going concern, assessed from the perspective of the threat of business failure.
The adoption of the financial perspective to assess the balanced effects of value creation and financial security of a going concern as the result of applying sustainable management is epistemologically justified. The article regards the achievement of a company’s financial goals as the foundation of its existence. Benefits resulting from sustainable development and management are defined in various ways, but their key financial effects are the same—margin improvement, or revenue increase. These lead to gaining competitive advantage, and, consequently, to premium profits and sustainable value creation. It implies that the financial measures of creating this value provide a financial justification for adopting a sustainable development strategy and its implementation in the form of sustainable management.
The study analyses manufacturing enterprises in Poland—the entire population included in public statistics (being non-financial companies with more than 9 employees, included in statistical reporting, classified as a production activity, section C—Manufacturing. As at the end of the first half of 2018, this was 13,006 entities). The major empirical objective of the study is a comparative assessment of the two categories in manufacturing enterprises in 2007–2018, including:
measurement and assessment of value creation and the degree of financial security,
identification of the characteristics of the analysed population of companies, the classification of companies and a comparative analysis of profiles.
The assessment of the degree of threat is based on the multifaceted logit model, which reflects the likelihood of maintaining financial security (FSD) for a period of one year. The value creation mechanism is quantified using value drivers constituting MVM—the multifaceted value measure (the range of value measures is taken from the available data in public statistics).
The ordering and classification are based on the ranking and the variation measure, as well as normative patterns (also for the purpose of assessing the profiles of the analysed structures).
The following hypotheses will be investigated:
main hypothesis:Hypothesis 0. there is a directly proportional relationship between the effects of the value creation process and the ensuring of financial security in manufacturing enterprises—the confirmation of the principle of sustainable management,
partial hypotheses:Hypothesis 1. The development of manufacturing enterprises, assessed on the basis of value creation, is marked by recurring cycles which are consistent with the factors which affect them,
Hypothesis 2. The value accruing to the owners is the main determinant of value creation, accompanied by an increased transmission of value to an economic system,
Hypothesis 3. Changes in financial security occur in recurring cycles, and are contrary to the level of its variation,
Hypothesis 4. The distribution of financial security determinants changes over time, with the lowest impact of asset productivity (capital circulation),
Hypothesis 5. The compatibility of the profile patterns of manufacturing enterprises’ microstructures in the context of value creation and financial security is not strongly opposed to their considerable diversity.
The results of the verification of the above hypotheses related to the research objectives are presented in the concluding remarks. They also point to the limitations of the conducted research, as well as to the trends of further studies and their implications for corporate management.
The use of the financial context as the sole criterion for assessing the balanced effects of value creation and financial security of going concern as the result of applying sustainable management is caused by several factors.
First, it results from the adopted epistemological approach—a company exists to obtain a financial effect (see: above remarks and detailed comments in “Literature Review”). The effects of a company’s development can have various forms, being reflected in meeting stakeholders’ expectations. In this context, shareholders and their financial objective—increasing their invested capital—are of key significance. Shareholder value also implies value created for other stakeholders. It corresponds to the concept of “illuminated” value-based management (VBM), being a basis for the commonly accepted corporate value theory developed by A. Rappaport.
Secondly, the effects of a company’s development are assessed in this article on the basis of multifaceted value measure (MVM). This measure combines two processes—internal value creating (for shareholders, a microeconomic approach), and external value creating (a macroeconomic approach). The latter is value added transferred to an economic system—it creates value added (the main component of GDP), and is close to the concept of value for a company’s broadly understood stakeholders (environment, society). The combination of the measurement of shareholder value and stakeholders value corresponds to the concept of sustainable value creation.
Thirdly, the assessment of the effects of manufacturing enterprises’ development comprises the measurement of the financial security of going concern. This measurement, based on a prediction (logit) model, can be exclusively carried out for a company’s financial dimensions of its financial condition. To ensure the comparability of the measurement of the financial security of going concern and the measurement of value creation (the balancing of their effects), this value should also refer to the financial dimensions of a company’s development effects and corporate value creation.
Fourthly, the presented research comprises an entire population of manufacturing enterprises in Poland (13,006 entities, unique in character), and is based on public statistics data bases. The data refers exclusively to the characteristics of enterprises’ financial standing (external assessment, and statistical and econometric analysis). Undoubtedly, it implies certain limitations, but the inclusion of non-financial information is only possible in the case of individual research (internal assessment, qualitative analysis), which implies a small sample of enterprises and difficulties in ensuring a representative sample.
The results of this research and their interpretation constitute part of an extensive study of the population of institutional sector enterprises in Poland, and is a component of a series of publications.
2. Literature Review
The essence of a company is described by the principles which govern its activities—the ability to generate profit, its functioning in the conditions of risk, and entrepreneurship [
1]. The characteristics of a company’s activities, being its targets, include innovativeness, effectiveness, development and value creation. In the process of achieving these objectives, a company is subject to the influence of the environment and the internal processes which it consciously creates, i.e., how it manages them [
2].
The idea of the purposefulness of a company’s activities and the definition of corporate objectives cause much controversy [
3]. Undoubtedly, a company’s objectives determine development trends, affect the planning process, act as motivating factors, and constitute a basis for corporate functioning, but they do not always create a coherent system [
4]. The most general objectives are a company’s survival and development. The former is a prerequisite to achieving other objectives, while the latter constitutes its essence.
A company’s survival and related threats, together with the company’s development—its measurement and assessment—represent the major focus of the paper. This research area focuses on two key issues: value creation (internal and external), and the financial security of going concern, which are discussed from the perspective of balancing their effects. Assessments refer solely to the meeting of balance requirements in their financial dimensions, but they certainly relate to a broader context comprising sustainable development (SD), sustainable management (SM), corporate social responsibility (CSR) and sustainable value creation (SVC).
2.1. Development, Effectiveness, Value
Development is a process of structural change, and it cannot be implemented in a short period of time [
5]. New phenomena and rules arise which have not occurred before. Development is a process which takes place over the course of time. It comprises consistently ordered phases and stages which constitute a company’s life cycle [
6].
It is justified to say that growth enables companies to better adapt to the environment and its development [
7], and that there is a feedback between these categories. However, treating development as a qualitative category and growth as a quantitative phenomenon is characteristic of a traditional approach.
Effectiveness is a quantitative characteristic of a company’s development [
8]. It best reflects the results of the rational manner of doing business, while entrepreneurship is the way in which effectiveness is achieved [
9]. Effectiveness is the factor that determines the essence of a company’s activities, its functioning and development [
10].
The effects of a company’s development can assume various forms, being achieved through meeting stakeholders’ expectations. Such expectations mainly include the interests of shareholders and their financial goal—accumulating the value of invested capital [
11]. Value created for company owners indicates value for other stakeholders [
12]. Value created at a microeconomic level is transferred to a macroeconomic level—creating value added (the main component of GDP) [
13].
Classical economics defines various sources, factors and types of value. Currently, value is understood in terms of outlays and effects, and it is no longer linked to real capital in favour of abstract capital. Consequently, a company’s value is linked to its ability to accumulate invested capital [
14] (pp. 293–308), also searching for a link with the business model [
15].
A company’s development and value creation are measured by several indicators [
16,
17,
18]. An important measure is a quantitative analysis of their mutual relationships and value determinants. It provides insights into the value creation mechanism.
2.2. Sustainable Development
Global, regional and local changes, affecting the existence and development of enterprises, have become an inspiration for developing the concept of a learning organization [
19] and a new research area—sustainable science [
20]. Sustainability is a company’s ability to carry out its activities based on continuous learning, revitalization, reconstruction and reorientation, and, in the first place, adaptation and development [
21].
There are several definitions of sustainable development, focusing on various aspects of this term [
22]. Sustainable development is frequently confused with the concept of ecodevelopment—ecology is only one of its aspects. Sustainability is based on economic, social, environmental and political factors which determine an equilibrium between costs and profits [
23]. Responsibility for maintaining a balance between sustainable development factors can be treated as a company’s “silent stakeholder” [
24].
Sustainable development expresses the idea of seeking the sources of a steady and safe market position based on a company’s responsibility to its environment [
25].
Sustainable development is characterised by three factors: sustainability—maintaining an equilibrium between company and stakeholder needs; stability—maintaining the accessibility of environmental resources; and self–support—the interdependence of economic, ecological and political factors in stimulating long-term growth [
26].
Exploration shows that the business methods (strategies) of sustainability are different. Although these methods differ, many sustainability practices touch upon the same interfaces for company action. R.J. Orsato argues that companies must make efforts in order to pursue ‘the right’ type of sustainability strategy, which proposes a contingency perspective and should pursue return-on-investment (ROI) on environmental actions [
27].
As S.L. Hart says, a few enterprises realise that environmental opportunities might actually become a major source of revenue growth—not just a source of cost savings. Thus, the strategy of eco-efficiency and social responsibility is the one to pursue as a first stage towards a sustainable company [
28]. Moreover, they also provide profits for shareholders [
29]. Going further, it is proven that innovation is a crucial element of sustainability, and vice versa—sustainability being a catalyst for innovation, the key driver of development [
30].
2.3. Sustainable Management and Corporate Social Responsibility
Sustainable development leads to the development of sustainable management [
31,
32]. This concept proves a close correlation between corporate development and stakeholder relationship management [
33].
The tool for implementing this idea is corporate social responsibility (CSR) [
34]. Presently, however, CSR is not aimed at “doing good” but is focused on creating shared value (CSV) [
35].
The CSR concept is based on agency theory—a company’s (agent’s) commitment to satisfying the needs of its allies (principal) [
36], and stakeholders theory—stakeholders’ right to intervene in company operations [
37].
The CSR concept focuses on stakeholders’ objectives. They have legitimised “interests” in a company’s process-related and substantive activities, and each of these interests has its intrinsic value [
38]. This leads to a conflict between CSR and shareholder concept. Its financial objective is shareholder value creation, which is achieved through value-based management (VBM).
However, achieving stakeholders’ objectives can have an adverse effect on corporate value creation. Hence the proposal to employ “illuminated VBM”, assuming the complementarity of stakeholder concept and VBM. According to “illuminated VBM”, shareholder value creation cannot be carried out without respecting stakeholders’ interests (which implies the absence of a conflict) [
39], [
40]. However, the assumption that care for the environment and society translates to greater corporate value is often criticised [
41]. Moreover, a company’s performance is still measured mainly in its financial dimension. Environmental and social aspects are taken into account only from the perspective of their contribution to improving financial results [
42,
43].
2.4. Sustainable Value Creation
Emphasising how sustainability creates value matches epistemological reasoning presented in this paper—a company exists to achieve a financial effect. This reinforces financial analysis as the main tool for assessing a company’s sustainable development and value creation.
The impact of sustainable management on financial results is confirmed by several research studies. However, financial results can be understood in different ways as, for example, company performance [
44], premium profits [
45], competitive advantage [
46], sustainable value added [
47], or long-term shareholder value [
48].
Benefits resulting from sustainable development can be different, but the key financial effects are the same—margin improvement or revenue increase. Sustainable development leads to competitive advantage, which, in turn, results in premium profits [
49]. These are the measures of value creation which provide a financial justification for implementing a sustainable development strategy.
S.L. Hart and M.B. Milstein are the creators of the sustainable value framework. It shows relationships between sustainable development and a company’s fundamental activities and functions understood as value drivers [
50].
Sustainable value creation is defined as a business strategy focused on solving key social problems through identifying new scaled sources of competitive advantage, which generate measurable profits and lead to social benefits—shared value [
51].
A review of the sustainability literature suggests a few key concepts and critical ways to understand sustainable value creation [
52]. The first one is systems thinking, which potentially provides the scope to integrate multiple factors: economic, social and environmental [
53,
54]. Further proposals include whole systems design [
55] and systems innovation [
56]. The implementation of these concepts is supported by appropriate sustainable business models [
57]. The new concepts for sustainable value creation form the framework for business models by considering value destroyed, value missed and value opportunities [
58].
2.5. A Company’s Crisis and Financial Threats
As already mentioned, a company’s operations are characterised by and based on the principle of its functioning in the conditions of crisis, resulting from the uncertainty of specific events and future developments. Crisis represents a severe stage of such conditions.
A company’s crisis can be understood in different ways [
59]—frequently as a breakthrough process between two stages of a company’s life cycle, which differ in terms of their quality. A company’s crisis is marked by its complexity, resulting from a combination of various factors forming a sequence of events, resulting in cause–effect processes and a distinct escalation path [
60].
A company’s exposure and vulnerability to threats is diversified, which can be described using specific models [
61], and Polish companies’ vulnerability is very high [
62]. A sudden, tangible crisis usually results from a long-lasting financial distress—a ‘smouldering’ crisis [
63].
The symptoms of a company’s crisis are caused by various factors and their combinations. The major sources of crisis result from a company’s failures in corporate functioning, which can be quantified from the perspective of a company’s financial standing [
64].
Crisis is part of the area of risk management [
65], hence the significance of the ability to predict it. This necessitates creating early warning systems (EWS) which diagnose the indications of crisis, but which should not be identified with bankruptcy prediction [
66,
67]. The quantification process is frequently based on discriminant analysis methods and logit models [
68].
The most significant characteristics of threat prediction methods include their effectiveness and reference points. Attempts aimed to depart from the idea of a business failure and its legal and narrow sense (
bankruptcy) have not been successful due to difficulties in offering a broad definition of failure referred to as
economic distress and
financial distress [
69].
2.6. Financial Threat Prediction Models
Early warning systems (EWS) make use of several tools applied in financial analyses as well as statistical methods used in predicting financial threats of going concern. The identified measures quantify early warning signals, thus becoming threat predictors. Such systems make use of three types of information: alarm signals, deviations from standards and weak signals (weakly structured) [
70].
EWS methods are usually classified on the basis of the character of the analysed factors (quantitative, qualitative and mixed methods) and the manner of formulating conclusions (logical deductive and empirical inductive methods) [
71].
The first group includes scoring models, multi-criteria models and models based on EVA (Economic Value Added), SVA (Shareholders Value Added) and MVA (Market Value Added). Research studies conducted in the Polish business environment indicate the lack of statistically significant correlation between the above measures and the risk of business failure [
72,
73].
Logical deductive methods use financial analysis in assessing the risk of business failure. Empirical inductive methods are examples of comparative analyses based on statistical and econometric methods (an analysis of the groups of threatened and non-threatened companies). Depending on the number of variables, these methods are referred to as one—or multivariable methods [
74].
The development of econometric modelling in the prediction of financial threats originates from (one–variable models) the first works of W. Rosendal and P.J. Fitzpatrick—they developed a pair-based comparative analysis (a threatened vs non-threatened entity). C.L. Merwin applied the methods of profile analysis and arithmetic mean for groups of objects, while W.H. Beaver verified the usefulness of financial ratios in threat prediction. This area of research was also undertaken by P. Weibel, who proved that an increased number of explanatory variables did not lead to significantly better results in risk assessment [
75,
76].
Currently, multi-variable models dominate, with a great contribution being made by the logit model. It allows for detecting not only a financial threat but also its probability. Multiple discriminant analysis was developed by E.I. Altman [
77]. Other well-known creators of threat prediction methods include G. Weinrich, J. Fulmer, J. Legault, J. Ko, H. Koh, Killough, K. Beermann, G. Gebhardt and E. Bleier [
78]. The creators of prediction models in Poland include E. Mączyńska, D. Appenzeller, J. Gajdka and T. Stos, B. Prusak, M. Hamrol. B. Czajka, M. Piechocki, A. Hołda and D. Wędzki [
79].
3. Methodology of Research
The subject of the research study (the first research area) is a mechanism of creating value determined by value creation processes attributable to company owners, and creating value added transferred to an economic system (value added: net financial result, compensation and social insurance, interest, income tax and quasi-fiscal charges).
The object of the study comprises 13,006 manufacturing enterprises (June 2018) in Poland in 2007–2018 (41.0% of value added in the enterprise sector with more than 9 employees). Data on the individual enterprises are held by the central statistical office in Warsaw (Statistics Poland) which may be made available on request. Disclosure relates to the results of analysis and aggregated data for PKD classes—the Polish Classification of Activities (microstructures, the protection of individual enterprises data necessary for reasons of statistical confidentiality and law).
The mechanism of value creation is quantified with the use of partial measures and value drivers interconnected within structural systems and merged into MVM (multifaceted value measure) with the use of statistical procedures including: standardization, change of destimulants into stimulants, elimination of their negative values by subtraction of the scalar (minimum value of the variable), determination of the Euclidean distance
di0 of individual objects from the coordinates of the anti-template (beginning of the coordinate system). The multifaceted value measure is therefore described by the formula:
where:
x0 = (0, …,0)
K,
K—number of multifaceted value measure components (
j = 1, …,
K).
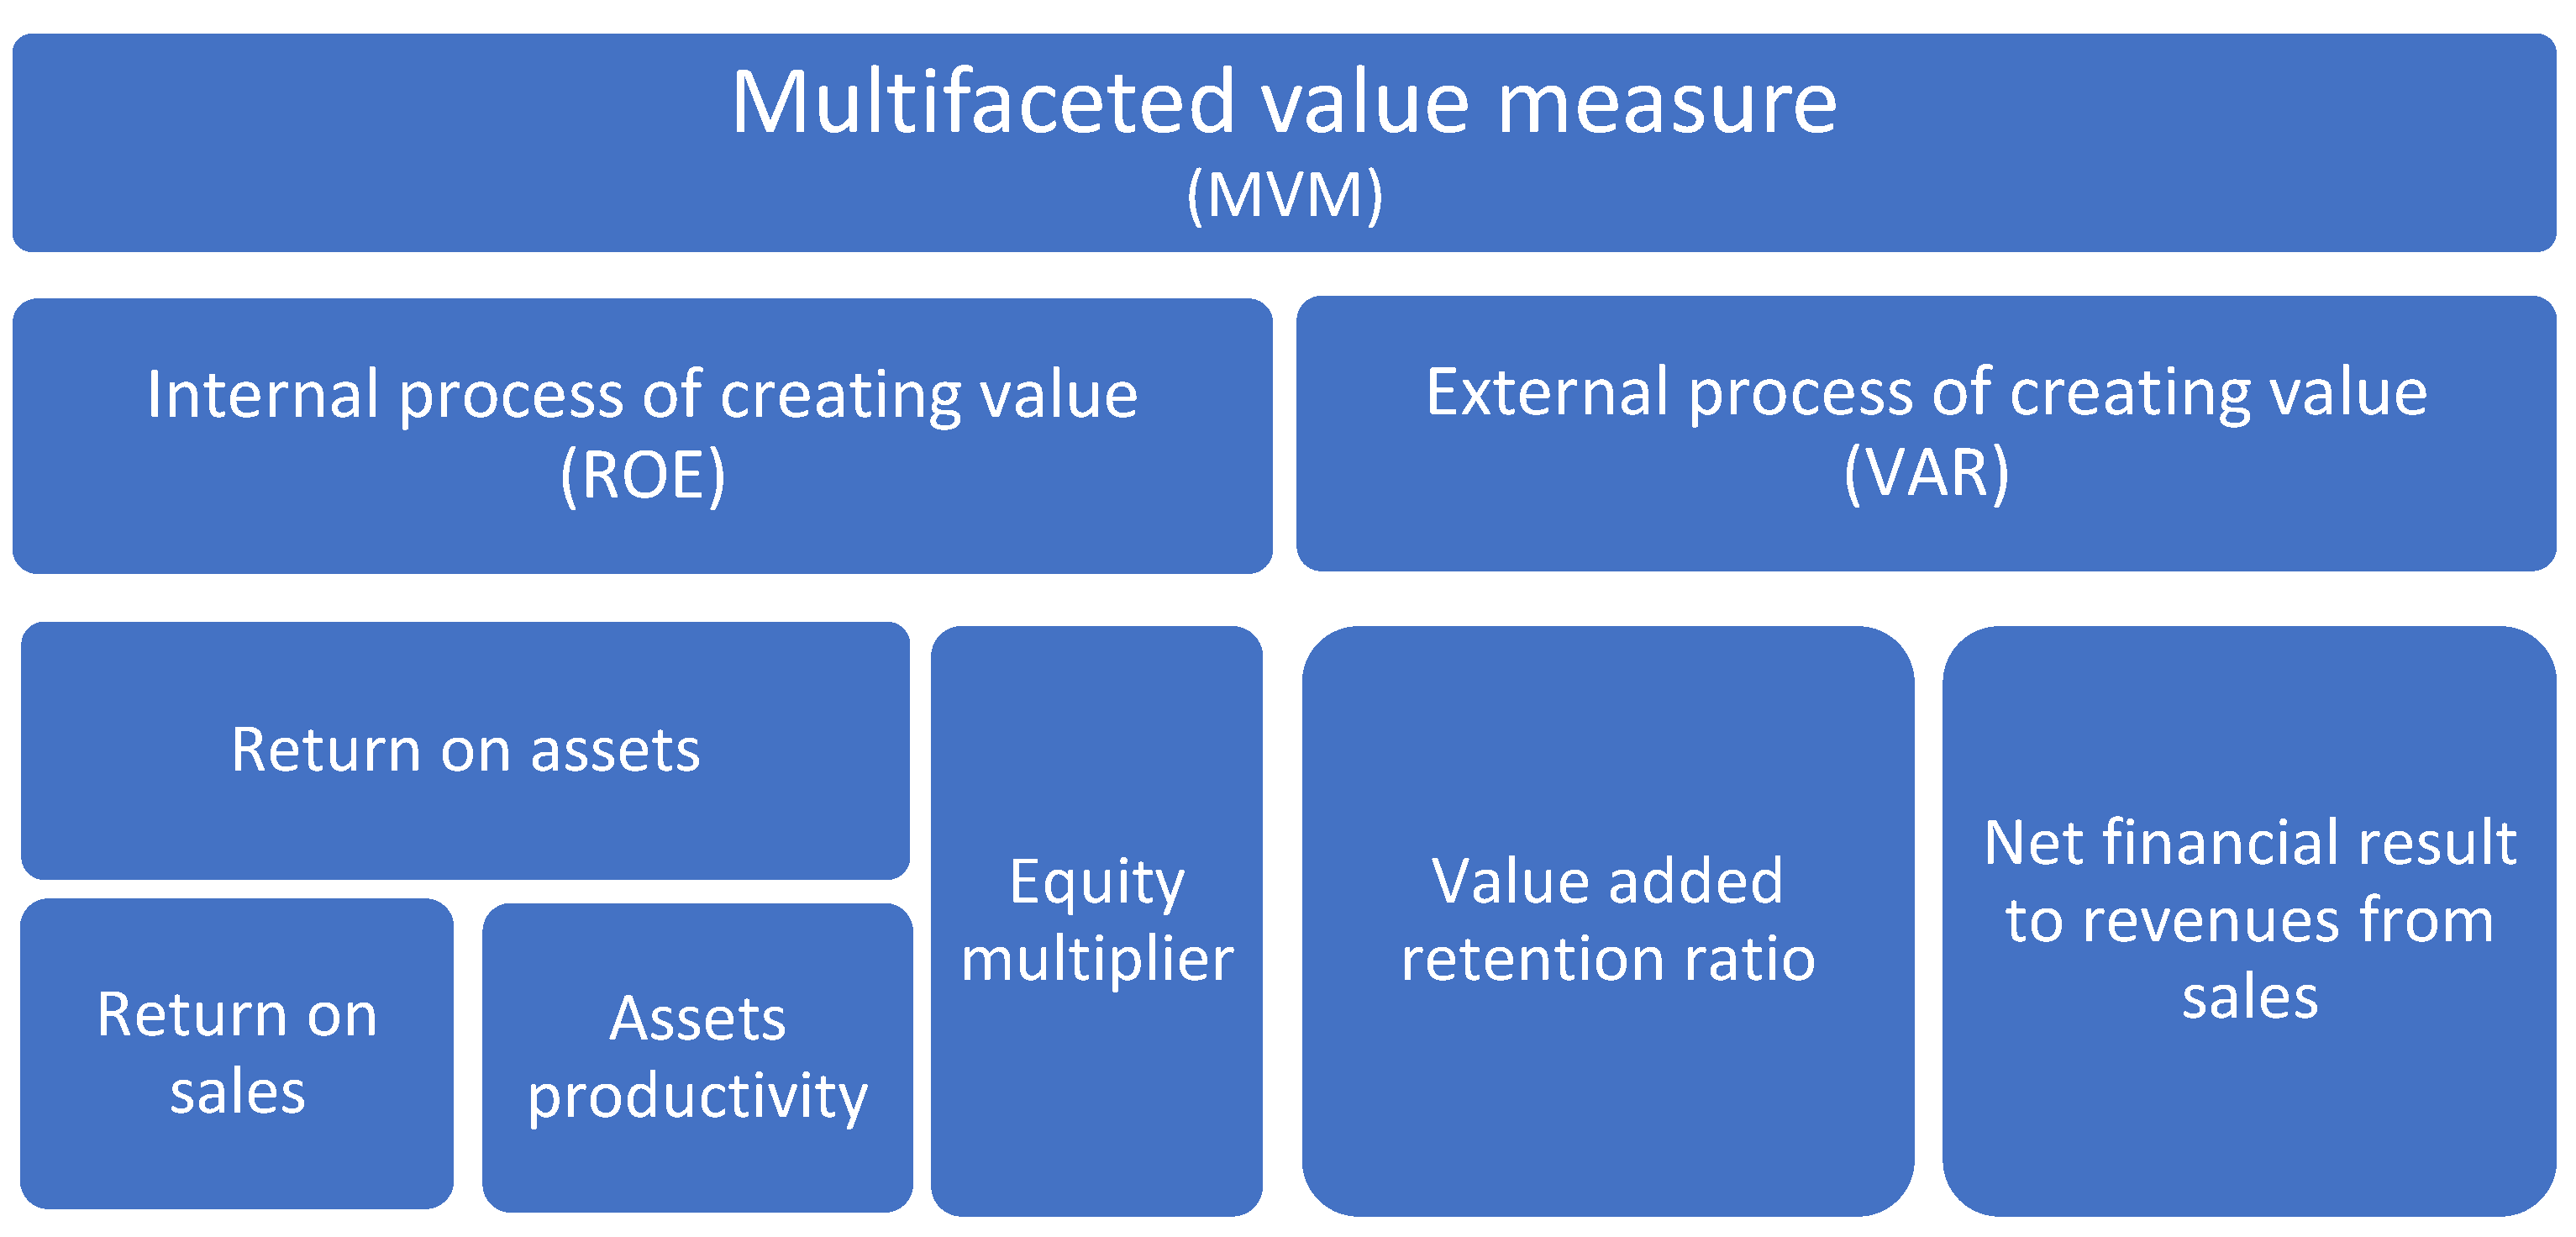
The processes that affect MVM are defined as follows (
Figure 1):
creating value for company owners (internal process): return on assets (ROA) and financing structure (equity multiplier EM—total capital to equity), which determine return on equity (ROE),
creating value added as a component of GDP (external process): net financial result referred to revenues from sales (ROR) and value added retention ratio (VAH—net financial result referred to value added), which determine the rate of value added (VAR—value added to revenue from sales).
The impact of the return on assets (ROA) and the financing structure (equity multiplier EM) on the return on equity (ROE) is the highest level of analysis generalisation using the relationships between profitability structural indicators (DuPont analysis). In this framework, ROA is formed by the net return on sales (ROS) and the asset productivity (AP)—total capital circulation. Thus, the analysis focused on changes in the dependent variable (ROE) and the nature of the impact of all defined explanatory variables (determinants)—ROA, ROS, EM and AP.
The second process investigated was the creation of added value (VAR). It is shaped by the net financial result referred to revenues from sales (ROR) and the value added retention ratio (VAH)—this is the part of the added value remaining in the company that creates it. Therefore, from the macroeconomic point of view, the ROR increase is stimulant, and the VAH increase is a destimulant of the value added rate (the increase in the share of the financial result in value added causes a decrease in the value added rate).
The measurement of financial security (the second research area) is based on an estimated logit model in response to the criticism of hitherto employed solutions. The basic deficiencies of the available models include: estimates from a long-term perspective before the 2008 crisis, limitations in their use in a dynamic analysis of threats, small numbers of learning sets, verification of prediction ability on learning sets, construction weaknesses, and the use of traditional estimation methods and techniques. The study is supplemented (details available in other publications) by the estimation of models scaled on the basis of the percentage of court insolvency proceedings [
80].
To construct the model a set of 24 indicators was used from the following areas: productivity, liquidity, financing, profitability, debt and efficiency. These indicators were characterised by 426 bankrupt companies and 1936 non-bankrupt companies (training set, 47,240 object–observations). The applied method for matching companies (bankrupt/non-bankrupt) involves the case–control technique (matching up to “1 to 5”) [
81]. In the next step, one-dimensional distributions and correlations of all 24 potential explanatory variables were analysed. The predictive capacity of decision rules was measured by taking into account their
sensitivity and
specificity. An assessment was next carried out of the parameters of the model (the best subset method,
Akaike Information Criterion). The model applied was the Firth’s logistic regression model, which almost completely eliminates the disadvantages of classic models (parameter assessments in this model are barely burdened, confidence intervals are characterised by better probabilistic properties and modification of the original likelihood function contains interpretation from the Bayes point of view) [
82,
83]:
where h
i is the diagonal elements of matrix
,
X is the data matrix, and
W is the diagonal matrix with dimensions
n x n, whose
i-th diagonal element is equal to
, and
is success likelihood by Bernoulli distribution.
Optimal cut-off points for level of financial security of going concern has been designated by means of the ROC (Receiver Operating Characteristic—a two-dimensional graph which presents
sensitivity and
1–specificity calculated for various values of the cut-off point). The predictive capacity of model was calculated with the use of
sensitivity and
specificity. Additionally, the quality of models has been measured with the use of the
(area under the ROC curve, where
y(x) is a function defining the ROC curve) [
84].
Bearing in mind the benefits of Firth’s model referred to, it is legitimate to presume that it should become one of the basic tools in the modelling of financial security of company going concern [
85].
The measure resulting from the logit model reflects the financial security degree (FSD) as opposed to the threat of the financial distress of going concern and bankruptcy. This change aims to define FSD as a stimulant for the needs of a multidimensional assessment of changes in the enterprise sector.
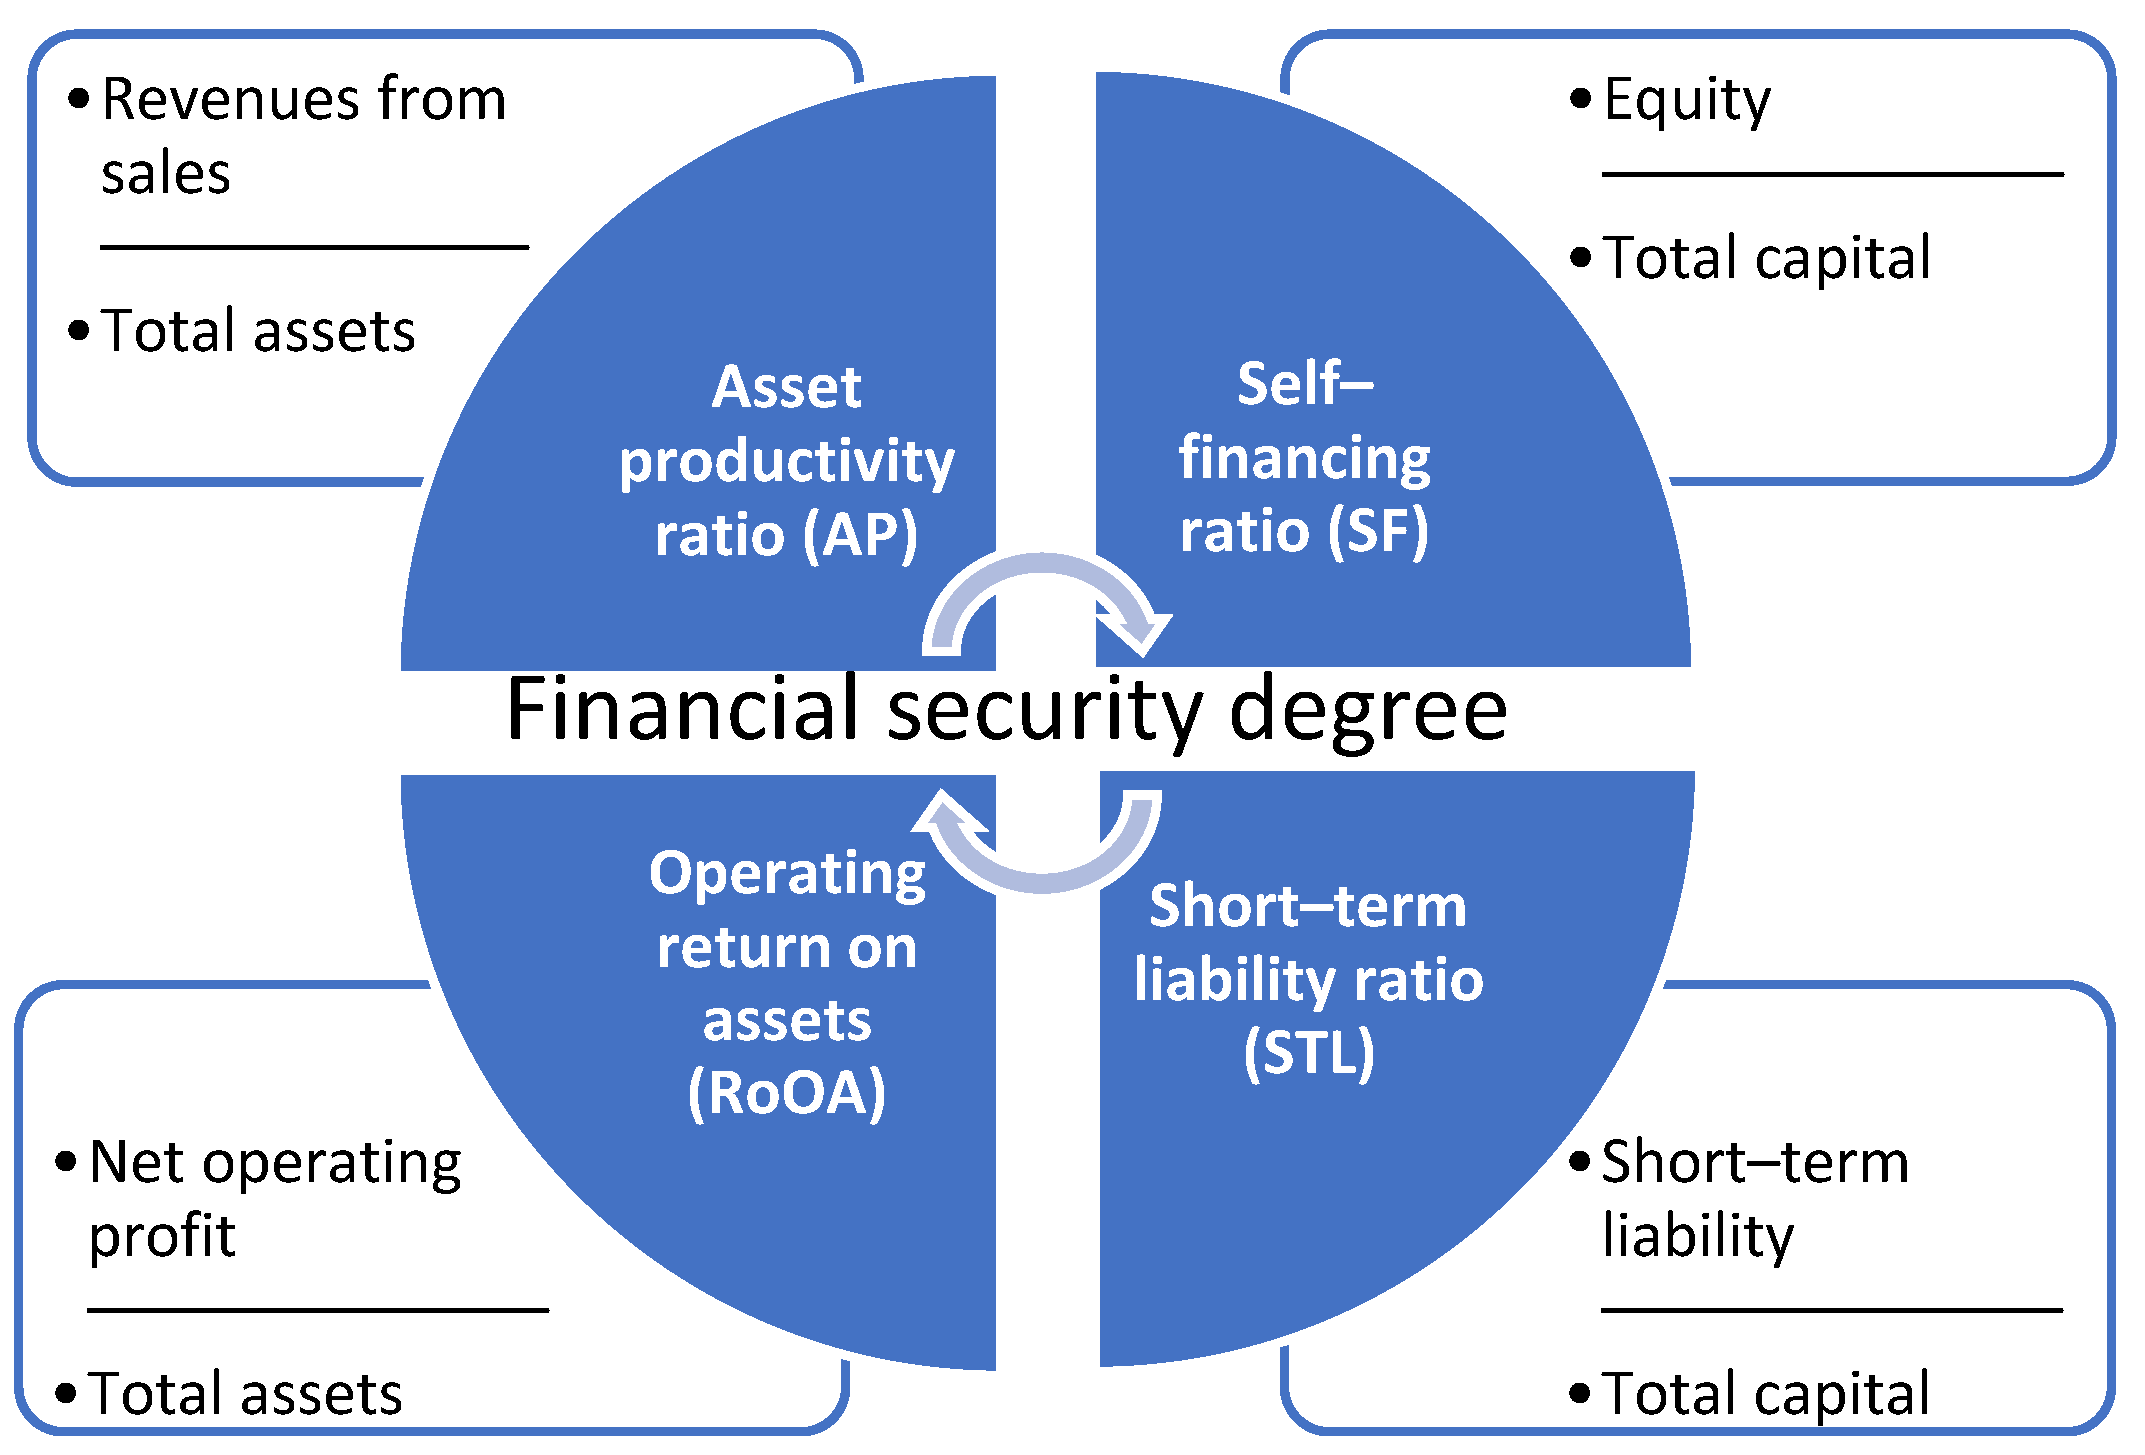
In accordance with the adopted methodology, the FSD model takes the following form [
86] (
Figure 2):
where:
AP—asset productivity ratio,
SF—self–financing ratio,
STL—short–term liability ratio,
RoOA—operating return on assets ratio.
This measure assumes values (0,100%), with higher values indicating higher probability of maintaining financial security from a one-year perspective (the model is characterised by: sensitivity 82.4%, specificity 82.1%, and AUC 0.894.
The analysis of the movement of objects in the identified structures is based on the ranking method. For this purpose, MVM and FSD measures are replaced by regular-type ranks. The average rank method is used, and the lowest rank is attributed to the highest value of a given measure. In combination with standard deviation (it’s treated as a measure of the variation/diversity of objects in relation to MVM and FSD), objects are classified as follows: pattern 1—high and stable position, pattern 2—high position with considerable variability, pattern 3—low and stable position, pattern 4—low position with considerable variability. These patterns and MVM and FSD measures, along with their explanatory variables, are used in analysing the profiles of the structures in question.
The degree of object density is analysed using the elliptical density measure:
where:
s2x,
s2y—variance of variable
x, variance of variable
y;
r2xy—Pearson linear correlation coefficient between
x and
y. The density measure describes the surface area of the ellipse covering the set of objects.
To assess the changes in microstructures, a taxonomic measure of similarity of structures (TMS) was used [
87]:
where:
pij,
pik—share of the
i–th object in structure
j,
k;
N—number of objects. This measure takes values from the range <0–1>; however, a closer value is to the unity, the more similar the compared structures are.
Cause analysis is based on a deterministic approach and logarithm method. It allows for transforming the sequence of the product of dynamics of explanatory variables (
DEV) into the sequence of the sum, which is followed by equating the dependent variable (
DDV) dynamics logarithm to one. Thereby, the structure ratios are determined, which describe the impact of explanatory variables (
REV) on the dependent variable (
RDV) [
88]:
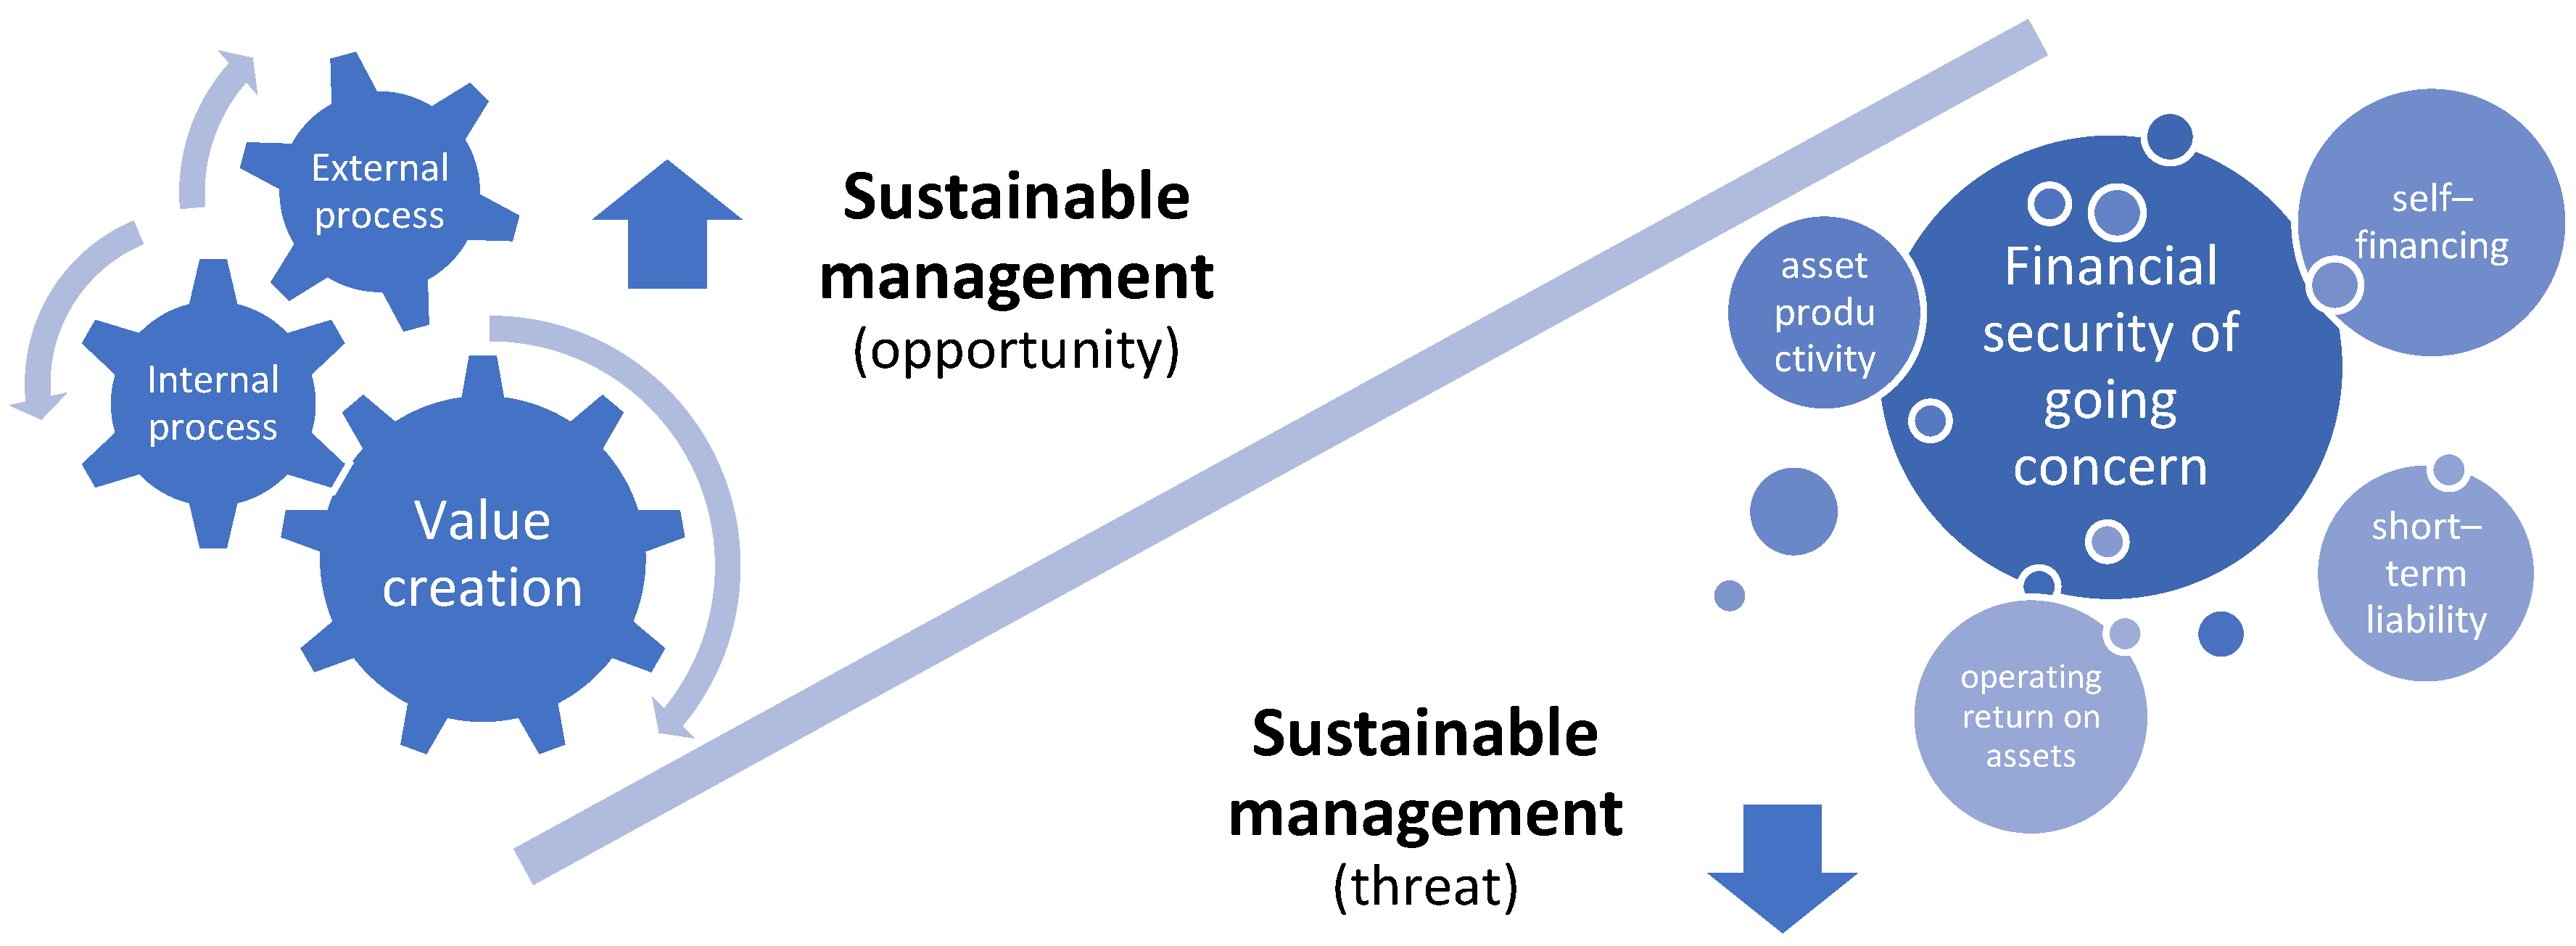
The diagram of the problem of balancing and evaluation of the effects of value creation and financial security sustainable management analysed in the article is presented in
Figure 3.
4. Findings and Discussion
4.1. Return on Equity (ROE) Determinants
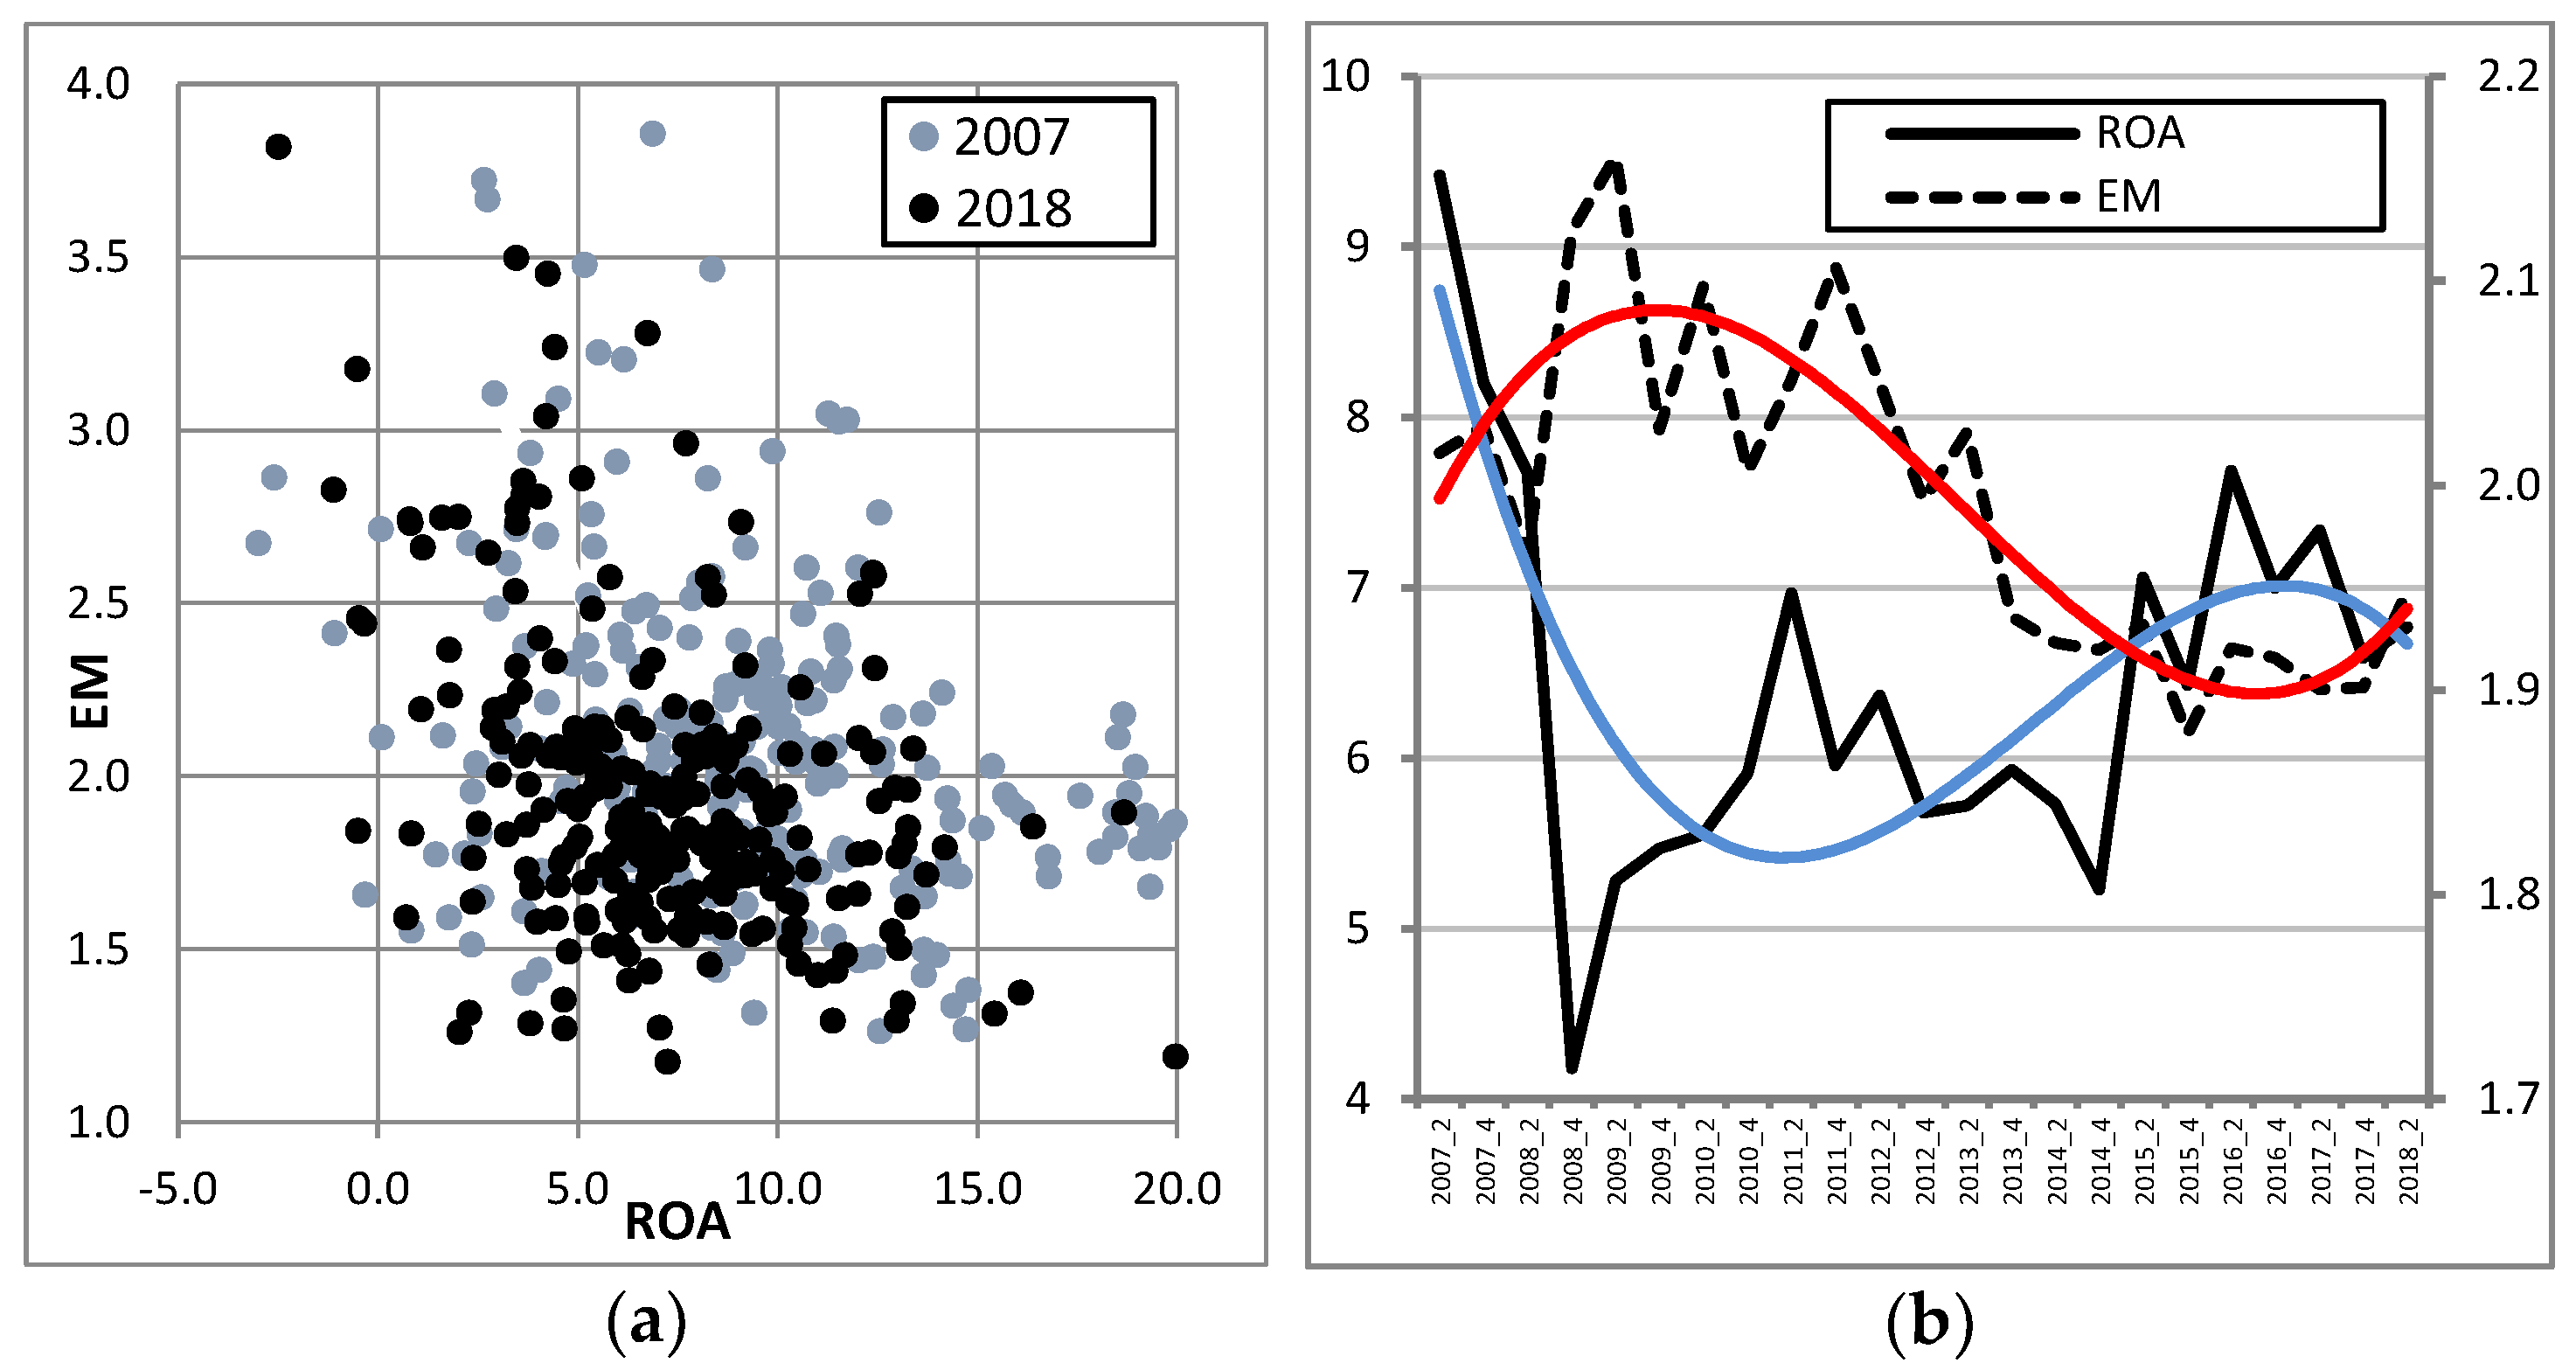
In a wide range of results and conclusions regarding ROE determinants in manufacturing enterprises in 2007–2018, attention should be given to the following findings (
Figure 4).
The first finding relates to a higher density of objects within a group of ROA–EM factors (an increase by 30.4%). Movements are relatively uniform towards the coordinate system. This indicates that objects become similar in terms of the obtained results: ROA, and financing structure (EM).
With regard to the values on the time axis, attention should be given on the contrary trend of changes in ROA–EM values – increases in one are accompanied by decreases in the other (and vice versa). The year 2015 marks the end of a longer and the beginning of a shorter phase of these contrary trends. A causal analysis indicates that the main determinant of ROE is ROA factor (an average of 72.7%). Its share rises steadily until 2009, and its dynamics declines in 2012–2013.
The path of the central point of the population shows numerous reversals, and average financing conditions are marked by an equilibrium between equity and foreign capital (EM = 1.99), accompanied by the increased effectiveness of the use of total capital (ROA = 6.44%).
Partial conclusions: (a) There is an opposite direction of changes in ROA–EM values—the change of one corresponded on the contrary change of the other; (b) the key determinant of ROE is the ROA factor.
4.2. Rate of Value Added (VAR) Drivers
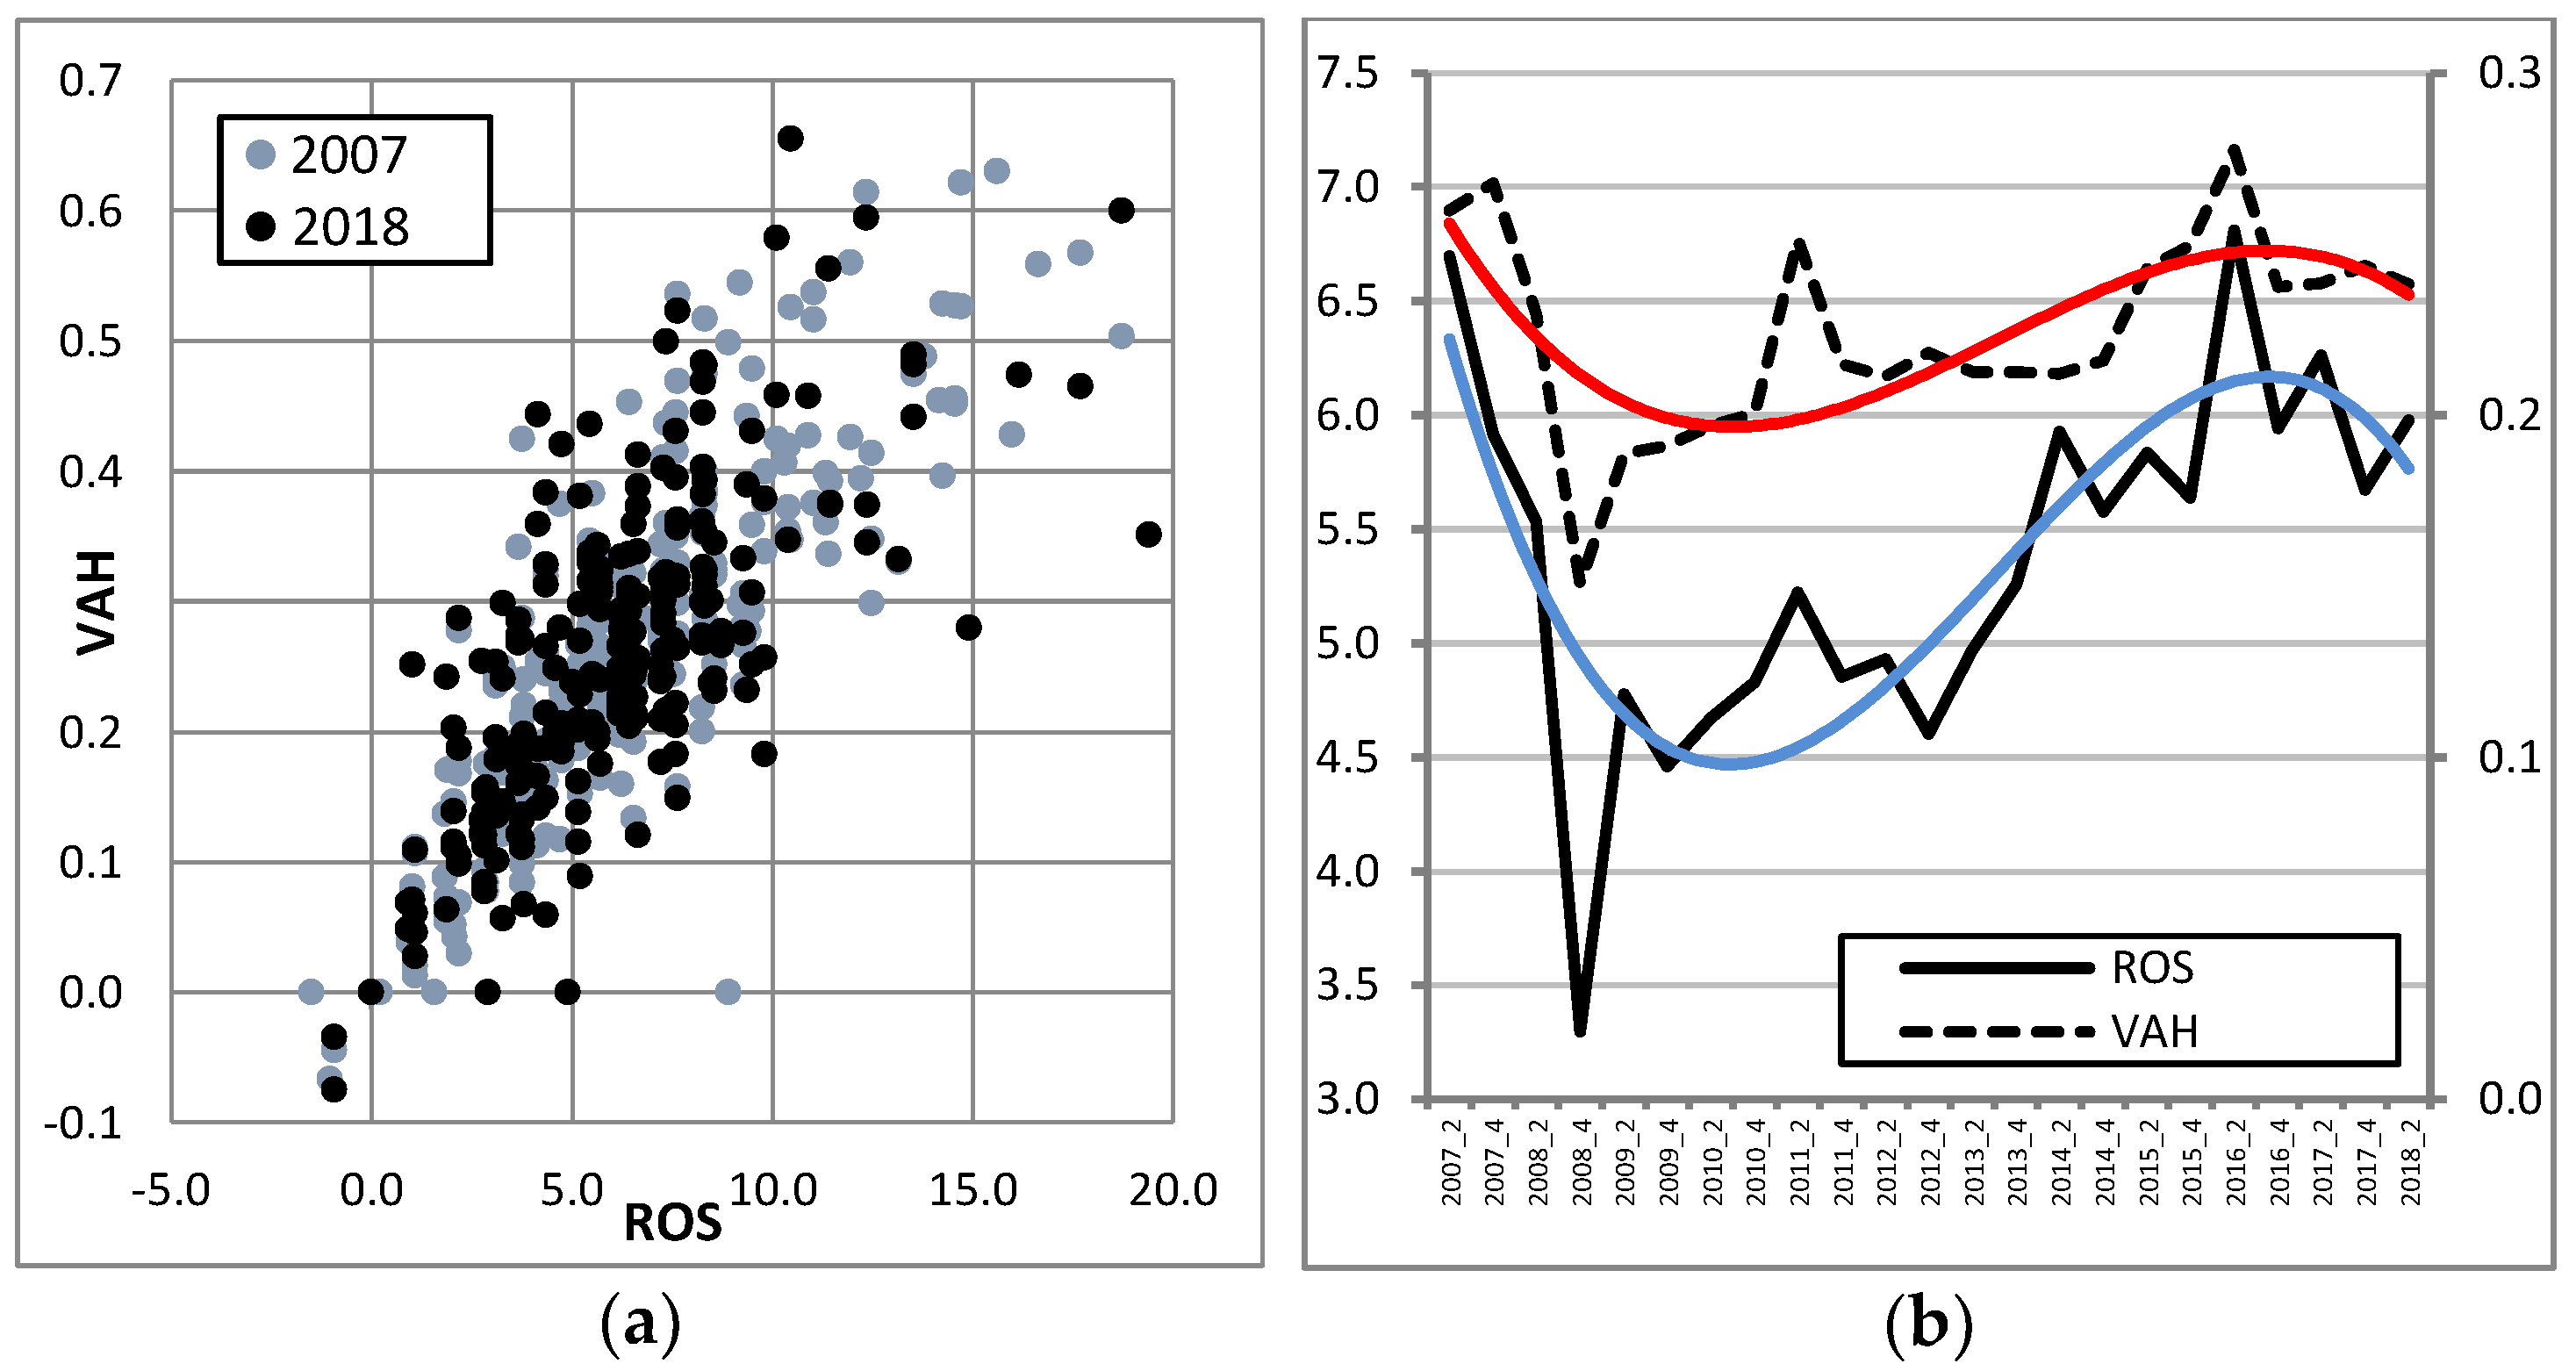
With regard to VAR determinants in manufacturing enterprises in 2007–2018, attention should be given, in the first place (
Figure 5), to the density of ROS–VAH objects (from 10.1 to 0.6). It is not quite uniform towards the system of coordinates but closer to the VAH axis. The increased density indicates a greater similarity of objects in terms of ROS values and the VAH coefficient.
The observed changes over the course of time also include the consistency of direction with regard to ROS–VAH values—an increase in one is accompanied by an increase in the other (Pearson = 0.87). The economic slowdown of 2008–2010 is distinctly shown by particular values, and the next period of deterioration starts in 2016—demonstrated by lower ROS and VAH values.
VAR, from a cause-related perspective, points to a balanced share of ROS and VAH variables (an average of 50% each), and the analysed period is marked by 3 points of changes of contrary trends (increase/decrease, decrease/increase).
The path of the central point of the analysed population forms a trajectory with numerous reversals. However, its regression curve is relatively stabilised (linear R2 = 0.76), and the average conditions of operating effectiveness stand at ROS = 5.38%, and VAH = 0.22.
Partial conclusions: (c) There is convergence in the direction of changes in the values of ROS–VAH factors; (d) by causally distributing the VAR component, the share of ROS and VAH factors was equivalent.
4.3. Multifaceted Value Measure (MVM) Determinants
An assessment of MVM changes with regard to ROE–VAR factors in manufacturing enterprises in 2007–2018 leads to several conclusions (
Figure 6).
An analysis of the movement of objects in the studied period indicates their higher density (+33.3%). It is relatively uniform towards the origin of the coordinate system but closer to the VAR axis. A greater similarity of objects in terms of the measures of internally and externally created value points to stiffer competition in the analysed population of manufacturing enterprises.
The trend of changes in ROE–VAR values is consistent as of 2017—an increase in one is accompanied by an increase in the other (Pearson = 0.73). There are two distinct periods of decreasing ROE values (the second one is weaker, in the initial phase), and one long-lasting period of declining VAR.
The path of the central point is marked by numerous reversals, and its regression curve with a good match of R2 = 0.60 is described by a 4th-order polynomial. The occurring changes lead to average values of ROE = 12.81%, and VAR = 20.3%.
The set of objects merged into uniform groups according to PKD—the Polish Classification of Activities (microstructures, the protection of individual enterprises data necessary for reasons of statistical confidentiality and law)—can be described by dividing them into uniform subsets (quadrants), distinguished by their ranking position and standard deviation. This procedure points to the majority of PKD classes below the level of average variation (48.0), indicating relative stability. However, such a conclusion is not unambiguous considering a high average value of the standard deviation.
The division of value creation measures into explanatory variables allows the identification of their share in determining the value of MVM (dependent variable). An average share of ROE is 64.5%, with VAR accounting for 35.5%. The 2007–2014 period is marked by a decreasing impact of ROE—10.4%. This share rises in subsequent periods, reaching the level of 94.4% of the initial value at the end of the analysed period (inference related to VAR changes is contrary).
Key considerations: (1) The development of manufacturing enterprises, assessed on the basis of value creation, is marked by recurring cycles which are consistent with the factors which affect them; (2) value creation for owners is the main determinant, accompanied by an increased transmission of value to the wider economic system.
4.4. Financial Threat to Going Concern and Bankruptcy
The measure resulting from estimation—the degree of financial security (FSD)—is the opposition of the concept of the threat to going concern and bankruptcy, which results from its definition as a stimulant for the needs of a multivariate assessment of changes in the enterprise sector, and in the context of inference presented in this paper, for the purpose of the relativisation of value creation assessments. Undoubtedly, the reference point for FSD or financial threat is the category of bankruptcy as a court bankruptcy proceedings and their percentage (percentage of bankruptcy proceedings—PBP).
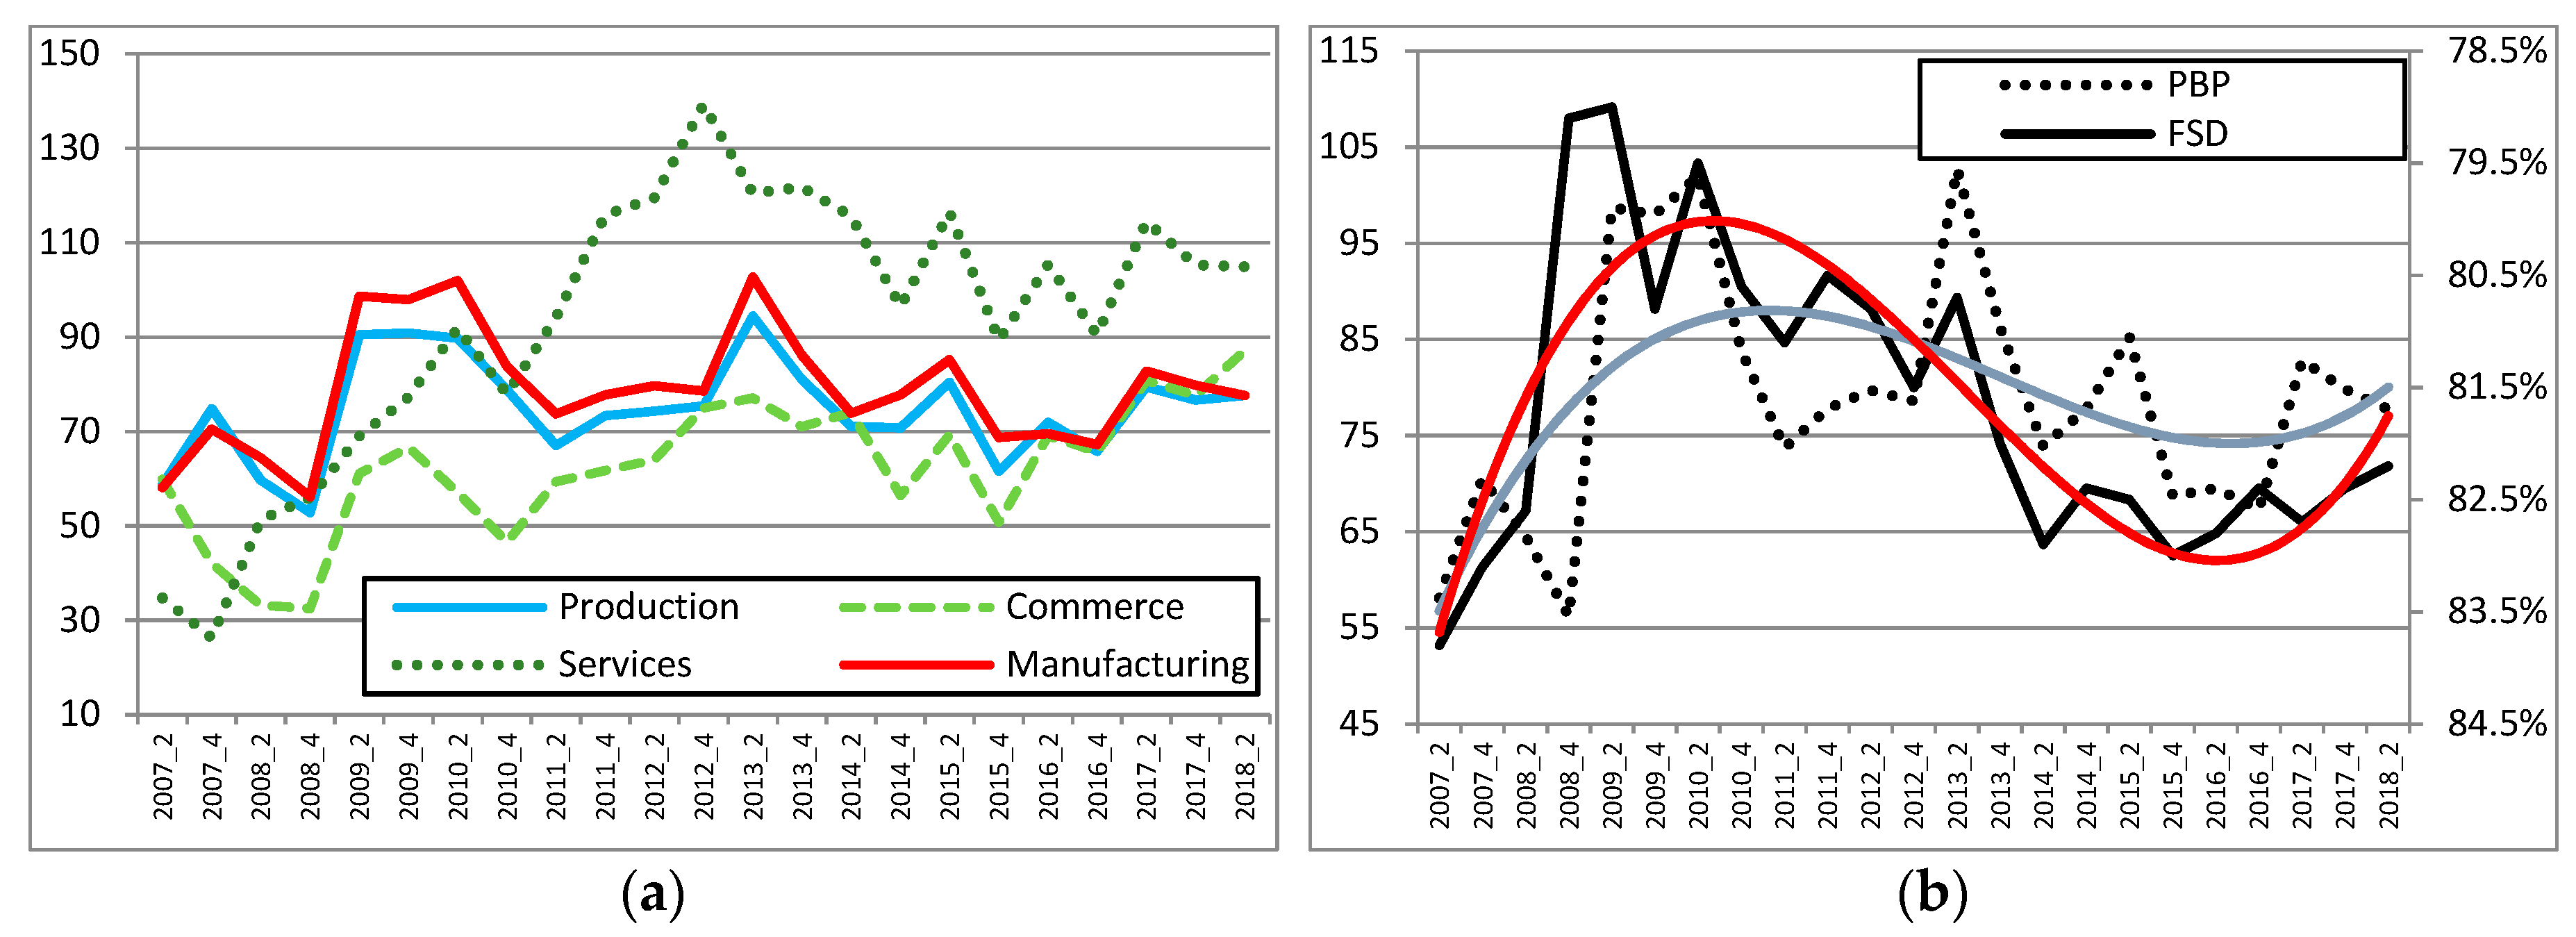
Bankruptcy proceedings (understood as PBP) intensified and reached their peak values in 2012, especially in the service sector. Trade activities reflected a long-term trend of GDP growth, while production activities were marked by the greatest stability (also in manufacturing enterprises—an average of 105.5% of PBP in production activities). There is a distinct period of economic slowdown (crisis)—the 2009–2010 period, with its peak in 2013 (the second slowdown) (
Figure 7a).
The analysis of bankruptcy concentration points to above-average values in services and an increasing trend until 2013, followed by a reverse trend. The production sector records a distinct trend of the decreasing concentration of bankruptcies, while trade activities are marked by a long-term increasing trend (concentration is assessment of court bankruptcy proceedings in a specific group of entities in relation to the total number of group members. Values in excess of 1 indicate above-average concentration of the analysed phenomenon in a given group).
The mutual reference of bankruptcy measures in a legal sense (PBP) and those in an economic sense (FSD) is not possible without defining their actual meaning. It does not imply, however, the absence of correlations between them. FSD and PBP values are similar over longer periods of time (the analysis of the 2007–2018 period). The determined trend functions (polynomial of degree 3) for both curves point to the consistency of their directions. It is also confirmed by the effectiveness of the FSD estimated measure (
Figure 7b).
Partial conclusions: (e) In the context of bankruptcy, the most stable situation was in manufacturing enterprises; (f) trends in PBP and FSD values are compatible.
4.5. The Degree of Financial Security
With regard to the second key area of the considerations, basic conclusions should be formulated as a result of the analysis of the degree of financial security (FSD) in manufacturing enterprises (
Figure 8).
The analysed period is characterised by a considerable and reverse variability of FSD values as well as their standard deviations (SD). The visible impact of economic slowdown after 2008 resulted in lower FSD values, while companies recorded greater changeability, marking the disturbance of relative equilibrium. The situation was reversed after 2010, where the FSD and SD curves intersected—improvements in FSD were accompanied by declining SD values. Another culminating point of FSD values is recorded in the second half of 2015, and as expected, declining FSD values are accompanied by increased SD levels until their curves intersect again (this issue is analysed in subsequent research studies).
The population of objects (enterprises merged into uniform groups according to the PKD classification—microstructure) is divided into subsets (quadrants), marked by their average ranking position and standard deviation (in an FSD-based approach). There is a slight dominance of positions below average variation (53.1%). High average standard deviation values of ranking positions (51.8) point to considerable object relocations, which is confirmed by the above conclusion.
FSD decile distribution shows a considerable improvement in the 9th decile, which results in reducing FSD’s average value. Unfortunately, a contrary trend of changes, but weaker in its impact, is recorded for the lowest deciles, and these changes have an adverse effect on improvements in the entire group of manufacturing enterprises.
The identification of explanatory variables in the FSD model shows their share in determining the final value of FSD (dependent variable). The average share of AP (assets productivity) is 16.6%, SF (self–financing)—29.6%, STL (short–term liability)—30.8%, and RoOA (operating return on assets)—23.0%. As compared with the beginning of the analysed period, a greater impact is recorded at the end of the period for AP, SF, and STL (+42.5%, +16.2%, and +12.5%, respectively), and a smaller impact for RoOA (–35.8%). Deviations from average values are lower: +3.0%, +6.4%, –6.5%, and –1.7%, respectively.
Key considerations: (3) Changes in financial security occur in recurring cycles, and are contrary to the level of its variation; (4) the distribution of financial security determinants changes, with the lowest impact of asset productivity (capital circulation).
4.6. Value Creation vs. Financial Security
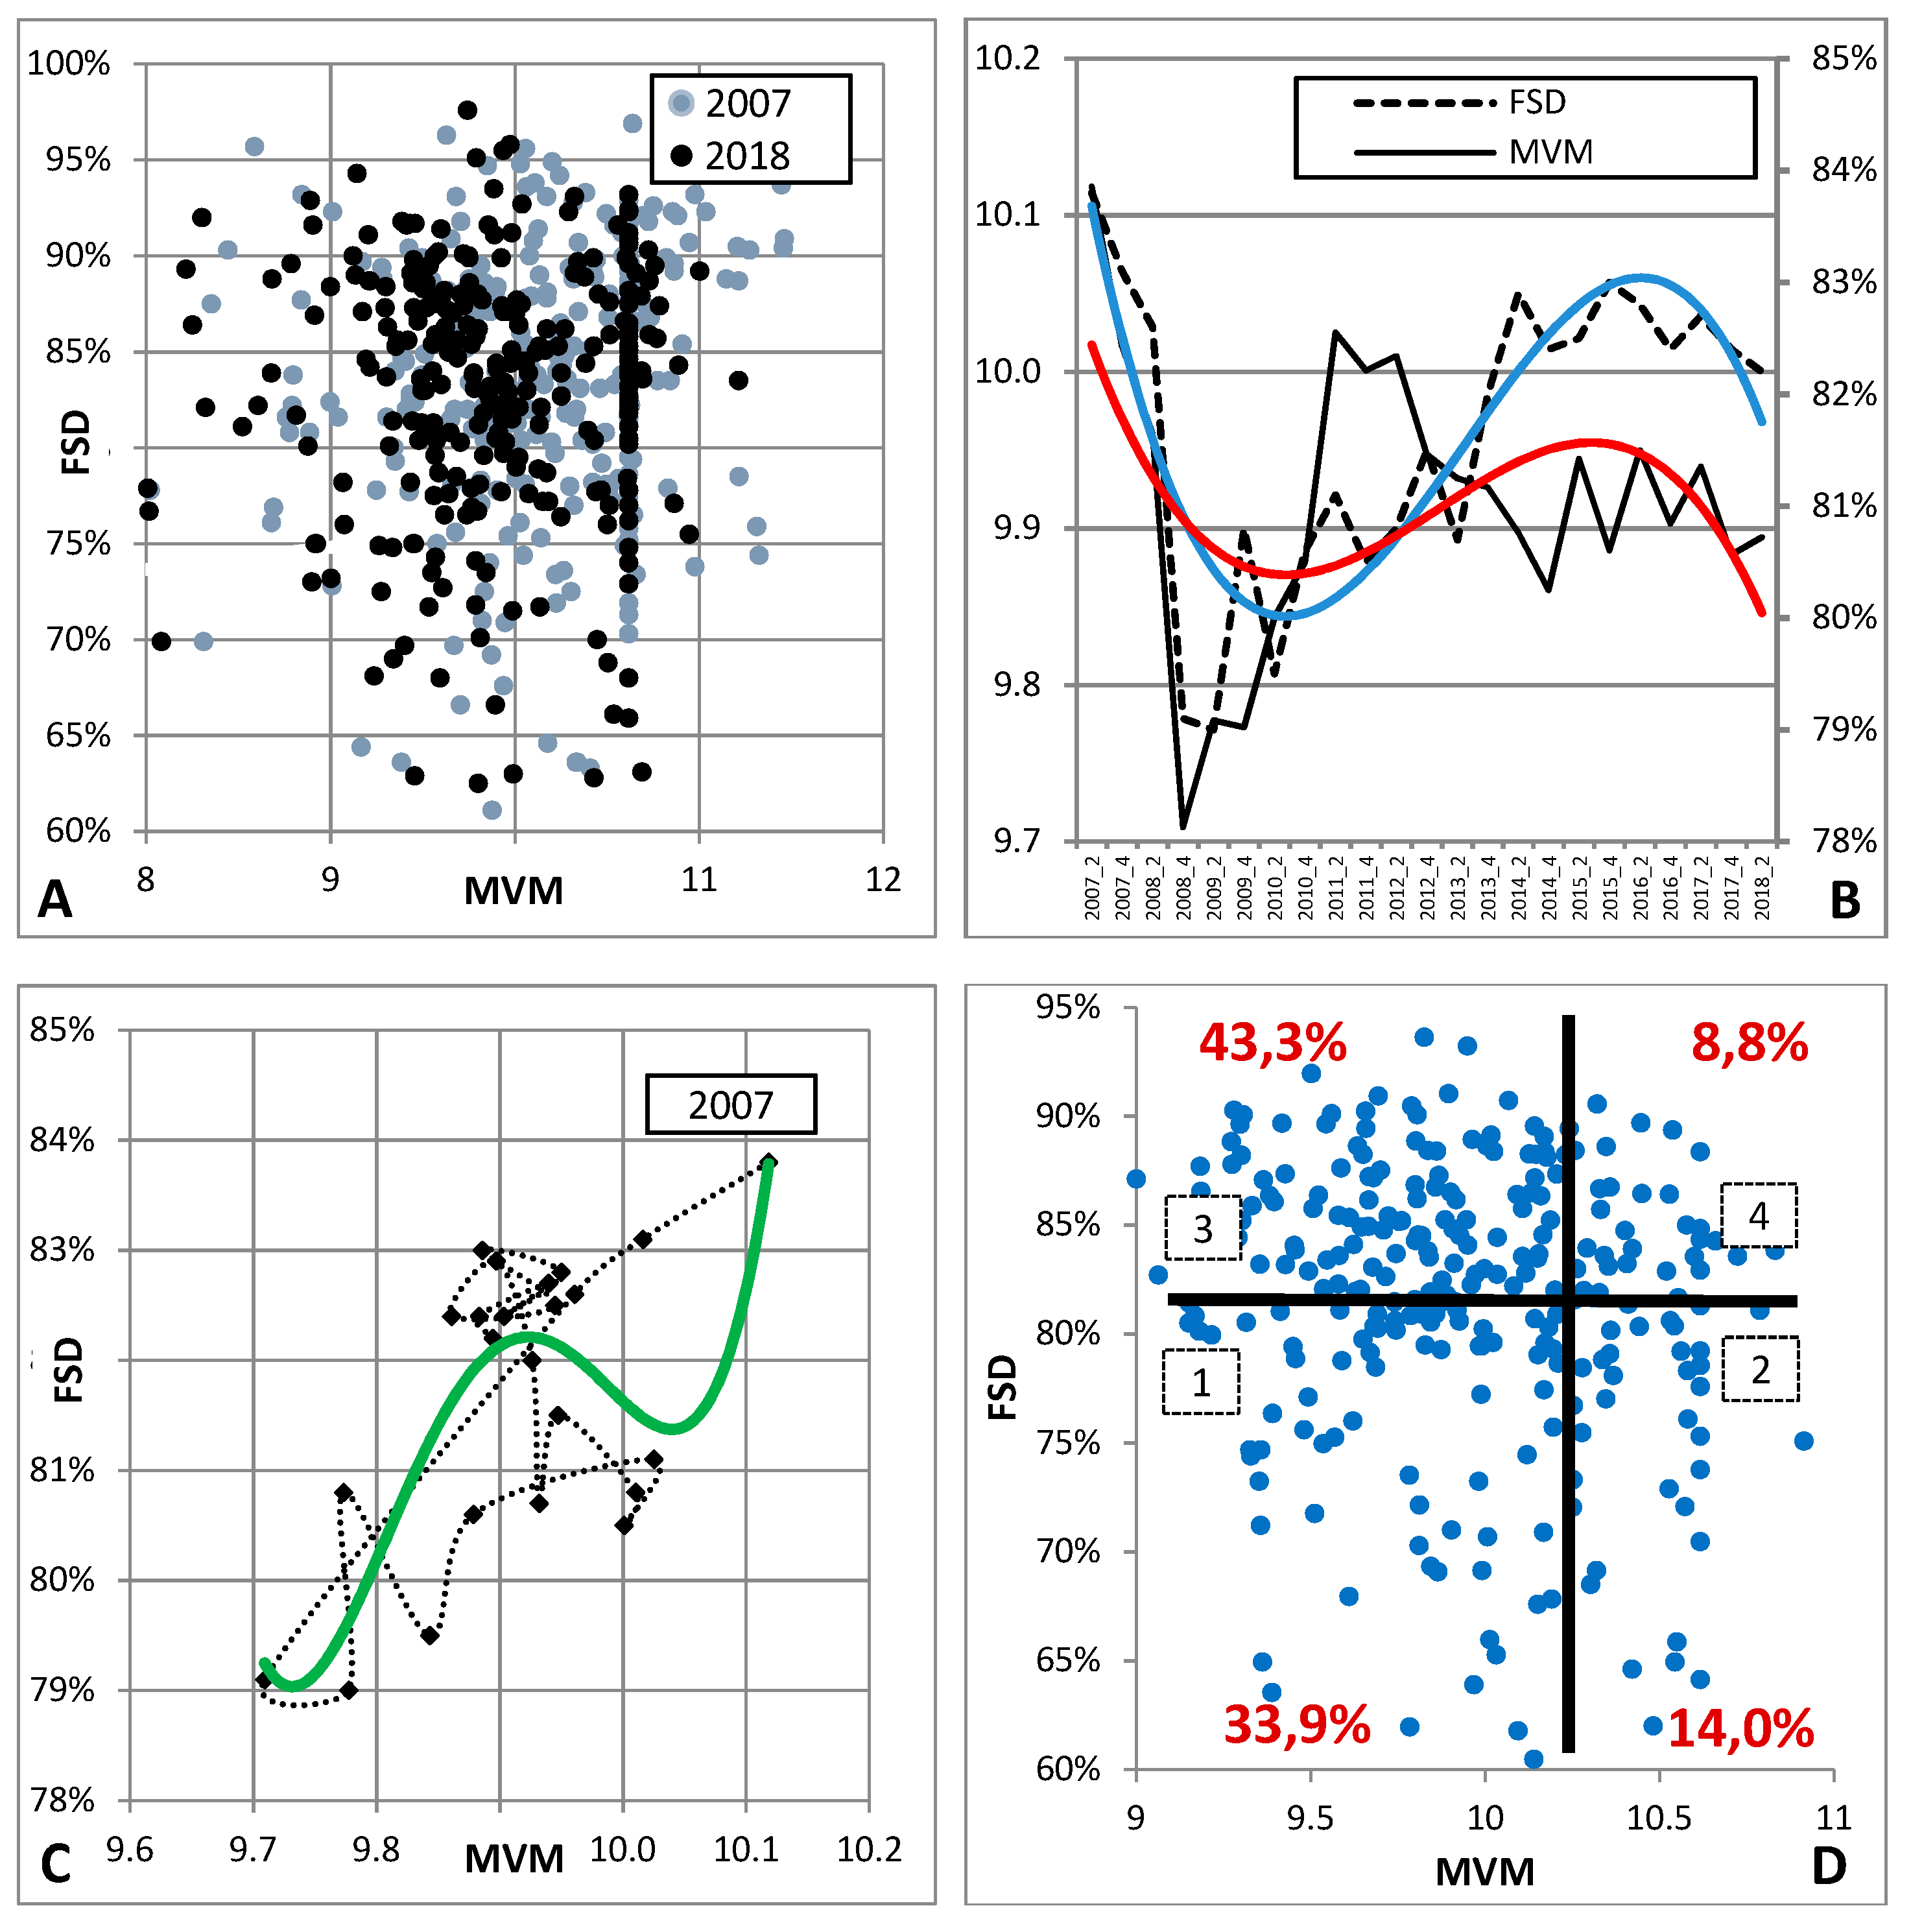
The main hypothesis of this paper is the existence, in the population of manufacturing enterprises, of direct proportionality between the effects of value creation and ensuring the financial security of going concern. The assessment analysis conducted for 2007–2018 results in several partial findings which lead to the final conclusion confirming this hypothesis (
Figure 9).
The analysed population is marked by a higher density of objects (by 30.0%)—it is relatively uniform, and objects become more similar in terms of value creation (MVM) and the level of achieved financial security (FSD). There is a subset of considerable size, characterised by a similar level of MVM and significant differences in FSD (15% of the population of manufacturing enterprises).
The trends of changes of both measures are consistent—an increase in one is accompanied by an increase in the other, and vice versa. Thus, there is a strong, positive and statistically significant correlation between MVM and FSD (Pearson = 0.63, p-value = 0.001270). There is a distinct period of declining value creation and financial security in 2007–2010, followed by a period of improvement until 2015. In that year, manufacturing enterprises enter another period of lower value creation and deterioration in financial security.
The path of the central point is marked by numerous reversals, its regression curve with a good match (R2 = 0.6) is described by the polynomial of 4th degree, and average values reach the level of MVM = 10.3, and FSD = 81.7%. Regarding these values as criteria for classification (enterprises merged into uniform groups according to PKD classes—microstructure), conditions below average with respect to MVM were characteristic of as many as 77.2% of objects in 2007–2018, and 47.9% of objects in terms of FSD. Only 8.8% of objects meet the above average criteria for both FSD and MVM. Manufacturing enterprises in this group are leaders in terms of value creation as well as in maintaining high levels of financial security.
Key consideration: (Hypothesis 0) There is a directly proportional relationship between the effects of the value creation process and the ensuring of financial security in manufacturing enterprises—the confirmation of the principle of sustainable management.
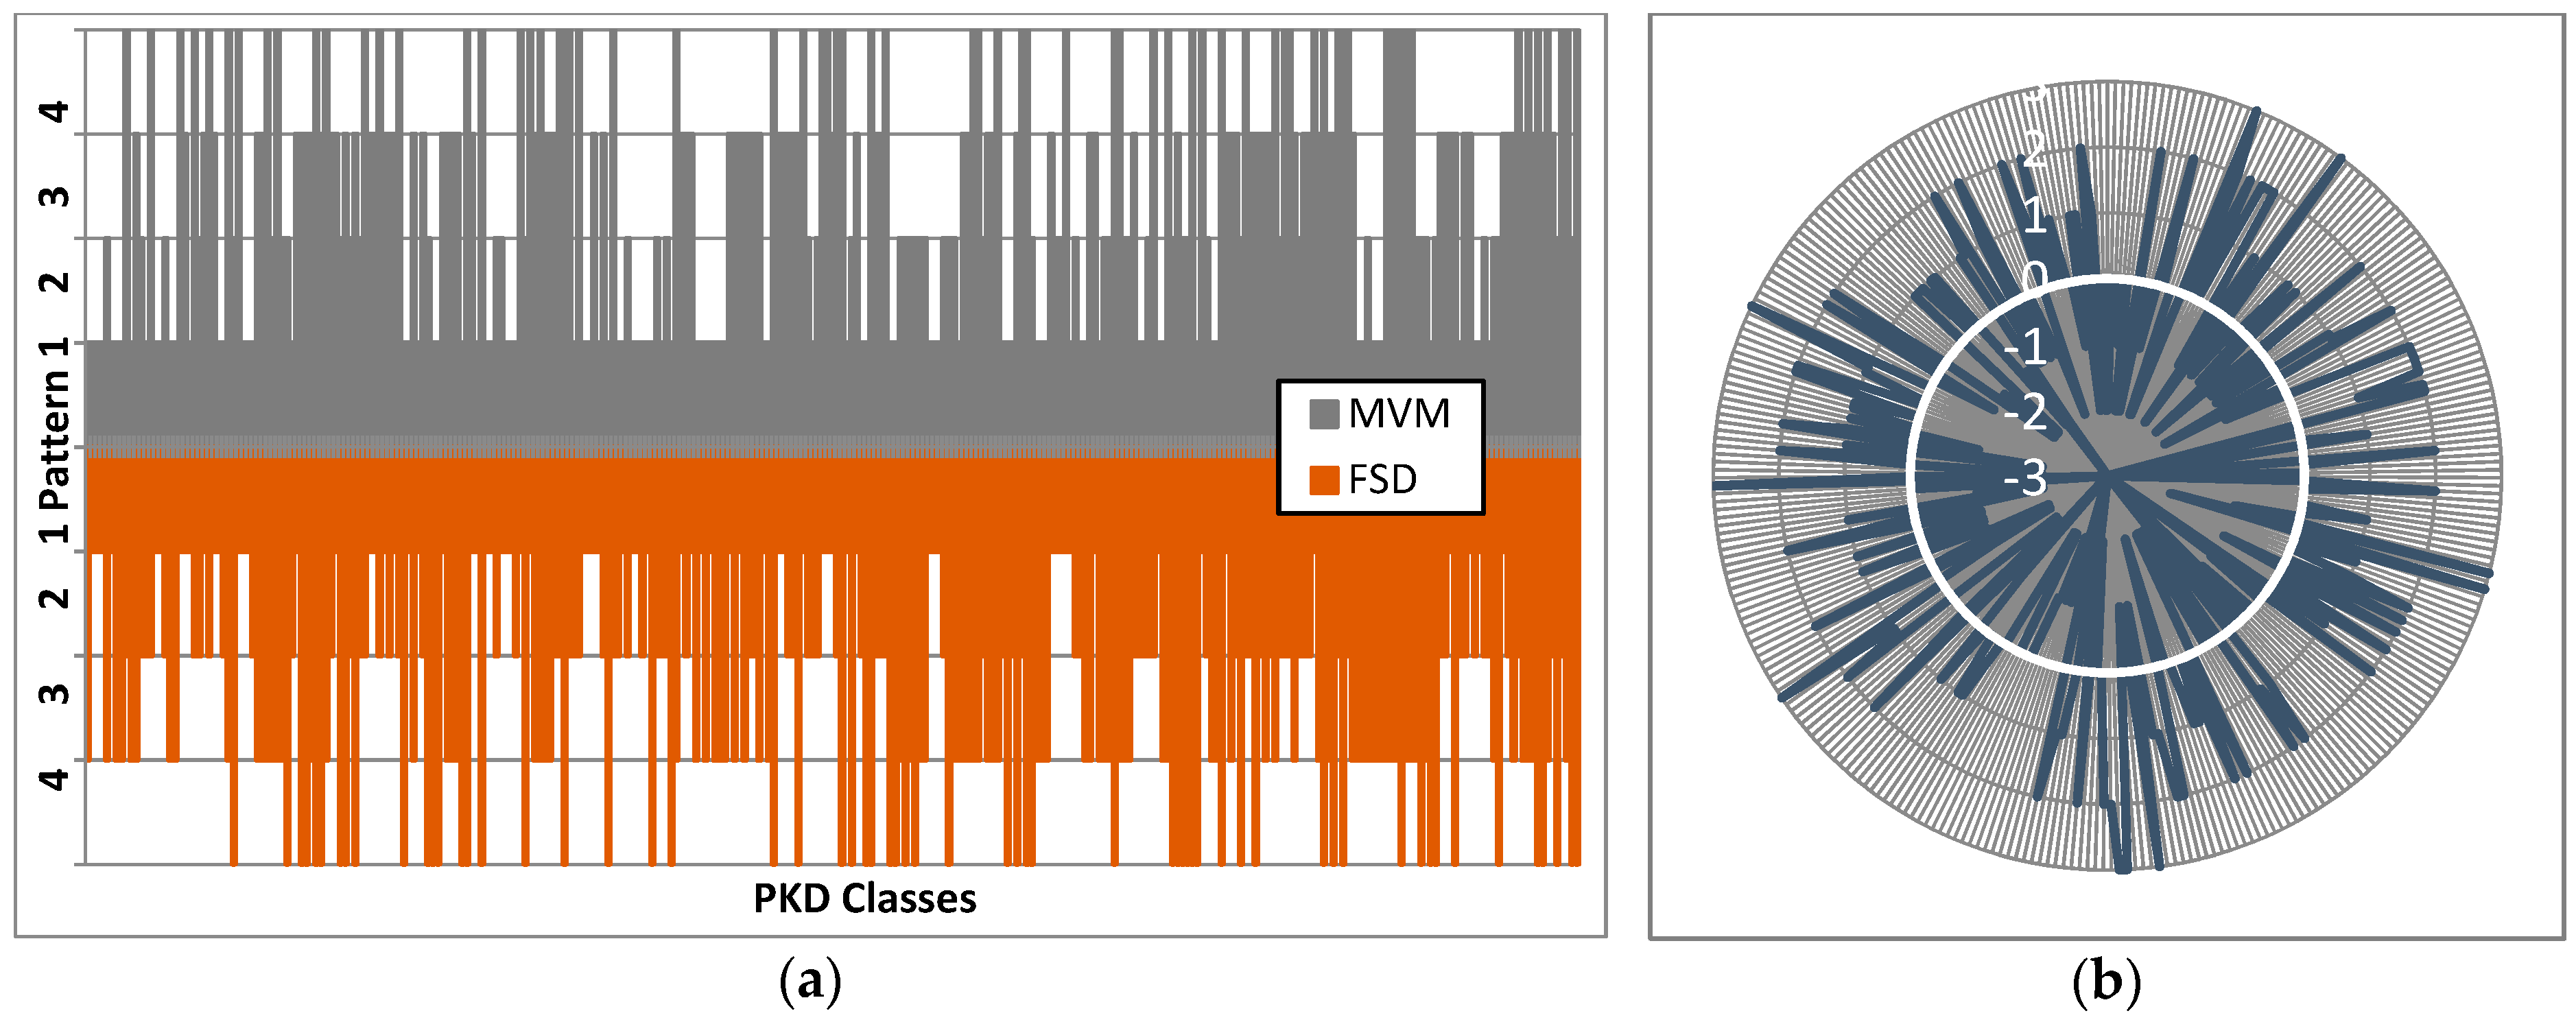
4.7. Structure Profiles in the Context of Value Creation and Financial Security
Multifaceted value measure (MVM) comprises two components—creating value for owners (internal value, ROE) and creating value added as a component of GDP (external value, VAR). The assessment of the population of manufacturing enterprises by PKD classes (microstructure, 306 objects) leads to general conclusions with regard to value creation profiles. An in-depth analysis requires developing an appropriate research methodology, which sets directions for further research and publication of results.
The first conclusion of the initial, generally oriented analysis is a relatively lower variability of objects (PKD classes) in terms of external value creation (standard deviation 9.4, i.e., 39.1% of average value) as compared with internal value (13.1% and 50.1%, respectively). Also, there are differences in the levels of absolute standardised values of both MVM components in particular PKD classes—for example, some of them, when creating internal value, have a relatively small impact on external value creation. Others, in turn, build this value. Also, there are objects which have simultaneously a great or small impact on both external and internal value creation.
The value of taxonomic measure of similarity (TMS) of the analysed microstructure for ROE and VAR variables was 0.710. If 0.7 < TMS < 0.8, the similarity is considered to be low (TMS < 0.7—no similarity). Therefore, the thesis of low similarity, close to non-existence can be assumed for the analysed microstructure (
Figure 10).
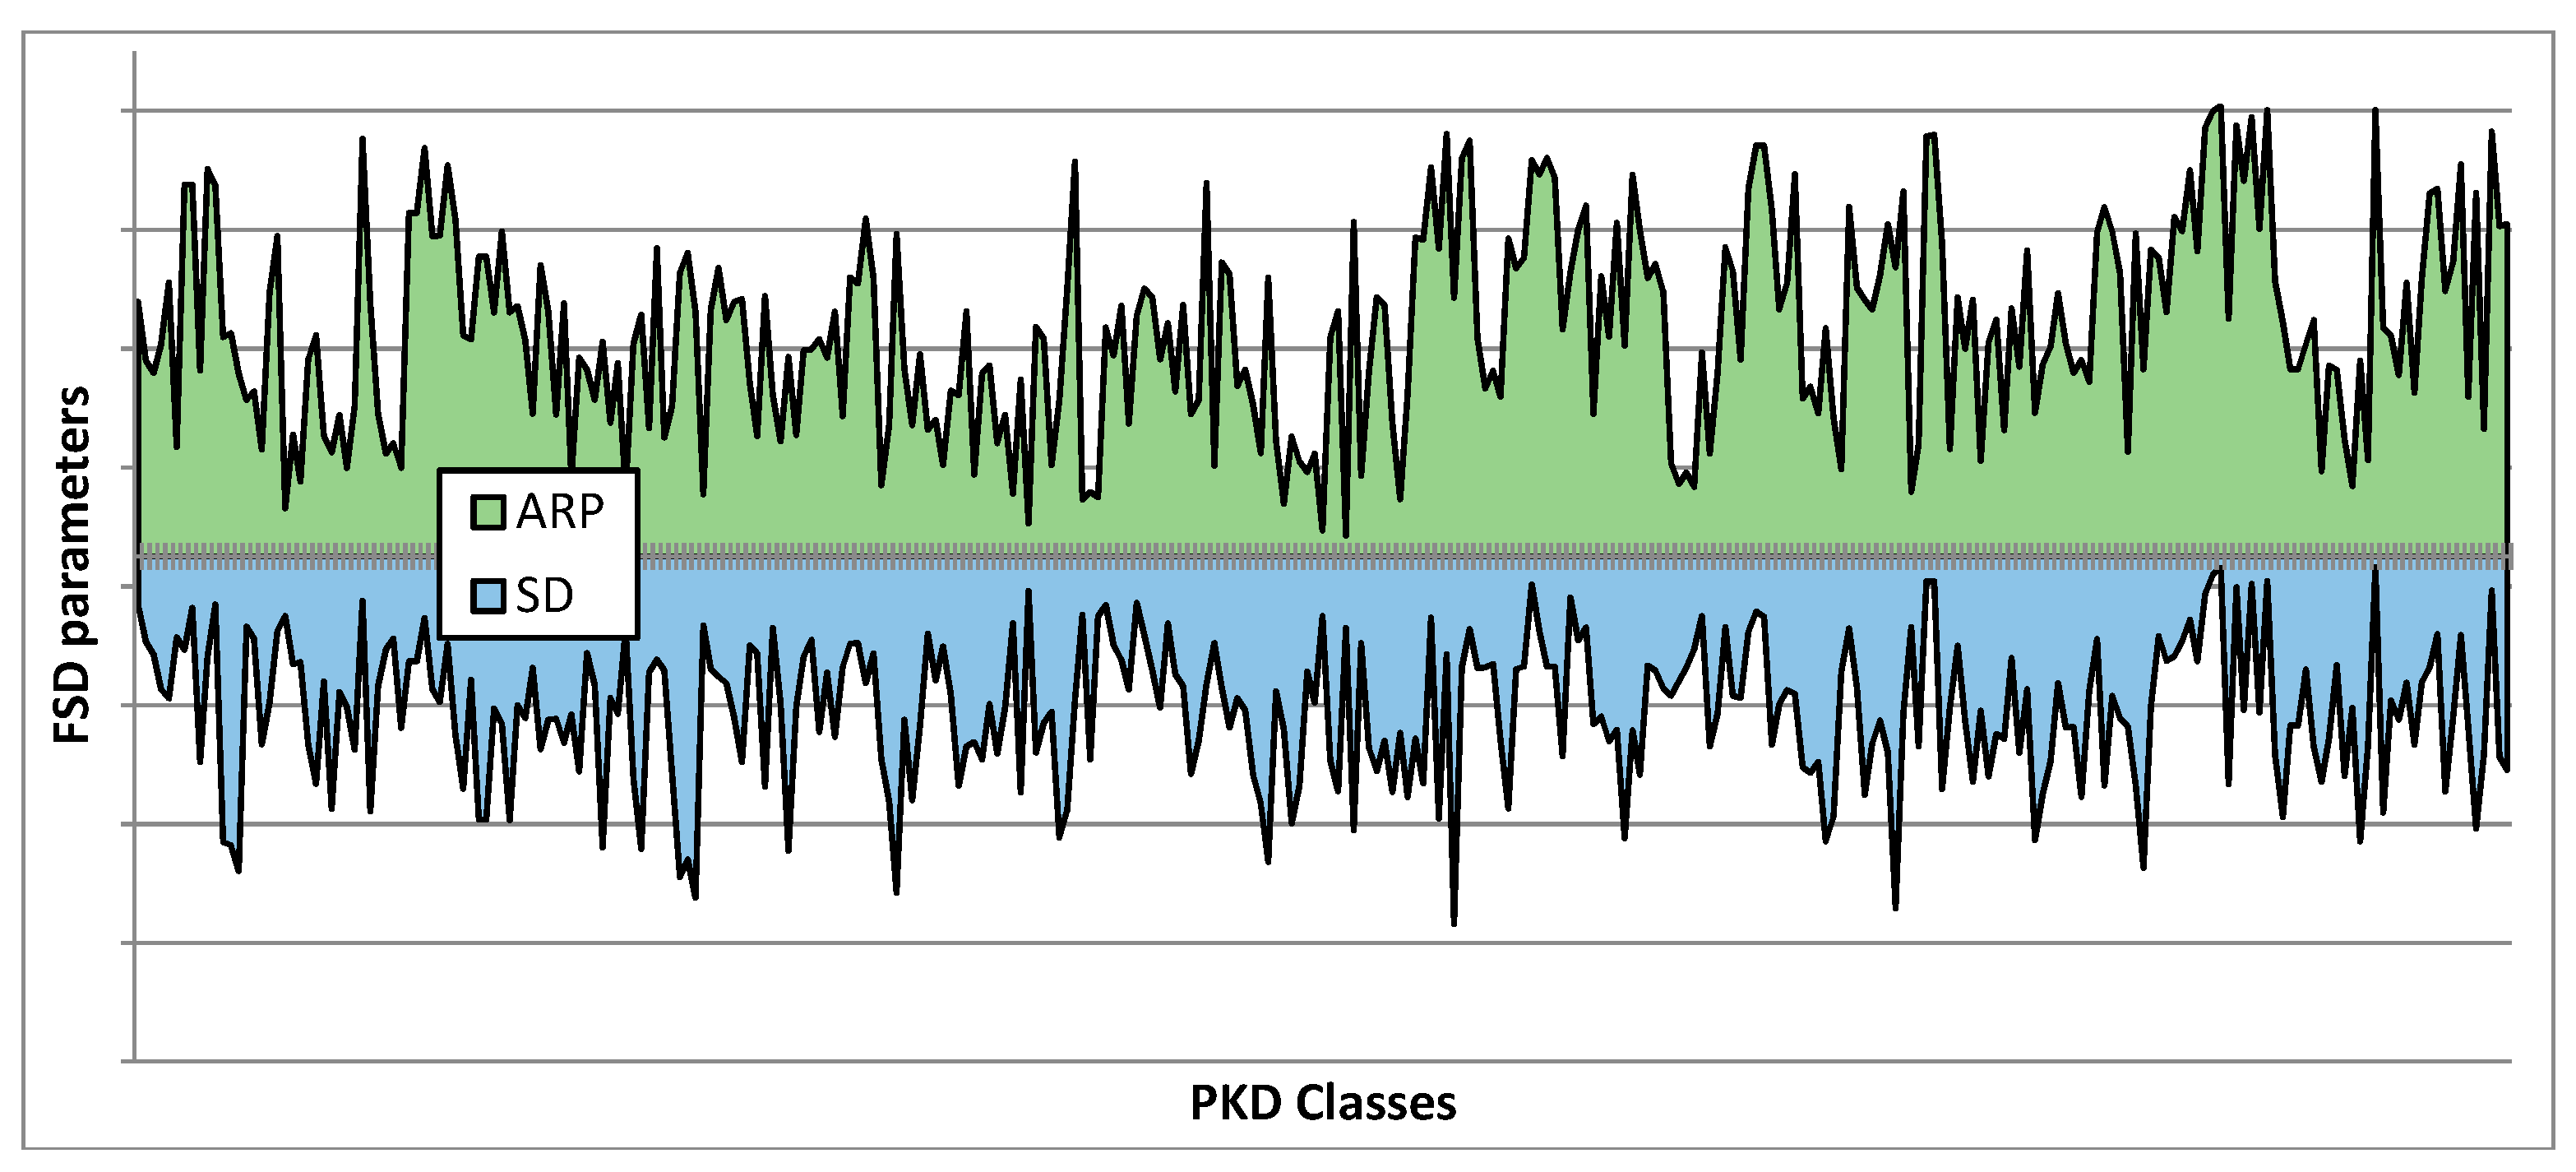
With regard to the financial security of going concern (FSD), factor analysis for PKD classes, aimed to determine their profiles, can be the subject of further in-depth analyses (5-dimensional), while for the purpose of general assessments we can refer to two features describing financial security in a given PKD class—average ranking position (ARP) in a group, and ranking position variation (SD). Differences on average ranking position in PKD classes are considerable: ±67.7 of positions, i.e., 44.0% in relation to an average value in the population. With regard to the SD, its average value is 51.8, and in particular for PKD classes it deviates by ±24.1, i.e., 45.6%.
The value of taxonomic measure of similarity (TMS) of the analysed microstructure for ARP and SD measures (in terms of FSD) was 0.721. Therefore, in this case a thesis of slight similarity of the microstructure can be assumed (
Figure 11).
The two abovementioned analytical areas can be combined on the basis of the previously defined normative patterns (in relation to average ranking position and its variation) simultaneously for MVM and FSD measures as an assessment of the consistency of PKD class profiles in manufacturing enterprises. In the analysed population consistency occurs in 31.6% of PKD classes, the lack of consistency in MVM–FSD positive differences occurs in 34.2%, and the same percentage is recorded for negative differences. Consequently, nearly the same number of PKD classes are characterised by the same MVM–FSD pattern as in the case of the dominance of MVM positions over FSD, and vice versa (with regard to normative patterns) (
Figure 12).
Key consideration: (5) the compatibility of the profile patterns of manufacturing enterprises’ microstructures in the context of value creation and financial security is not strongly opposed to their considerable diversity.
5. Conclusions
The microeconomic studies of the populations of enterprises are very rare due to such limiting factors as access, scope and the complexity of data. The results presented in the paper focus on the value creation mechanism related to company owners, and transferred to an economic system. The second area of research concerns the financial security of going concern. The major question and objective of the study is an assessment of bringing balance between value creation and financial security—are there any positive effects of value creation and financial security sustainable management?
The detailed research findings, based on the obtained results and their assessment, allow for formulating the following confirmed main consideration (Hypothesis 0)—there is a directly proportional relationship (strong, positive and statistically significant correlation) between the effects of the value creation process (MVM) and the ensuring of financial security (FSD) in manufacturing enterprises—the confirmation of the principle of sustainable management.
The specific assessments can be given as follows (the points are corresponding to the partial hypotheses 1–5):
the development of manufacturing enterprises, assessed on the basis of value creation (MVM), is marked by recurring cycles which are consistent with the factors which affect them (ROE and VAR),
the value accruing to the owners (ROE) is the main determinant of value creation, accompanied by an increased transmission of value to an economic system (VAR),
in detail, on the ROE side:
- a.
changes in ROA and the equity multiplier (EM) move in opposite directions
- b.
the key determinant of ROE is the ROA factor,
in detail, on the VAR side:
- c.
the directions of changes in the ROS and VAH factors are similar,
- d.
the contribution of ROS and VAH to value added creation (VAR) is equivalent,
changes in financial security (FSD) occur in recurring cycles, and are contrary to the level of its variation,
the distribution of financial security determinants changes over time, with the lowest impact of asset productivity (capital circulation),
in detail, on the FSD side:
- e.
the most stable situation in terms of bankruptcy (PBP) is in manufacturing enterprises (in relation to other activities),
- f.
trends in PBP and FSD are compatible,
the compatibility of the profile patterns of manufacturing enterprises’ microstructures in the context of value creation and financial security is not strongly opposed to their considerable diversity.
In light of the above findings and conclusions presented in the discussion of results, it can be assumed that the formulated hypotheses are positively verified—both the main hypothesis and partial hypotheses. The reliability of the presented evidence results from the fact that the research study covers all manufacturing enterprises (a comprehensive study not based on a statistical sample) in 2007–2018, covered by public statistics, with more than 9 employees. Therefore, the research study can be treated as unique and covering the broadest possible range of objects.
References made in the paper exclusively to a financial approach to assessing the balanced effects of value creation and the financial security of going concern as the result of sustainable management set certain limitations of the research—its scope, specificity, as well as the range of measurements and interpretation of results. These limitations are mainly determined by the adopted epistemological approach—the objective of a company’s existence is to achieve financial results. Undoubtedly, such an approach can be regarded as controversial, but it contributes to the universal character of the conducted research—which is its major objective, determining the adoption of the employed methodology.
The concept of research presented in the paper provides a universal tool for assessing the balanced effects of two major corporate management processes—value creation and financial security of going concern. Currently, corporate value is understood from the perspective of outlays and their effects. As a result, this value is associated with a company’s ability to increase return on invested capital. Frequently, it leads to a sort of value creation “race”—at any cost, regardless of the possible threats posed by the employment of this strategy. Even if executives’ activities do not assume the form of “a race for value”, the obvious dilemma is still the choice between intensified corporate value creation and the financial security of going concern. According to classic theories, the use of financial support mechanisms (financial leverage) and the resulting indebtedness may lead to the loss of liquidity and insolvency. Such a threat should be detected by an early warning system, but only by a system developed within a company. Such a system is founded on threat prediction methods and, currently appreciated for their efficiency, logit models. Such a methodological solution is offered in this paper to company executives. Simultaneously, the paper proposes an effective tool for measuring value creation with a broad understanding of value as internal and external value, which is similar to the idea of value for a company’s broadly understood stakeholders: the environment, society and an economic system.
The significant thesis proved in this paper, related to the characteristics of manufacturing enterprises, is the degree of consistency of their profiles with value creation and financial security of going concern. This consistency is recorded for 31.6% of the analysed population, but only 10.4% of entities are marked by “high assessment of value—high assessment of security”, which are the features of sustainable management leaders.
Further research will focus on analysing changes in the remaining company core activities (construction, transportation, information and communication, trade, services) and on formulating general conclusions for the entire populations of enterprises (over 50 thousand entities). Moreover, considering suggestions with regard to further analyses, future research will focus on comparisons by company size (small, medium, large), and the characteristics of different business profiles and strategies. Further research will require the acquisition of new analytical data.


