The Sustainability of Reclaimed Asphalt as a Resource for Road Pavement Management through a Circular Economic Model


Abstract
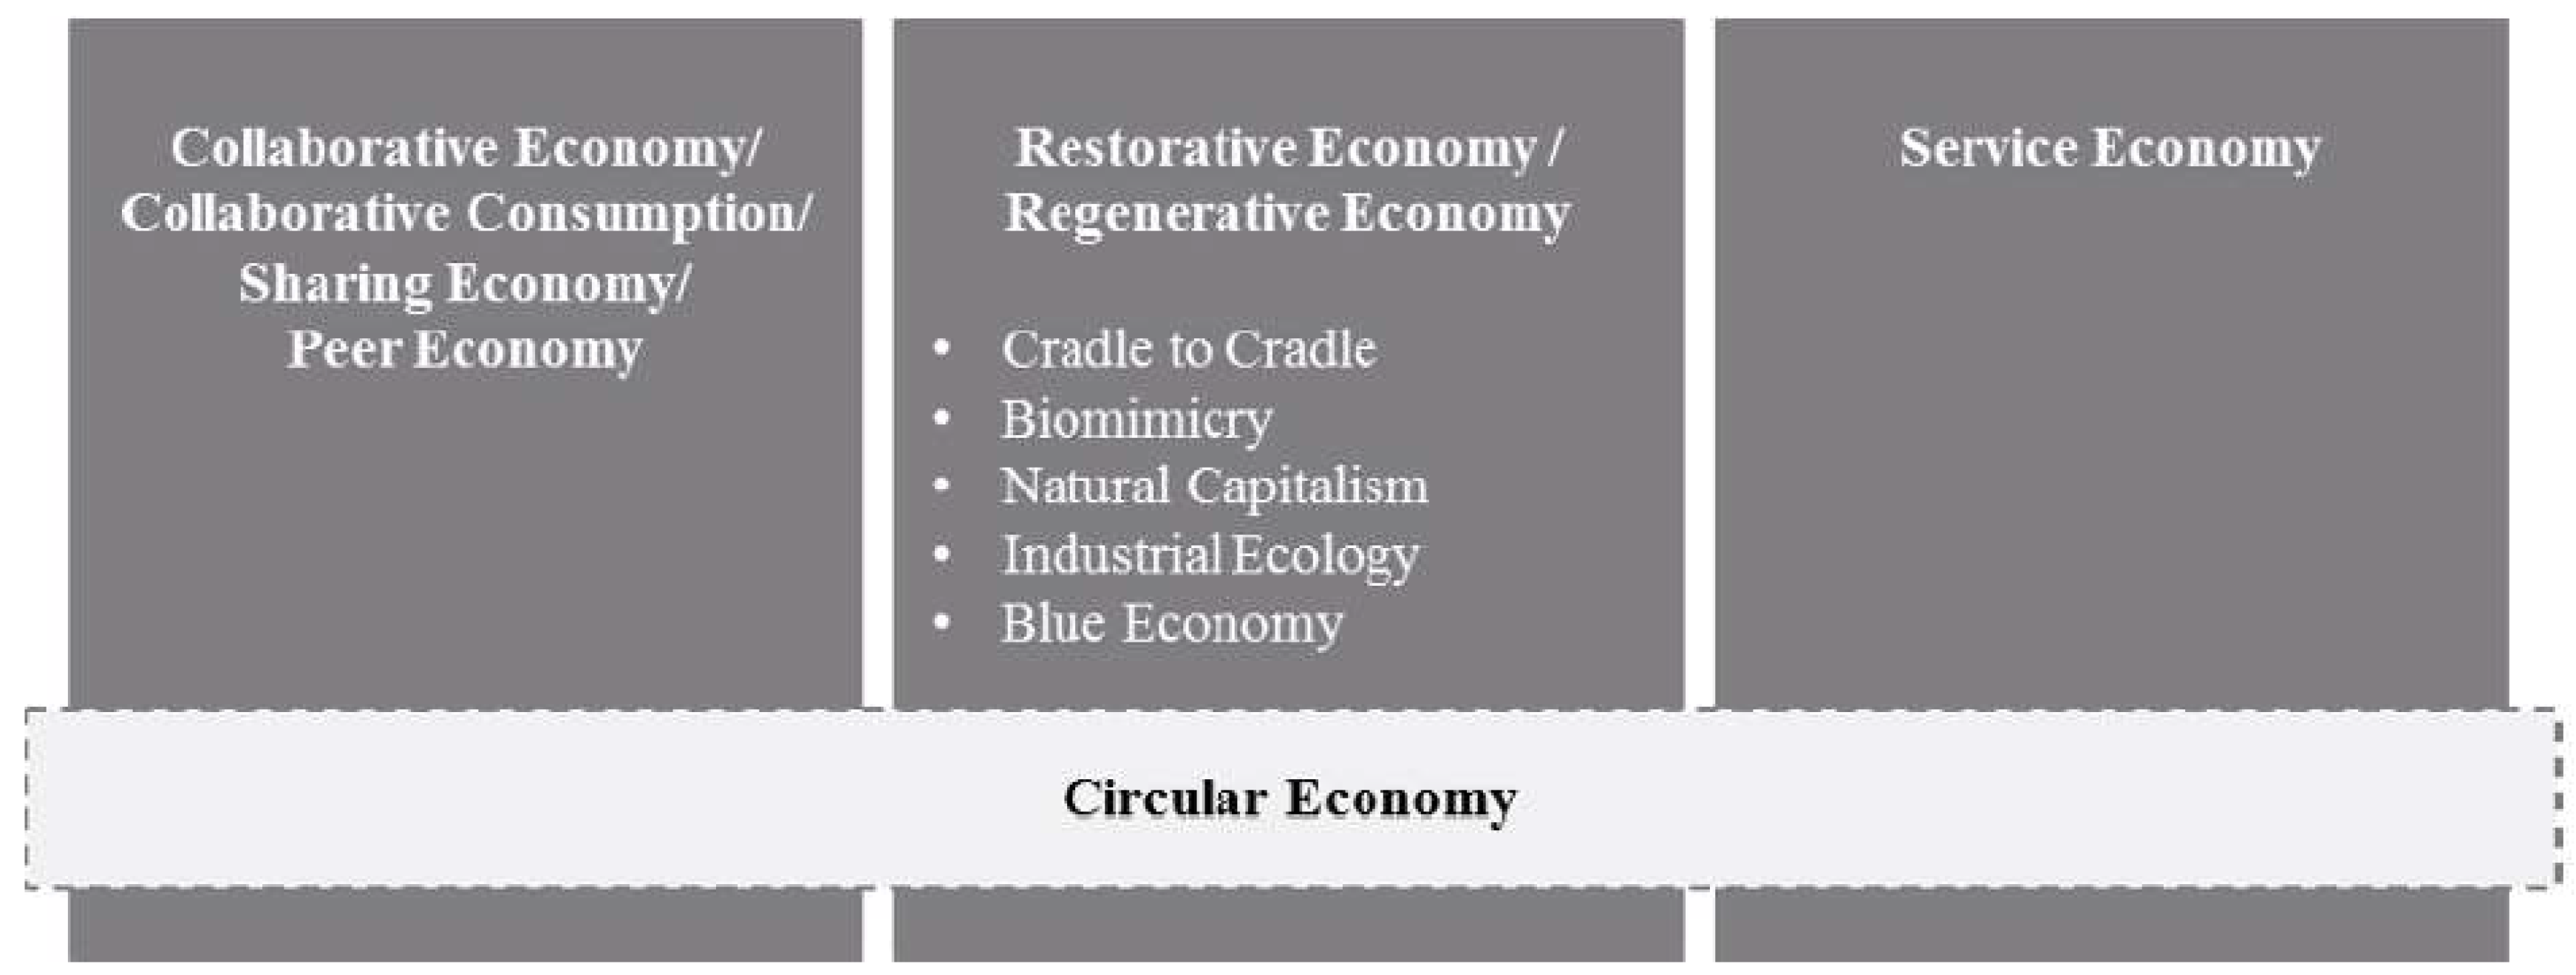
1. Introduction
- Design out waste and pollution: This includes the detection and exclusion of the negative externalities of economic activities, which can cause damage to human health and ecosystems, by minimizing the emission of toxic substances, greenhouse gases, and eliminating water, air, and land pollution.
- Keep products, components, and materials at their highest value and in use: Adapting the design process to support the reuse, the remanufacturing, and the recycling of components and materials, biological or technical, in order to keep them in circulation within the same or another product system. In circular systems, it is possible to maximize the use and the value of various components that have been designed in such a way by cascading them into different applications or product systems [11].
2. Scope and Objectives
3. Methods
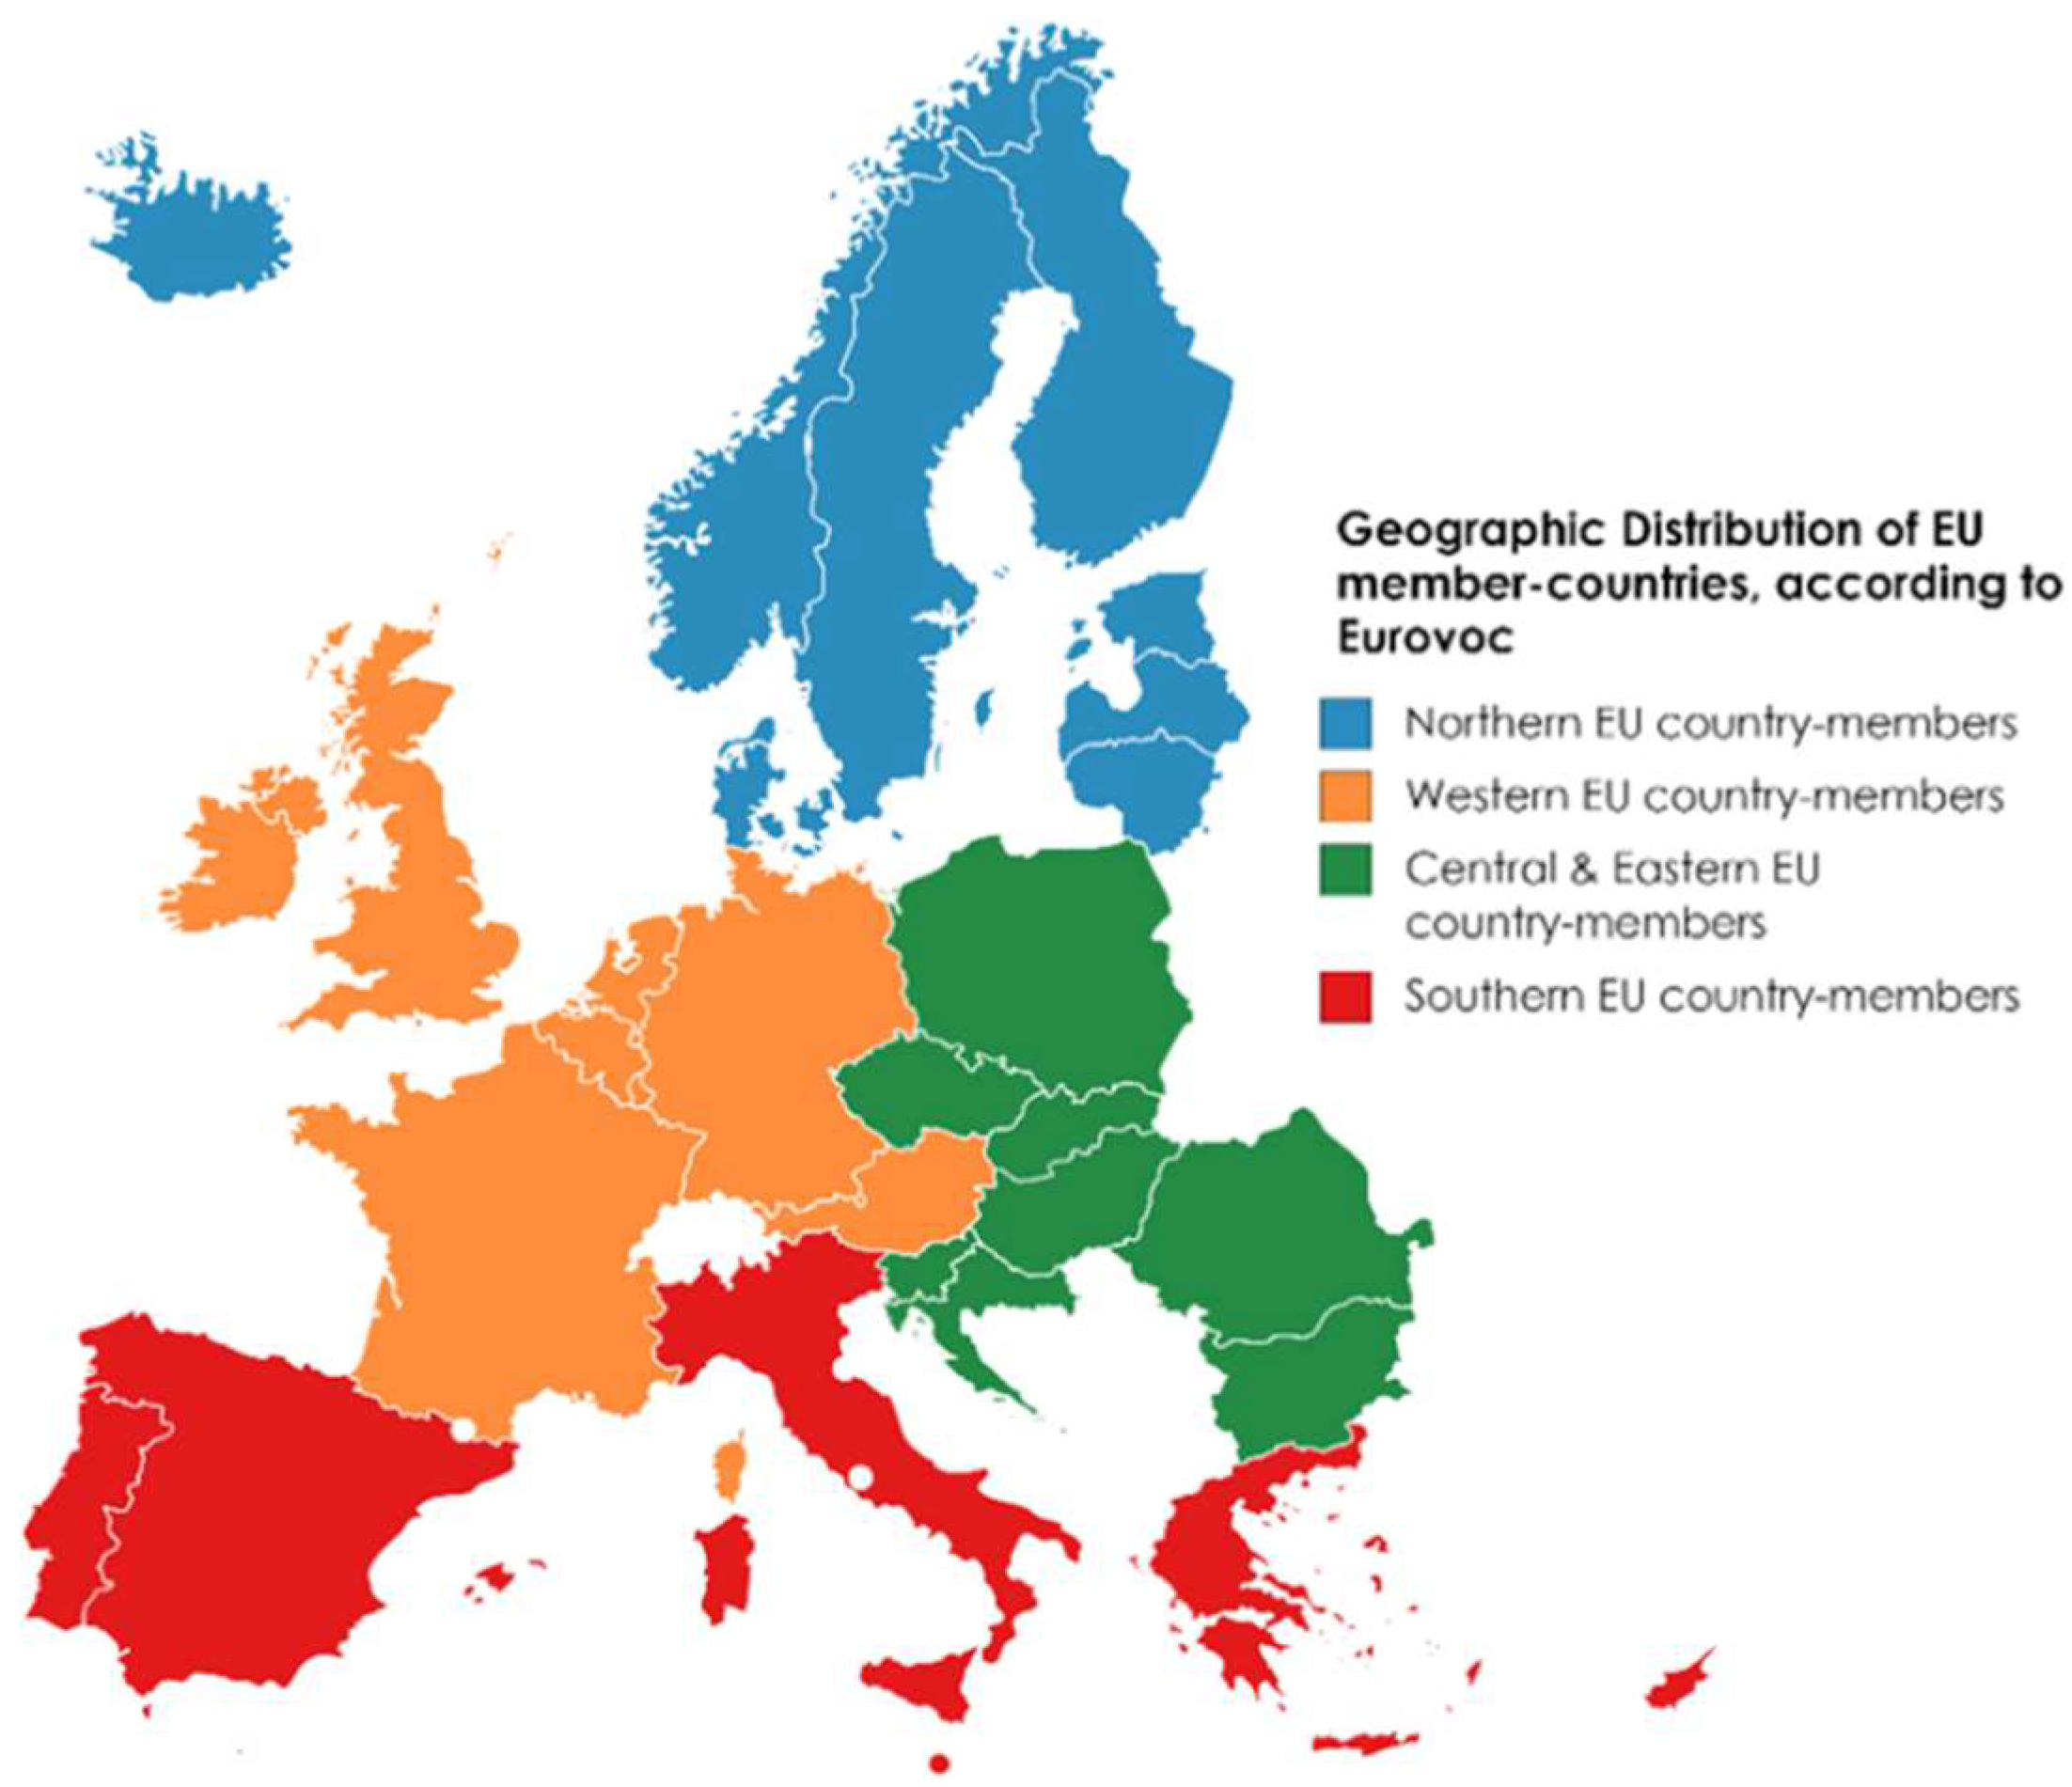
3.1. The Current State of Hot and Warm Mix Asphalt Production and Reclaimed Asphalt Exploitation in the European Union
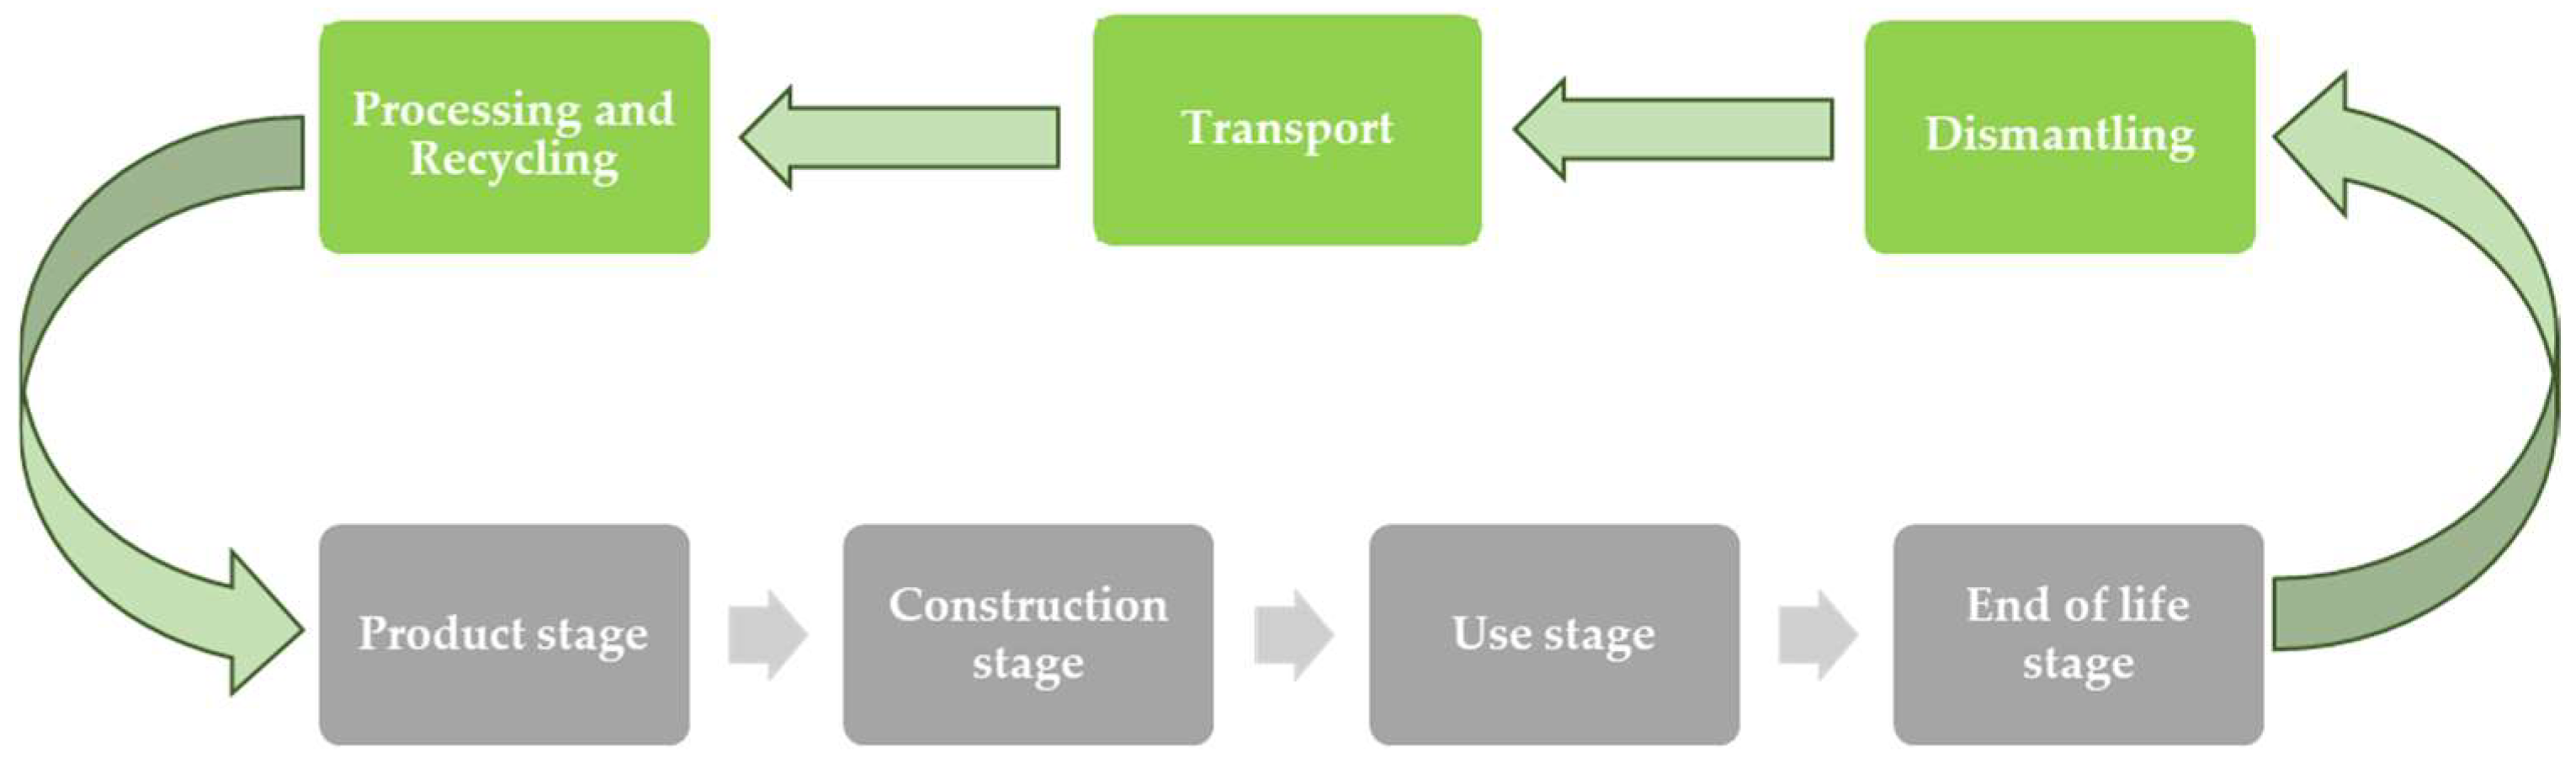
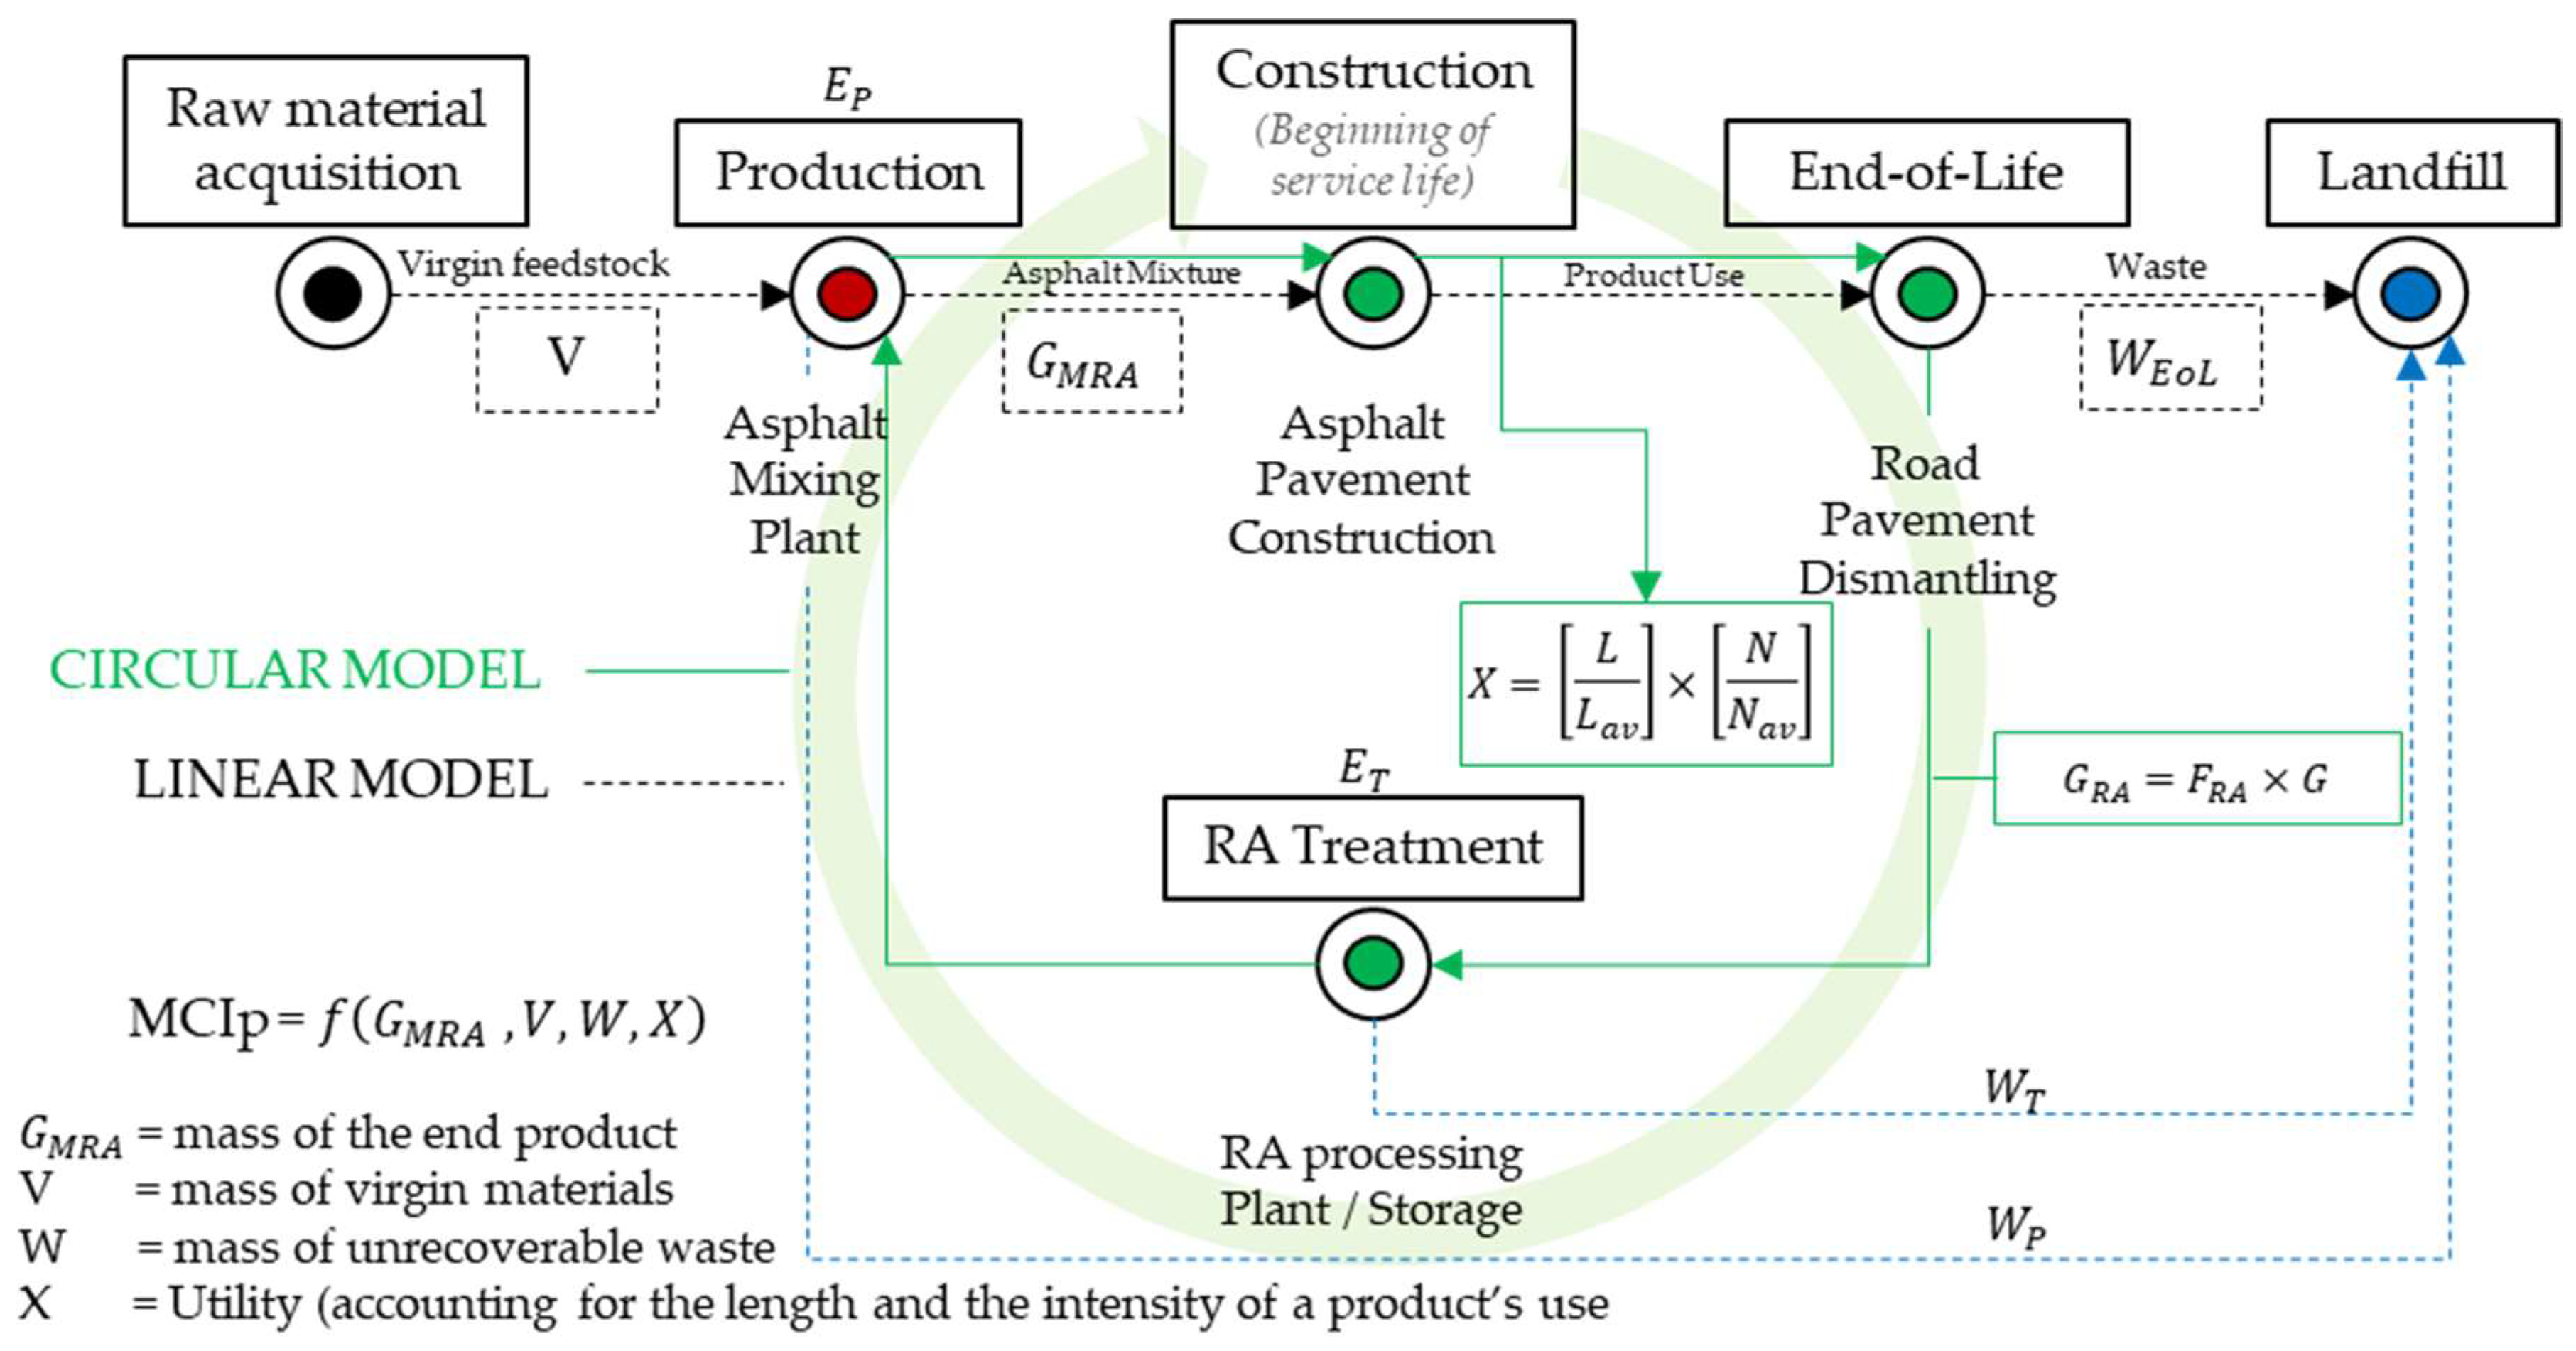
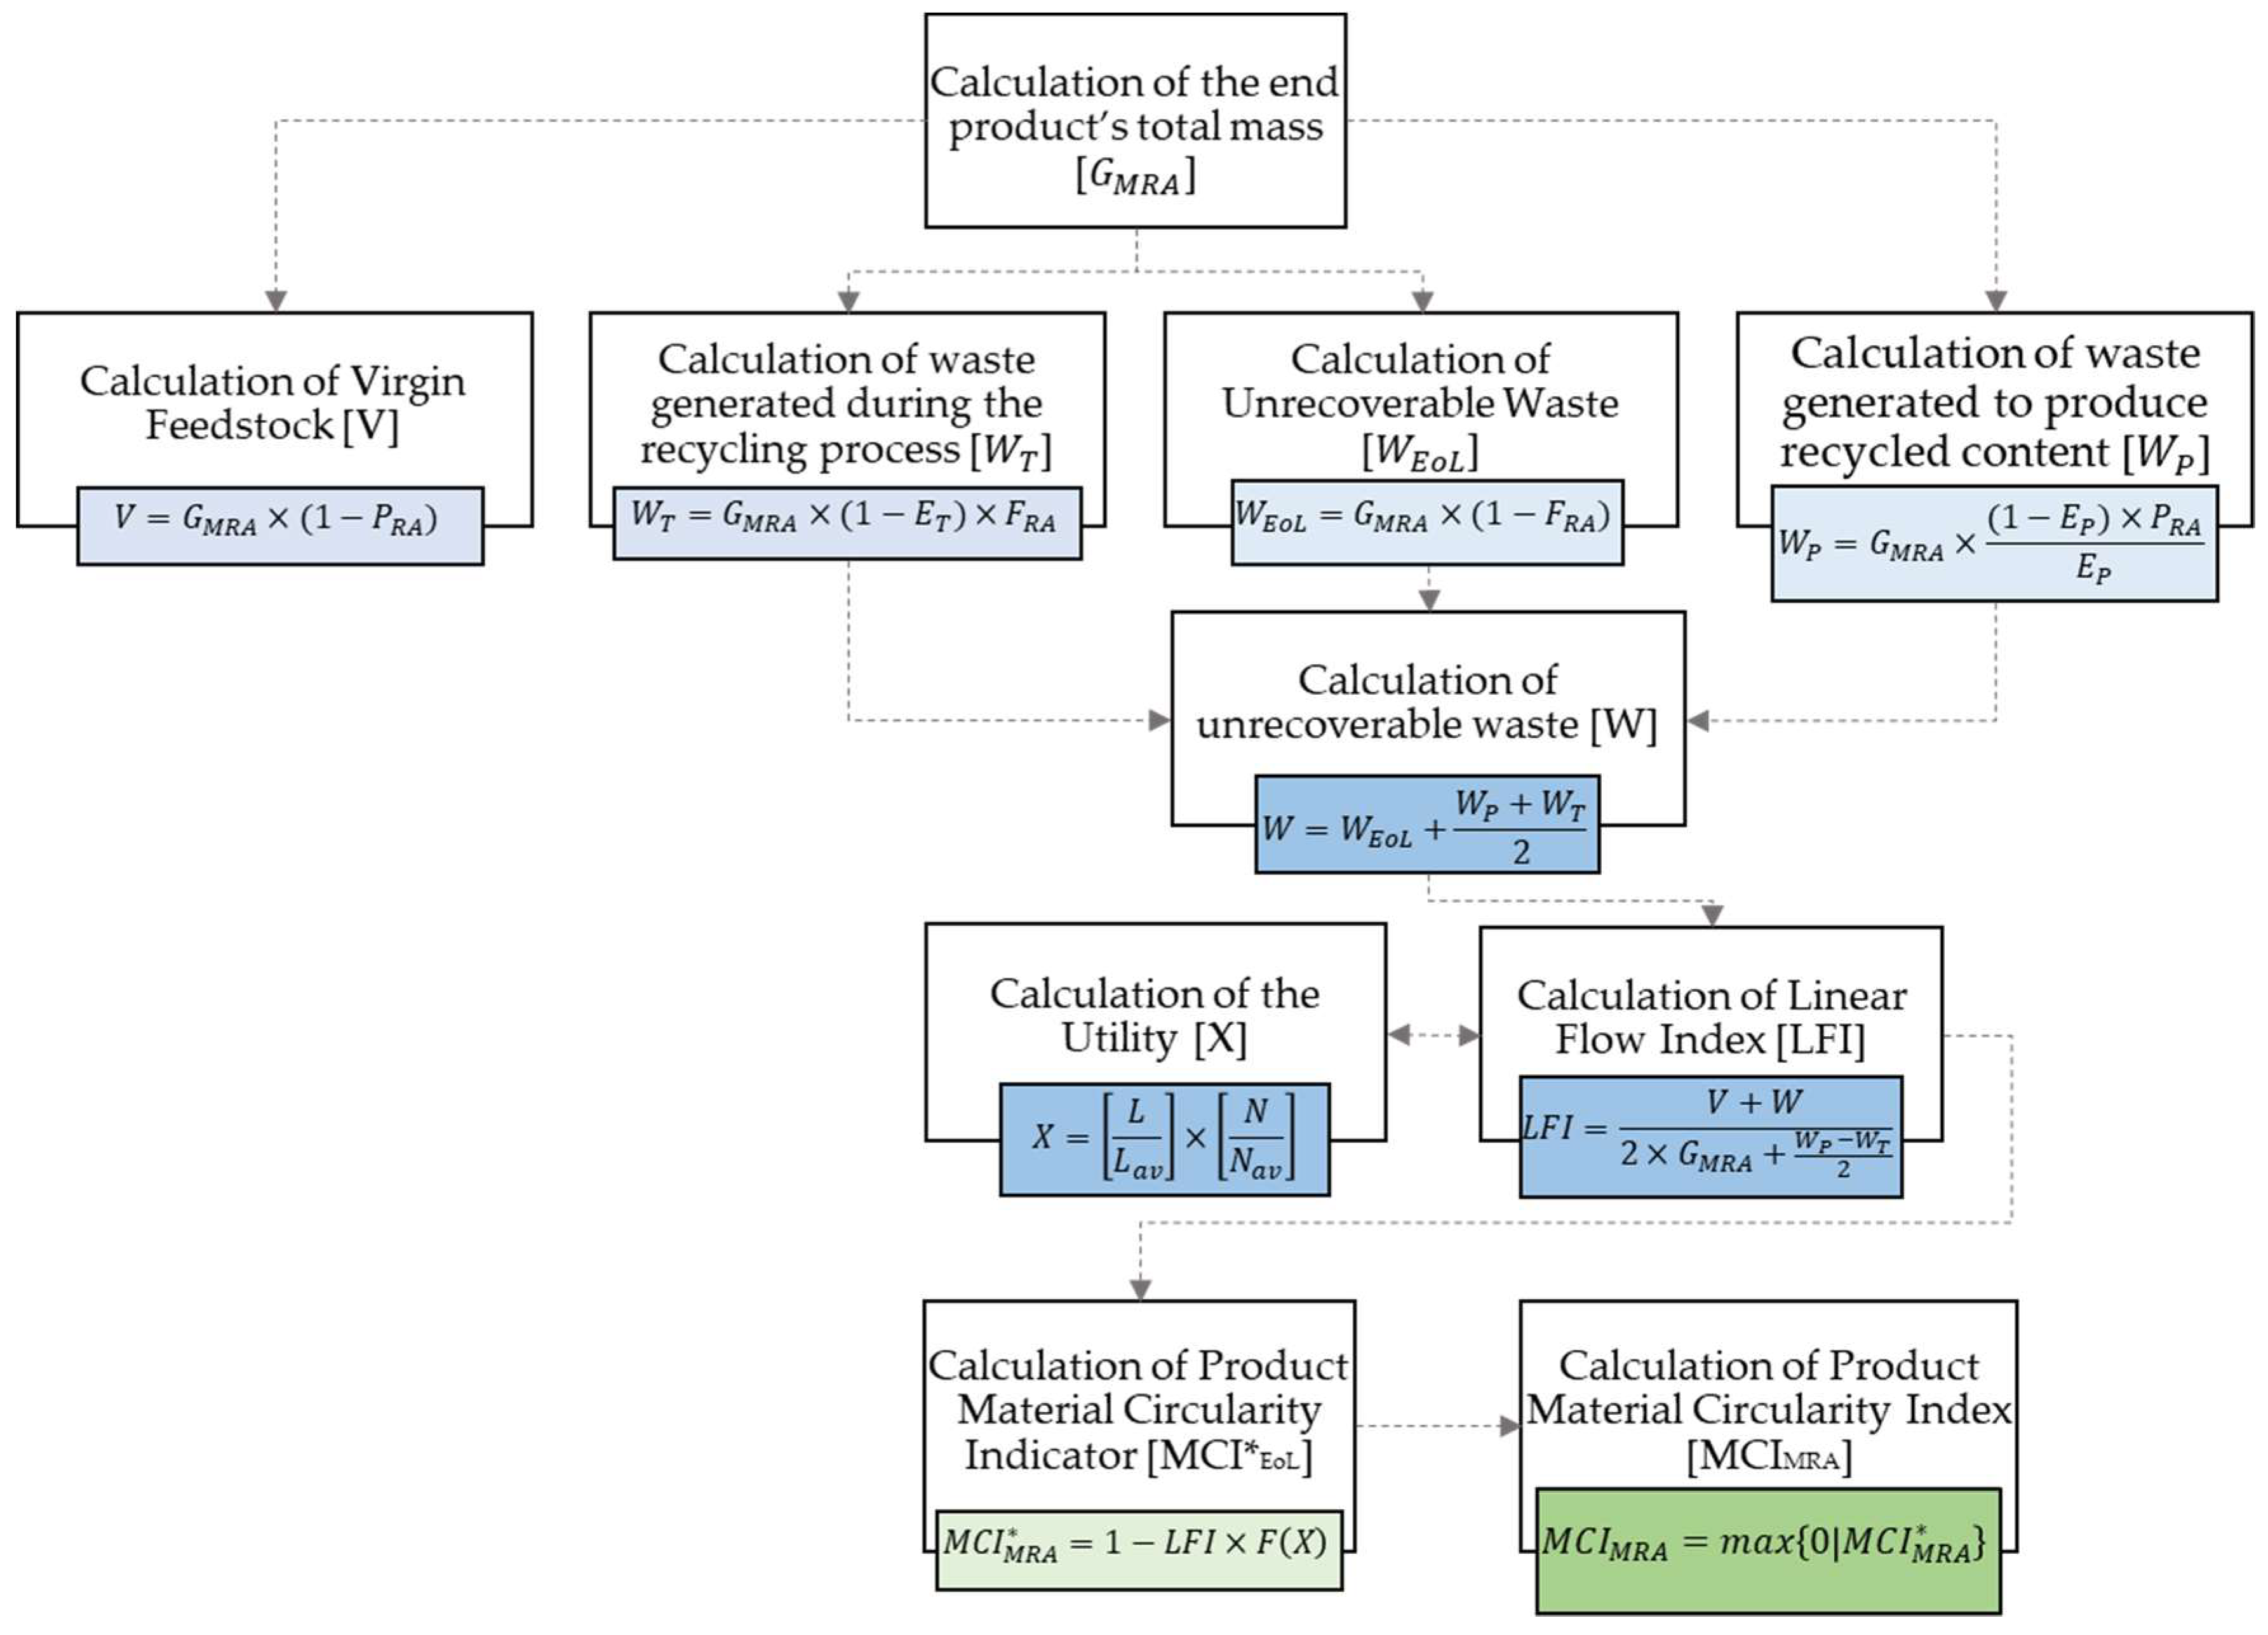
3.2. Implementing a Circular Economic Model for Asphalt Mixtures with Reclaimed Asphalt
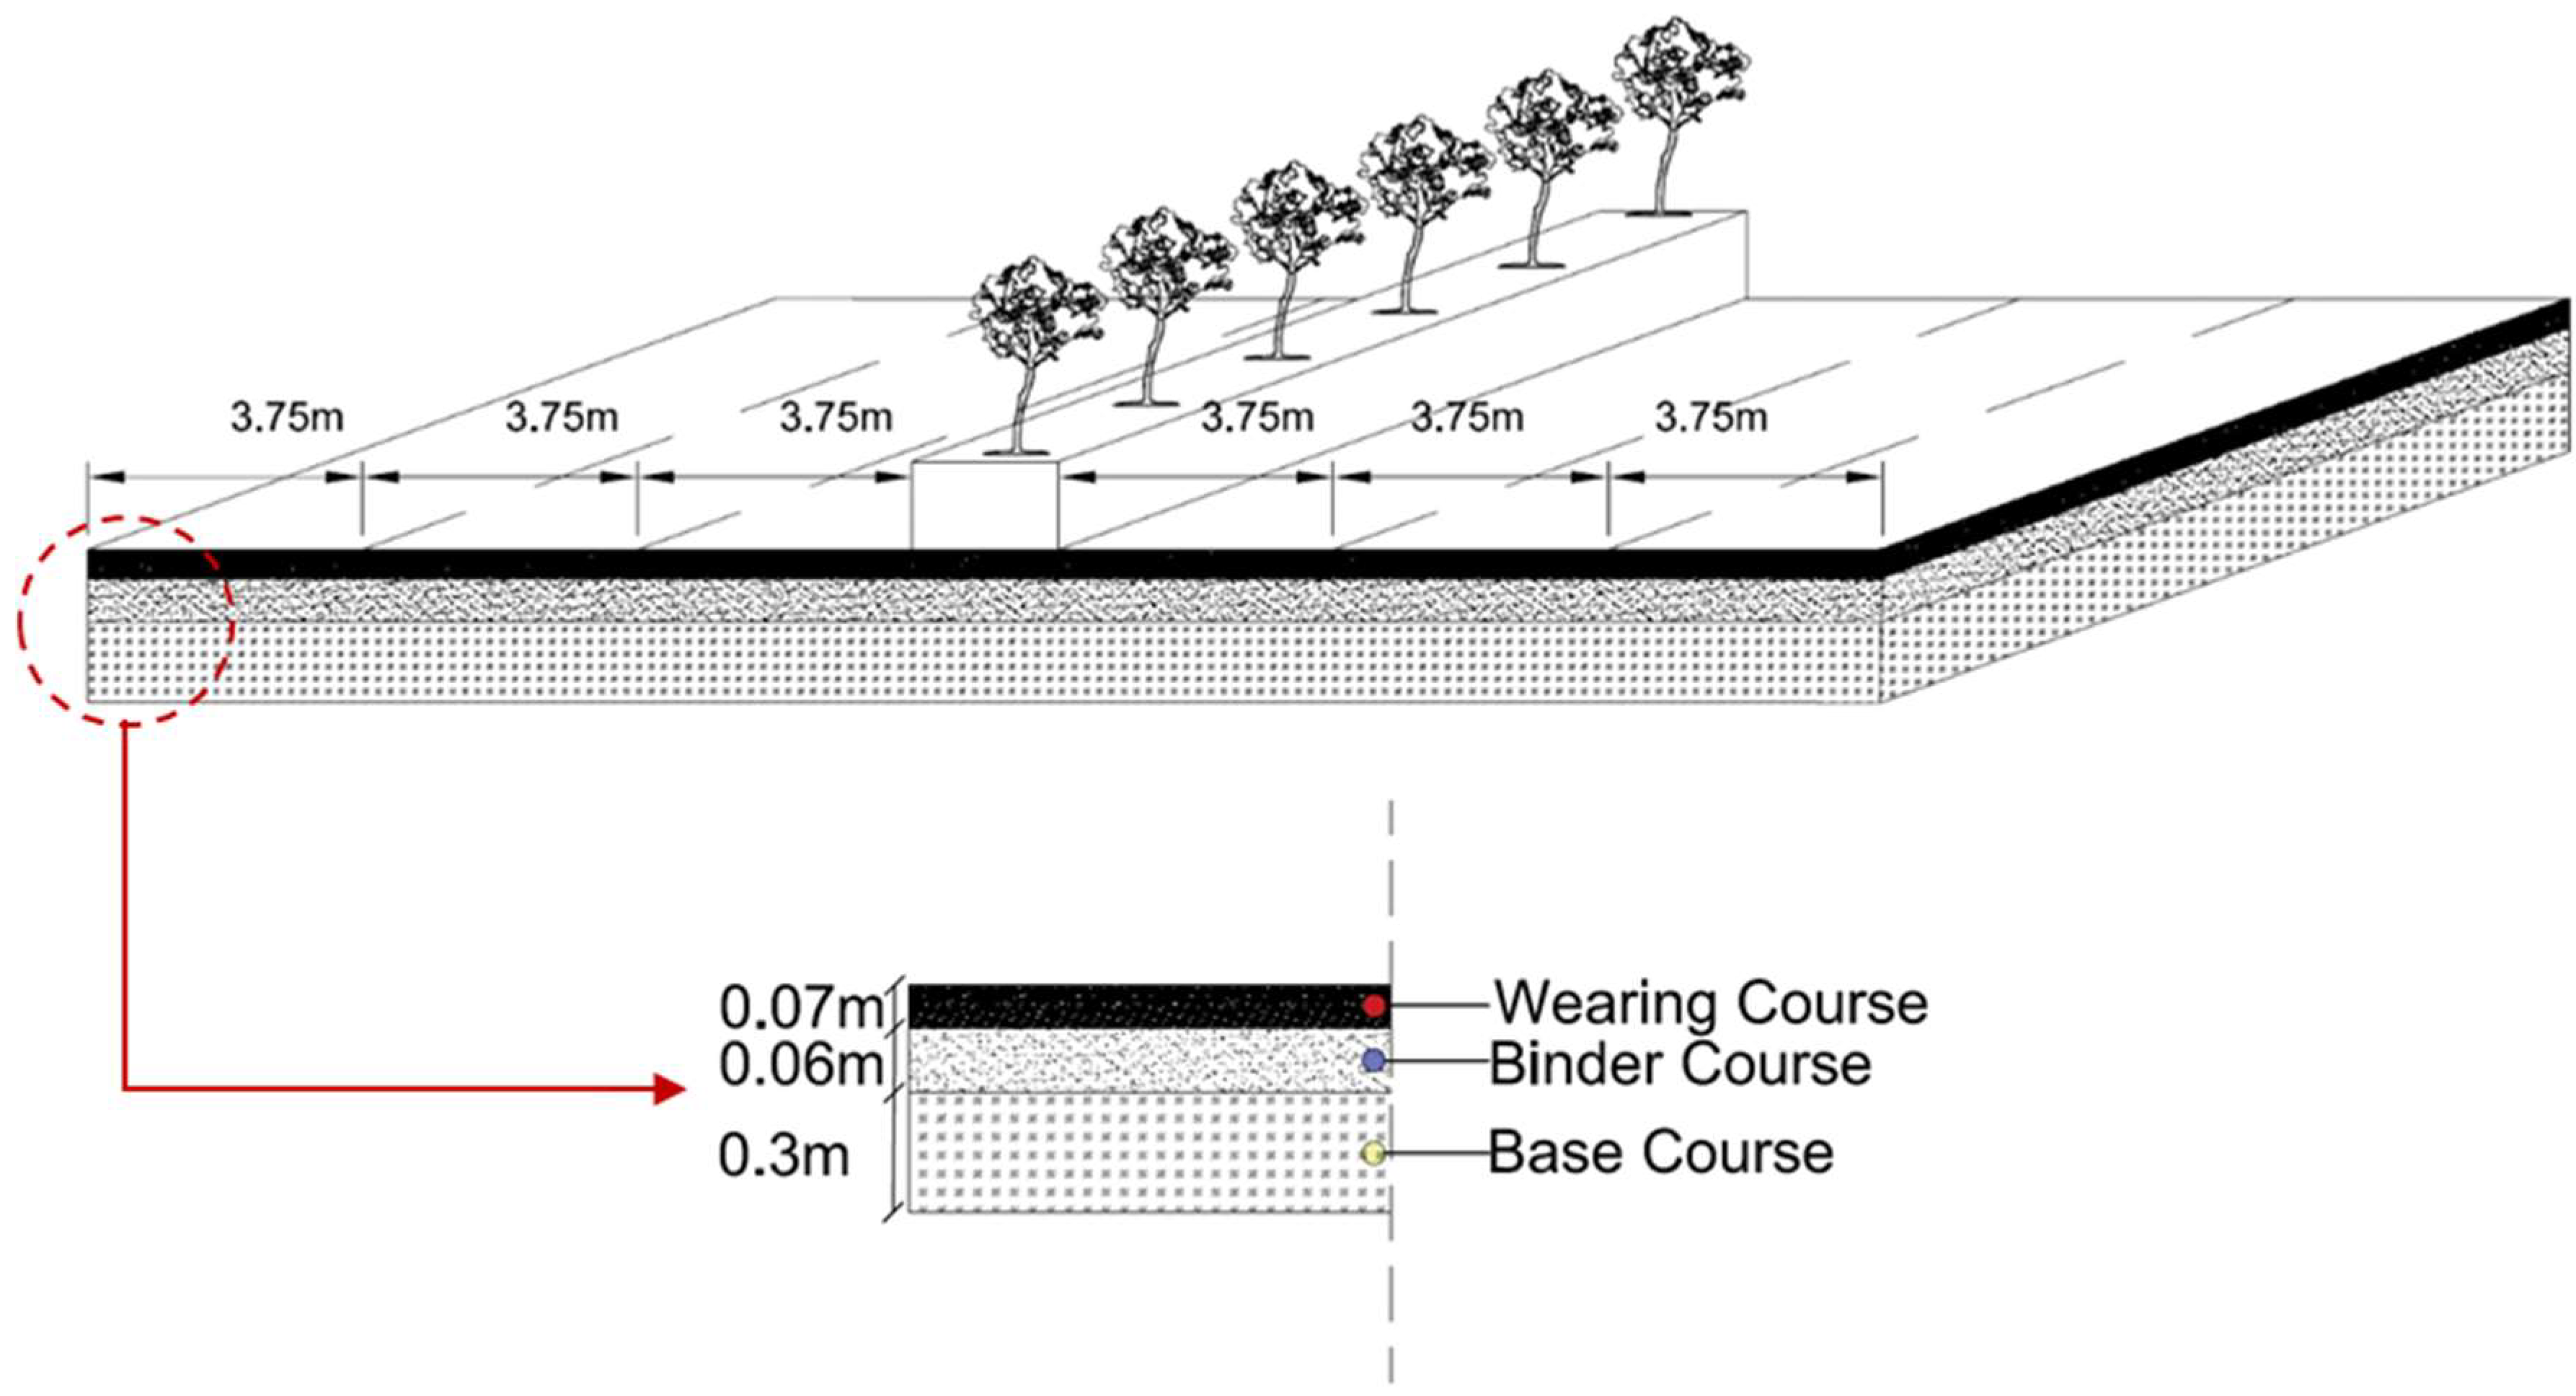
3.3. Quantifying the MCIMRA of the Italian Motorway Pavement: A Case Study
4. Results and Discussion
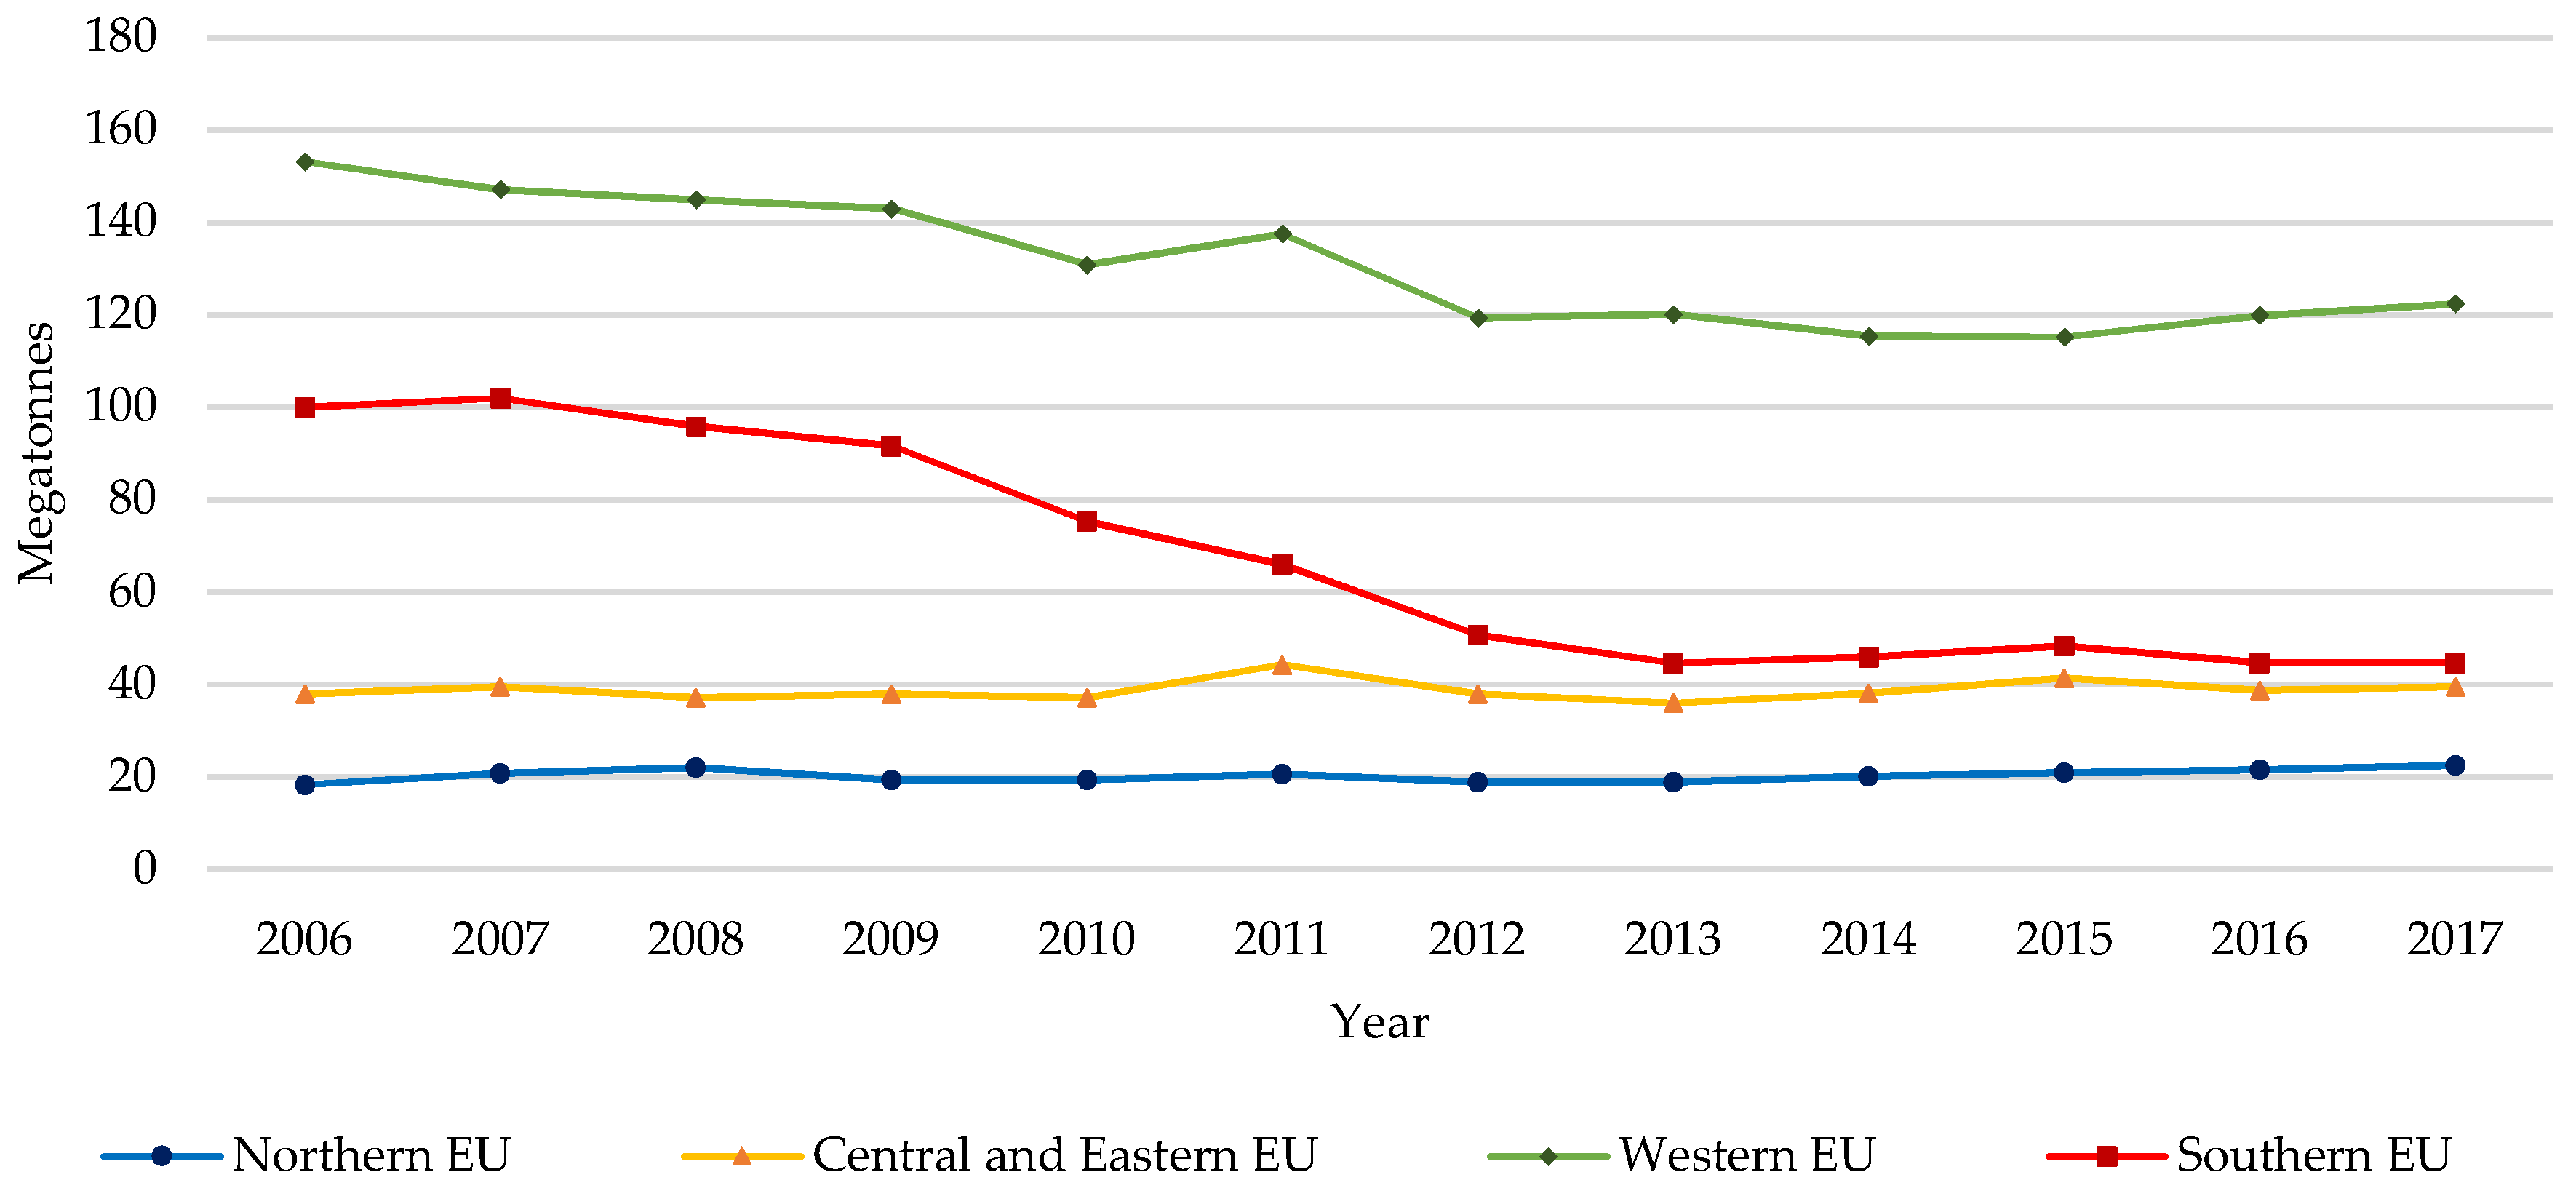
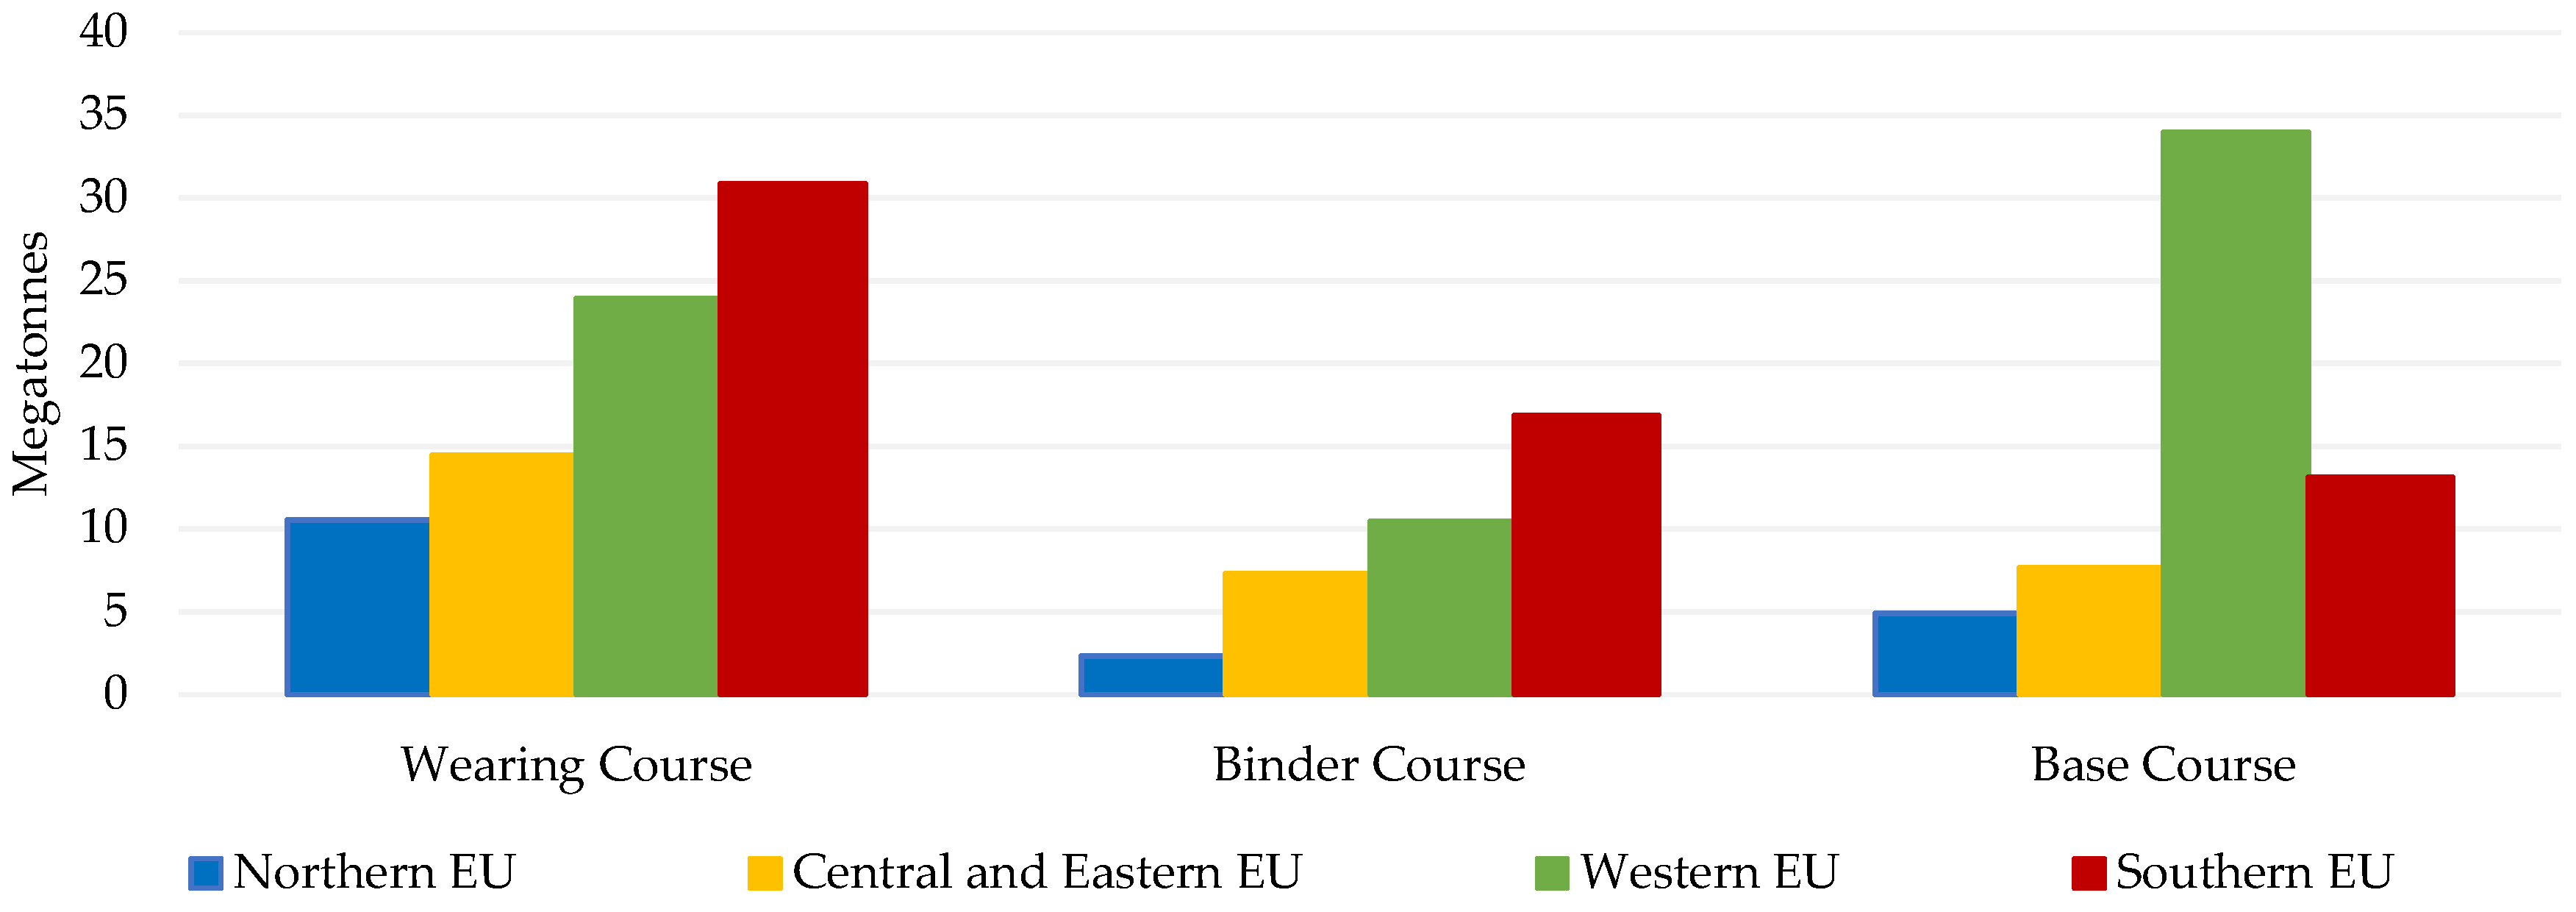
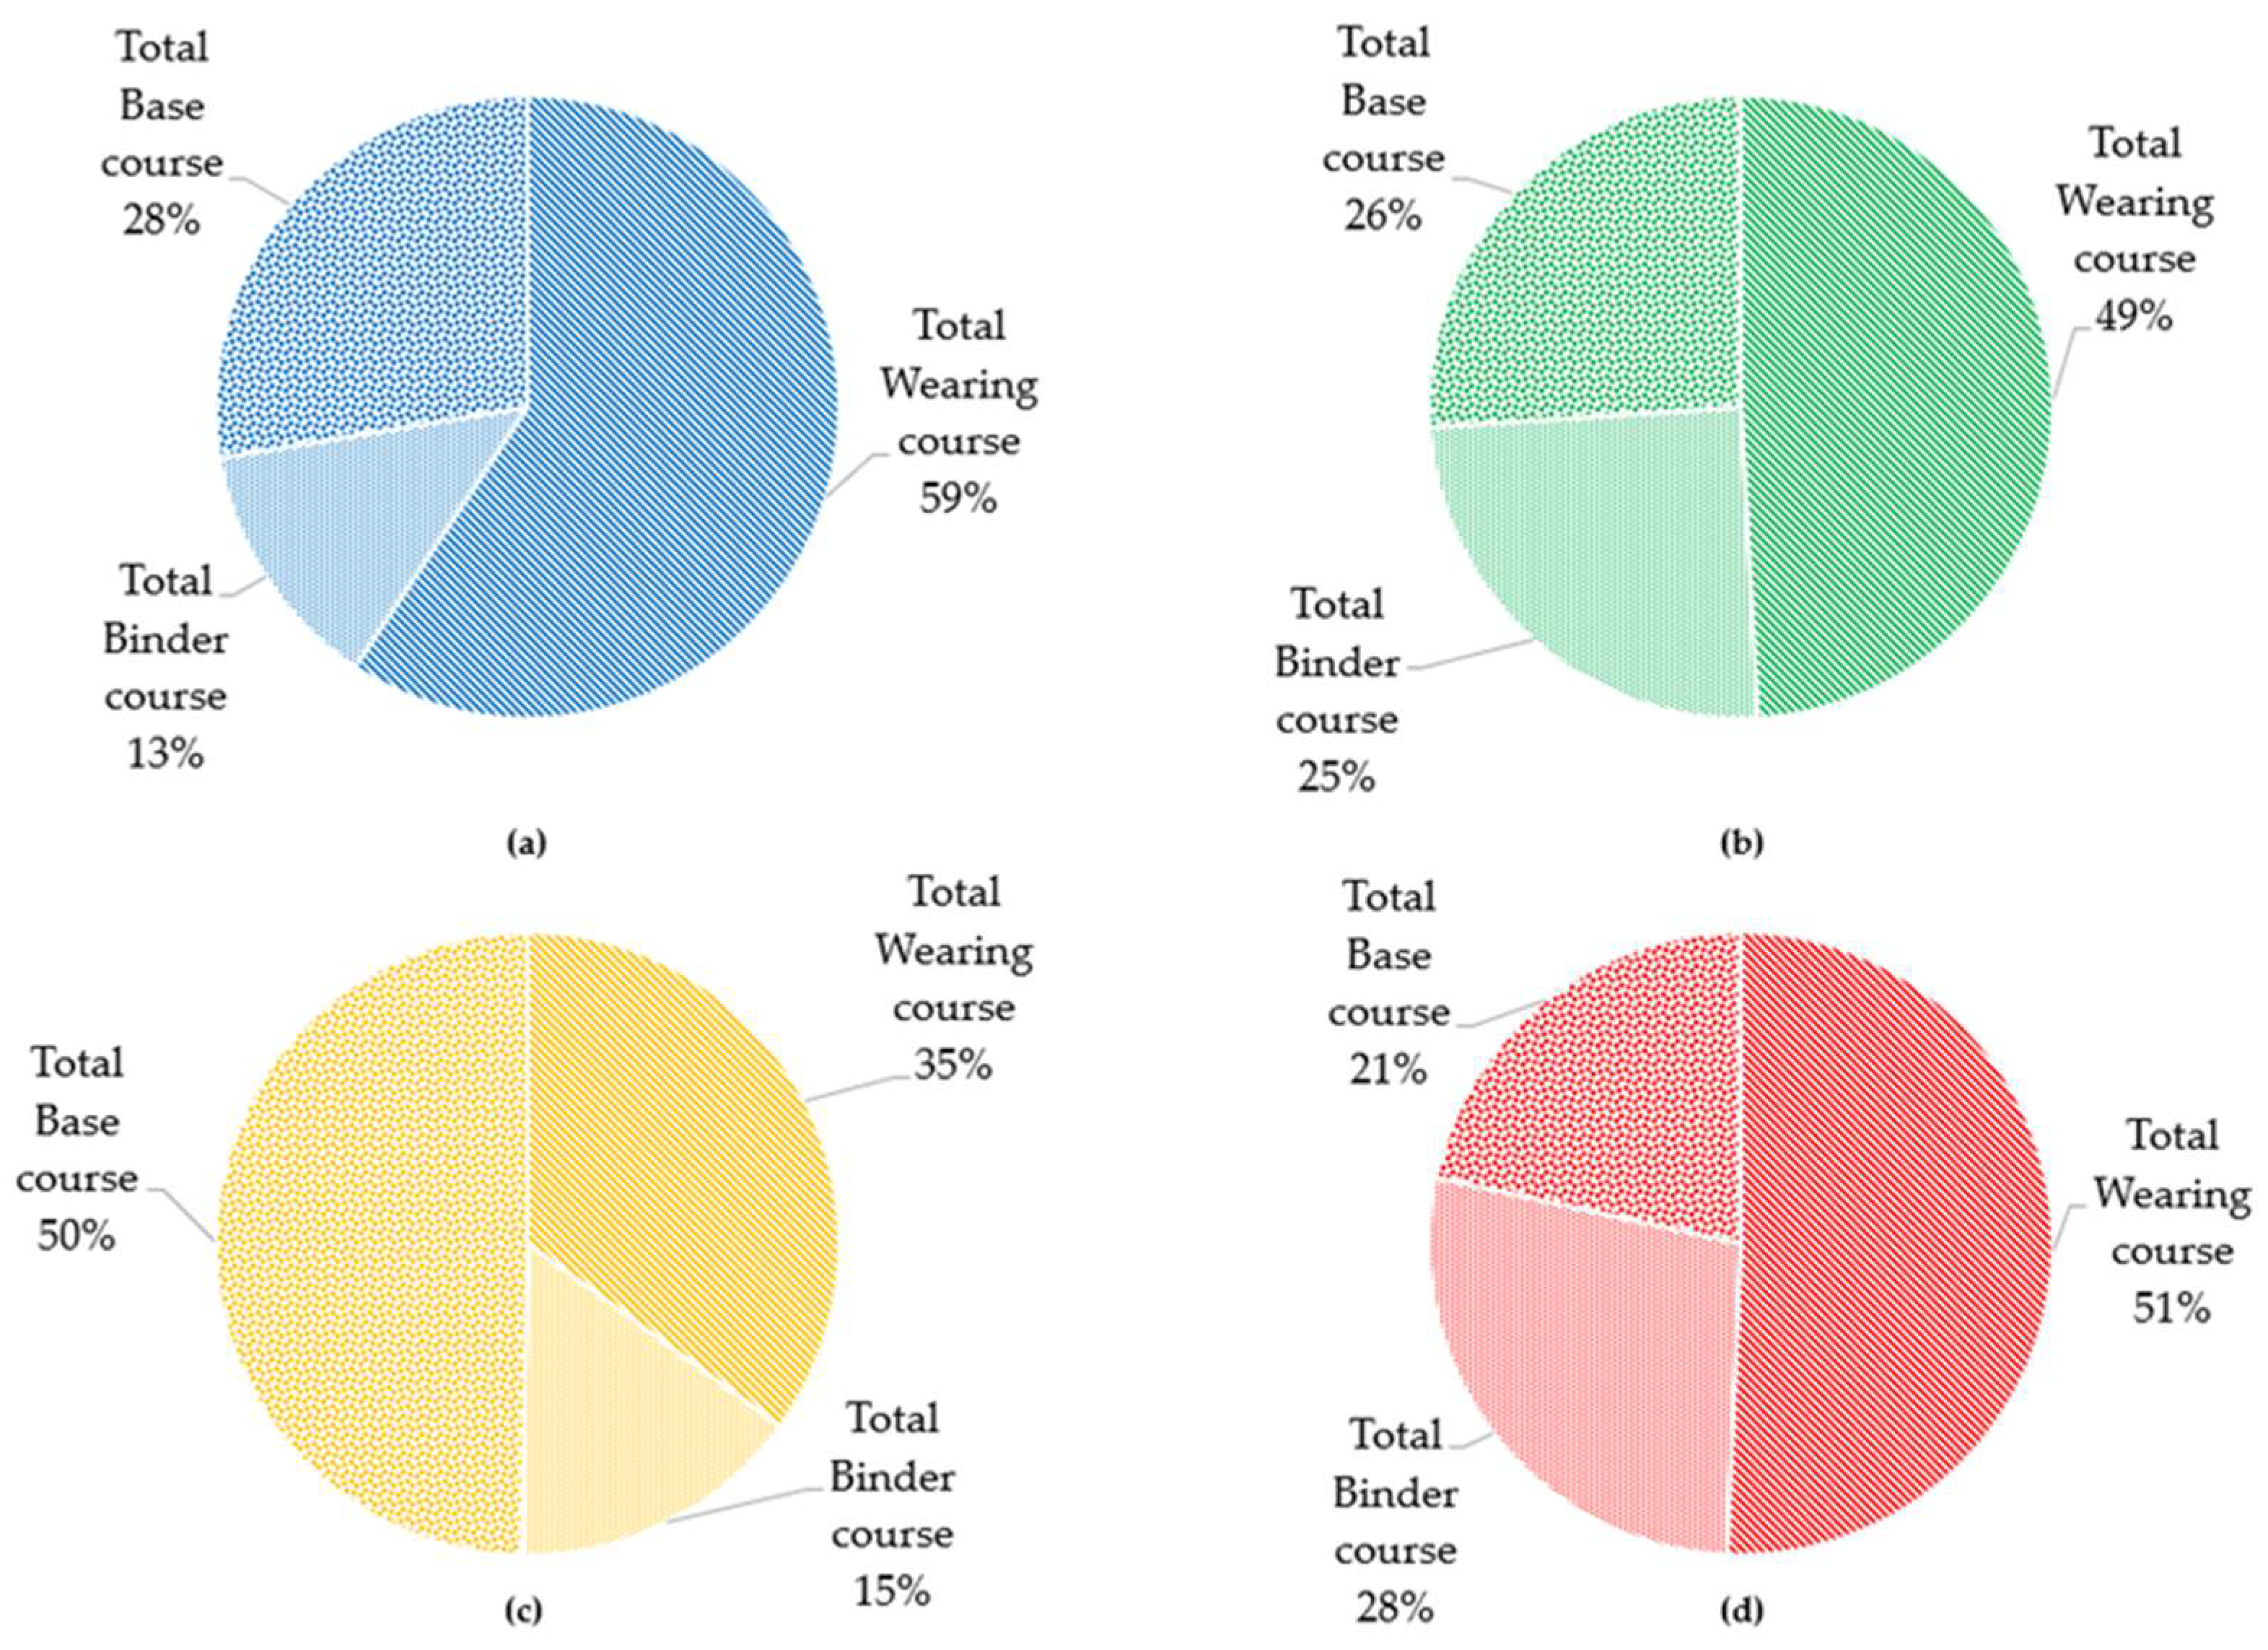
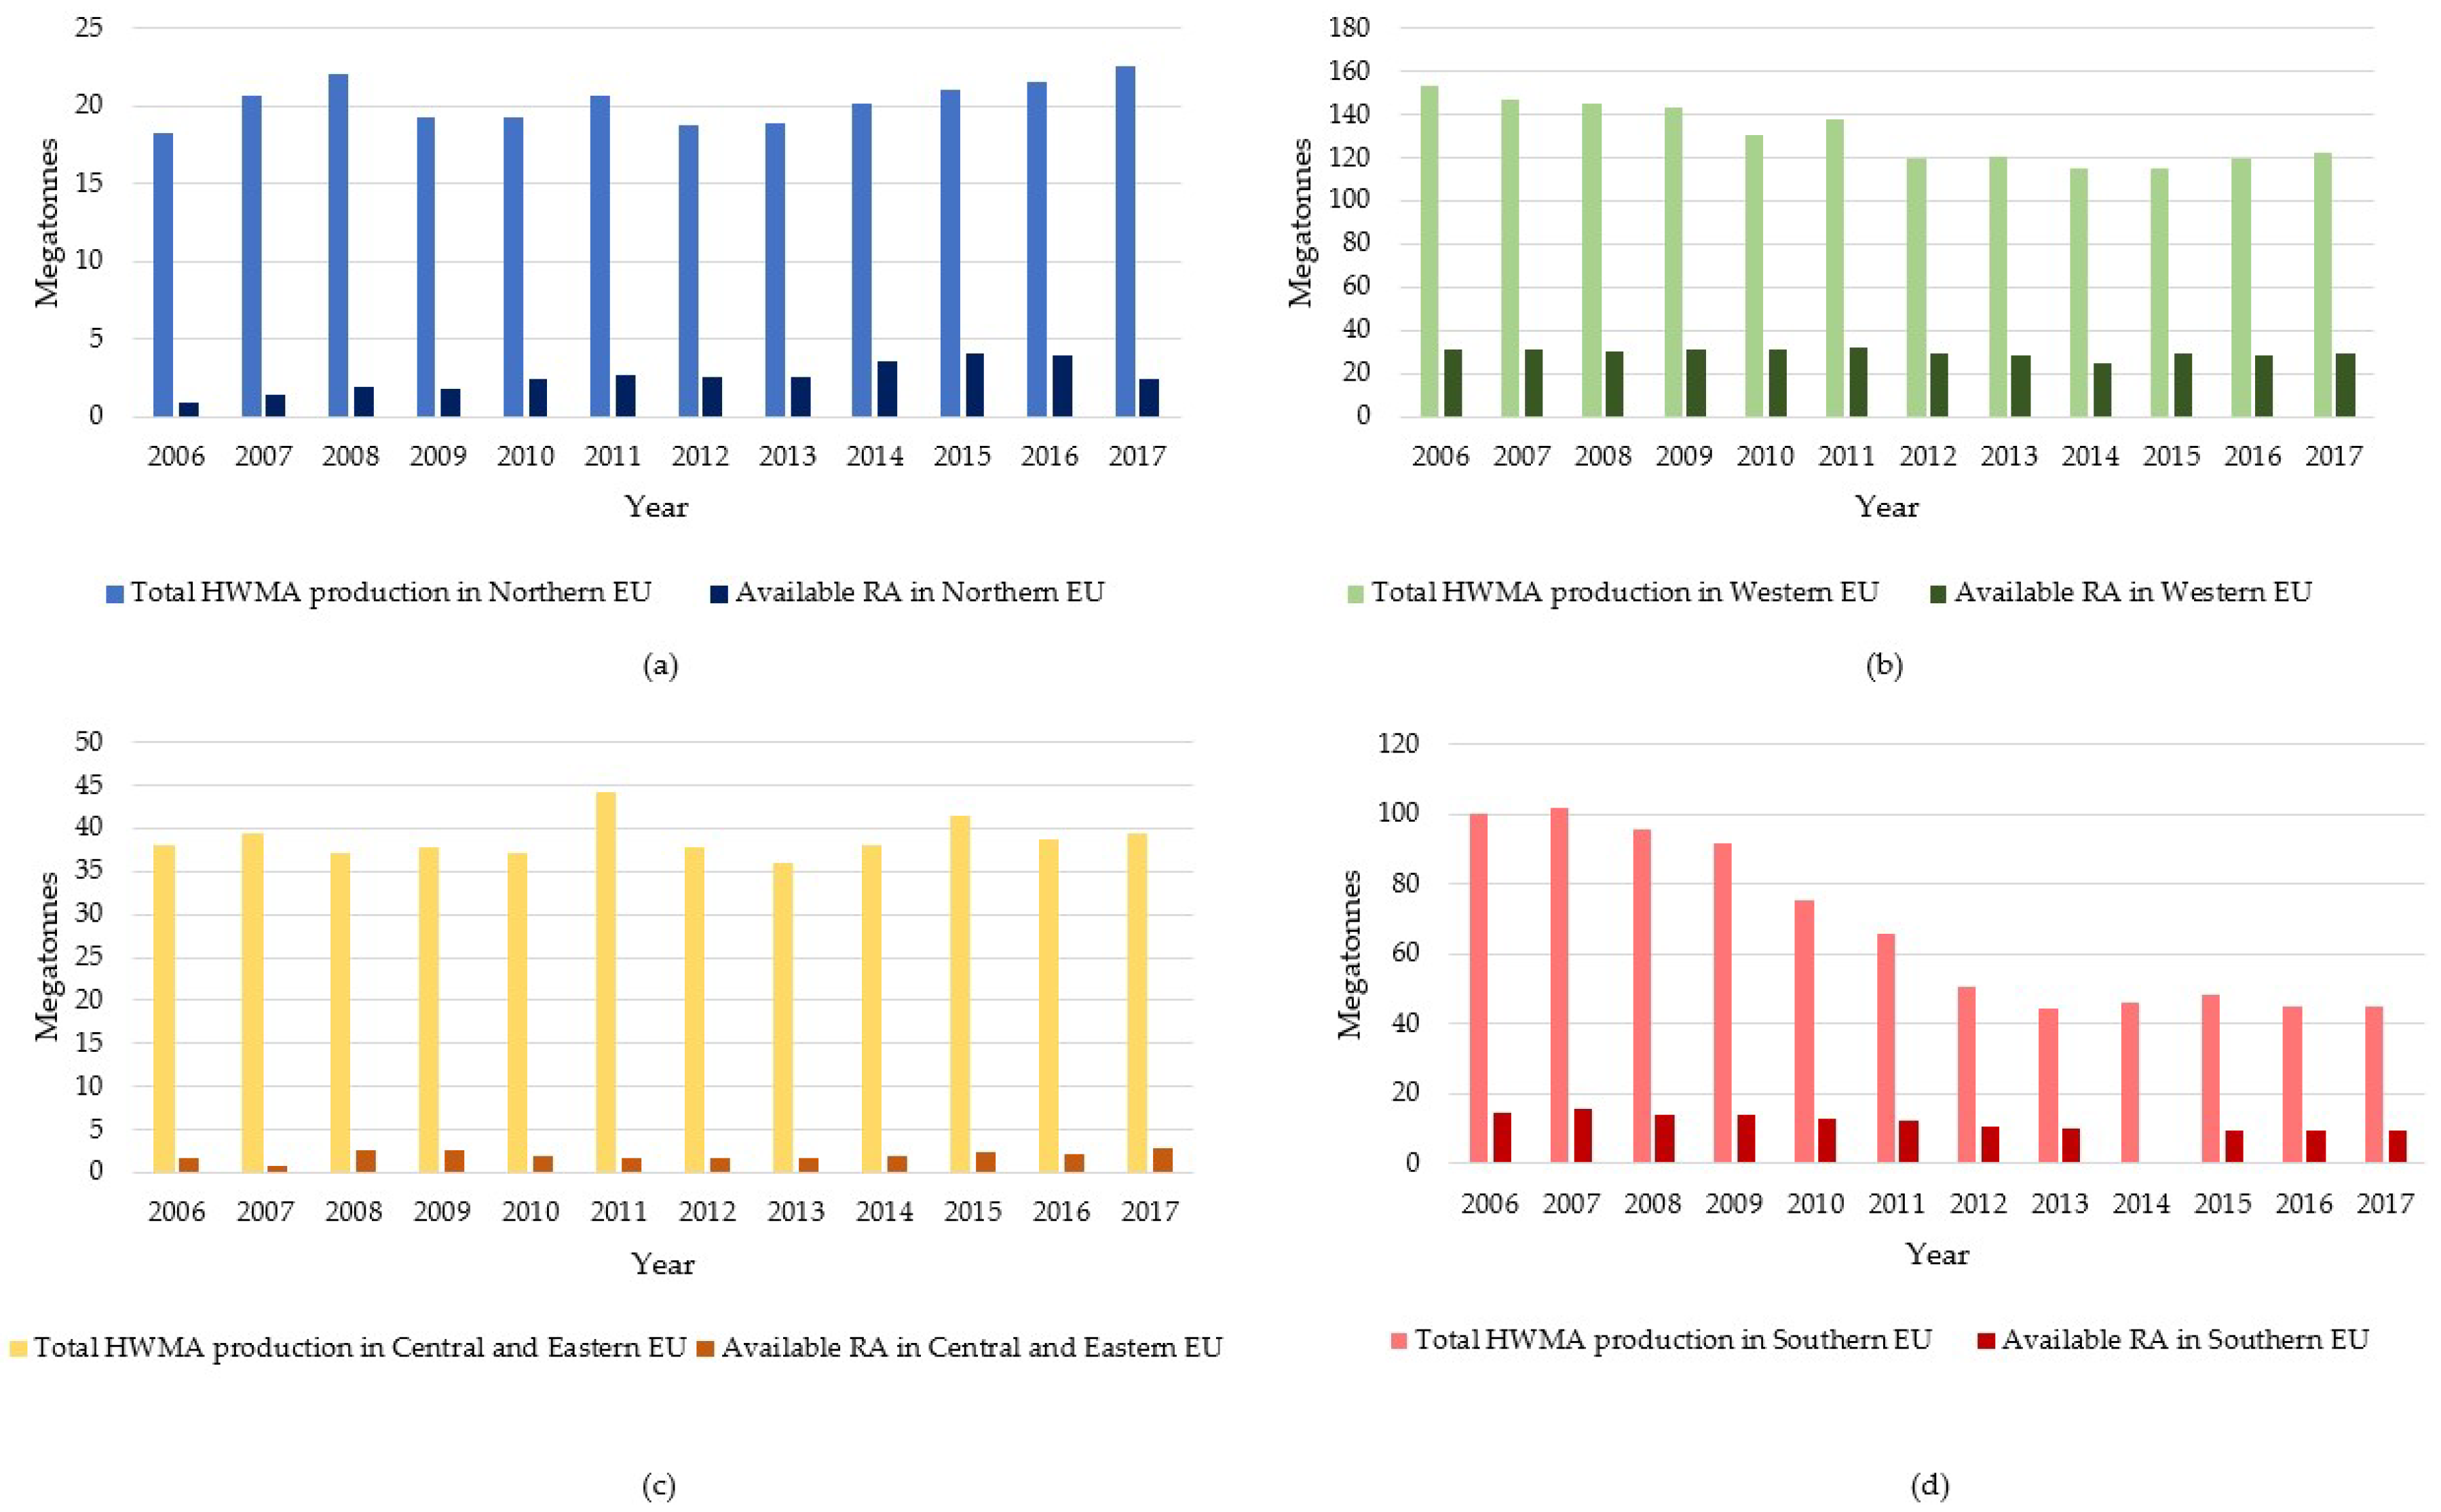
4.1. Hot and Warm Asphalt Mix production and Its Utilization Trends per Layer
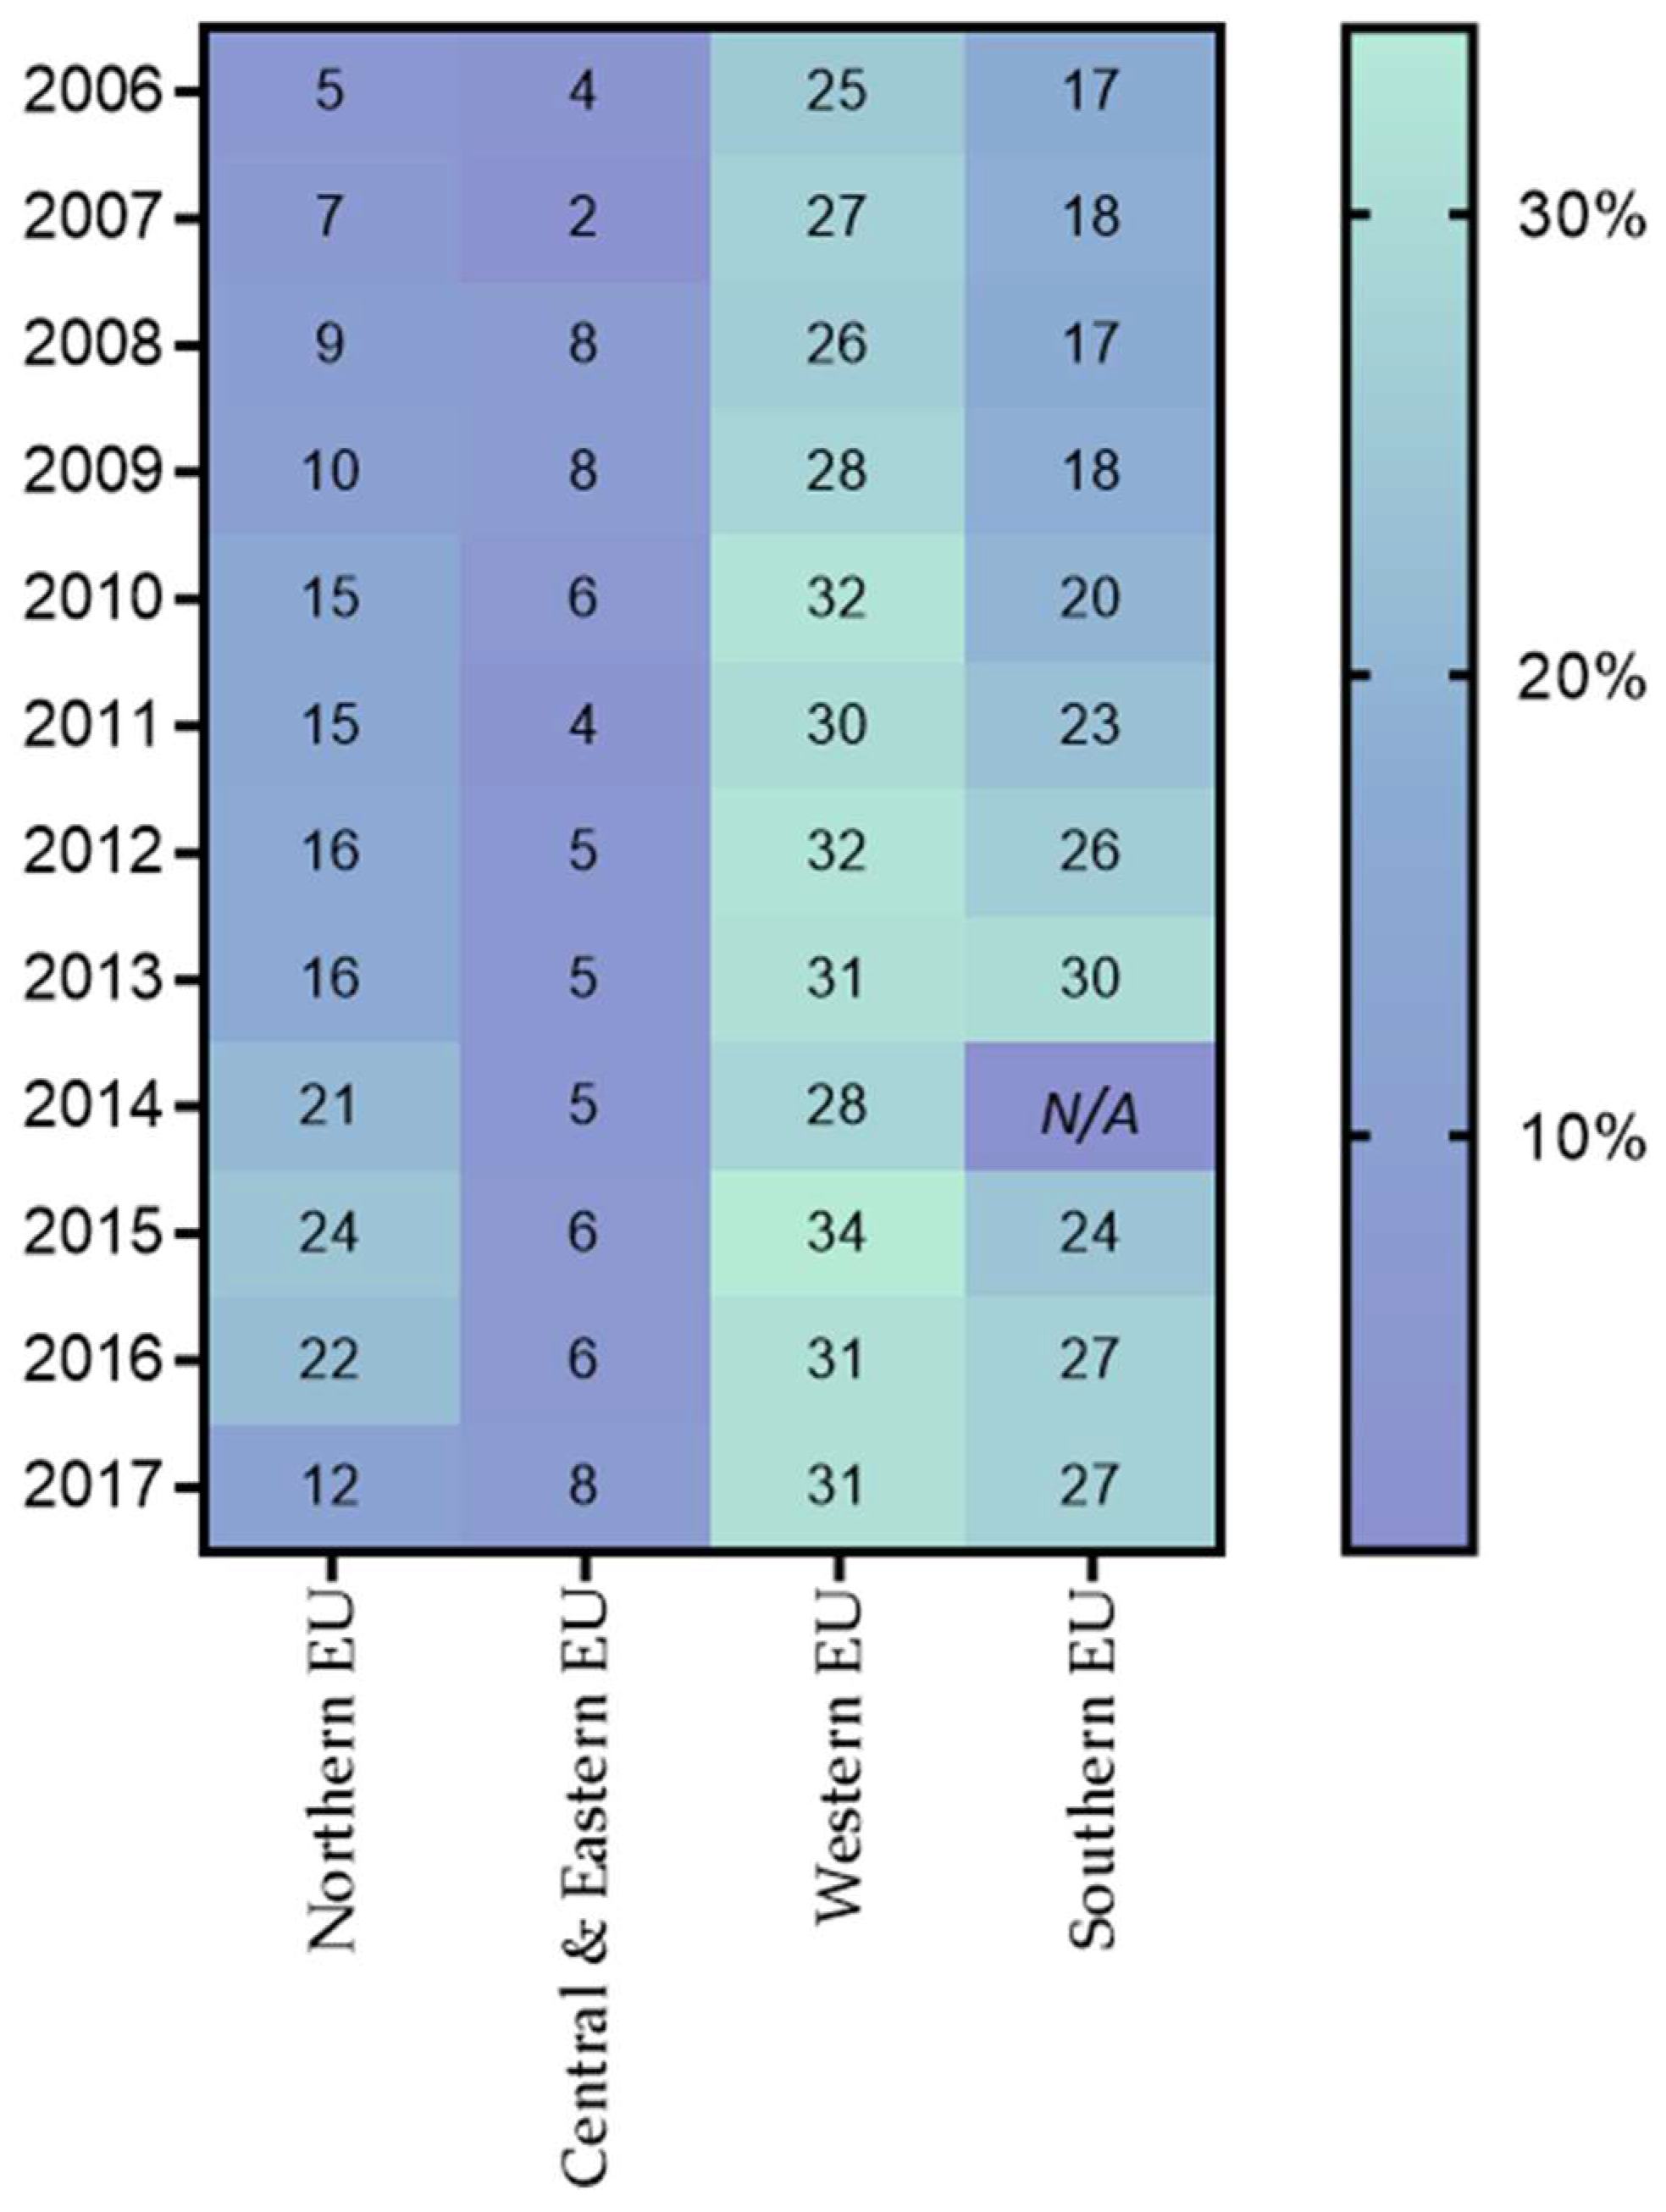
4.2. Reclaimed Asphalt Recycling Rates, QF[a] and QF[p]
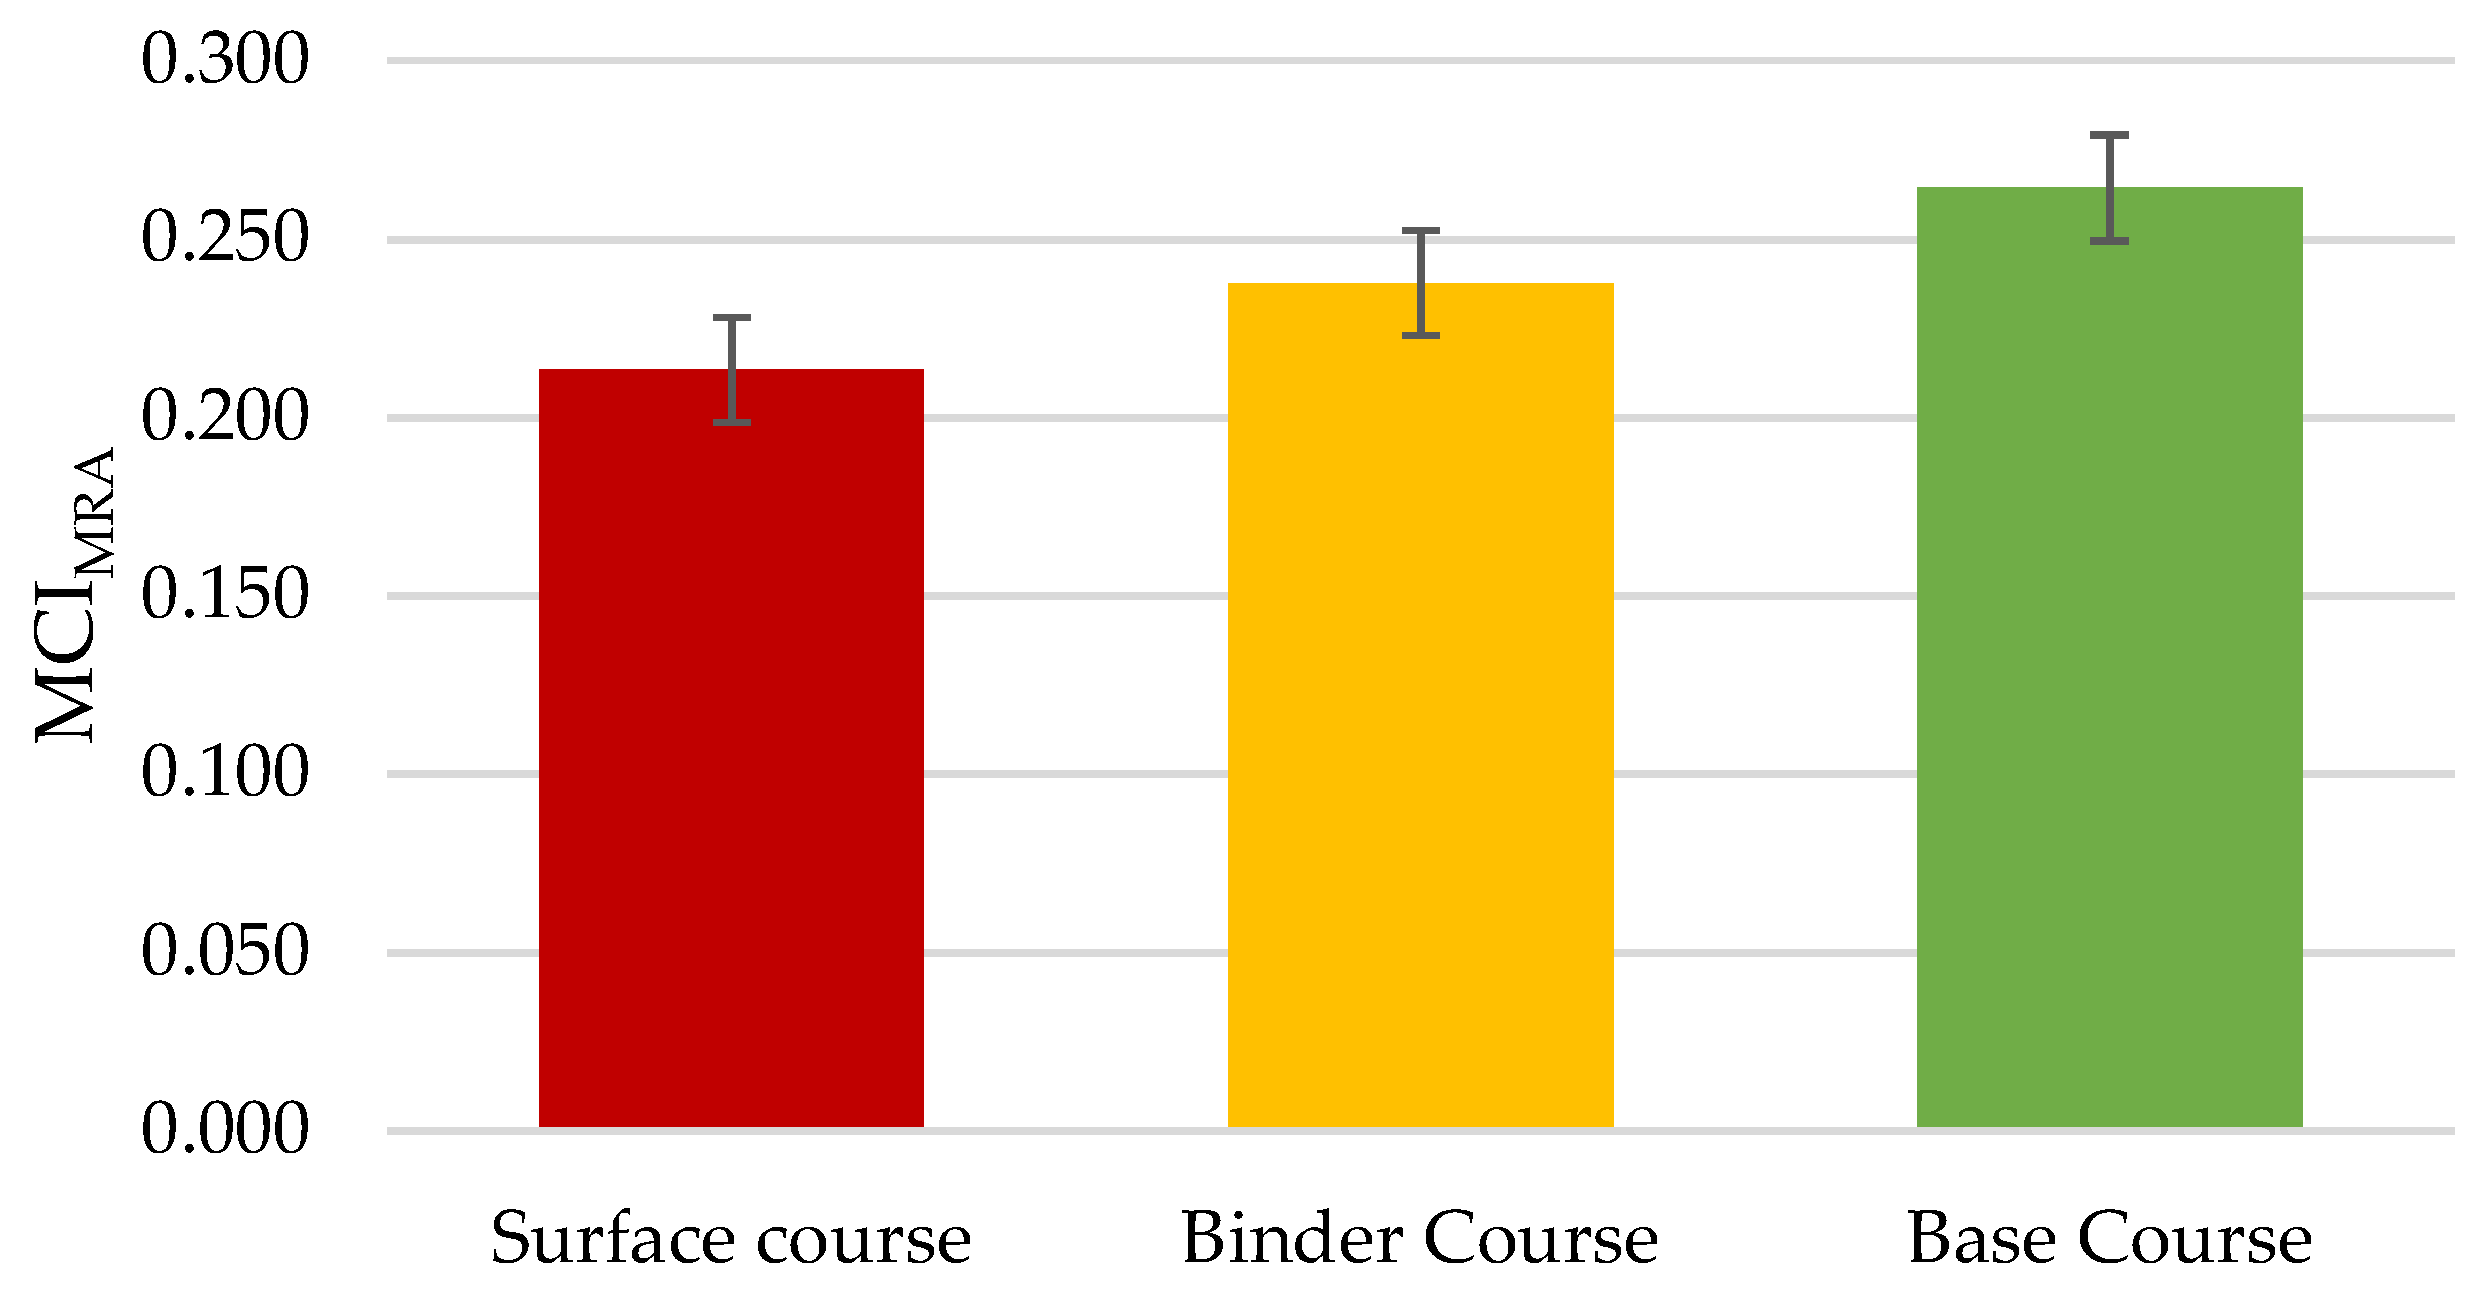
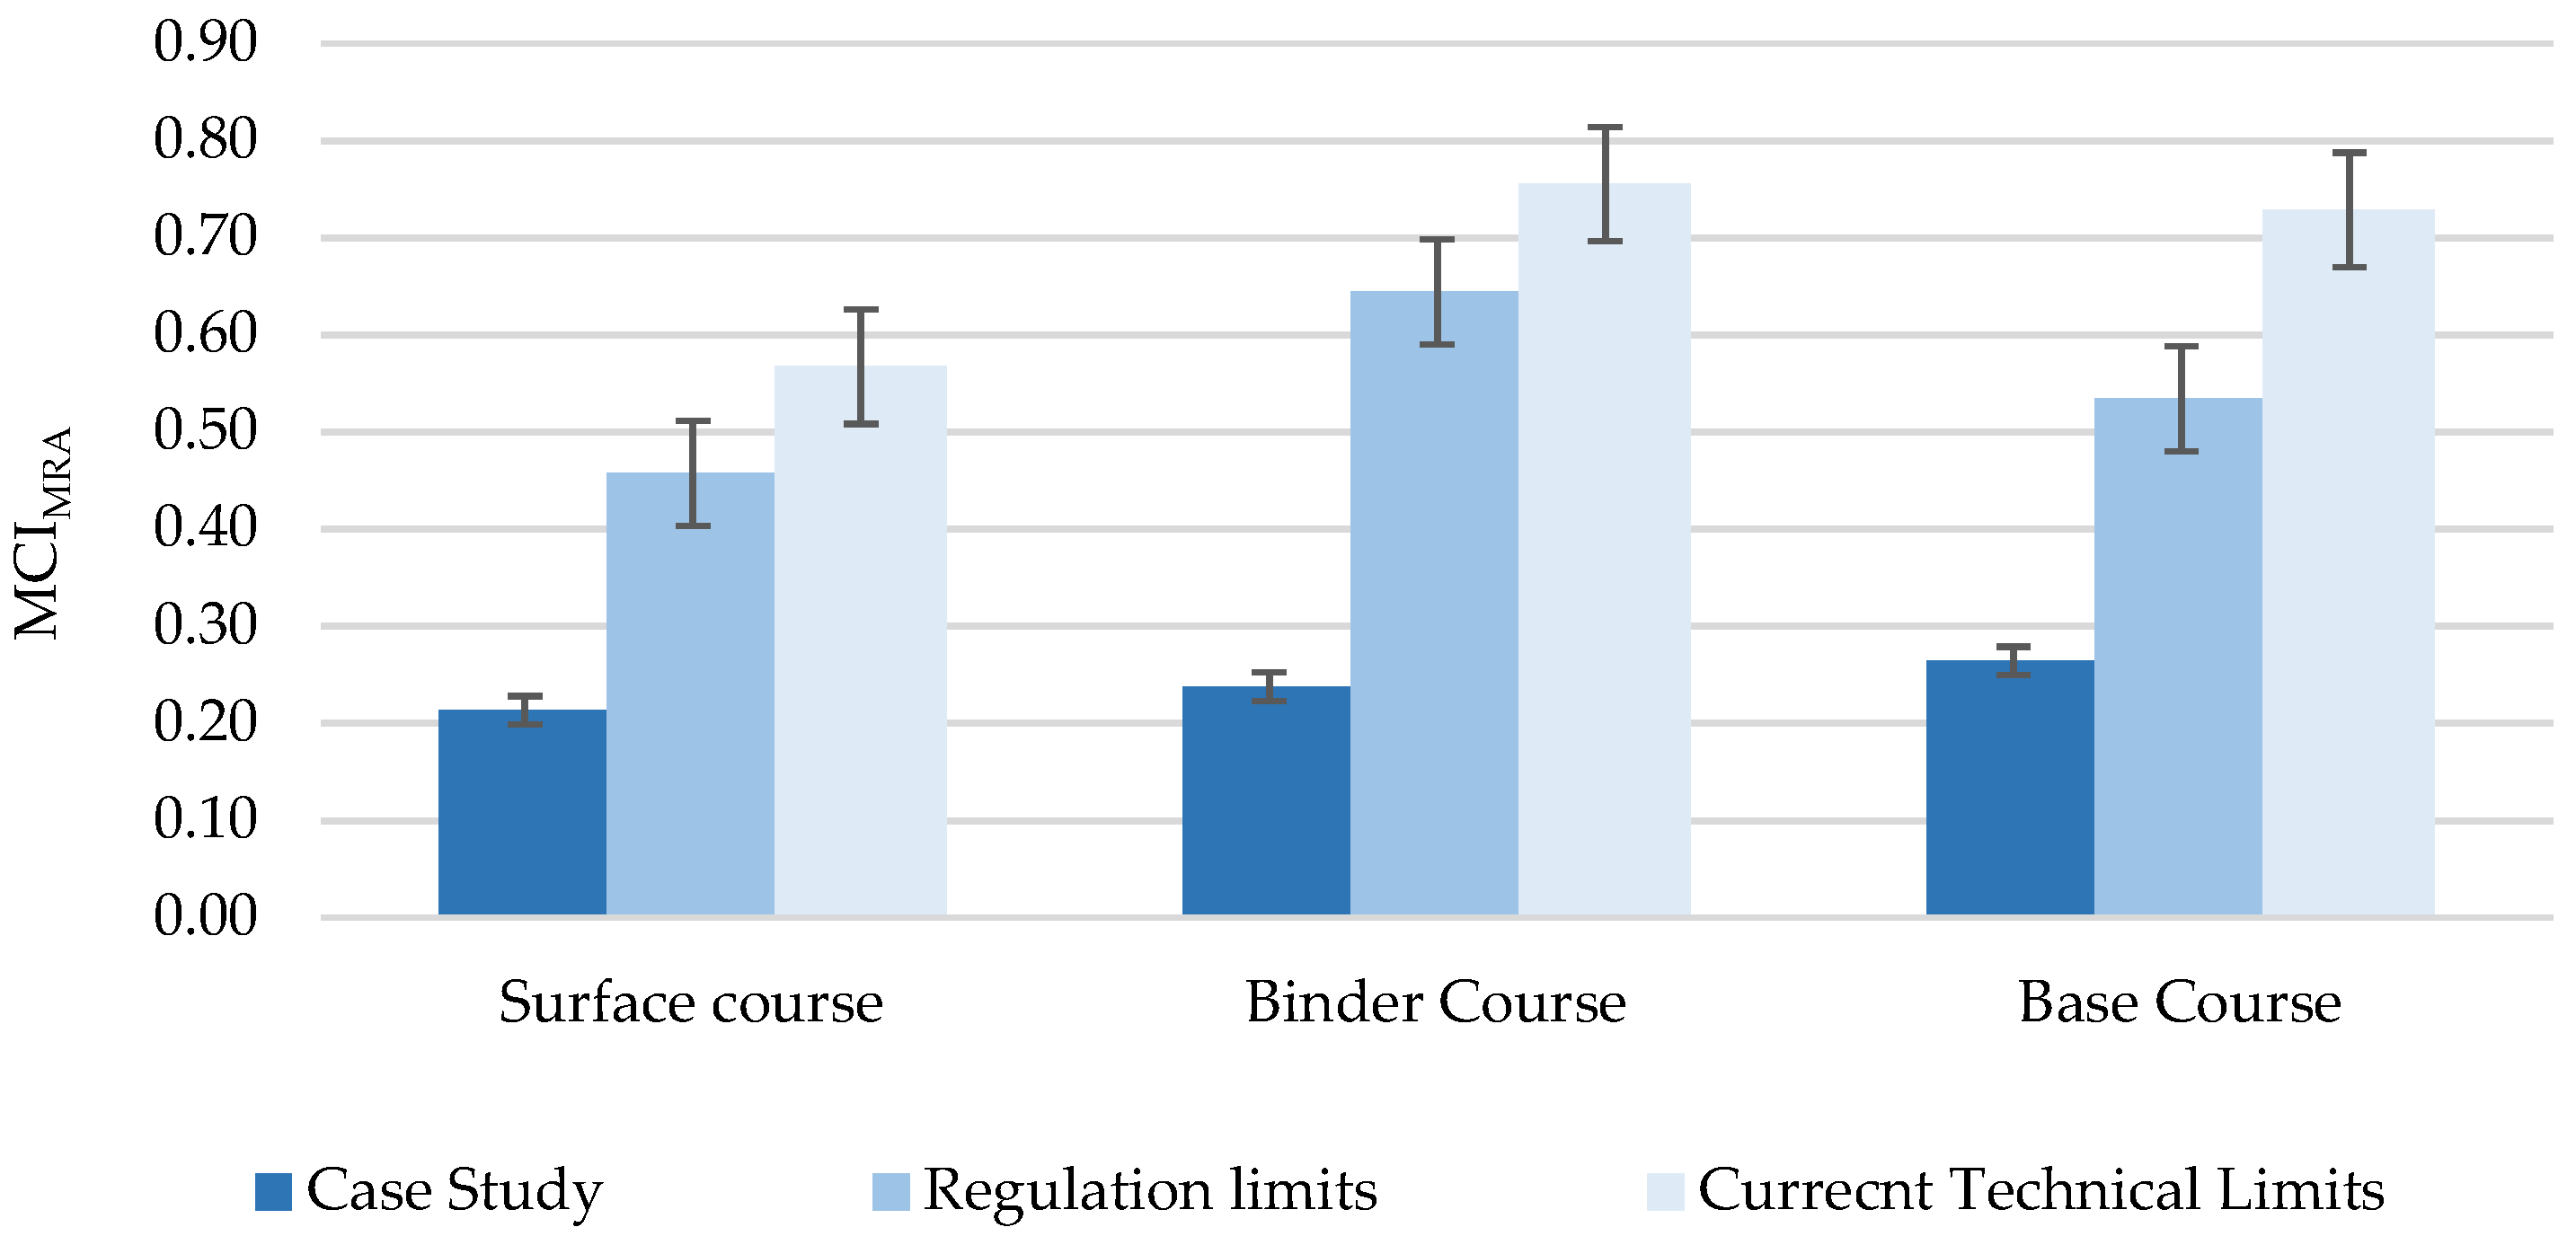
4.3. Product Material Circularity Index of Italian Motorways per Layer
- Optimize the Utility [X] by extending the actual average lifetime of asphalt pavements, and thus the functional units achieved through their life cycle, by introducing more systematic and effective maintenance regimes.
- Minimize the Linear Index flow (LFI) by reducing the utilization of virgin feedstock and increasing the feedstock originating from recycled sources; or in other words, maximize the potential of RA recycling.
5. Summary and Conclusions
- ΔU, by encouraging waste recycling techniques, while at the same time discouraging landfilling through incentives, bonuses, and penalties;
- PRA, by increasing the allowed limits of RA incorporation in the asphalt mixtures, following the current direction of scientific research;
- X, by increasing the utility factor through an appropriate and specifically tailored mix design addressed to RA;
- F[X], by further analyzing and fully defining the parameter of utility function according to an “ad hoc” structure for the end product;
- Capability and Efficiency, by accordingly adapting and strengthening the asphalt production chain, with particular reference to the structure and equipment of the treatment and mixing plants.
Author Contributions
Funding
Conflicts of Interest
Disclaimer
References
- Barrag, A. The Role of Renewable Energy in the Promotion of Circular Urban Metabolism. Sustainability 2017, 9, 2341. [Google Scholar]
- BSI. Framework for Implementing the Principles of the Circular Economy in Organizations—Guide; BSI Standards Publication; BSI: London, UK, 2017. [Google Scholar]
- Swagemakers, P.; Dolores, M.; Garcia, D.; Wiskerke, J.S.C. Socially-Inclusive Development and Value Creation: How a Composting Project in Galicia (Spain) ‘Hit the Rocks’. Sustainability 2018, 10, 2040. [Google Scholar] [CrossRef]
- Huang, Y.; Ning, Y.; Zhang, T.; Wu, J. Measuring Carbon Emissions of Pavement Construction in China. Sustainability 2016, 8, 723. [Google Scholar] [CrossRef]
- Gregson, N.; Crang, M.; Fuller, S.; Holmes, H. Interrogating the circular economy: the moral economy of resource recovery in the EU. Econ. Soc. 2015, 44, 218–243. [Google Scholar] [CrossRef]
- Vanner, R.; Bicket, M.; Withana, S.; Brink, P. Ten; Razzini, P.; Dijl, E. Van; Watkins, E.; Hestin, M.; Tan, A.; Guilche, S.; et al. Scoping Study to Identify Potential Circular Economy Actions, Priority Sectors, Material Flows and value Chains; Luxembourg Publications Office of the European Union: Luxembourg, 2014; ISBN 9789279401664. [Google Scholar]
- Boulding, K.E. Environmental Quality in a Growing Economy; RFF Press: Washington, DC, USA, 2011; pp. 3–14. [Google Scholar]
- Dobbs, C.G. Silent spring. Forestry 1962, 36, 195–198. [Google Scholar] [CrossRef]
- Clark, G.; Kosoris, J.; Hong, L.N.; Crul, M. Design for Sustainability: Current Trends in Sustainable Product Design and Development. Sustainability 2009, 1, 409–424. [Google Scholar] [CrossRef]
- Ellen MacArthur Foundation. Towards a Circular Economy: Business Rationale for an Accelerated Transition. Greener Manag. Int. 2015, 20, 13–34. [Google Scholar]
- Ellen MacArthur Foundation. Cities in the Circular Economy: An Initial Exploration; Ellen MacArthur Foundation: Cowes, UK, 2017; 16p. [Google Scholar]
- Frodermann, L. Exploratory Study on Circular Economy Approaches, Acpmparative Analysis of Theory and Practice; Springer: Berlin/Heidelberg, Germany, 2018. [Google Scholar]
- Ellen MacArthur Foundation. Towards the Circular Economy. Vol. 3: Accelerating the Scale-Up Across Global Supply Chains; Ellen MacArthur Foundation: Cowes, UK, 2014; pp. 1–64. [Google Scholar]
- Tran, T.; Park, J.Y. Development of a Novel Co-Creative Framework for Redesigning Product Service Systems. Sustainability 2016, 8, 434. [Google Scholar] [CrossRef]
- Goedkoop, M.J.; van Halen, C.J.G.; te Riele, H.R.M.; Rommens, P.J.M. Product Service Systems, Ecological and Economic Basics. Technical Report. Available online: https://teclim.ufba.br/jsf/indicadores/holan%20Product%20Service%20Systems%20main%20report.pdf (accessed on 8 March 2019).
- Chen, C. Guidance on the Conceptual Design of Sustainable Product—Service Systems. Sustainability 2018, 10, 2452. [Google Scholar] [CrossRef]
- AECOM and Atkins. Circular Economy Approach and Routemap; Highways England: Guildford, UK, 2016; Available online: https://highwaysengland.co.uk/knowledge-compendium/knowledge/publications/circular-economy-approach-and-routemap/index.html (accessed on 8 March 2019).
- LWARB. London’S Circular Economy Route Map; London Waste and Recycling Board: London, UK, 2017. Available online: https://www.lwarb.gov.uk/wp-content/uploads/2015/04/LWARB-London%E2%80%99s-CE-route-map_16.6.17a_singlepages_sml.pdf (accessed on 8 March 2019).
- Opportunity Peterborough. Circular Peterborough Circular City Roadmap–An Ambitious Plan & Performance Monitoring Framework towards 2021; Future Peterborough: Peterborough, UK, 2018; Available online: http://www.futurepeterborough.com/wp-content/uploads/2018/05/PREVIEW_Peterboroughs-Circular-City-Roadmap.pdf (accessed on 8 March 2019).
- Dai, B.; Lu, X. Evaluation of Mechanical Properties of a New Warm-Mix Asphalt using Sylvaroad Additive. Athens J. Technol. Eng. 2013, X, 1–14. [Google Scholar]
- Copeland, A. Reclaimed Asphalt Pavement in Asphalt Mixtures: State of the Practice; Rep. No. FHWA-HRT-11-021; Research, Development, and Technology Turner-Fairbank Highway Research Center: McLean, VA, USA, 2011; pp. 1–60. [Google Scholar]
- Gao, L.; Li, H.; Xie, J.; Yu, Z.; Charmot, S. Evaluation of pavement performance for reclaimed asphalt materials in different layers. Constr. Build. Mater. 2018, 159, 561–566. [Google Scholar] [CrossRef]
- Wang, Y.; Leng, Z.; Li, X.; Hu, C. Cold recycling of reclaimed asphalt pavement towards improved engineering performance. J. Clean. Prod. 2018, 171, 1031–1038. [Google Scholar] [CrossRef]
- Huang, Y.; Galatioto, F.; Parry, T.; Ne, T. Road pavement maintenance life cycle assessment—A UK case study. In Proceedings of the International Symposium on Pavement LCA, Davis, CA, USA, 14–16 October 2014; pp. 179–190. [Google Scholar]
- Birgisdóttir, H.; Pihl, K.A.; Bhander, G.; Hauschild, M.Z.; Christensen, T.H. Environmental assessment of roads constructed with and without bottom ash from municipal solid waste incineration. Transp. Res. Part D Transp. Environ. 2006, 11, 358–368. [Google Scholar] [CrossRef]
- Mroueh, U.M.; Laine-Ylijoki, J.; Eskola, P. Life-cycle impacts of the use of industrial by-products in road and earth construction. Waste Manag. Ser. 2000, 1, 438–448. [Google Scholar]
- Lo Presti, D.; Jiménez Del Barco Carrión, A.; Airey, G.; Hajj, E. Towards 100% recycling of reclaimed asphalt in road surface courses: Binder design methodology and case studies. J. Clean. Prod. 2016, 131, 43–51. [Google Scholar] [CrossRef]
- European Asphalt Pavement Association. Asphalt in Figures 2006; European Asphalt Pavement Association: Brussels, Belgium, 2006. [Google Scholar]
- European Asphalt Pavement Association. Asphalt in Figures 2007; European Asphalt Pavement Association: Brussels, Belgium, 2007. [Google Scholar]
- European Asphalt Pavement Association. Asphalt in Figures 2008; European Asphalt Pavement Association: Brussels, Belgium, 2008. [Google Scholar]
- European Asphalt Pavement Association. Asphalt in Figures 2009; European Asphalt Pavement Association: Brussels, Belgium, 2009. [Google Scholar]
- European Asphalt Pavement Association. Asphalt in Figures 2010; European Asphalt Pavement Association: Brussels, Belgium, 2010. [Google Scholar]
- European Asphalt Pavement Association. Asphalt in Figures 2011; European Asphalt Pavement Association: Brussels, Belgium, 2011. [Google Scholar]
- European Asphalt Pavement Association. Asphalt in Figures 2012; European Asphalt Pavement Association: Brussels, Belgium, 2012. [Google Scholar]
- European Asphalt Pavement Association. Asphalt in Figures 2013; European Asphalt Pavement Association: Brussels, Belgium, 2013. [Google Scholar]
- European Asphalt Pavement Association. Asphalt in Figures 2014; European Asphalt Pavement Association: Brussels, Belgium, 2014. [Google Scholar]
- European Asphalt Pavement Association. Asphalt In Figures 2015; European Asphalt Pavement Association: Brussels, Belgium, 2015. [Google Scholar]
- European Asphalt Pavement Association. Asphalt in Figures 2016; European Asphalt Pavement Association: Brussels, Belgium, 2016. [Google Scholar]
- European Asphalt Pavement Association. Asphalt in Figures 2017; European Asphalt Pavement Association: Brussels, Belgium, 2017. [Google Scholar]
- Miliutenko, S.; Björklund, A.; Carlsson, A. Opportunities for environmentally improved asphalt recycling: The example of Sweden. J. Clean. Prod. 2013, 43, 156–165. [Google Scholar] [CrossRef]
- Blasl, A.; Kraft, J.; Presti, D. Lo; Mino, G. Di; Wellner, F. Performance of asphalt mixes with high recycling rates for wearing layers. In Proceedings of the 6th Eurasphalt Eurobitume Congress, Prague, Czech Republic, 1–3 June 2016. [Google Scholar]
- Maupin, G.W.; Diefenderfer, S.D.; Gillespie, J.S. Evaluation of Using Higher Percentages of Recycled Asphalt Pavement in Asphalt Mixes in Virginia; The Virginia Transportation Research Council: Charlottesville, VA, USA, 2008; 29p. [Google Scholar]
- Celauro, C.; Bernardo, C.; Gabriele, B. Production of innovative, recycled and high-performance asphalt for road pavements. Resour. Conserv. Recycl. 2010, 54, 337–347. [Google Scholar] [CrossRef]
- McDaniel, R.S.; Shah, A. Use of reclaimed asphalt pavement (RAP) under Superpave specifications. Asph. Paving Technol. 2003, 72, 226–252. [Google Scholar]
- Silva, H.M.R.D.; Oliveira, J.R.M.; Jesus, C.M.G. Are totally recycled hot mix asphalts a sustainable alternative for road paving? Resour. Conserv. Recycl. 2012, 60, 38–48. [Google Scholar] [CrossRef]
- Tran, D.H.; Kim, D.S. Minimum latency and energy efficiency routing with lossy link awareness in wireless sensor networks. In Proceedings of the 2012 9th IEEE International Workshop on Factory Communication Systems, WFCS, Lemgo, Germany, 21–24 May 2012; pp. 75–78. [Google Scholar]
- Falla, G.; Blasl, A.; Millow, R.; Lo Presti, D. Mix design considerations for asphalt wearing courses with high reclaimed asphalt content. In Proceedings of the 6th International Conference Bituminous Mixtures and Pavements, Thessaloniki, Greece, 10–12 June 2015; pp. 561–566. [Google Scholar]
- Bueche, N.; Dumont, A.; Pittet, M.; Bressi, S. 8th International RILEM Symposium on Testing and Characterization of Sustainable and Innovative Bituminous Materials, SIB 2015. Int. J. Pavement Res. Technol. 2014, 7, IV. [Google Scholar]
- EAPA. Guidance Document for preparing Product Category Rules (PCR) and Environmental Product Declarations (EPD) for Asphalt Mixtures by the European Asphalt Pavement Association (EAPA) 2 nd November 2016; EAPA: Arlington County, VA, USA, 2016. [Google Scholar]
- Williams, J. Circular Cities: Challenges to Implementing Looping Actions. Sustainability 2019, 11, 423. [Google Scholar] [CrossRef]
- Lewandowski, M. Designing the Business Models for Circular Economy—Towards the Conceptual Framework. Sustainability 2016, 8, 43. [Google Scholar] [CrossRef]
- Frank, H.J. Circularity Indicator. Circ. Indic. Approach Meas. Circ. Methodol. 2006, 23, 159–161. [Google Scholar]
- Huang, B.; Kingery, W.; Zhang, Z.; Zuo, G. Laboratory study of fatigue characteristics of HMA surface mixtures containing RAP. In Proceedings of the 83rd Annual Meeting Transportation Research Board, Washington, DC, USA, 11–15 January 2004. [Google Scholar]
- Norouzi, A.; Sabouri, M.; Kim, Y. Evaluation of the fatigue performance of asphalt mixtures with high RAP content. Asph. Pavements 2014, 8, 1069–1077. [Google Scholar]
- Al-Qadi, I.L.; Aurangzeb, Q.; Carpenter, S.H.; Pine, W.J.; Trepanier, J. Impact of High RAP Content on Structural and Performance Properties of Asphalt Mixtures; Illinois Center for Transportation: Rantoul, IL, USA, 2012; pp. 7–41. [Google Scholar]
- Tang, S.; Williams, R.C.; Professor, M.; Wang, K.; Jahren, C.; Stephenson, W.R.; Olafsson, S. Evaluate the Fracture and Fatigue Resistances of Hot Mix Asphalt Containing High Percentage Reclaimed Asphalt Pavement (RAP) Materials at Low and Intermediate Temperatures. Ph.D. Thesis, Iowa State University, Ames, IA, USA, 2014. [Google Scholar]
- Sonmez, I.; Yildirim, S.A.; Temren, Z. Investigation of performance properties of laboratory and plant produced bituminous mixture containing high rates of reclaimed asphalt. In Proceedings of the 6th Eurasphalt & Eurobitume Congress, Prague, Czech Republic, 1–3 June 2016. [Google Scholar]
- Al-Rousan, T.; Asi, I.; Al-Hattamleh, O.; Al-Qablan, H. Performance of asphalt mixes containing RAP. Jordan J. Civ. Eng. 2008, 2, 218–227. [Google Scholar]
- Tabakovic, A.; Gibney, A.; Gilchrist, M.D.; Mcnally, C. The Influence of Recycled Asphalt Pavement on 20 mm Binder Course Mix Performance. In Proceedings of the 3rd National Symposium on Bridge and Infrastructure Research, Ireland, Dublin, 2016; Available online: https://researchrepository.ucd.ie/handle/10197/2328 (accessed on 15 March 2019).
- Tabaković, A.; Gibney, A.; McNally, C.; Gilchrist, M.D. Influence of Recycled Asphalt Pavement on Fatigue Performance of Asphalt Concrete Base Courses. J. Mater. Civ. Eng. 2010, 22, 643–650. [Google Scholar] [CrossRef]
- Bańkowski, W. Evaluation of Fatigue Life of Asphalt Concrete Mixtures with Reclaimed Asphalt Pavement. Appl. Sci. 2018, 8, 469. [Google Scholar] [CrossRef]
- Linder, M.; Sarasini, S.; van Loon, P. A Metric for Quantifying Product-Level Circularity. J. Ind. Ecol. 2017, 21, 545–558. [Google Scholar] [CrossRef]
- CNR—Consiglio Nazionale Delle Ricerche. Bolletino Ufficiale, Parte IV, Norme Techiche, A.XXiX—N.178., Catalogo delle Pavimentazioni Stradali; Commissione di studio per le norme relative ai materiali stradali e costruzione e manutenzione strade, Piazzale Aldo Moro: Roma, Italy, 15 Settembre 1995. [Google Scholar]
- Ministero Dei Lavori Pubblici, Apitolato Speciale D’Appalto Tipo Per Lavori Stradali, Articolo 8- Conglomerati bituminosi riciclati a freddo, Formazione di strati in conglomerato bituminoso riciclato a freddo, 1–6. Available online: http://www.mucchilab.it/_img/_pdf/54.pdf (accessed on 15 March 2019).
- Don Brock, J.; Richmond, J.L. Milling and Recycling; ASTEC, INC.: Chattanooga, TN, USA, 2007; pp. 3–27. Available online: https://www.astecinc.com/images/file/literature/Astec-T-127-Milling-Recycling-EN.pdf (accessed on 8 April 2019).


| Northern EU Members | Central and Eastern EU Members | Western EU Members | Southern EU Members |
|---|---|---|---|
| Denmark | Bulgaria | Austria | Cyprus |
| Estonia | Croatia | Belgium | Greece |
| Finland | Czech Republic | France | Italy |
| Latvia | Hungary | Germany | Malta |
| Lithuania | Poland | Ireland | Portugal |
| Sweden | Romania | Luxembourg | Spain |
| Slovakia | Netherlands | ||
| Slovenia | United Kingdom |
| Average road dimensions | Total Length of motorways (km) | 6.83 × 10³ |
| Number of lanes per direction | 3 | |
| Average width of lanes (m) | 3.75 | |
| Average Layer Thicknesses | Wearing course (m) | 0.06 |
| Binder course (m) | 0.07 | |
| Base course (m) | 0.3 | |
| Allowed % of RA incorporation within the pavement layers | Wearing course | 20% |
| Binder course | 25% | |
| Base course | 30% | |
| Quantities of Hot and Warm Mix Asphalt Production and Reclaimed Asphalt | Total Available RA (tonnes) | 1.02 × 10⁷ |
| Total Placed RA (tonnes) | 1.70 × 10⁶ | |
| Total HWMA production (tonnes) | 2.83 × 10⁷ | |
| Total average mass of pavement layers as final products | Wearing course (tonnes) | 2.17 × 10⁷ |
| Binder course (tonnes) | 2.53 × 10⁷ | |
| Base course (tonnes) | 1.08 × 10⁸ | |
| Total average use of the total Hot and Warm Mix Asphalt Production per pavement layer | Wearing course (tonnes) | 7.37 × 10⁶ |
| Binder course (tonnes) | 8.22 × 10⁶ | |
| Base course (tonnes) | 7.37 × 10⁶ |
| MCIMRA of Pavement Layers in Italian Motorways (INPUTS) | Wearing Course | Binder Course | Base Course | |
|---|---|---|---|---|
| DEFINITION | SYMBOL | VALUE | VALUE | VALUE |
| Mass of Virgin Feedstock used | V (tonnes) | 2.07 × 10⁷ | 2.28 × 10⁷ | 9.15 × 10⁷ |
| Fraction of feedstock derived from recycled sources | PRA | 0.043 | 0.097 | 0.156 |
| Mass of the finished product | GMRA (tonnes) | 2.17 × 10⁷ | 2.53 × 10⁷ | 1.08 × 10⁸ |
| Fraction of the mass of the product collected for recycling at the End-of-Life | FRA = ΔU | 0.2130 | 0.2130 | 0.2130 |
| Amount of waste going to landfill or energy recovery | WEoL (tonnes) | 1.71 × 10⁷ | 1.99 × 10⁷ | 8.53 × 10⁷ |
| Quantity of waste generated in the recycling process | WT (tonnes) | 9.23 × 10⁴ | 1.08 × 10⁵ | 4.62 × 10⁵ |
| Quantity of waste generated to produce any recycled content used as feedstock | WP (tonnes) | 0 | 0 | 0 |
| Efficiency of recycling process as treatment | ET | 98% | ||
| Efficiency of the recycling process as production | EP | 100% | ||
| Overall amount of unrecoverable waste | W (tonnes) | 1.71 × 10⁷ | 2.00 × 10⁷ | 8.55 × 10⁷ |
| Linear flow index (LFI) | LFI | 0.87 | 0.85 | 0.82 |
| Utility | X | 1.00 | 1.00 | 1.00 |
| Utility factor built as a function of the utility factor X of a product | F[X] | 0.90 | 0.90 | 0.90 |
| Northern EU | Central and Eastern EU | |||||||||||
| Year | HWMA (Mt) | RA Available (Mt) | RA Placed (Mt) | ΔU | QF[a] | QF[p] | HWMA (Mt) | RA Available (Mt) | RA Placed (Mt) | ΔU | QF[a] | QF[p] |
| 2006 | 18.300 | 0.900 | 0.500 | 0.581 | 4.69% | 2.60% | 38.000 | 1.600 | 0.232 | 0.143 | 4.04% | 0.59% |
| 2007 | 20.700 | 1.400 | 0.800 | 0.590 | 6.33% | 3.62% | 39.500 | 0.700 | 0.347 | 0.503 | 1.74% | 0.86% |
| 2008 | 22.100 | 1.900 | 0.900 | 0.467 | 7.92% | 3.75% | 37.100 | 2.700 | 0.450 | 0.168 | 6.78% | 1.13% |
| 2009 | 19.300 | 1.800 | 0.900 | 0.508 | 8.53% | 4.27% | 37.900 | 2.600 | 0.369 | 0.140 | 6.42% | 0.91% |
| 2010 | 19.300 | 2.500 | 1.000 | 0.394 | 11.47% | 4.59% | 37.200 | 1.900 | 0.284 | 0.146 | 4.86% | 0.73% |
| 2011 | 20.600 | 2.700 | 1.300 | 0.463 | 11.59% | 5.58% | 44.300 | 1.700 | 0.287 | 0.169 | 3.70% | 0.62% |
| 2012 | 18.800 | 2.600 | 1.200 | 0.464 | 12.15% | 5.61% | 37.900 | 1.700 | 0.441 | 0.265 | 4.29% | 1.11% |
| 2013 | 18.900 | 2.600 | 1.400 | 0.539 | 12.09% | 6.51% | 36.000 | 1.600 | 0.366 | 0.227 | 4.26% | 0.97% |
| 2014 | 20.100 | 3.500 | 2.700 | 0.761 | 14.83% | 11.44% | 38.100 | 1.900 | 0.366 | 0.197 | 4.75% | 0.91% |
| 2015 | 21.100 | 4.100 | 3.200 | 0.783 | 16.27% | 12.70% | 41.400 | 2.300 | 0.565 | 0.247 | 5.26% | 1.29% |
| 2016 | 21.600 | 3.900 | 3.200 | 0.831 | 15.29% | 12.55% | 38.700 | 2.100 | 0.521 | 0.248 | 5.15% | 1.28% |
| 2017 | 22.500 | 2.365 | 1.969 | 0.833 | 9.51% | 7.92% | 39.500 | 2.854 | 0.542 | 0.191 | 6.74% | 1.28% |
| Western EU | Southern EU | |||||||||||
| Year | HWMA (Mt) | RA Available (Mt) | RA Placed (Mt) | ΔU | QF[a] | QF[p] | HWMA (Mt) | RA Available (Mt) | RA Placed (Mt) | ΔU | QF[a] | QF[p] |
| 2006 | 153.100 | 31.048 | 15.953 | 0.514 | 16.86% | 8.66% | 100.000 | 14.690 | 2.727 | 0.186 | 12.81% | 2.38% |
| 2007 | 147.100 | 31.015 | 16.439 | 0.530 | 17.41% | 9.23% | 102.000 | 15.650 | 3.603 | 0.230 | 13.30% | 3.06% |
| 2008 | 144.900 | 29.930 | 16.717 | 0.559 | 17.12% | 9.56% | 95.900 | 14.150 | 0.552 | 0.039 | 12.86% | 0.50% |
| 2009 | 143.000 | 31.353 | 18.813 | 0.600 | 17.98% | 10.79% | 91.600 | 13.850 | 3.362 | 0.243 | 13.13% | 3.19% |
| 2010 | 130.800 | 31.380 | 18.607 | 0.593 | 19.35% | 11.47% | 75.300 | 12.611 | 3.094 | 0.245 | 14.35% | 3.52% |
| 2011 | 137.550 | 31.920 | 19.957 | 0.625 | 18.84% | 11.78% | 66.000 | 12.352 | 3.187 | 0.258 | 15.76% | 4.07% |
| 2012 | 119.310 | 29.110 | 19.067 | 0.655 | 19.61% | 12.85% | 50.700 | 10.368 | 2.243 | 0.216 | 16.98% | 3.67% |
| 2013 | 120.100 | 28.750 | 19.260 | 0.670 | 19.31% | 12.94% | 44.600 | 10.205 | 2.174 | 0.213 | 18.62% | 3.97% |
| 2014 | 115.400 | 24.985 | 18.287 | 0.732 | 17.80% | 13.03% | 45.900 | Data N/a | Data N/a | Data N/a | Data N/a | Data N/a |
| 2015 | 115.200 | 29.104 | 22.567 | 0.775 | 20.17% | 15.64% | 48.400 | 9.410 | 2.185 | 0.232 | 16.28% | 3.78% |
| 2016 | 119.900 | 28.691 | 22.197 | 0.774 | 19.31% | 14.94% | 44.700 | 9.490 | 2.128 | 0.224 | 17.51% | 3.93% |
| 2017 | 122.400 | 28.950 | 22.650 | 0.782 | 19.13% | 14.97% | 44.700 | 9.494 | 2.480 | 0.261 | 17.52% | 4.58% |
| Year | 2006 | 2007 | 2008 | 2009 | 2010 | 2011 | 2012 | 2013 | 2014 | 2015 | 2016 | 2017 |
|---|---|---|---|---|---|---|---|---|---|---|---|---|
| Northern EU | 5.1% | 7.1% | 9.5% | 10.3% | 14.5% | 15.1% | 15.9% | 15.6% | 21.1% | 24.0% | 22.0% | 11.7% |
| Central and Eastern EU | 4.5% | 1.8% | 7.8% | 7.5% | 5.5% | 4.0% | 4.6% | 4.7% | 5.2% | 5.9% | 5.7% | 7.8% |
| Western EU | 25.4% | 26.7% | 26.0% | 28.1% | 31.6% | 30.2% | 32.3% | 31.5% | 27.6% | 33.8% | 31.5% | 31.0% |
| Southern EU | 17.2% | 18.1% | 17.3% | 17.8% | 20.1% | 23.0% | 25.7% | 29.7% | N/A | 24.1% | 27.0% | 27.0% |
| MCIMRA of Pavement Layers in Italian Motorways (OUTPUT) | Wearing Course | Binder Course | Base Course |
|---|---|---|---|
| Material circularity indicator per pavement layer MCIMRA | 0.213 | 0.2377 | 0.2643 |
© 2019 by the authors. Licensee MDPI, Basel, Switzerland. This article is an open access article distributed under the terms and conditions of the Creative Commons Attribution (CC BY) license (http://creativecommons.org/licenses/by/4.0/).
Share and Cite
Mantalovas, K.; Di Mino, G. The Sustainability of Reclaimed Asphalt as a Resource for Road Pavement Management through a Circular Economic Model. Sustainability 2019, 11, 2234. https://doi.org/10.3390/su11082234
Mantalovas K, Di Mino G. The Sustainability of Reclaimed Asphalt as a Resource for Road Pavement Management through a Circular Economic Model. Sustainability. 2019; 11(8):2234. https://doi.org/10.3390/su11082234
Chicago/Turabian StyleMantalovas, Konstantinos, and Gaetano Di Mino. 2019. "The Sustainability of Reclaimed Asphalt as a Resource for Road Pavement Management through a Circular Economic Model" Sustainability 11, no. 8: 2234. https://doi.org/10.3390/su11082234
APA StyleMantalovas, K., & Di Mino, G. (2019). The Sustainability of Reclaimed Asphalt as a Resource for Road Pavement Management through a Circular Economic Model. Sustainability, 11(8), 2234. https://doi.org/10.3390/su11082234