Article

The Impact on System Performance When Renovating a Multifamily Building Stock in a District Heated Region

Division of Energy Systems, Department of Management and Engineering, Linköping University, SE-581 83 Linköping, Sweden
*
Author to whom correspondence should be addressed.
Sustainability 2019, 11(8), 2199; https://doi.org/10.3390/su11082199
Submission received: 12 March 2019 / Revised: 4 April 2019 / Accepted: 6 April 2019 / Published: 12 April 2019

Abstract

:
In Sweden, 90% of multifamily buildings utilize district heat and a large portion is in need of renovation. The aim is to analyze the impact of renovating a multifamily building stock in a district heating and cooling system, in terms of primary energy savings, peak power demands, electricity demand and production, and greenhouse gas emissions on local and global levels. The study analyzes scenarios regarding measures on the building envelope, ventilation, and substitution from district heat to ground source heat pump. The results indicate improved energy performance for all scenarios, ranging from 11% to 56%. Moreover, the scenarios present a reduction of fossil fuel use and reduced peak power demand in the district heating and cooling system ranging from 1 MW to 13 MW, corresponding to 4–48 W/m2 heated building area. However, the study concludes that scenarios including a ground source heat pump generate significantly higher global greenhouse gas emissions relative to scenarios including district heating. Furthermore, in a future fossil-free district heating and cooling system, a reduction in primary energy use will lead to a local reduction of emissions along with a positive effect on global greenhouse gas emissions, outperforming measures with a ground source heat pump.

1. Introduction

The residential and services sector accounts for 40% of Sweden’s energy use [1] and ~10% of greenhouse gas (GHG) emissions [2]. Of the share of energy use, space heating and domestic hot water in multifamily buildings were responsible for roughly 20% (26.6 TWh) in 2016, and district heating (DH) is the predominant energy carrier with 90% of Sweden’s multifamily buildings connected to a DH network [3,4]. As in many European countries, Sweden’s building stock increased rapidly between 1950 and 1975, after the Second World War and before the oil crisis [5,6]. During what is now called ‘the record years’, the Swedish government initiated the construction of a million dwellings between 1965 and 1975, now called the Million Homes Program [7]. As Meijer et al. [5] emphasize, these buildings have a common characteristic of generally poor insulation and a relatively high need for renovation, and estimations indicate that 75% of these building are in need of renovation [8,9].
The national targets of Sweden, originating from the targets of the European Council [10], state that by 2020 GHG emissions shall be decreased by 40% (relative to 1990) and no net emissions shall occur by 2045. The energy intensity shall decrease by 20% by 2020 (relative to 2008 and expressed as less input energy per unit gross domestic product), and by 50% by 2030 (relative to 2005). By 2020, the share of renewable energy shall be 50% of the total energy use, and by 2040 electricity production shall be from 100% renewable resources [11,12]. The Swedish government [11] also states that fossil fuel is not to be used for heating purposes by 2020. Moreover, substantial energy efficiency measures ought to be carried out within the residential and services sector. The sector has been identified as having high potential for energy savings with sufficient technical solutions, including, e.g., renovation as well as energy storage and scheduling [13,14,15,16,17]. Werner [4] also highlights that savings has been made in building stock, explained by reduced heat demand in buildings of the Million Homes Program, lower demands in newer buildings and milder climate. However, as Svenfelt et al. [13] conclude, knowledge, incentives, and policy work need to address the actors with direct influence in the field.
The Swedish government has expressed that DH utilizing the technique of combined heat and power (CHP) plants provides the opportunity to make use of energy that would otherwise be wasted [11,12]. The use of DH has steadily increased over the past 50 years, from 13 to 60 TWh, mainly in the residential and services sector, and by 2018 ~10% of Sweden’s electricity production capacity comes from CHP technique [3]. Studies emphasize the role of the CHP technique in the energy transition from fossil fuel to renewable resources [18,19,20,21]. However, Werner [22] highlights a low utilization and low awareness of the benefits on a global level. Furthermore, considering the work of reducing GHG emissions, the potential electricity output from European CHP plants could be more than doubled [23]. Studies also points to the unclear role of a DHC system in a future energy system, where questions regarding surplus electricity from intermittent sources and future access to conventional fuel as waste and biomass are unexplored [24]. Stankeviciute [23] points to increased competition for biomass with the transport sector as a limitation for the CHP potential. Furthermore, studies highlights potential issues where CHP plants are unprofitable in a Nordic market and a prevailing trend of heat-only boilers replacing CHP plants in DH production [25].
According to the Swedish Energy Agency [26], energy use within the residential and services sector will increase slightly during the coming years, mostly caused by increased use of DH due to colder weather than in previous years. A marginal increase in energy use is expected from newly constructed buildings. The prognosis until 2050 points to a decreased use of DH, with the main reasons being energy efficiency measures in the existing building stock and heat pumps starting to compete with DH in multifamily buildings [27], the latter showing an increased market share for heat supply over the past two decades [4].
The aim of this paper is to analyze the impact of renovation on a multifamily building stock in a regional energy system utilizing a CHP technique. The renovation measures are related to the building envelope, ventilation, and substitution from DH to a ground source heat pump (GSHP). The key performance indicators are the specific energy use and energy performance of the renovated building, and, regarding the district heating and cooling (DHC) system, primary energy savings, peak power demand, electricity production and demand, as well as local and global GHG emissions.
The two parts of this study—the renovation of multifamily buildings, and effects on DHC systems due to changes in demand—are studied in several previous studies. However, most studies treat the parts separately and there are few studies that combine both parts from a wider systems perspective, meaning analyzing the renovation’s impact on a DHC system, and even fewer studies that analyze the subsequently climate effects in terms of local and global GHG emissions. A common approach in order to analyze the issues is to utilize the general idea of a systems perspective approach inspired by Churchman [28], who introduced the subject, and further promoted by, e.g., Bijker et al. [29] and Olsson and Sjöstedt [30]. A solution or change in a large system may have a great impact on its surroundings, and it is crucial to understand the system’s objective, performance, and environment in order to minimize the risk of suboptimization [31].
Regarding studies with a wider systems perspective, Ramírez-Villegas et al. [32] examined how different renovation strategies impact the energy rating of the building and local GHG emissions from the DH system. Moreover, Lidberg et al. [33] concluded that renovating a building envelope decreases GHG emissions more than measures regarding ventilation, due to the increased electricity demand of the latter. It also stresses that all renovation measures decrease the DH demand, resulting in a loss of electricity production at CHP plants. The possible issues caused by decreasing heat demand and increasing electricity demand, i.e., if DH is replaced by heat pumps, are seen in other Nordic countries [34,35,36,37,38,39]. One concern is a possible suboptimization of the energy system in terms of emissions, where heat normally supplied by renewable DH would be substituted by heat pumps using nonrenewable electricity. However, this concern is only applicable to DH systems using a CHP technique, as mentioned by Le Truong et al. [40], who also conclude that primary energy savings are higher for the renovation of buildings connected to DH systems using heat-only boilers, as there are no losses in electricity production.
A related study carried out by Difs et al. [41] concluded that local electricity savings in the energy system should be prioritized over a reduction in DH use. This is due to both economics and the assumption of a deregulated European electricity market leading to global GHG emissions outweighing the saving in local GHG emissions. Djuric Ilic et al. [42] studied opportunities for a reduction of global GHG emissions by introducing biofuel production in a DH system. The study concluded that the potential for a reduction of global GHG emissions highly depends on whether the biofuel is seen as a limited or unlimited resource and the alternative use of biofuel. Moreover, as Olsson et al. [43] highlight, when concluding that methodological choices affect the results when estimating GHG emissions from DH systems, the local conditions should be considered when assessing DH systems.
The main contribution of this work regards the renovation packages including common measures along with a substitution from DH to GSHP, and the resulting energy performance on a building level and resulting impact of local and global emissions. Moreover, the analyzed impact of peak power needed in the DHC system can contribute to the scientific community when analyzing large scale renovation. The study is also well established in the non-academia in the region of the study, as the research include and involve energy and housing companies.

2. Method

A framework is designed, which includes modeling of a building energy simulation model and optimization model of the DHC system. As illustrated in Figure 1, the results of six building energy simulations are scaled-up to a larger building stock in order to analyze the impact of a proposed larger renovation of the city’s building stock. A scenario with no renovation sets a references level, and five different scenarios follow. The building energy simulation uses the software IDA ICE version 4.8 [44]. The time division of the resulting energy demand from the building energy simulations is converted from hourly data to a flexible time division suitable for larger energy systems such as DHC using the program Converter [45]. The scenarios are then analyzed within the scope of the DHC system using the linear optimization program MODEST [46]. The analysis studies both the results regarding energy performance from the building simulations and the effects on the DH system in terms of primary energy savings, electricity demand and production, as well as local and global GHG emissions. Section 2.1 and Section 2.2 present the software tools used in the study, while Section 3 describes the design of the scenario study as well as input and use of the software tools.

2.1. Building Energy Simulation

The energy saving potential in the building stock was estimated using a whole building energy simulation in IDA Indoor Climate and Energy (ICE). IDA ICE is a dynamic simulation tool for modeling building performance, thermal conditions, and comfort indices [47]. The software also includes balancing equations for CO2, humidity, and domestic and supplied energy. IDA ICE has been validated in accordance with ASHRAE Standard 140-2004 [48], CEN Standards EN 15255-2007 and 15265-2007 [49], and CEN Standard EN 13791 [50]. IDA ICE has also been validated with test cell measurements as part of IEA’s SHC Task 34 [51].

2.2. Optimization of the District Heating and Cooling System

MODEST is an optimization program for regional energy systems developed at Linköping University in 1997. The acronym MODEST is short for “Model for Optimization of Dynamic Energy Systems with Time-dependent components and boundary conditions” and the software has been used in several research studies. MODEST may be used to analyze different energy systems and components, at both local and national levels. The software includes energy flows from sources via conversion and distribution to serve a provided demand. The model’s objective is to analyze the lowest possible system cost to supply the demand [52]. Hence, the results from MODEST will represent an optimum production mix in terms of cost efficiency. The system’s GHG emissions, peak power, and primary energy use in the production mix will also be analyzed. The software is mainly developed and used for studies regarding DH, e.g. Lidberg et al. [33], Henning [52], and Åberg et al. [53,54], but other modeling studies using MODEST include the national electricity grid [55], utilizing waste heat from industries [56,57], introducing large-scale heat pumps in DH [58], and biogas systems [59].
What distinguishes this software from other similar programs, such as MESSAGE [60], MARKAL [61], and its successor TIMES [62], is that MODEST has a flexible time division to reflect fluctuations. The time division describes a full year with several periods reflecting seasonal, weekly, and daily dependencies [63]. Moreover, the seasonal changes in the climate are represented in this time division presented in Table 1. The seasons of spring, summer and autumn are divided into periods of night and daytime to cope with the variations, whilst the high use winter months are analyzed more closely. This is done by selecting the peak power of each time period in each month. The demand in the DH system peaks during the mornings when the majority of the people wake up and industries are picking up. This analysis of the heat demand may also be used to study peak power needed in the system.
In order to convert a full year of hourly data from IDA ICE into the MODEST time division seen in Table 1, the software Converter is used. The software sorts the hourly data into seasonal and diurnal variation according to MODEST’s time divisions and selects each division’s and month’s peak power. The software is developed at the Energy Systems division at Linköping University.

3. The Scenario Study

The study is performed as a scenario analysis and the location is Linköping, Sweden—a city with 160,000 residents located 200 km southwest from Stockholm. In addition to the national sustainability goals, the municipality of Linköping is aiming at becoming carbon neutral by 2025 [64]. In this work, publicly utility companies, such as the two companies involved in this study, are important actors. Linköping, like many other cities, is facing the challenge of an aging building stock in need of renovation, with approximately 70% of Linköping’s total stock of multifamily buildings having been built prior to the 1980s [6].
The scenario study is illustrated in Figure 2. A larger energy system is represented by a DHC system, operated by Tekniska verken AB, and a subsystem consisting of a multifamily building stock, managed by Linköping’s largest housing company Stångåstaden AB. The renovation measures included in the analysis was implemented in the reference building, presented in Section 3.1, when it was renovated in 2014 and were decided based on common praxis of the building owner. Several studies have studied similar renovation approaches and identified great potential for reducing heat demand in building by adding thermal insulation [65,66,67,68] and ventilation measures [66,67,69,70]. Therefore, the scenarios constitutes of substitution from DH to GSHP, as this is a potential future competitive situation [27], and measures on building envelope and ventilation, which are common measures regarding this type of building [9,71].
The energy performance of the buildings will be analyzed on a general level whilst a more detailed analysis will be conducted on the larger DHC system in terms of primary energy savings, electricity demand and production, as well as local and global GHG emissions.
The DHC system in Linköping is the third largest high-temperature system in Sweden. The majority of the heat, cooling, and electricity production comes from CHP plants mainly using household waste, biofuels, coal and oil as fuel. The demand during a normal year amount to 1700 GWh heat, 60 GWh cooling, and 400 GWh electricity. Moreover, of the total DH demand, 40% derives from multifamily buildings [72].
Stångåstaden AB has approximately 20,000 rental multifamily buildings, which is roughly 40% of the city’s stock of multifamily buildings. The majority of the buildings are located in the urban areas and utilize DH for heating purposes. The reference building used for estimating energy efficiency potential in the building stock is a five story multifamily building located in central Linköping and connected to the DH network [71]. The building was constructed in 1961 and has a common construction for buildings from the time period of the record years and the million homes program. Moreover, the construction is a common type in Stångåstaden’s building stock, and the company manages several homogeneous areas with buildings of this type that will be renovated over the coming years.
In order to analyze the effects on the DHC system, the building energy simulation results will be scaled-up to a larger building stock. The stock is a selection of similar types of buildings in Stångåstaden’s building stock. The selection of buildings was constructed between 1961 and 1975 and consists of detached multifamily buildings with exhaust air ventilation. Moreover, the selected building stock has a mean energy performance of 155 kWh/m2 and comprises 273,500 m2, which is close to 10% of Linköping’s residential area in terms of multifamily buildings.
The studied building presents an annual energy performance of 140 kWh/m2 in the building energy simulation, as will be seen in the reference scenario later on. It is 10% lower than the mean energy performance of the selected building stock. This is explained mainly by the good thermal properties of the building, relative to other buildings from the time period [73]. However, it also infers that it is improbable that the results of the upscaled building stock would be an overestimation.

3.1. The Reference Building and Renovation Scenarios

The original construction can be seen in Table 2 along with the envelope measures conducted in 2014 when the building underwent deep renovation. The renovation included insulation of the façade (100 mm) and attic (180 mm), new windows with a glazing heat transfer coefficient (U-value) of 1.1 W/m2·K and solar heat gain factor (g-value) of 0.43. A balanced mechanical ventilation system with heat recovery was also part of the renovation and is included in the scenarios presented in Table 3.
The building model used in this study has been previously validated with regard to its accuracy in prediction at both zone and building levels [71]. The model predicted the indoor air temperature with a maximum standard deviation of 0.4 °C from measurement during winter in a reference apartment in the building. The predicted annual space heating demand had a difference from measured heat demand of 3.7% before renovation and 5.6% after the renovation.
Standard values from a Swedish setting were used as input data for the simulations [76]. The residents in the building were assumed to use 30 kWh of electricity per square meter of apartment area for domestic purposes and 70% of this is assumed to be useful heat gains when there is a heat deficit. The residents were assumed be away from the building during office hours and to use the majority of the electricity when they were at home, see La Fleur et al. [71]. The thermal bridges were set to “normal” in IDA ICE version 4.8. The annual space heating was simulated during normal year corrected climate data from Linköping [77]. The simulation had a variable time step (maximum 1.5 h) with an output time step of 1 h. The desired indoor temperature was assumed to be 21 °C, in accordance with the recommendations of the Swedish National Board of Health and Welfare [78].
The selected scenarios derive from when the reference building was renovated in 2014 and include measures on the building envelope and ventilation. A substitution of the heating solution, from DH to GSHP, is also added in this study. The scenarios are presented in Table 3. The building and its energy use prior to the deep renovation in 2014 serve as a reference scenario (R). Scenario 1 consists of DH as the heating system along with building envelope measures. An extensive renovation with additional ventilation measures comprises scenario 2. The renovation package of scenario 2 also includes the measures carried out in 2014, and previously studied by La Fleur et al. [71,79]. Furthermore, scenario 3 consists of a substitution from DH to GSHP, scenario 4 adds measures on the envelope and, lastly, added ventilation measures make up scenario 5.
The ground source heat pump, introduced in scenarios 3–5, was simulated using the early state building optimization plant in IDA ICE. The maximum power of the heat pump was 60% of maximum power demand, and the maximum coefficient of performance of the heat pump is 4.

3.2. The DHC System

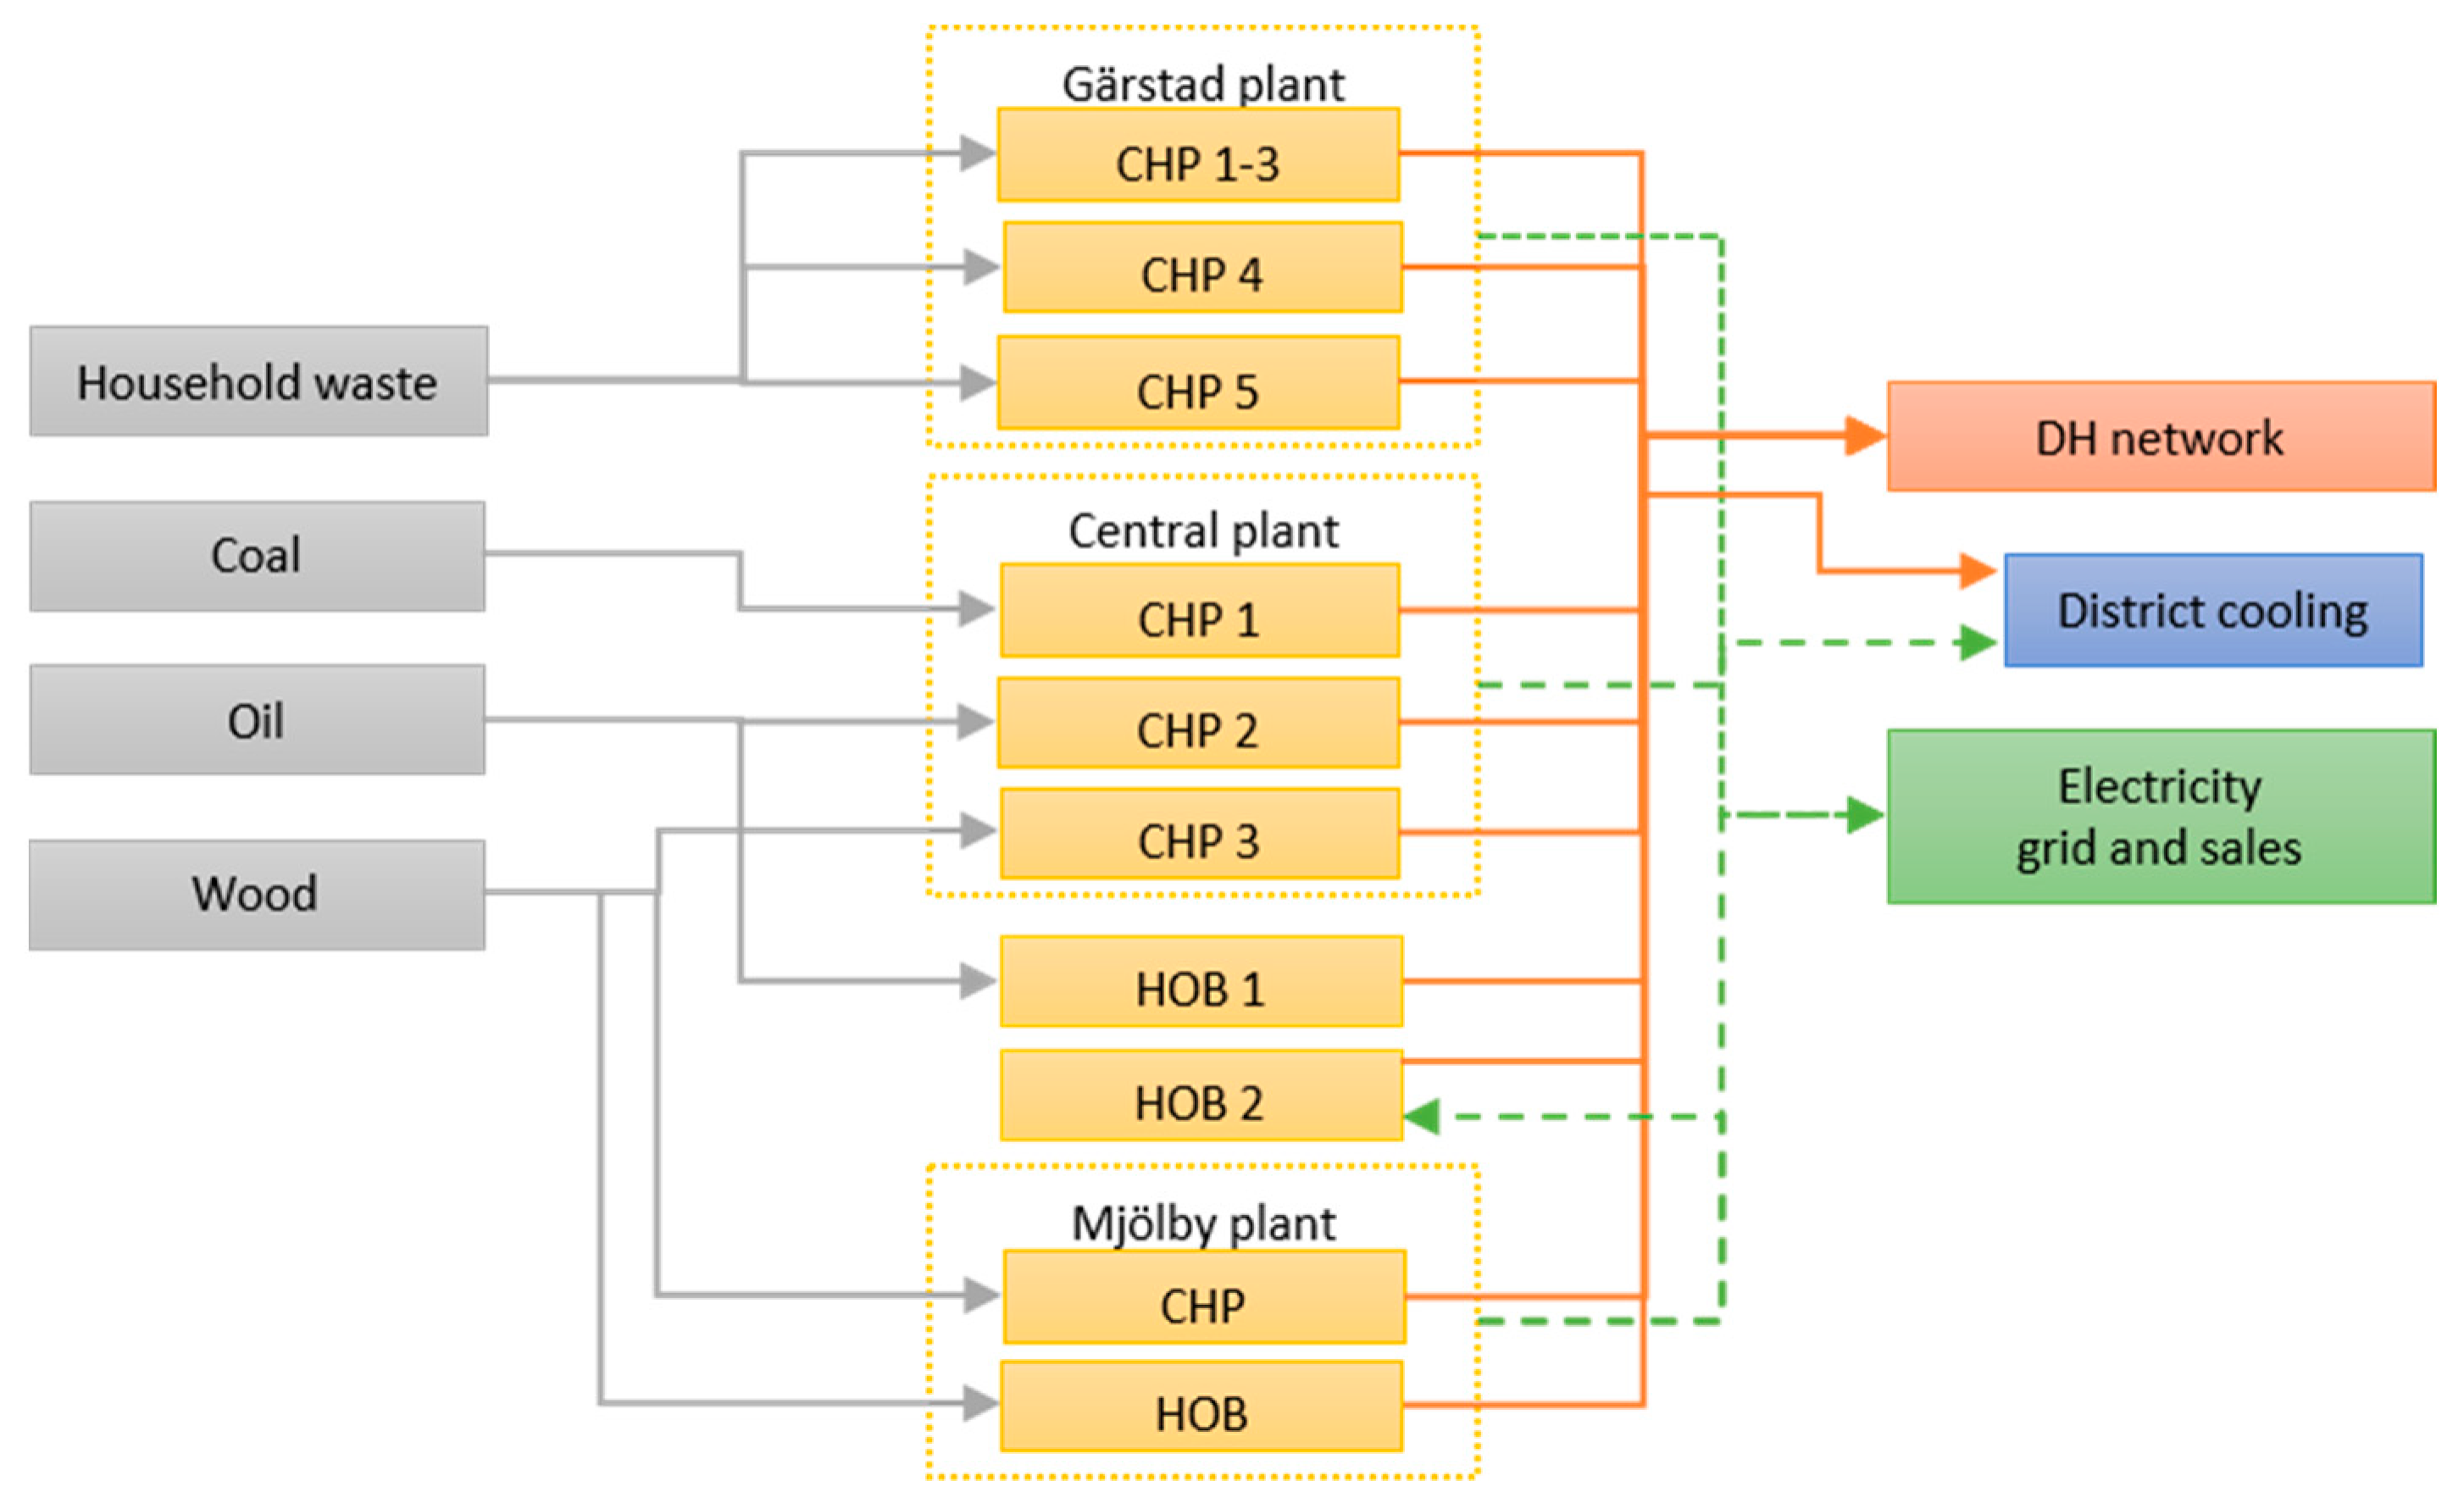
Figure 3 presents a description of the DHC system, with the demands of electricity, district cooling and DH. The DHC production is based on two incineration CHP plants: the Gärstad waste-based CHP plant located in the northern part of Linköping and the mixed fuel CHP plant located in the central part. The system is complemented with a third biofuel-based CHP plant in the nearby town of Mjölby, and heat-only biofuel boilers. As a backup, there are also heat-only boilers (HOBs) using oil and fat to cover peak loads.
The Gärstad CHP plant consists of three waste incineration boilers, called CHP 1–3, 4 and 5 in Figure 3, with a flue gas condensing and steam turbine through a gas turbine heat recovery steam generator, a so-called hybrid system. CHP 1–3 have a maximum capacity of 75 MW heat, an additional 15 MW heat from flue gas condensing, and 10 MW electricity. A decision was made to expand the Gärstad waste incineration plant by adding fourth and fifth waste-fueled boilers with steam turbines (CHP 4 and 5). The fourth boiler with flue gas condensing and steam turbine max capacity is 68 MW heat, an additional 15 MW heat from flue gas condensing and 19 MW electricity. The fifth boiler with steam turbine can produce 84 MW, an additional 12 MW heat from flue gas condensing and 21 MW electricity. The steam from waste incineration in all Gärstad CHP plant’s boilers is used for heat and electricity production or only heat production. The majority of waste is organic and comes from households in the surrounding region. The technical input data may be seen in Table 4.
The central CHP plant consists of three boilers and three steam turbines, two back-pressure turbines and one combined condensing and backpressure turbine. The first boiler is fueled with a mixture of coal, with fractions of rubber and wood. The second boiler uses heating oil. The third boiler, with flue gas condensing, is fueled with wood and fractions of plastics. The central plant can produce electricity and heat or use a direct condenser for the sole production of heat. Cooling of condensing turbine occurs with water from the nearby river Stångån. This means that heat of approximately 50 GWh/year may be wasted in a recooler in Stångån.
District cooling is produced in a district heating-driven absorption plant of 12 MW and an electricity-driven compression-cooling plant of 6 MW, and is distributed by a network in the same way as district heating in order to satisfy the cooling demand in Linköping’s urban area.
In order to calculate local and global GHG emissions, factors presented in Table 5 are used. The locally emitted GHG is a result of the fuel use in the DHC system. Also included in this study is the globally emitted GHG caused by changes in electricity production and increase in demand.

4. Results

The results are presented in three parts. Firstly, the results of the building energy simulation are presented in terms of specific energy use and energy performance. Secondly, results from the optimization model of the DHC system are presented concerning primary energy use, peak power demand and changes in electricity production and demand. Thirdly, local and global GHG emissions are analyzed.

4.1. Specific Energy Use and Energy Performance

The annual values of the scenarios from the building energy simulations are presented in Table 6 and divided by DH use and electricity use. Also presented are the specific energy use and the energy performance values attained by using primary energy factor for DH and electricity [82]. Since 1 January 2019, energy performance are used as a comparative figure in documentation and statistics for buildings in Sweden [82]. Specific energy was previously used, and in this study the specific energy use is analyzed further in the context of the DHC system and the demand of heat and electricity. The energy performance savings range between 11% and 32% within DH solutions, and between 15% and 29% within the solution utilizing GSHP. Including both heating solutions, the results range is between 11% and 56% relative to the reference scenario R. The results indicate a larger reduction in specific energy use for scenarios 3, 4, and 5 utilizing GSHP, where the coefficient of performance of the pumps influences the results. The simulation utilizing the early state building optimization plant in IDA ICE presents an average coefficient of performance of the heat pump of 3.2.
In Figure 4, where the monthly specific energy supplied is presented, Sweden’s seasons are evident, with high use during winter and low use during summer. The demand for domestic hot water is the main reason for the demand during the summer months. The windows installed in the renovation have a lower solar heat gain factor (g-value) than in the reference case. Thus, the solar heat gain is reduced, and the heat demand is slightly higher during months with large amounts of solar radiation, even though the heat losses have been reduced. The majority of the heat losses occur via ventilation and building envelope transmission losses are relatively small, meaning that insulation measures on the building envelope have limited potential.
The annual demand for supplied energy of the upscaled building stock for each scenario are presented in Table 7. The building stock results in a DH demand of 35.9 GWh, which corresponds to approximately 2% of Linköping’s total DH demand. Scenario 1 only reduces the demand for DH, whilst the additional ventilation measures in scenario 2 cause increased electricity demand and further decreased DH demand. Scenarios 3–5, with a solution utilizing GSHP, result in a large increase in electricity demand and erase the DH demand. Scenario 3 is the scenario that demands most electricity. Furthermore, when including envelope measures, the electricity demand decreases and when including ventilation measures the demand for supplied energy in the form of electricity decreases further.

4.2. Primary Energy Savings, Peak Power Demand, and Electricity Production

Household waste serves as the main primary energy used in Linköping’s DHC system, as seen in Figure 5a. Moreover, biofuels (wood) along with waste contribute to production capacity of 330 MW. For more capacity, fossil fuel needs to be utilized although coal is introduced earlier in the production due to limitations in fuel use. The HOB using wood and oil kicks in during peak loads, seen in Figure 5a during the high use period of approximately 500 h.
Figure 5b presents the peak power demand in the DHC system in the reference scenario R, with values ranging from 310 MW to 475 MW. The highest peak demand occurs in the morning hours of January and February and, as seen in Figure 4, the largest savings are made in the colder winter months, when peak power occurs in the DHC system.
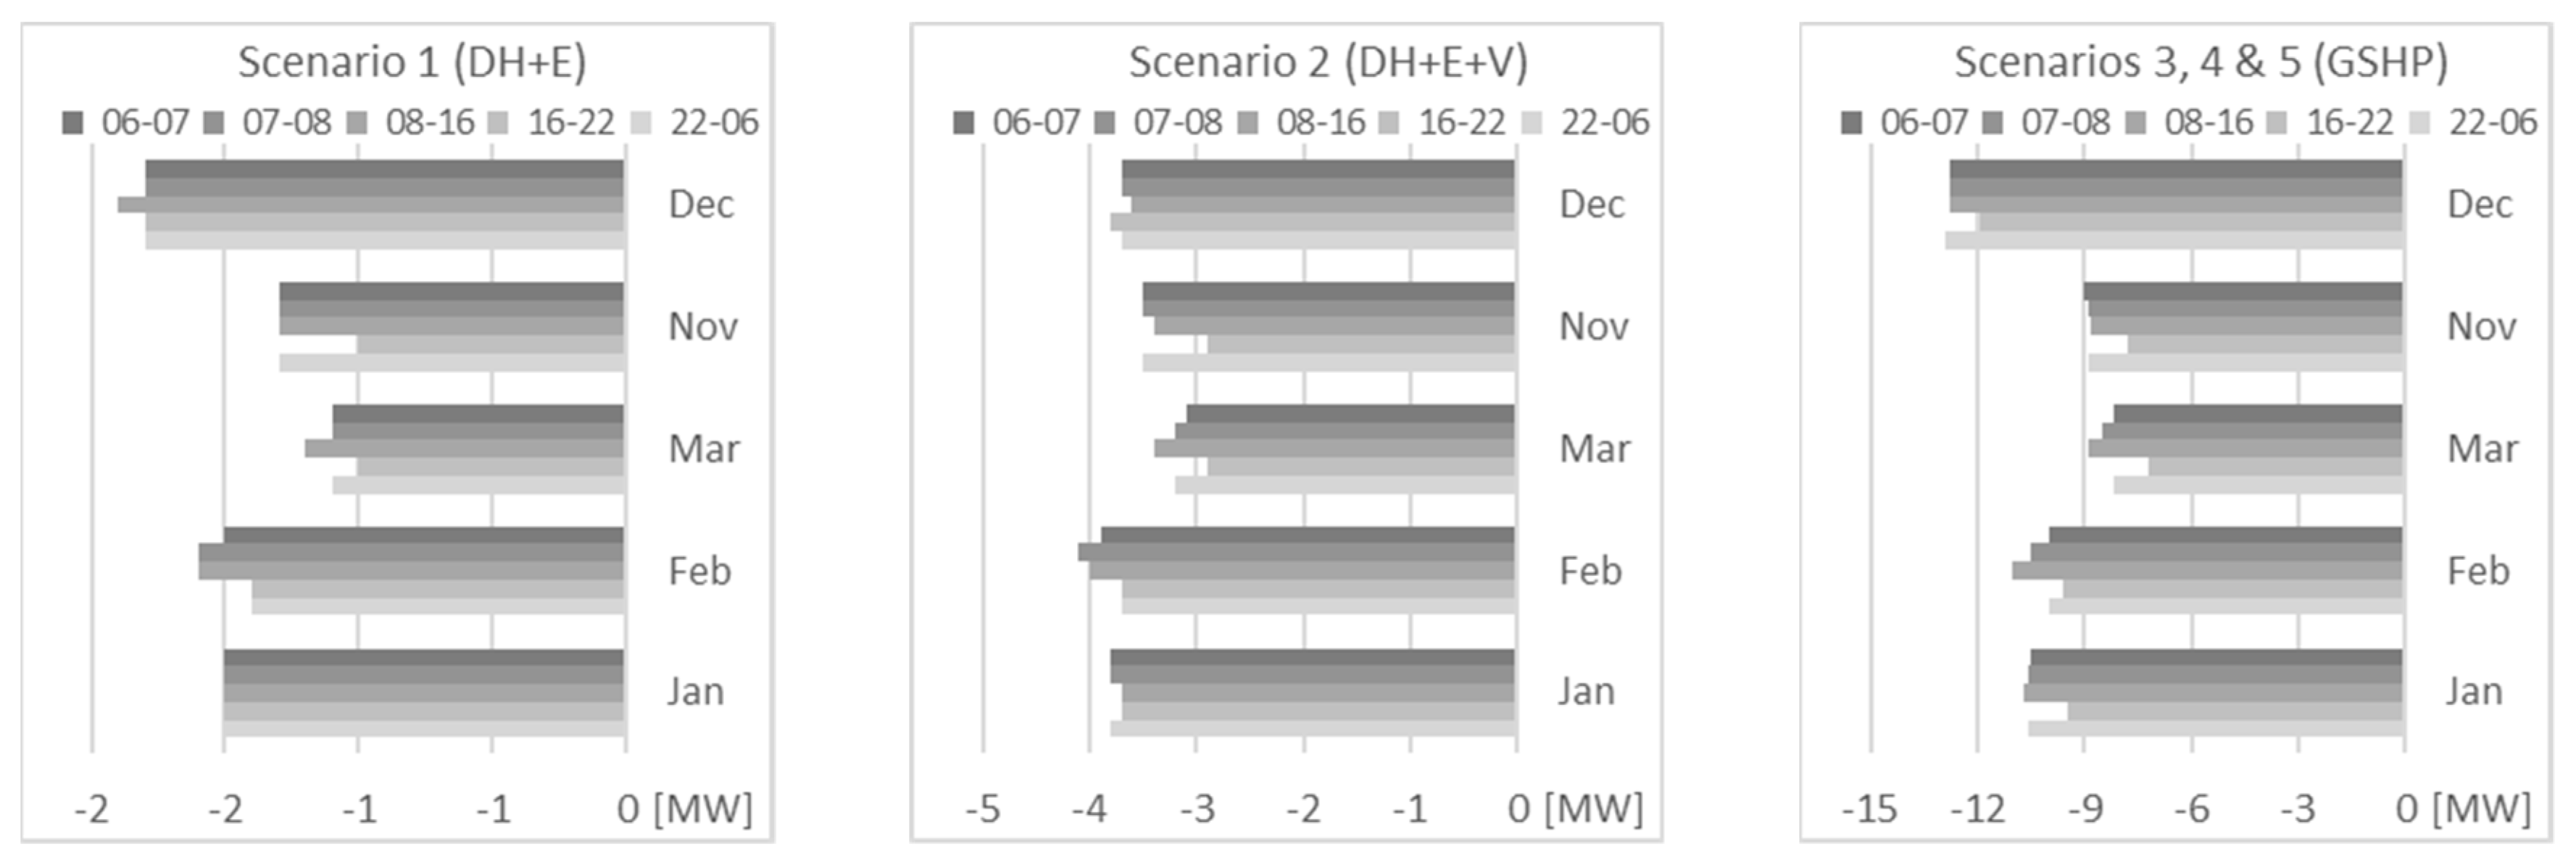
Figure 6 presents an analysis of the changes in peak power demand caused by the studied scenarios. All proposed measures decrease the peak power needed in the system in the range of 1 to 13 MW over the studied colder months and time periods. Scenario 1, which includes building envelope measures, contributes by reducing the peak load of 1 to 2 MW, corresponding to 4–7 W/m2 heated area in the building stock studied. The resulting reduction varies over the months, with the largest reduction during December followed by February and January. Including ventilation measures, scenario 2 reduces the peak demand to 3–4 MW, corresponding to 11–15 W/m2 heated area. The results also show a more homogeneous appearance with equal values over the months.
Scenarios 3, 4, and 5 are all disconnected from the DHC system and use GSHP for heating purposes, resulting in a reduced peak demand in the DHC system of 8–13 MW, corresponding to 29–48 W/m2 heated area. Moreover, the results show a pattern similar to scenario 1, with a larger reduction in December, followed by January and February, and lastly March and November.
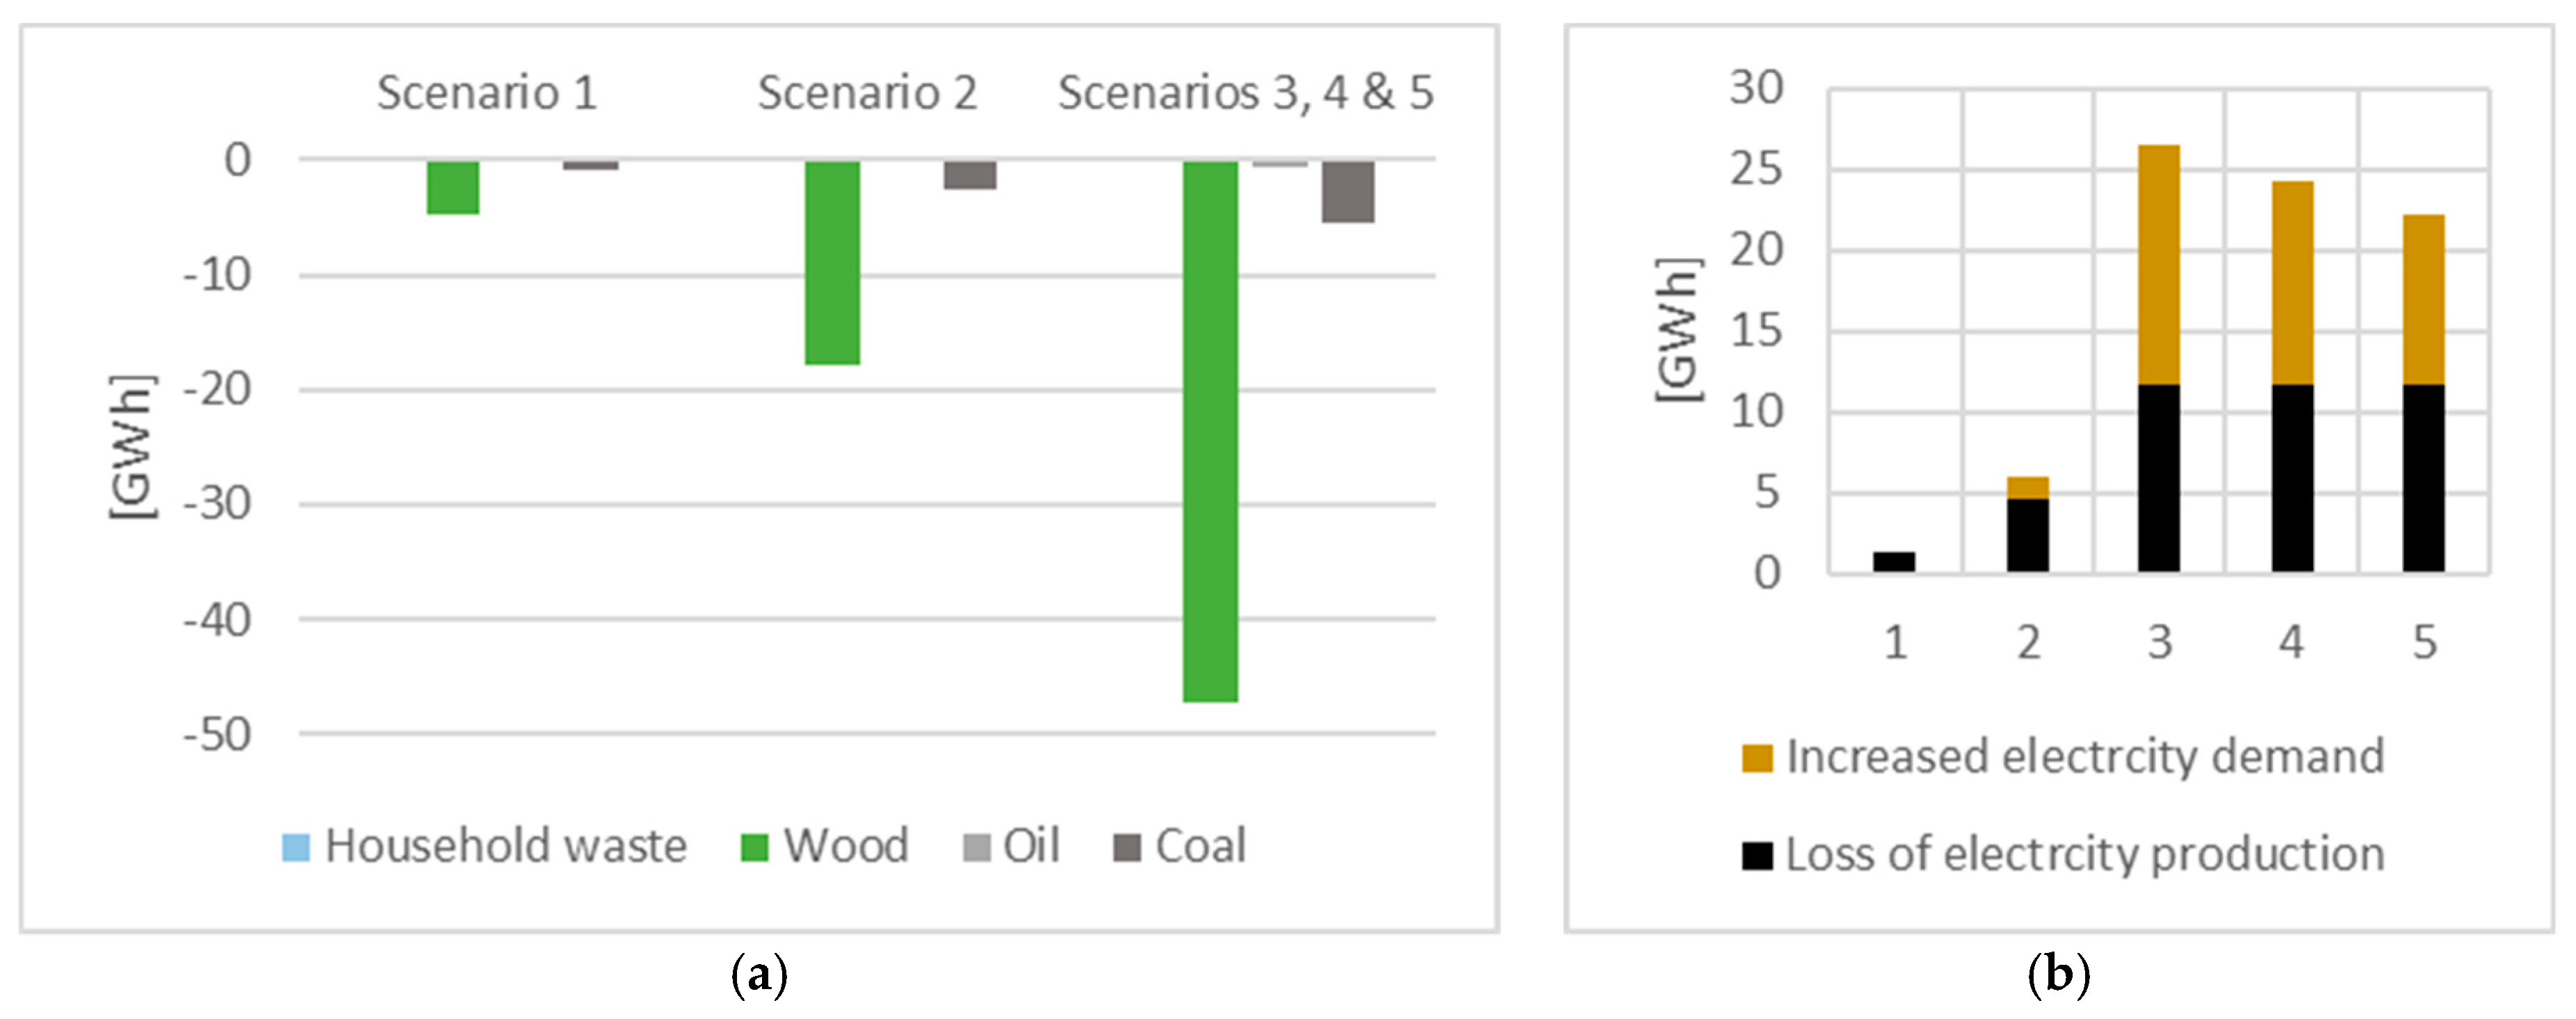
Figure 7a illustrates the primary energy saving in production units of the DHC system for each scenario. The majority of savings are made by reduced use of wood, with 5 GWh and 18 GWh for scenario 1 and 2 respectively and 47 GWh in scenarios 3, 4 and 5 when DH is substituted for GSHP. Also, savings in coal use, ranging from 1 GWh to 6 GWh, are made along with minor savings of oil.
The loss of electricity production from the CHP plants due to reduced DH demand along with increased electricity demand is visualized in Figure 7b. All scenarios cause loss of production, and in all scenarios except scenario 1 the electricity demand increases. Scenario 3 generates the largest impact of 26.5 GWh, followed by scenario 4 with 24 GWh and scenario 5 with 22 GWh, while scenarios 1 and 2 generate 1.5 GWh and 6 GWh, respectively.

4.3. Local and Global GHG Emissions

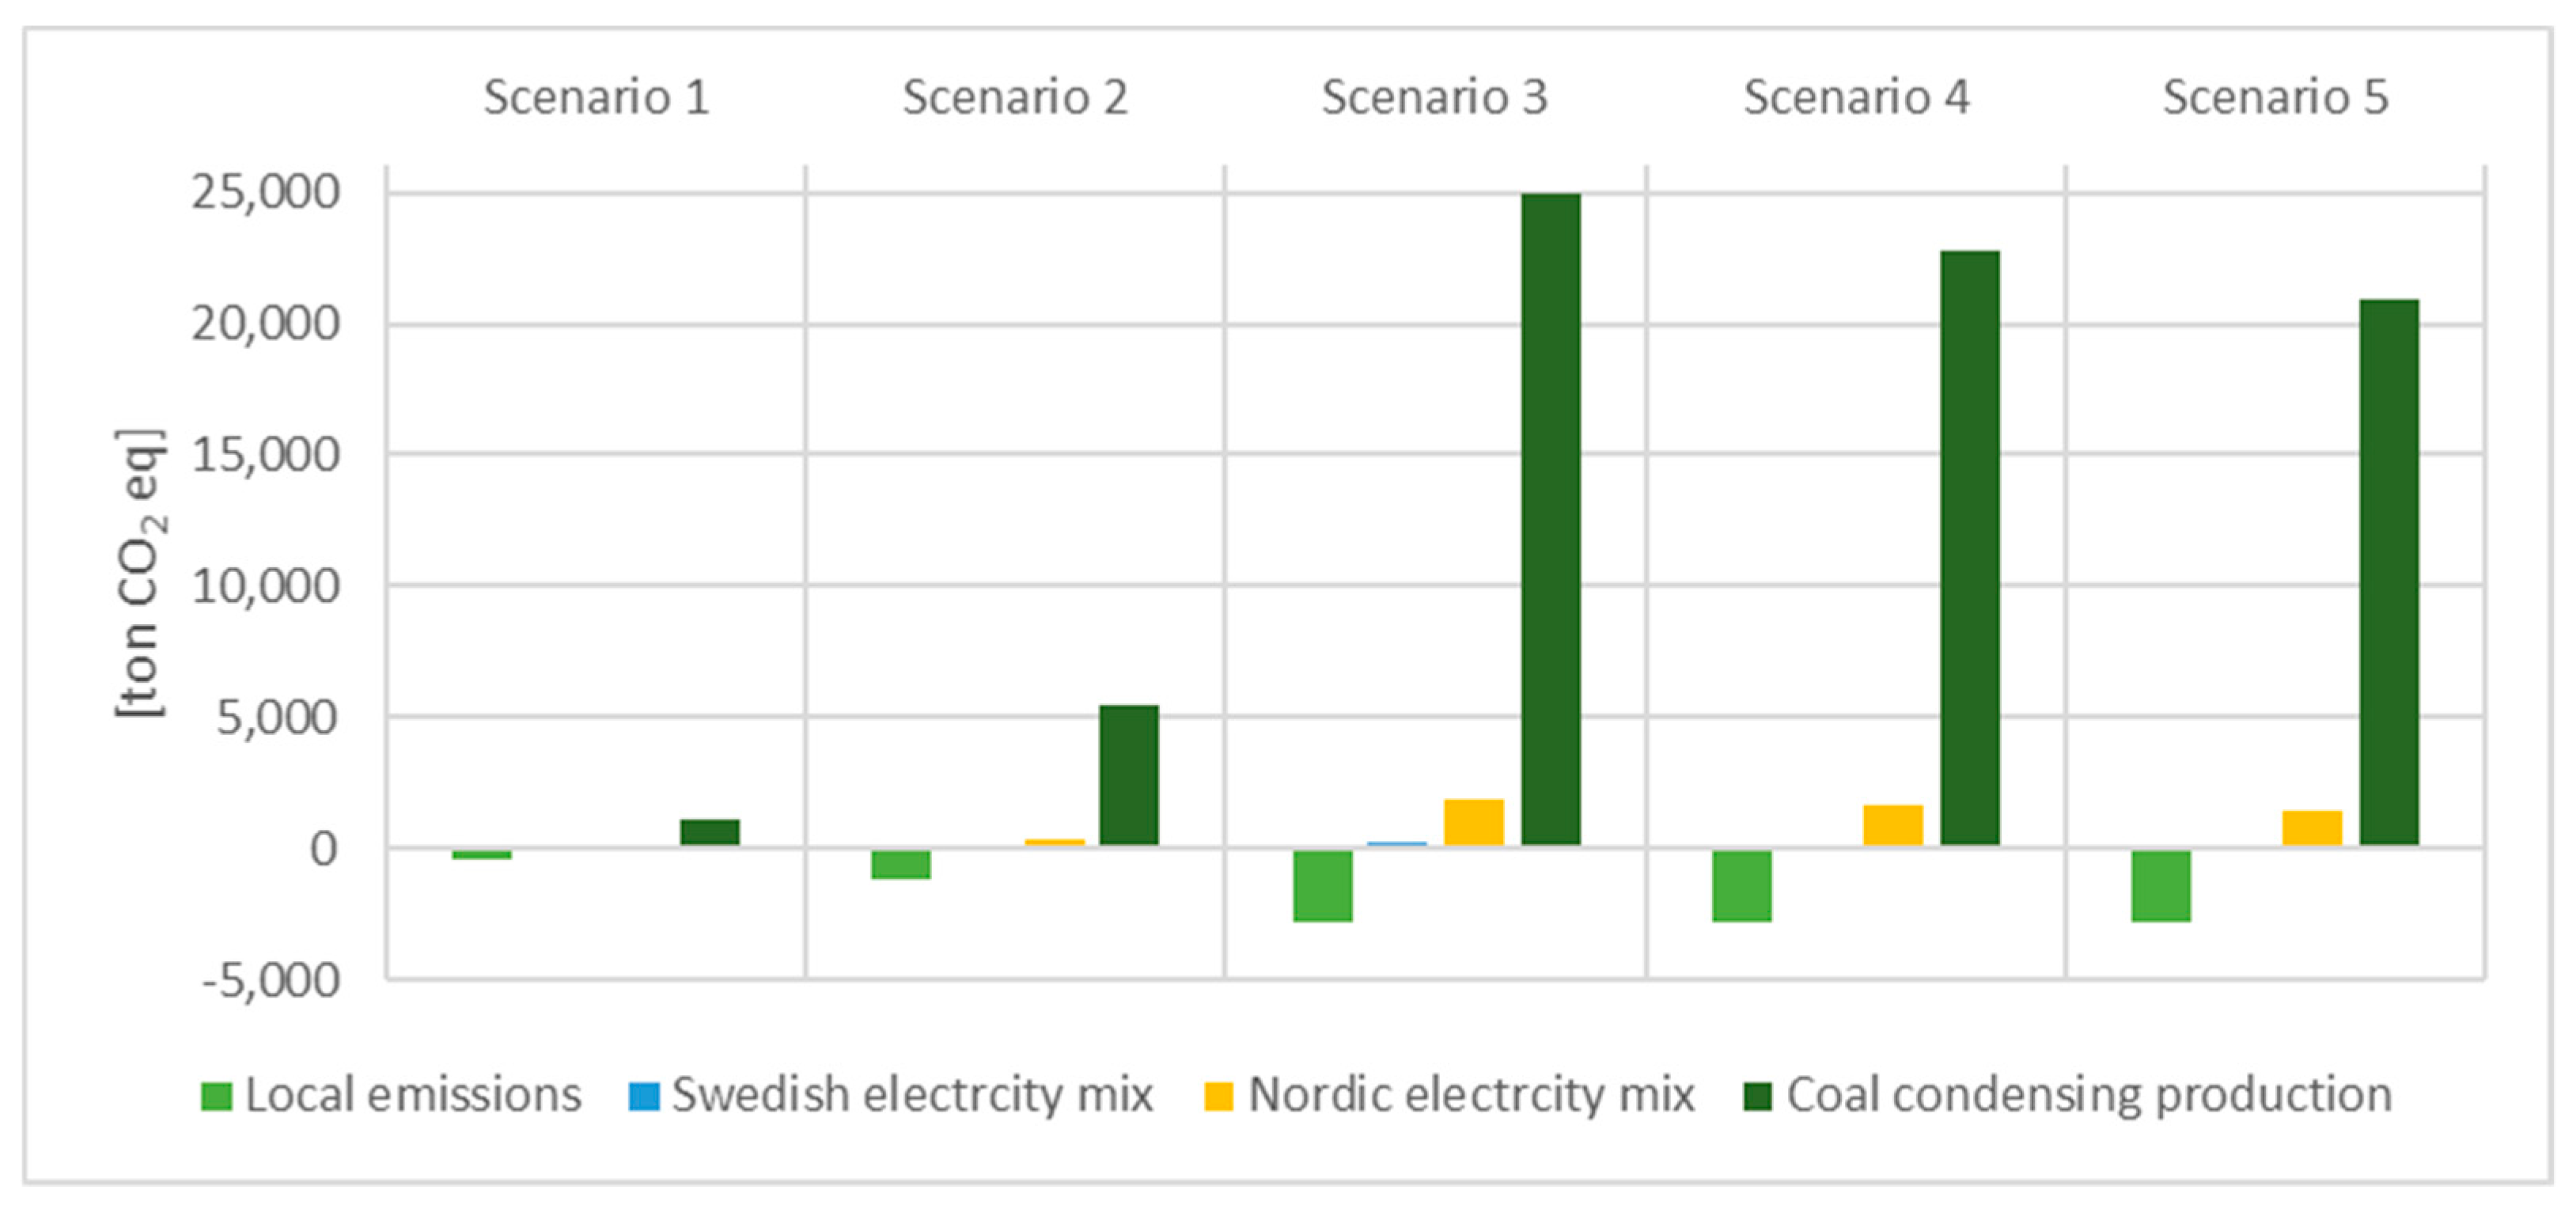
Figure 8 presents the impact of the scenarios on local and global emissions. The local emissions are reduced in all scenarios, ranging between 400- and 2800-ton CO2-equivalents, as a result of the reduced DH demand and thus a reduced use of primary energy from fuel, as seen in Figure 7a. However, as presented in Figure 7b, the loss of electricity production from the local CHP plants along with the increased electricity demand in scenarios 2, 3, 4 and 5 result in less available electricity on the market, which must be compensated for elsewhere. Depending on the systems perspective used, the effects on global emissions may be calculated differently. In Figure 8, the resulting increase in global GHG emissions is presented by three different emission factors (seen in Table 5): a Swedish electricity mix with a low emission factor, a Nordic electricity mix, and lastly the emission factor of coal condensing power promoted to use by [83] when analyzing changes in electricity production and use. Keeping a national or Nordic perspective, all scenarios contribute to a positive impact on global GHG emissions, when adding the local emissions. However, when considering a European integrated electricity market and using the factor of coal condensing electricity production, the global emissions are ranging between 1200- and 25,000-ton CO2 equivalents. A significant increase of global GHG emissions is seen in scenarios 3, 4 and 5, as the impact is an increase of 18,000- to 22,000-ton CO2 equivalents, including the decrease of local emissions.

5. Discussion

The savings in terms of supplied energy are larger within the scenarios with DH (R, 1, and 2) than within the scenarios with GSHP (3, 4, and 5), as presented in Table 6. Measures on the building envelope display limited potential, mainly due to relatively good U-values on the reference building. Added ventilation measures, on the other hand, contribute to a larger improvement, especially in scenario 2. A substitution from DH to GSHP (scenario 3) produces better results in terms of energy performance than the more extensive renovation scenario of scenarios 1 and 2. Moreover, scenario 3 produces good results, as the energy performance ends up close to 85 kWh/m2, which is the highest permitted value for new construction of multifamily buildings [82]. Scenarios 4 and 5 reduce the energy performance even further. This means that it should be considered whether the incentives for continuing with measures in scenarios 4 and 5 are high enough for the building owner. Moreover, as presented in Table 7, scenario 3 demands the most electricity and causes the largest GHG emissions as seen in Figure 8. Hence, this is the least desirable solution from a wider systems perspective. However, an incentive for further renovation measures, as in e.g., scenarios 4 and 5, may also be an improved indoor climate [79,84].
The largest reduction of peak power needed in the DH system occurs in December, as seen in Figure 6. December is also the peak month of use according to Figure 4, followed by January and February. However, December is not the month with the highest peak demand according to Figure 5b, where February followed by January and December are the high use months in terms of DH demand. This is explained by December being the month with stable low temperature days along with low solar radiation, causing the latent heat stored in the building to be low, and therefore requires more supplied energy. Moreover, during January and February the solar radiation and latent heat increase, but it is also during those months that the single coldest days of the year occur, causing the peak demand in the DH system.
The results indicate reduced energy use and reduced demand for heat in the DHC system. This subsequently reduces electricity production at the CHP plants. In Sweden, DH is mainly based on nonfossil fuel, and the out-phasing should be done by 2020. This, in turn, leads to a reduction in global emissions if DH is used to a high degree. Thus, the two desires of decreasing energy use for heating purposes and decreasing GHG emissions may contradict each other. However, in this study, GHG emissions indicate a reduction on a local level, in accordance with the reduction of biofuel and coal use. It should be noted that a reduction in primary energy use of biofuel, if seen as a scarce resource, is calculated to have positive effect on GHG emissions. The biofuel may be used elsewhere and substitute fossil fuel as primary energy, as Lidberg et al. [33] and Djuric Ilic et al. [42] highlight. In the future, when the out-phasing of fossil fuel in the DHC systems has resulted in a fully renewable system, the reduced use of DH and subsequently reduced use of biofuel in such systems may contribute to a larger reduction of global GHG emissions.
Regarding local and global emissions, the Swedish government [12] has stated that the transmission capacity in the electricity grid, both domestic and between neighboring countries, shall increase. Hence, in the future we will have an integrated European electricity market. As promoted by the Swedish Environmental Research Institute [83], marginal production should be used when assessing changes in electricity use. This leads to the marginal electricity being coal condensing power, as presented in Figure 8. However, other solutions employ a closer geographical perspective and mixed production, such as a Nordic mix production or a national perspective, in this case a Swedish mix production [81].

6. Conclusions

  • All scenarios generate improved energy performance of the studied building, ranging from 11% to 56%, including both DH and GSHP heating solutions. Envelope measures have limited potential, while including ventilation measures, especially in combination with DH, generates a larger improvement.
  • Scenarios utilizing GSHP for space heating and hot water demand show the best energy performance when calculating in accordance with the Swedish National Board of Housing, Building and Planning. However, the scenarios with GSHP also cause the significantly larger negative effect on GHG emissions, relative to scenarios utilizing DH.
  • The peak power demand and, subsequently, the maximum capacity in the DHC system are reduced in all scenarios, ranging between 1 MW and 13 MW in the upscaled building stock or 4–48 W/m2 heated area.
  • In a future fossil-free DHC system, a reduction in primary energy use will lead to a local reduction of emissions along with a positive effect on the global GHG emissions. This will lead to efficiency measures including DH out-performing measures with heat pump solutions.

Author Contributions

Conceptualization, S.B., L.L.F., P.R., and L.Ö.; Data Curation, S.B. and L.L.F.; Formal Analysis, S.B.; Funding Acquisition, L.Ö.; Investigation, S.B.; Methodology, S.B.; Project Administration, S.B., P.R. and L.Ö.; Software, S.B., L.L.F., and S.A.; Supervision, P.R. and L.Ö.; Validation, S.B., L.L.F., and S.A.; Visualization, S.B.; Writing—Original Draft, S.B., L.L.F., and S.A.; Writing—Review & Editing, S.B., P.R., and L.Ö.

Funding

This study has been financed by the Swedish Agency for Economic and Regional Growth and the energy companies Tekniska verken AB and E. ON Sweden AB, as well as the housing companies Stångåstaden AB, AB Lejonfastigheter, Fastighets AB L E Lundberg, and Akademiska Hus AB.

Acknowledgments

The authors gratefully acknowledge Tekniska verken AB for the insights and information regarding the DHC system and Stångåstaden for information about the studied reference building and building stock.

Conflicts of Interest

The authors declare no conflict of interest.

References

  1. Swedish Energy Agency. Energiläget 2018—En Översikt; Swedish Energy Agency: Eskilstuna, Sweden, 2018. [Google Scholar]
  2. The Swedish Environmental Protection Agency (Sv: Naturvårdsverket) Territorial Emissions and Uptake of Greenhouse Gases (Sv: Nationella Utsläpp och Upptag av Växthusgaser). Available online: http://www.naturvardsverket.se/Sa-mar-miljon/Statistik-A-O/Vaxthusgaser-territoriella-utslapp-och-upptag/? (accessed on 7 February 2019).
  3. Swedish Energy Agency. Energy in Sweden Facts and Figures 2018; Swedish Energy Agency: Eskilstuna, Sweden, 2018. [Google Scholar]
  4. Werner, S. District heating and cooling in Sweden. Energy 2017, 126, 419–429. [Google Scholar] [CrossRef]
  5. Meijer, F.; Itard, L.; Sunikka-Blank, M. Comparing European residential building stocks: performance, renovation and policy opportunities. Build. Res. Inf. 2009, 37, 533–551. [Google Scholar] [CrossRef]
  6. Statistics Sweden (Sv: Statistiska Centralbyrån (SCB)) Housing, Construction and Buildingr—Dwelling Stock. Available online: http://www.scb.se/bo0104-en (accessed on 7 February 2019).
  7. Hall, T.; Vidén, S. The Million Homes Programme: a review of the great Swedish planning project. Plan. Perspect. 2005, 20, 301–328. [Google Scholar] [CrossRef]
  8. Johansson, T.; Olofsson, T.; Mangold, M. Development of an energy atlas for renovation of the multifamily building stock in Sweden. Appl. Energy 2017, 203, 723–736. [Google Scholar] [CrossRef]
  9. Boverket och Energimyndigheten. Basis for the Second National Strategy for Energy Efficient Renovation (sv: Underlag Till Den Andra Nationella Strategin för Energieffektiviserande Renovering); Boverket och Energimyndigheten: Karlskrona, Sweden, 2016. [Google Scholar]
  10. Commission of the European Communities. 20 20 by 2020 Europe’s Climate Change Opportunity; Commission of the European Communities: Brussels, Belgium, 2008. [Google Scholar]
  11. Reinfeldt, F.; Olofsson, M. Prop. 2008/09:163: En sammanhållen klimat- och energipolitik; Government Office: Stockholm, Sweden, 2008.
  12. Löfven, S.; Baylan, I. Prop. 2017/18:228: Energipolitikens inriktning; Government Office: Stockholm, Sweden, 2018.
  13. Svenfelt, Å.; Engström, R.; Svane, Ö. Decreasing energy use in buildings by 50% by 2050—A backcasting study using stakeholder groups. Technol. Forecast. Soc. Chang. 2011, 78, 785–796. [Google Scholar] [CrossRef]
  14. Hong, T.; Koo, C.; Kim, J.; Lee, M.; Jeong, K. A review on sustainable construction management strategies for monitoring, diagnosing, and retrofitting the building’s dynamic energy performance: Focused on the operation and maintenance phase. Appl. Energy 2015, 155, 671–707. [Google Scholar] [CrossRef]
  15. Carli, R.; Dotoli, M. Cooperative Distributed Control for the Energy Scheduling of Smart Homes with Shared Energy Storage and Renewable Energy Source. IFAC-PapersOnLine 2017, 50, 8867–8872. [Google Scholar] [CrossRef]
  16. Parra, D.; Swierczynski, M.; Stroe, D.I.; Norman, S.A.; Abdon, A.; Worlitschek, J.; O’Doherty, T.; Rodrigues, L.; Gillott, M.; Zhang, X.; et al. An interdisciplinary review of energy storage for communities: Challenges and perspectives. Renew. Sustain. Energy Rev. 2017, 79, 730–749. [Google Scholar] [CrossRef] [Green Version]
  17. Parra, D.; Norman, S.A.; Walker, G.S.; Gillott, M. Optimum community energy storage system for demand load shifting. Appl. Energy 2016, 174, 130–143. [Google Scholar] [CrossRef]
  18. Kim, H.-J.; Yu, J.-J.; Yoo, S.-H.; Kim, H.-J.; Yu, J.-J.; Yoo, S.-H. Does Combined Heat and Power Play the Role of a Bridge in Energy Transition? Evidence from a Cross-Country Analysis. Sustainability 2019, 11, 1035. [Google Scholar] [CrossRef]
  19. Lake, A.; Rezaie, B.; Beyerlein, S. Review of district heating and cooling systems for a sustainable future. Renew. Sustain. Energy Rev. 2017, 67, 417–425. [Google Scholar] [CrossRef]
  20. Sayegh, M.A.; Danielewicz, J.; Nannou, T.; Miniewicz, M.; Jadwiszczak, P.; Piekarska, K.; Jouhara, H. Trends of European research and development in district heating technologies. Renew. Sustain. Energy Rev. 2016, 68, 1183–1192. [Google Scholar] [CrossRef]
  21. Lund, R.; Mathiesen, B.V. Large combined heat and power plants in sustainable energy systems. Appl. Energy 2015, 142, 389–395. [Google Scholar] [CrossRef]
  22. Werner, S. International review of district heating and cooling. Energy 2017, 137, 617–631. [Google Scholar] [CrossRef] [Green Version]
  23. Stankeviciute, L.; Krook Riekkola, A. Assessing the development of combined heat and power generation in the EU. Int. J. Energy Sect. Manag. 2014, 8, 76–99. [Google Scholar] [CrossRef]
  24. Sernhed, K.; Lygnerud, K.; Werner, S. Synthesis of recent Swedish district heating research. Energy 2018, 151, 126–132. [Google Scholar] [CrossRef]
  25. Helin, K.; Zakeri, B.; Syri, S.; Helin, K.; Zakeri, B.; Syri, S. Is District Heating Combined Heat and Power at Risk in the Nordic Area?—An Electricity Market Perspective. Energies 2018, 11, 1256. [Google Scholar] [CrossRef]
  26. Swedish Energy Agency. Short Term Prognosis, Summer 2018; Swedish Energy Agency: Eskilstuna, Sweden, 2018. [Google Scholar]
  27. Swedish Energy Agency. Scenarios of Sweden’s Energy System (sv: Scenarier Över Sveriges Energisystem); Swedish Energy Agency: Eskilstuna, Sweden, 2017. [Google Scholar]
  28. Churchman, C.W. The Systems Approach; Delacorte Press: New York, NY, USA, 1968; ISBN 9780440584599. [Google Scholar]
  29. Bijker, W.E.; Hughes, T.P.; Pinch, T. The Social Construction of Technological Systems: New Directions in the Sociology and History of Technology; MIT Press: Cambridge, MA, USA, 1987; ISBN 0262521377. [Google Scholar]
  30. Olsson, M.-O.; Sjostedt, G. Systems Approaches and Their Application: Examples from Sweden; Kluwer Academic Publishers: Dordrecht, The Netherlands, 2004; ISBN 1402023693. [Google Scholar]
  31. Meadows, D.H.; Wright, D. Thinking in Systems: A Primer; Chelsea Green Publishing: Burlington, VT, USA, 2008; ISBN 9781603580557. [Google Scholar]
  32. Ramírez-Villegas, R.; Eriksson, O.; Olofsson, T. Assessment of renovation measures for a dwelling area—Impacts on energy efficiency and building certification. Build. Environ. 2016, 97, 26–33. [Google Scholar] [CrossRef]
  33. Lidberg, T.; Olofsson, T.; Trygg, L. System impact of energy efficient building refurbishment within a district heated region. Energy 2016, 106, 45–53. [Google Scholar] [CrossRef]
  34. Abdurafikov, R.; Grahn, E.; Kannari, L.; Ypyä, J.; Kaukonen, S.; Heimonen, I.; Paiho, S. An analysis of heating energy scenarios of a Finnish case district. Sustain. Cities Soc. 2017, 32, 56–66. [Google Scholar] [CrossRef]
  35. Rinne, S.; Syri, S. Heat pumps versus combined heat and power production as CO2 reduction measures in Finland. Energy 2013, 57, 308–318. [Google Scholar] [CrossRef]
  36. Reino, A.; Harm, M.; Hamburg, A. The impact of building renovation with heat pumps to competitiveness of district heating: Estonian district heating pricing system needs more flexibility. In Proceedings of the 2017 IEEE 58th International Scientific Conference on Power and Electrical Engineering of Riga Technical University (RTUCON), Riga, Latvia, 12–13 October 2017; pp. 1–6. [Google Scholar]
  37. Traaen, K.B. Bergvarmepumper: Lokale Eller Kollektive Energibrønner? Norwegian University of Life Sciences: Ås, Norway, 2018. [Google Scholar]
  38. Reda, F.; Fatima, Z. Northern European nearly zero energy building concepts for apartment buildings using integrated solar technologies and dynamic occupancy profile: Focus on Finland and other Northern European countries. Appl. Energy 2019, 237, 598–617. [Google Scholar] [CrossRef]
  39. Heinonen, J.; Laine, J.; Pluuman, K.; Säynäjoki, E.-S.; Soukka, R.; Junnila, S.; Heinonen, J.; Laine, J.; Pluuman, K.; Säynäjoki, E.-S.; et al. Planning for a Low Carbon Future? Comparing Heat Pumps and Cogeneration as the Energy System Options for a New Residential Area. Energies 2015, 8, 9137–9154. [Google Scholar] [CrossRef] [Green Version]
  40. Le Truong, N.; Dodoo, A.; Gustavsson, L. Effects of energy efficiency measures in district-heated buildings on energy supply. Energy 2018, 142, 1114–1127. [Google Scholar] [CrossRef]
  41. Difs, K.; Bennstam, M.; Trygg, L.; Nordenstam, L. Energy conservation measures in buildings heated by district heating- A local energy system perspective. Energy 2010, 35, 3194–3203. [Google Scholar] [CrossRef]
  42. Djuric Ilic, D.; Dotzauer, E.; Trygg, L.; Broman, G. Introduction of large-scale biofuel production in a district heating system- an opportunity for reduction of global greenhouse gas emissions. J. Clean. Prod. 2014, 64, 552–561. [Google Scholar] [CrossRef]
  43. Olsson, L.; Wetterlund, E.; Söderström, M. Assessing the climate impact of district heating systems with combined heat and power production and industrial excess heat. Resour. Conserv. Recycl. 2015, 96, 31–39. [Google Scholar] [CrossRef] [Green Version]
  44. EQUA Simulation AB. IDA ICE- IDA Indoor Climate and Energy, Version 4.6.2; EQUA Simulation AB: Solna/Stockholm, Sweden, 2014. [Google Scholar]
  45. Division of Energy System at Linköping University. Converter; Linköping University: Linköping, Sweden, 2016. [Google Scholar]
  46. Henning, D. MODEST for windows; IEI Energy Systems, Linköping University: Linköping, Sweden, 2014. [Google Scholar]
  47. Rohdin, P.; Molin, A.; Moshfegh, B. Experiences from nine passive houses in Sweden—Indoor thermal environment and energy use. Build. Environ. 2014, 176–185. [Google Scholar] [CrossRef]
  48. Equa Simulation AB. Technical Report: Validation of IDA Indoor Climate and Energy 4.0 build 4 with respect to ANSI/ASHRAE Standard 140-2004; Equa Simulation AB: Solna, Sweden, 2010. [Google Scholar]
  49. Equa Simulation AB. Technical report: Validation of IDA Indoor Climate and Energy 4.0 with Respect to CEN Standards EN 15255-2007 and EN 15265-2007; Equa Simulation AB: Solna, Sweden, 2010. [Google Scholar]
  50. Kropf, S.; Zweifel, G. Validation of the Building Simulation Program IDA-ICE According to CEN 13791 “Thermal Performance of Buildings—Calculation of Internal Temperatures of a Room in Summer Without Mechanical Cooling—General Criteria and Validation Procedures”; Hochschule Technik+Architektur Luzern: Horw, Switzerland, 2001. [Google Scholar]
  51. Loutzenhiser, P.; Manz, H.; Maxwell, G. Empirical Validations of Shading/Daylighting/Load Interactions in Building Energy Simulation Tools; A Report from the International Energy Agency’s SHC Task 34/ECBCS Annex 42 Project C; IEA SHC: Cedar, MI, USA, 2007. [Google Scholar]
  52. Henning, D. MODEST—An energy-system optimisation model applicable to local utilities and countries. Energy 1997, 22, 1135–1150. [Google Scholar] [CrossRef]
  53. Åberg, M.; Widén, J.; Henning, D. Sensitivity of district heating system operation to heat demand reductions and electricity price variations: A Swedish example. Energy 2012, 41, 525–540. [Google Scholar] [CrossRef]
  54. Åberg, M.; Henning, D. Optimisation of a Swedish district heating system with reduced heat demand due to energy efficiency measures in residential buildings. Energy Policy 2011, 39, 7839–7852. [Google Scholar] [CrossRef]
  55. Henning, D.; Trygg, L. Reduction of electricity use in Swedish industry and its impact on national power supply and European CO2 emissions. Energy Policy 2008, 36, 2330–2350. [Google Scholar] [CrossRef]
  56. Sundberg, G.; Orgen, J.; Odin, S. Project financing consequences on cogeneration: industrial plant and municipal utility co-operation in Sweden. Energy Policy 2003, 31, 491–503. [Google Scholar] [CrossRef]
  57. Gebremedhin, A. The role of a paper mill in a merged district heating system. Appl. Therm. Eng. 2003, 23, 769–778. [Google Scholar] [CrossRef]
  58. Lund, R.; Ilic, D.D.; Trygg, L. Socioeconomic potential for introducing large-scale heat pumps in district heating in Denmark. J. Clean. Prod. 2016, 139, 219–229. [Google Scholar] [CrossRef]
  59. Amiri, S.; Henning, D.; Karlsson, B.G. Simulation and introduction of a CHP plant in a Swedish biogas system. Renew. Energy 2013, 49, 242–249. [Google Scholar] [CrossRef]
  60. Agnew, M.; Schrattenholzer, L.; Voss, A. A Model for Energy Supply Systems Alternatives and their General Environmental Impact; IIASA: Laxenburg, Austria, 1979. [Google Scholar]
  61. Fishbone, L.G.; Abilock, H. Markal, a linear-programming model for energy systems analysis: Technical description of the BNL version. Int. J. Energy Res. 1981, 5, 353–375. [Google Scholar] [CrossRef]
  62. Loulou, R.; Remne, U.; Kanudia, A.; Lehtila, A.; Goldstein, G. Energy Technology Systems Analysis Programme; Kgs: Lyngby, Denmark, 2005. [Google Scholar]
  63. Henning, D. Optimisation of Local and National Energy Systems: Development and Use of the MODEST Model; Division of Energy Systems, Department of Mechanical Engineering, Linköpings University: Linköping, Sweden, 1999; ISBN 9172193921. [Google Scholar]
  64. Linköping Municipality. Strategic Plan 2011–2014, Town Council; Linköping Municipality: Linköping, Sweden, 2011. [Google Scholar]
  65. Lechtenböhmer, S.; Schüring, A. The potential for large-scale savings from insulating residential buildings in the EU. Energy Effic. 2011, 4, 257–270. [Google Scholar] [CrossRef]
  66. Liu, L.; Moshfegh, B.; Akander, J.; Cehlin, M. Comprehensive investigation on energy retrofits in eleven multi-family buildings in Sweden. Energy Build. 2014, 84, 704–715. [Google Scholar] [CrossRef]
  67. Morelli, M.; Rønby, L.; Mikkelsen, S.E.; Minzari, M.G.; Kildemoes, T.; Tommerup, H.M. Energy retrofitting of a typical old Danish multi-family building to a “nearly-zero” energy building based on experiences from a test apartment. Energy Build. 2012, 54, 395–406. [Google Scholar] [CrossRef] [Green Version]
  68. Galvin, R.; Sunikka-Blank, M. Economic viability in thermal retrofit policies: Learning from ten years of experience in Germany. Energy Policy 2013, 54, 343–351. [Google Scholar] [CrossRef]
  69. Majcen, D.; Itard, L.; Visscher, H. Actual heating energy savings in thermally renovated Dutch dwellings. Energy Policy 2016, 97, 82–92. [Google Scholar] [CrossRef] [Green Version]
  70. Le Truong, N.; Dodoo, A.; Gustavsson, L. Effects of heat and electricity saving measures in district-heated multistory residential buildings. Appl. Energy 2014, 118, 57–67. [Google Scholar] [CrossRef]
  71. La Fleur, L.; Moshfegh, B.; Rohdin, P. Measured and predicted energy use and indoor climate before and after a major renovation of an apartment building in Sweden. Energy Build. 2017, 146, 98–110. [Google Scholar] [CrossRef]
  72. Tekniska Verken Facts and Statistics 2005–2017 (Sv: Fakta och Statistik 2005–2017). Available online: http://fakta-statistik.tekniskaverken.se/#/ (accessed on 18 January 2019).
  73. Swedish National Board of Housing, Building and Planning. Energy in Buildings- Technical Properties and Calculations. Results from the BETSI Project (Sv: Energi i Bebyggelsen-Tekniska Egenskaper och Beräkningar. Resultat från Projektet BETSI); Swedish National Board of Housing: Karlskrona, Sweden, 2010.
  74. International Standard ISO 6946:2007. Building Components and Building Elements—Thermal Resistance and Thermal Transmittance—Calculation Method; ISO: Geneva, Switzerland, 2007. [Google Scholar]
  75. International Standard ISO 13370:2007. Thermal Performance of Buildings—Heat Transfer via the Ground—Calculation Methods; ISO: Geneva, Switzerland, 2007. [Google Scholar]
  76. Sveby. Brukarindata Bostäder; Sveby: Stockholm, Sweden, 2012. [Google Scholar]
  77. ASHRAE. IDA ICE Climate File-Linköping Malmslätt, Sweden; ASHRAE International Weather Files for Energy Calculations 2.0 (IWEC2): Stockholm, Sweden, 2016. [Google Scholar]
  78. The National Board of Health and Welfare. National Advice on Indoor Temperatures; SOSFS 2005:15; The National Board of Health and Welfare: Stockholm, Sweden, 2005.
  79. La Fleur, L.; Rohdin, P.; Moshfegh, B. Energy Use and Perceived Indoor Environment in a Swedish Multifamily Building before and after Major Renovation. Sustainability 2018, 10, 766. [Google Scholar] [CrossRef]
  80. Energiföretagen Sverige. Överenskommelse i Värmemarknadskommittén 2018; Energiföretagen Sverige: Stockholm, Sweden, 2018. [Google Scholar]
  81. Gode, J.; Martinsson, F.; Hagberg, L.; Öman, A.; Höglund, J.; Palm, D. Miljöfaktaboken 2011- Estimated Emission Factors for Fuels, Electricity, Heat and Transport in Sweden (Sv: Uppskattade Emissionsfaktorer för Bränslen, el, Värme och Transporter); Värmeforsk Service AB: Stockholm, Sweden, 2011; ISBN 1653-1248. [Google Scholar]
  82. Swedish National Board of Housing, Building and Planning. The National Board of Housing, Building and Planning’s Building Regulations- Regulations and General Advice (Sv: Boverkets Byggregler - Föreskrifter och Allmänna Råd); Swedish National Board of Housing: Karlskrona, Sweden, 2018.
  83. Gode, J.; Byman, K.; Persson, A.; Trygg, L. Environmental Valuation of Electricity from a Systems Perspective (Sv: Miljövärdering av el ur Systemperspektiv); IVL Svenska Miljöinstitutet: Stockholm, Sweden, 2009. [Google Scholar]
  84. Liu, L.; Rohdin, P.; Moshfegh, B. Evaluating indoor environment of a retrofitted multi-family building with improved energy performance in Sweden. Energy Build. 2015, 102, 32–44. [Google Scholar] [CrossRef]
Figure 1. Illustration of the framework used in the study including design of a building energy simulation model, upscaling and modeling of an optimization model of the DHC system. A general description of the software tools used is presented in Section 2.1 and Section 2.2. The design of the scenario study, inputs, and use of the software tools are presented in Section 3.
Sustainability 11 02199 g001
Figure 2. An overall visualization of the study. In the subsystem, a reference scenario and five different scenarios of renovation measures are analyzed by being simulated and scaled-up, in order to reflect a larger building stock. The scenarios generate different use of district heat and electricity, resulting in changes in demand of energy and peak power from the DHC system. Thereafter, the effects on the DHC system are analyzed and the key performance indicators analyzed are input of primary energy as fuel and output of electricity and GHG emissions at local and global levels.
Sustainability 11 02199 g002
Figure 3. Schematic view of the studied DHC system and optimization model created in MODEST. The model consists of fuel that is converted using CHP and HOB to serve a demand of district heat, cooling, and electricity. The production units are based on the plants Gärstad, Central and Mjölby, and standalone HOBs. Table 4 presents technical data of the production units. The district cooling is produced by an absorption plant of 12 MW and a compression plant of 6 MW.
Sustainability 11 02199 g003
Figure 4. The figures present monthly specific energy for space heating and domestic hot water of the simulated building. (a) DH is utilized in scenarios R, 1, and 2 and (b) electricity is used in scenarios 3, 4, and 5. Please note that the figures present specific energy use and not energy performance, which is calculated by using primary energy factors as presented in Table 6.
Sustainability 11 02199 g004
Figure 5. (a) Duration diagram of the fuel use for production in the DHC system concerning the reference scenario R. Image used courtesy of MODEST. (b) Peak power demand in the DHC system of the reference scenario R. A day is divided into five time periods, as presented in Table 1, and the peak period of each month is presented.
Sustainability 11 02199 g005
Figure 6. The reduction in peak power needed in the DHC system as a result of scenario demand. Scenarios 3, 4, and 5 are presented together as they affect the peak power demand in the DHC system equivalently. The results are presented relative to the reference scenario R, presented in Figure 5b.
Sustainability 11 02199 g006
Figure 7. (a) Results showing primary energy savings in the production units of the DHC system for the scenarios. Scenarios 3, 4, and 5 are presented together as they affect the DHC system equivalently. Results are presented relative to the reference scenario R. (b) Results showing the aggregate effect of lost electricity production in the CHP plants and increased electricity demand for each scenario. Results are presented relative to the reference scenario R.
Sustainability 11 02199 g007
Figure 8. Results showing the reduction of local GHG emissions due to decreased production in the DHC system. Also presented are the resulting increase in global GHG emissions due to a loss of electricity production and an increase in electricity demand as presented in Figure 7b. Results are presented relative to the reference scenario R. Emission factors are presented in Table 5.
Sustainability 11 02199 g008
Table 1. A course description of the time division of a full normal year (8760 h) in MODEST, with respect to seasonal, weekly and daily dependencies. This study focuses on the winter season.
SeasonsMonthsDays and HoursAnalyzed Peak Hours
WinterJan-Mar, Nov–DecMon-Fri 06:00–07:00Peak day 06:00–07:00
Mon–Fri 07:00–08:00Peak day 07:00–08:00
Mon–Fri 08:00–16:00Peak day 08:00–16:00
Mon–Fri 16:00–22:00Peak day 16:00–22:00
Mon–Fri 22:00–06:00Peak day 22:00–06:00
Sat, Sun 06:00–22:00
Sat, Sun 22:00–06:00
Spring, summer and autumnApr–AugMon–Fri 06:00–22:00
Mon–Fri 22:00–06:00
Sat, Sun 06:00–22:00
Sat, Sun 22:00–06:00
Table 2. Original construction of reference building before any renovation measures. Also presented is the building physics after the renovation in 2014.
SegmentArea [m2]Original ConstructionU-Value 1 [W/m2·K]Renovated ConstructionU-Value 1
[W/m2·K]
Walls 1569.90.25 m lightweight concrete, cladding0.430.25 m lightweight concrete, 0.1 m mineral wool, cladding0.2
Roof23.10.15 m concrete, 0.04 m cork, roofing tile0.910.15 m concrete, 0.04 m mineral wool, roofing tile0.71
Attic194.50.05 m concrete, 0.12 m mineral wool, 0.2 m concrete0.270.05 m concrete, 0.3 m mineral wool, 0.2 m concrete0.12
Windows north118.03-pane clear glass 21.93-pane low emissivity 31.1
Floor216.50.2 m concrete, 0.1 m insulation, ground 40.20.2 m concrete, 0.1 m insulation, ground 40.2
1U-values calculated in accordance with ISO 6946—Building components and building elements [74]. 2 Standard glazing U-values for clear glass windows (IDA ICE version 4.8), g-value 0.68. 3 Elite Original Alu, g-value 0.43. 4 Ground properties and floor U-value calculated in accordance with ISO 13370—Thermal performance of buildings [75].
Table 3. The analyzed renovation packages of the scenario study, which includes a reference scenario R and five combinations of envelope measures (E), ventilation measures (V) and substitution of heating solution from DH to GSHP.
ScenarioHeating SystemEnvelope, U-Values [W/m2·K]Ventilation 2
Radiator Supply/Return Temp. [°C]WallsRoofAtticWindowsFloorHeat Recovery [η]
R. Ref (BAU) DH 180/600.430.910.271.90.2-
1. DH + E50/350.20.710.121.10.2-
2. DH + E + V50/350.20.710.121.10.260%
3. GSHPGSHP 180/600.430.910.271.90.2-
4. GSHP + E50/350.20.710.121.10.2-
5. GSHP + E + V50/350.20.710.121.10.260%
1 The primary energy factor is 1.0 for DH and 1.6 for electricity in accordance with the Swedish National Board of Housing, Building and Planning [80]. 2 Ventilation air flow represents 0.82 h-1 in all scenarios.
Table 4. Production capacity and fuel use of the units in the DHC system presented in Figure 3.
UnitFuelHeat 1 [MW]Power [MW]Heat from Flue Gas Condensation [MW]
GärstadCHP 1–3 Household waste 2751015
CHP 4Household waste 2681915
CHP 5Household waste 2842112
CentralCHP 1Coal 38331-
CHP 2Oil 15441-
CHP 3Wood 47832 or 22 520
HOB 1Oil144--
HOB 2Electricity25--
MjölbyCHPWood3310-
HOBWood32.5--
1 Heat from steam production. 2 The annual use of household waste is limited to 1781 GWh. 3 Fuel also contains fractions of rubber. 4 Fuel also contains fractions of plastics. 5 22 MW back-pressure power or 32 MW condensing power.
Table 5. Local GHG emission factors for the fuel used in the model of the DHC system. The factors include incineration, production, and transportation. Also presented is the global GHG emission factors used to analyze the global effects generated by changes in the local DHC system.
Local EmissionGHG Emission Factor [80] (g CO2eq/kWh) Global EmissionGHG Emission Factor [81] (g CO2eq/kWh)
Household waste143Swedish electricity mix36.4
Wood 114.5Nordic electricity mix97.3
Oil297Coal condensing production968.6
Coal 1340
Electricity (internal)0
Flue gas cond.0
1 Emission factors are weighted in order to reflect a fuel mixture used in the central plant CHP 1 (coal with fractions of rubber) and CHP 3 (primary and secondary wood fuels with fractions of plastics).
Table 6. Annual demand for supplied energy from the building energy simulations. The heat demand presented herein is divided on heating solution, as the use of DH or electricity reflects the resulting energy performance due to the different primary energy factors. The specific energy use, which do not regard primary energy factors is also presented and form the basis for input data to the DHC system.
ScenarioHeat Supplied for Space Heating and Domestic Hot Water 1Ventilation and Building Electricity 2 Specific Energy UseEnergy Performance 4
DHElectricity Electricity(kWh/m2)Savings 3(kWh/m2)Savings 3
(kWh/m2)(kWh/m2)(kWh/m2)
R. Ref (BAU)131.4-5.1136.6-139.6-
1. DH + E116.0-5.1121.111%124.211%
2. DH + E + V79.1-1089.135%95.132%
3. GSHP-49.05.154.160% (-)86.638% (-)
4. GSHP + E-40.85.145.966% (15%)73.447% (15%)
5. GSHP + E + V-28.71038.772% (28%)61.956% (29%)
1 Heat demand for domestic hot water at a fixed level of 25 kWh/m2 annually. 2 Building electricity accounts for 1750 kWh annually. 3 Annual energy savings; where scenarios 1 and 2 are relative to scenario R and scenarios 3 and 5 are relative to scenario 3. 4 The energy performance is obtained by factoring DH and electricity. The primary energy factor is 1.0 for DH and 1.6 for electricity, and the geographical correction factor for Linköping is 1.0 [82].
Table 7. Annual supplied energy for the scenarios regarding the upscaled building stock. The values are based on the specific energy use presented in Table 6. These demands affect the DHC system.
ScenarioDH [GWh]Electricity [GWh]
R. Ref (BAU) 35.91.4
1. DH + E31.71.4
2. DH + E + V21.62.8
3. GSHP014.8
4. GSHP + E012.6
5. GSHP + E + V010.6