Comparison of Assessment Systems for Green Building and Green Civil Infrastructure


Abstract
:1. Introduction
1.1. Foreword
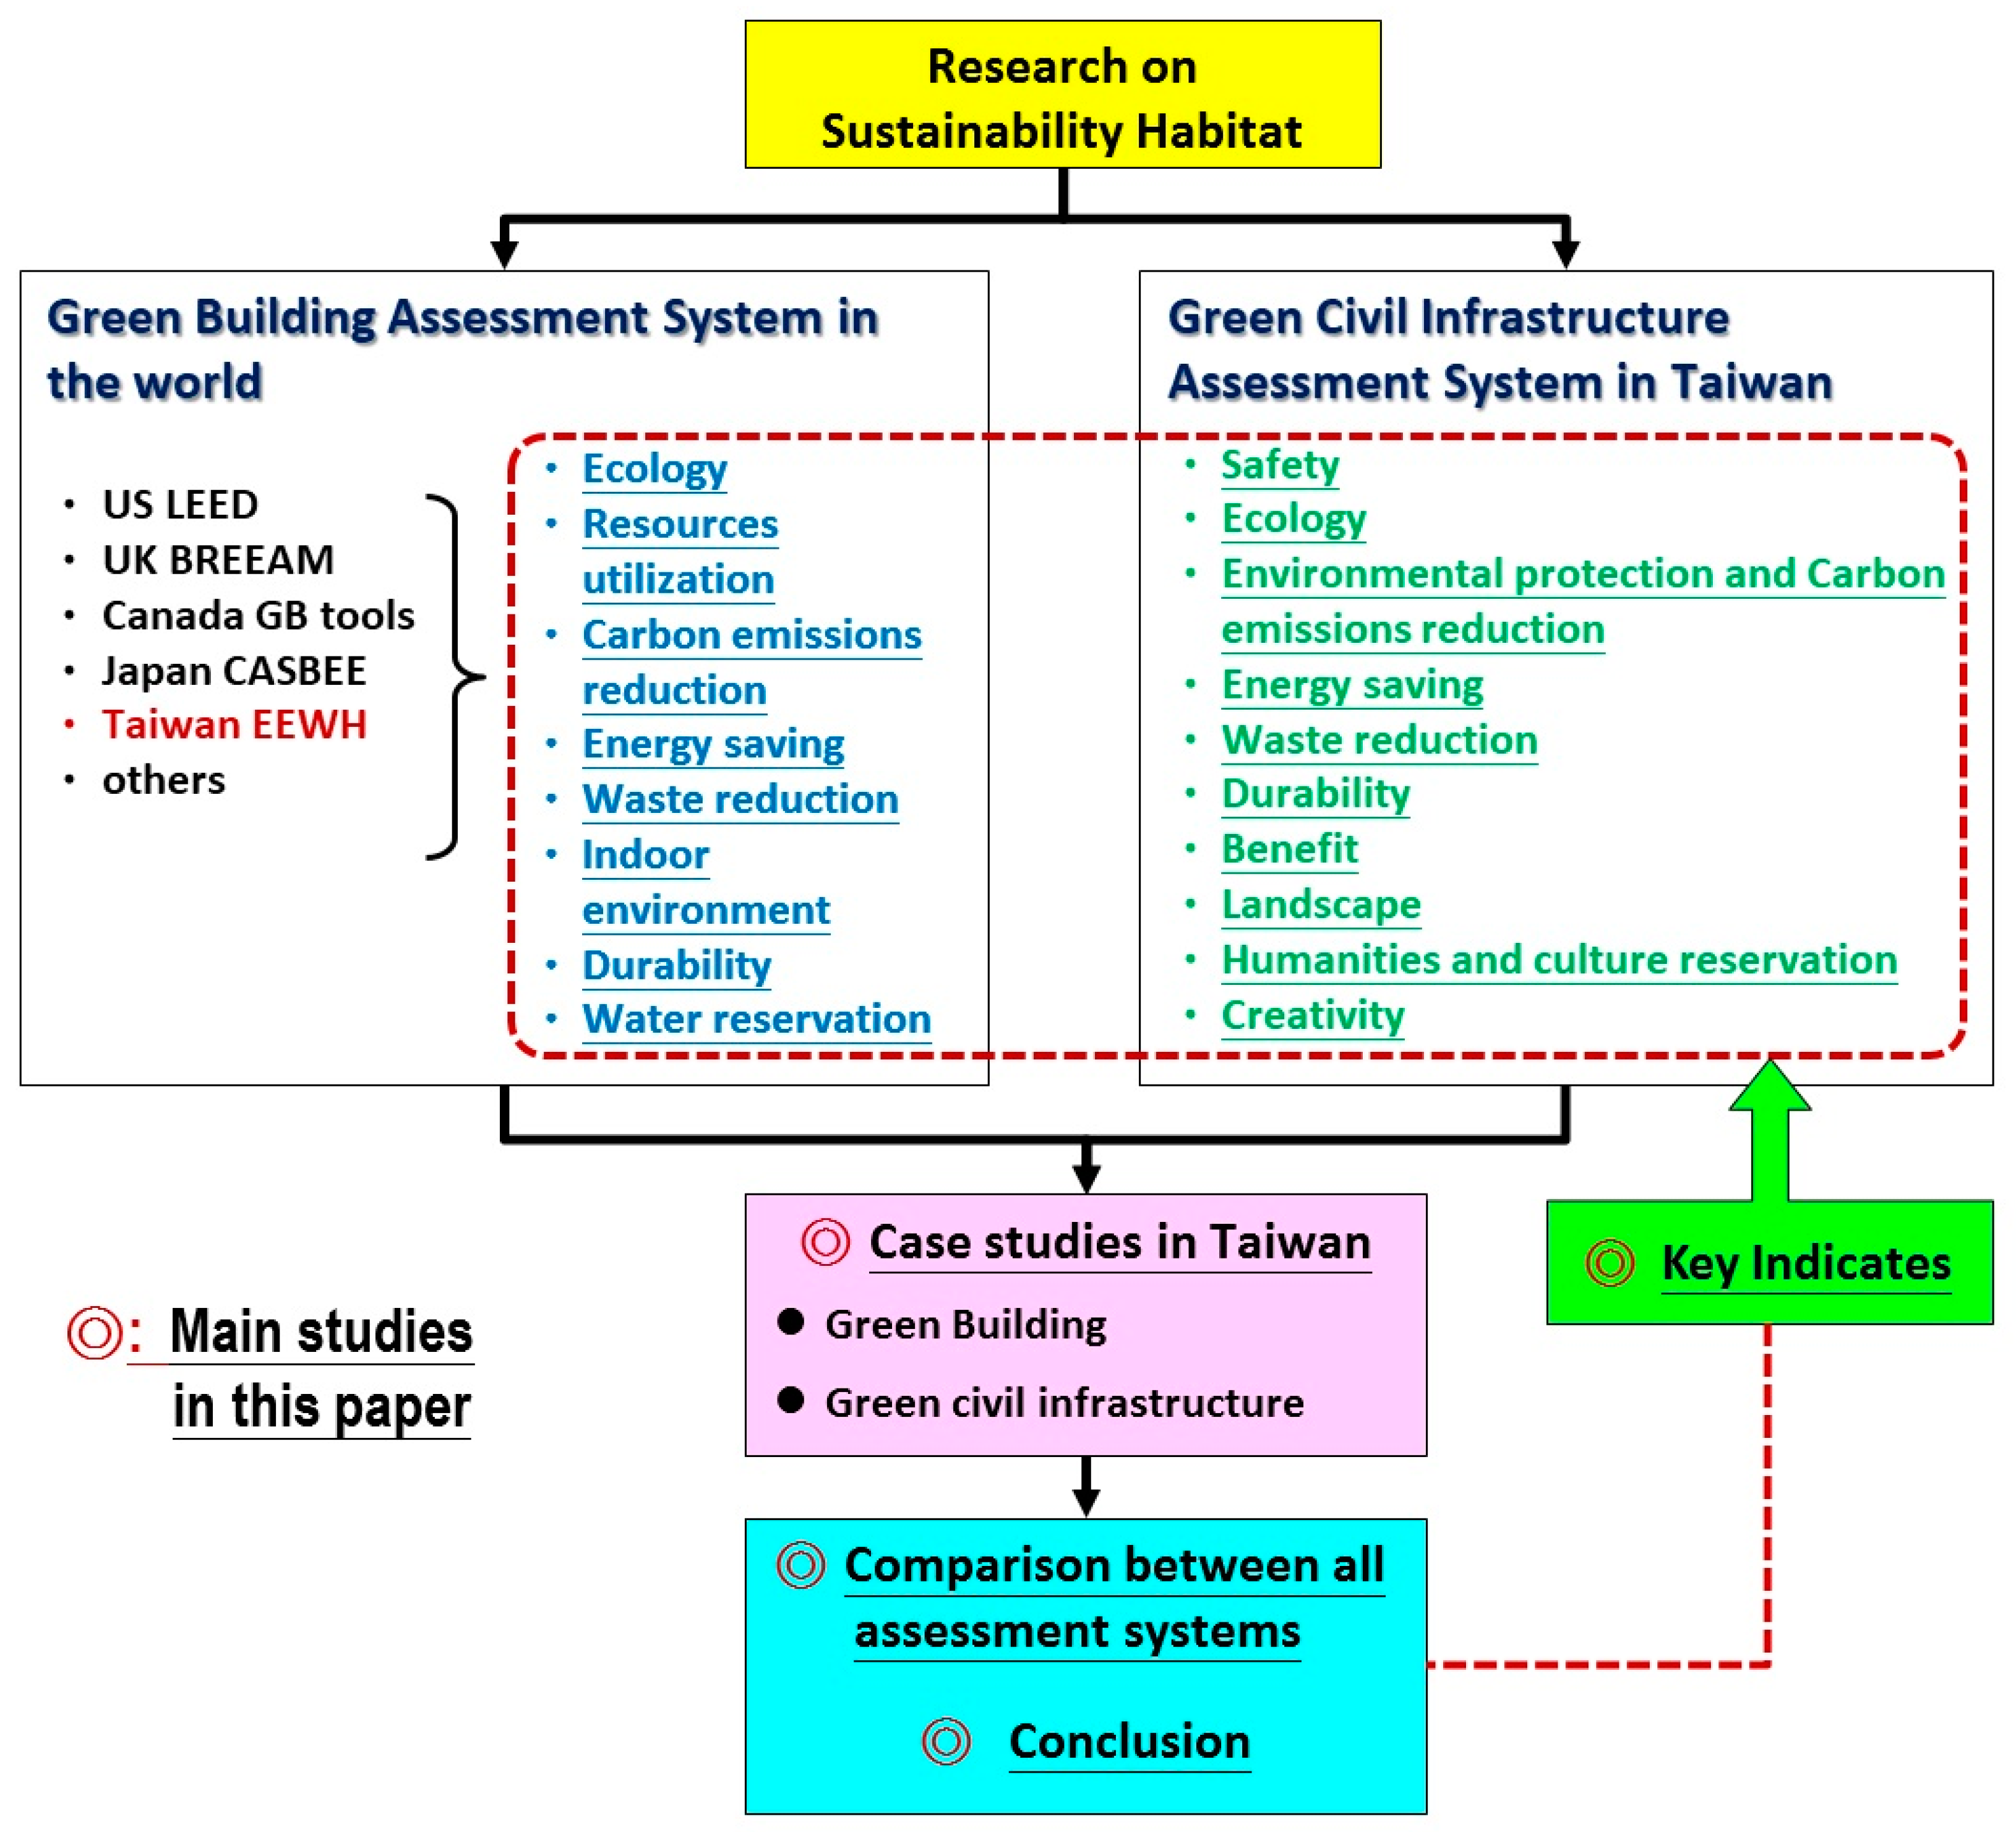
1.2. Objective and Methodology
1.3. Green Building
- Savings of energy, efficiency of water usage, and the use of other resources
- Pollution and waste reduction
- Carbon emission reduction
- Re-use and recycling of materials
- Use of renewable energy, e.g., wind or solar energy
- Improvement of indoor environment and air quality
- Use of green and sustainable materials
- Consideration of biodiversity in design
1.4. Green Civil Infrastructure in Taiwan
- Roads: Embankments, retaining walls, pavements, slopes, etc.
- Tunnels: Tunnel boring machine, shield machine, cut-and-cover tunnel, etc.
- Bridges: Ground sourcing, free cantilever, advancing sourcing, etc.
- Plants: Power station, factory plant, warehouse, etc.
- Utilities: Telecom communication, power, gas, water, draining, etc.
- Transportation: Rail, MRT, gondola, etc.
- Others.
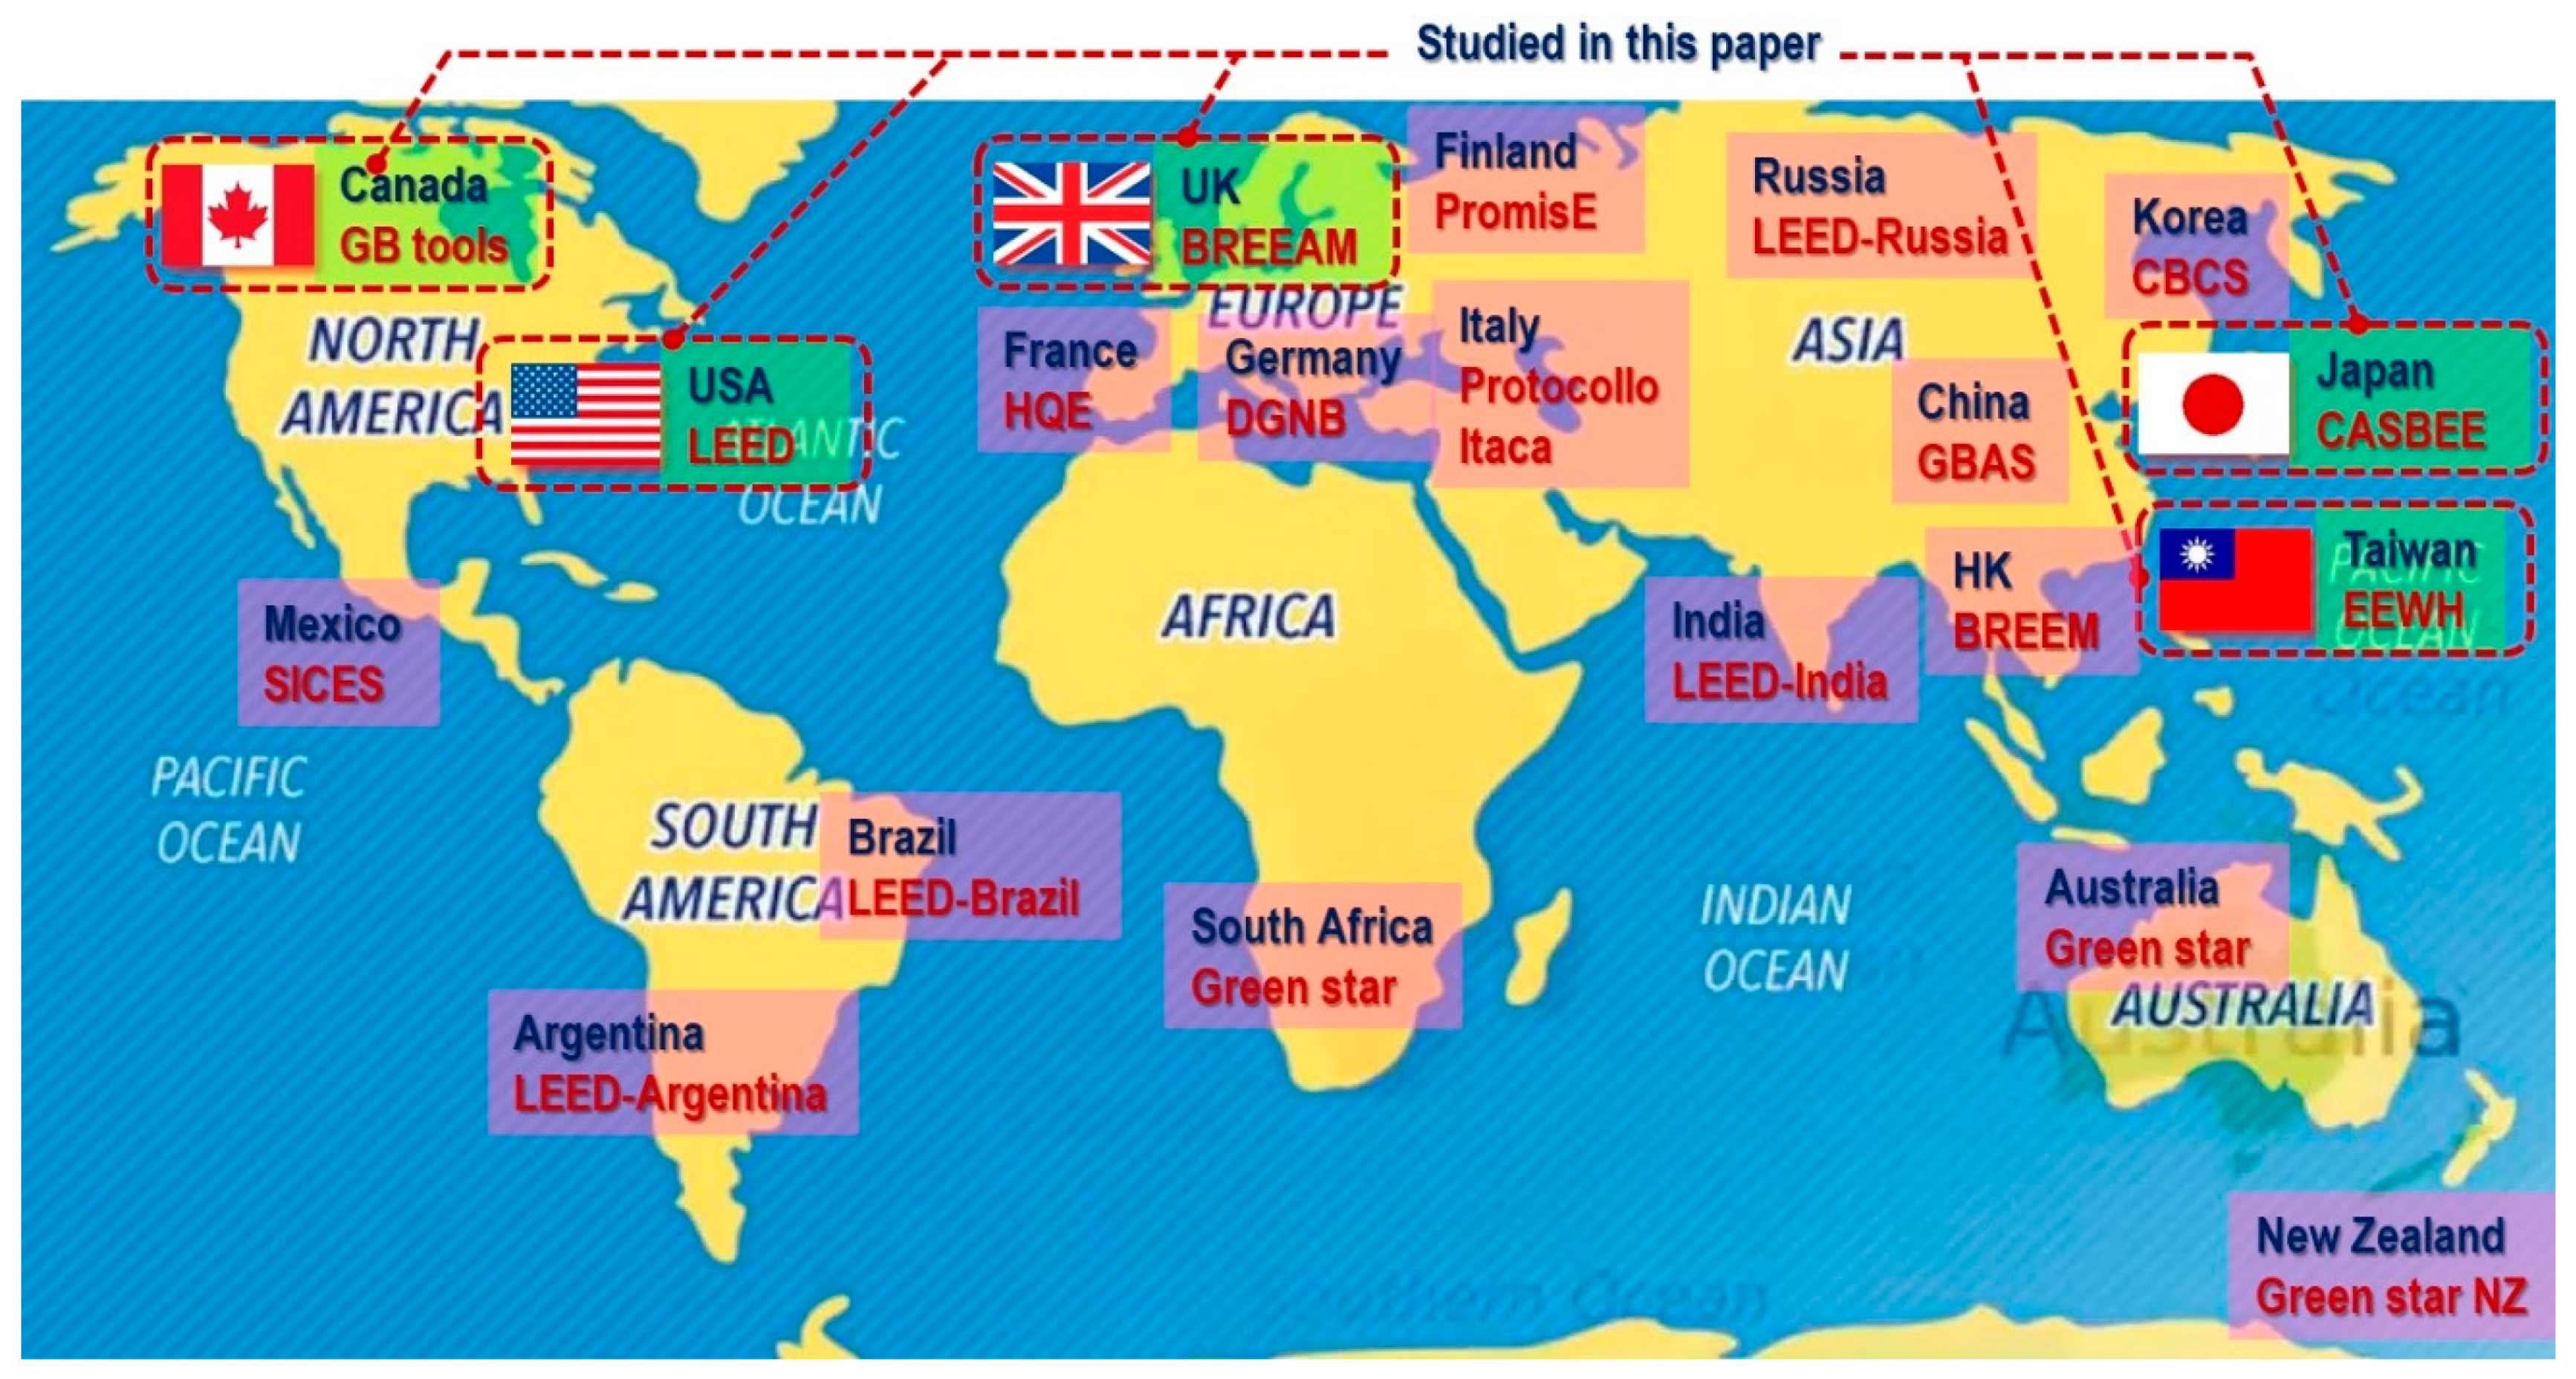
2. Major Green Building Assessment Systems around the World
2.1. United States: LEED
- Certified level: 40–49 points
- Silver level: 50–59 points
- Gold level: 60–79 points
- Platinum level: 80 points above
2.2. United Kingdom: BREEAM
- The environmental section weightings
- The minimum BREEAM standards
- The BREEAM rating level benchmarks
- Credits achieved: the credits gained from the experts’ determination
- Credits available: the maximum credits of a section
- Weight: as shown in Table 2
2.3. Canada: Green Building (GB) Tool
2.3.1. Energy Star
- K-12 schools
- Commercial offices
- Hospitals
- Supermarkets and food stores
- Medical offices
- Senior care communities and residential care facilities
- Ice and curling rinks
2.3.2. LEED Holder
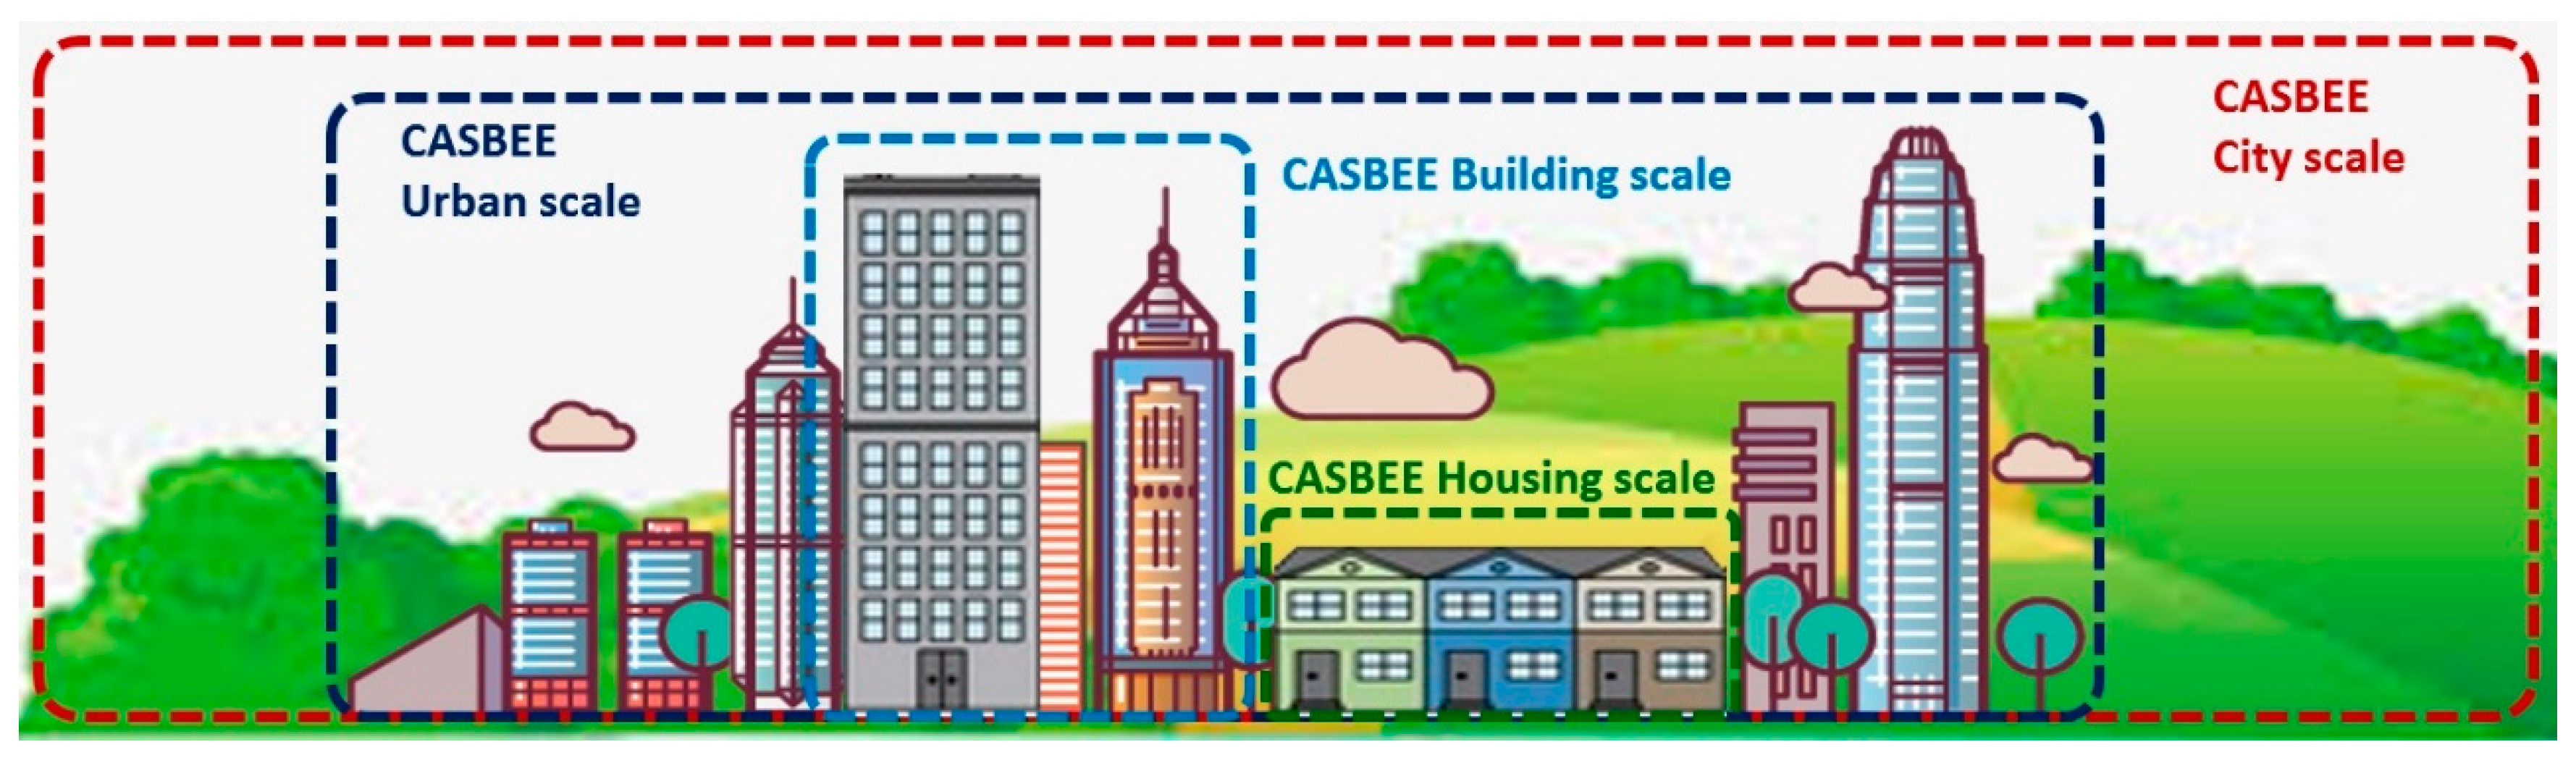
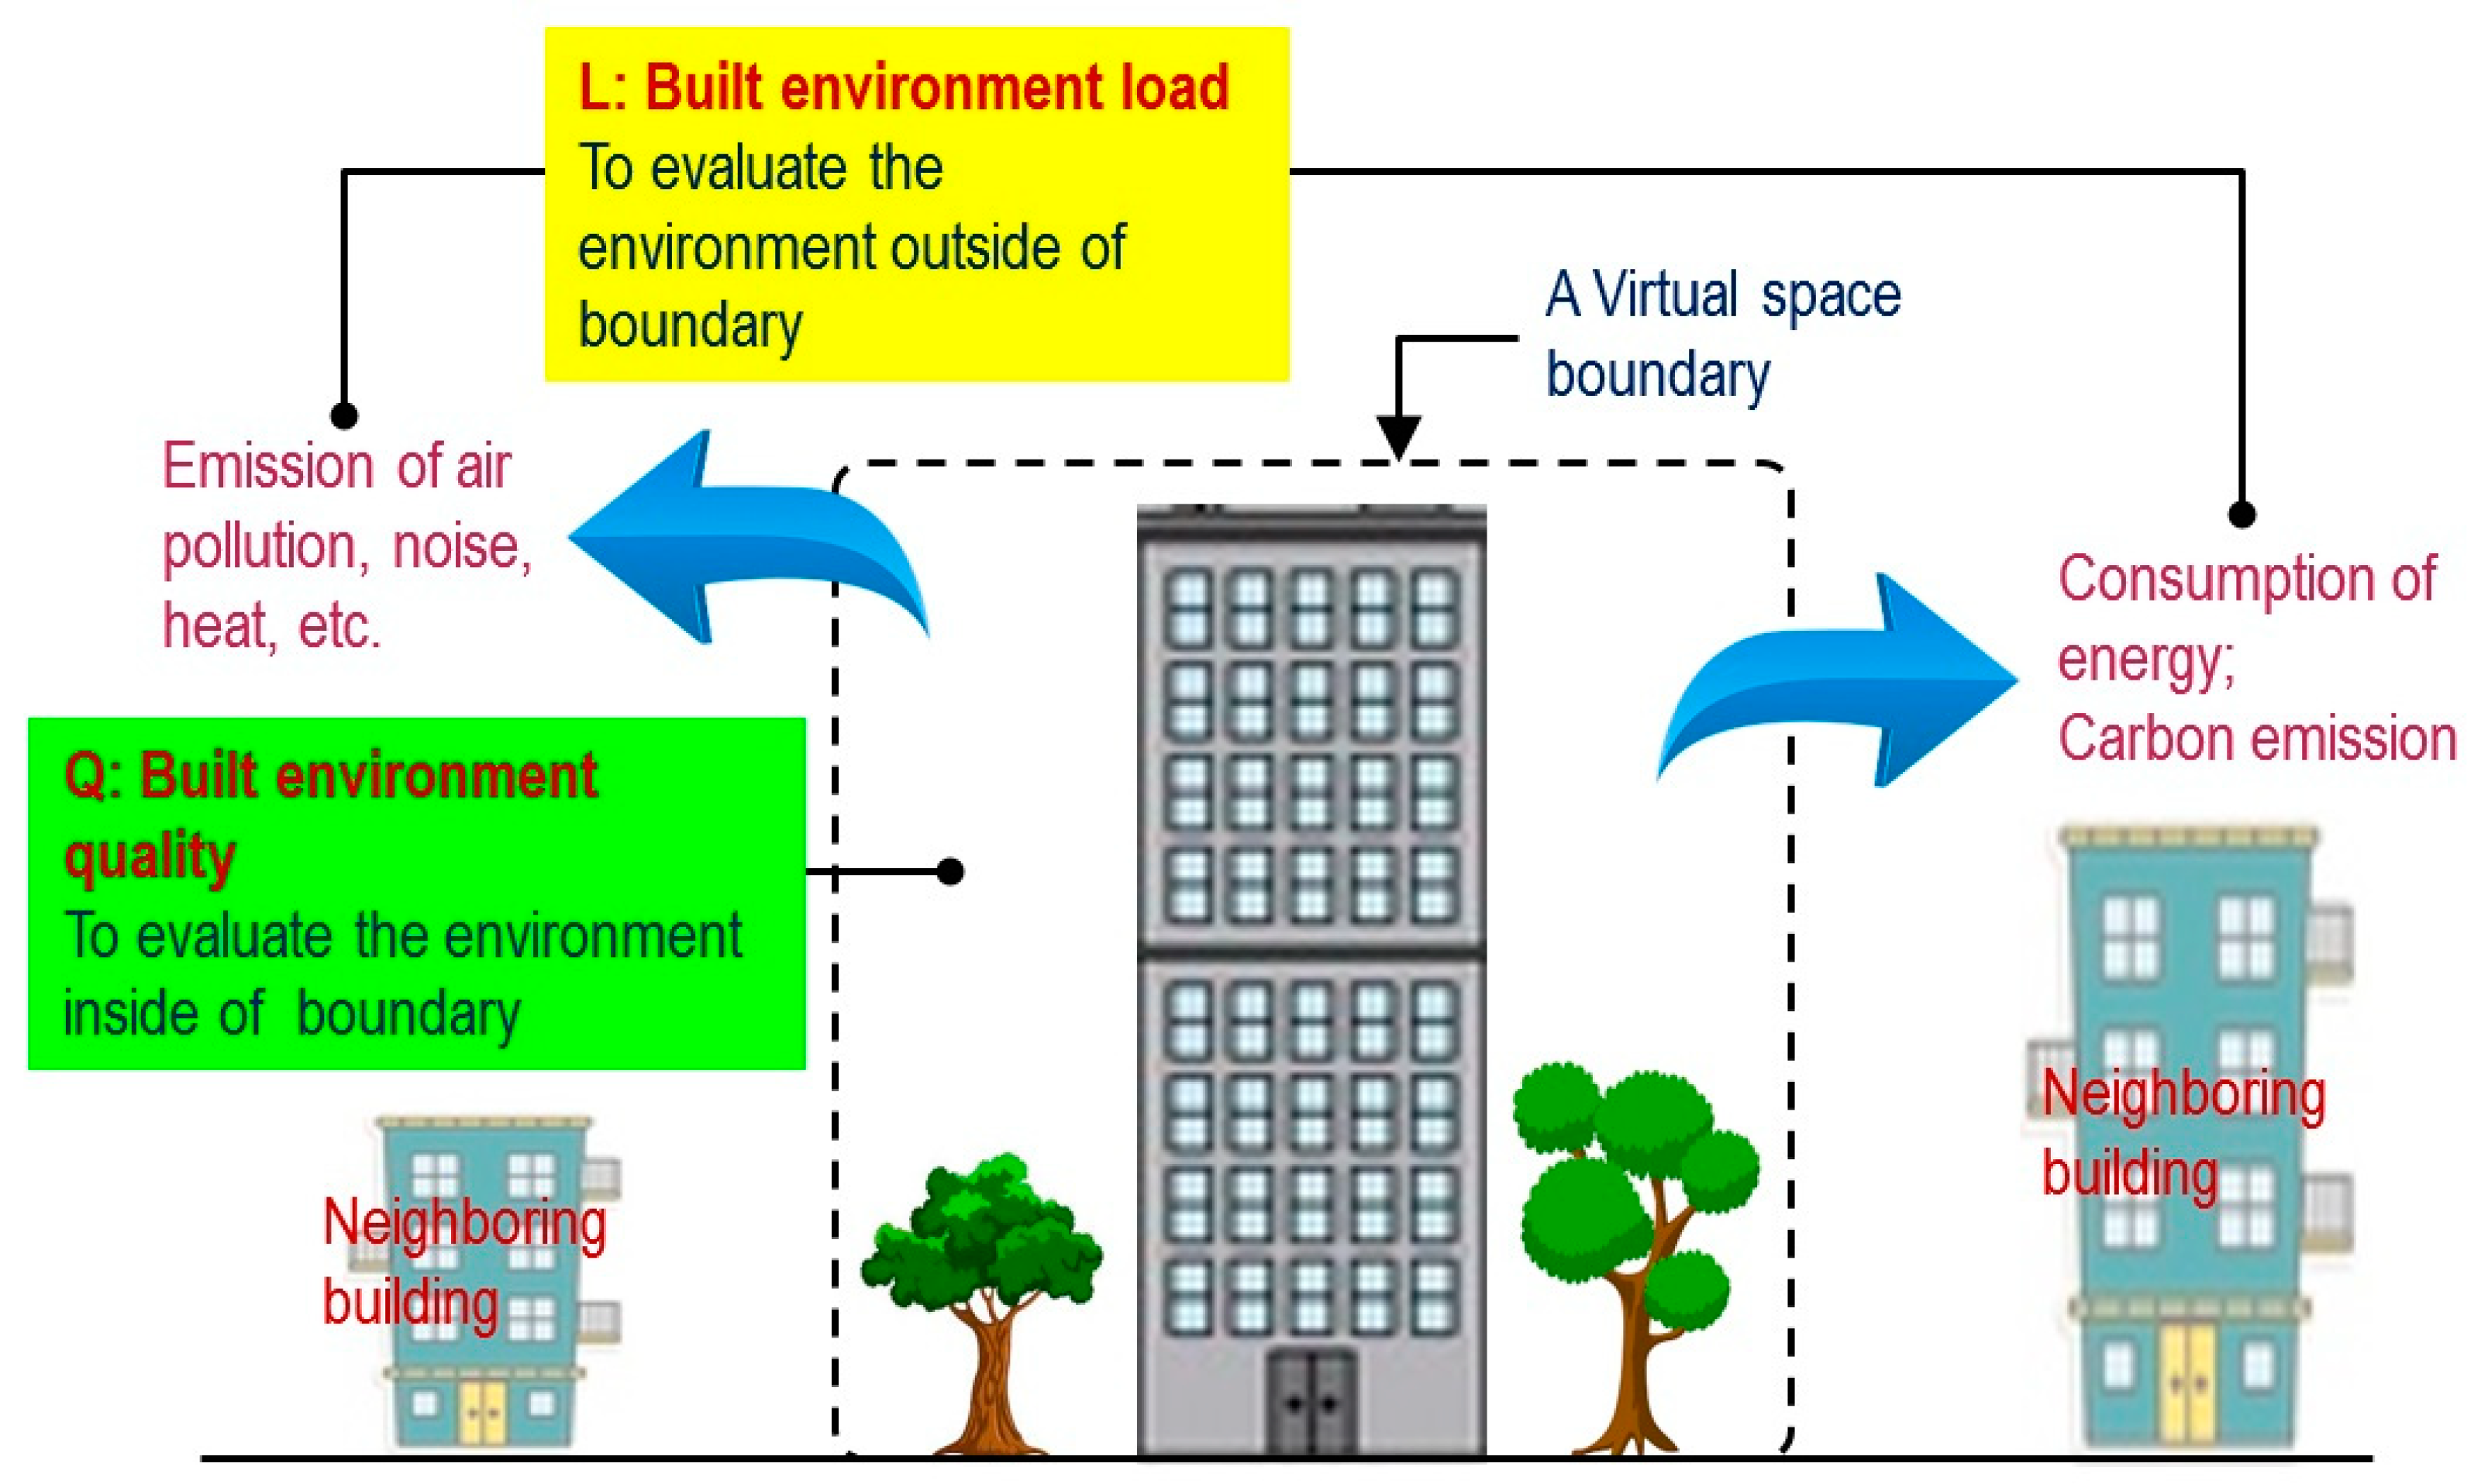
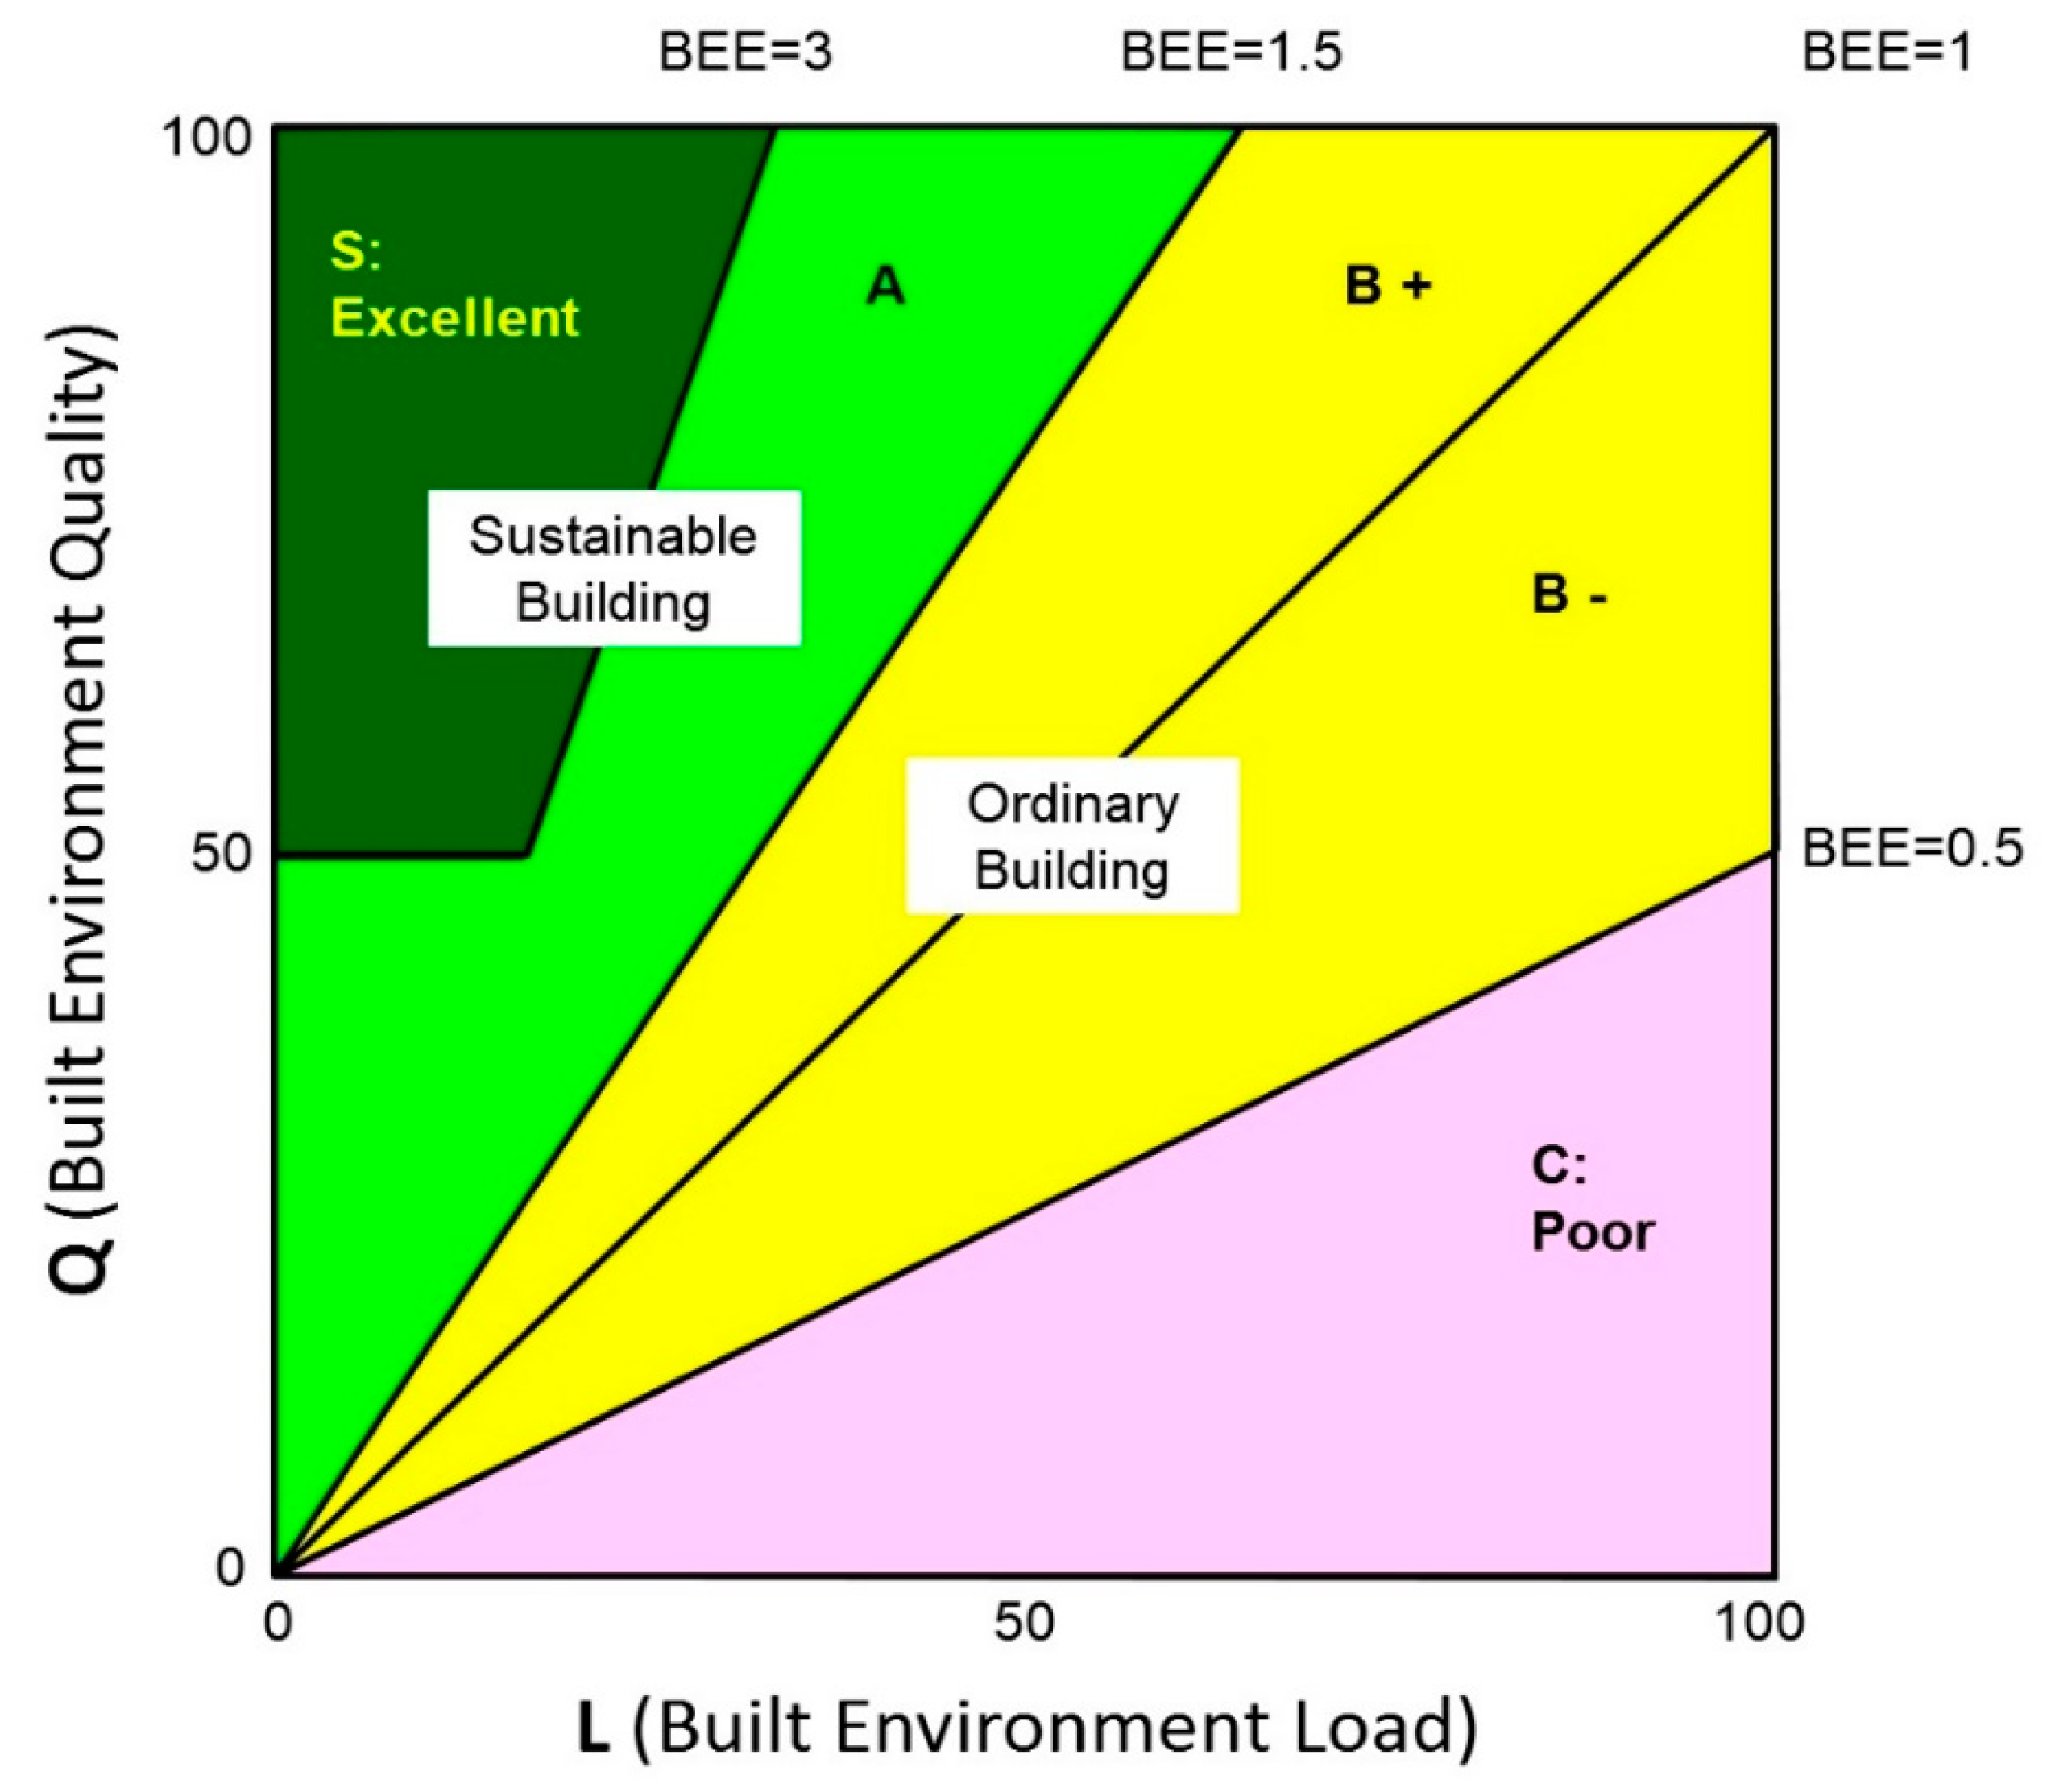
2.4. Japan: CASBEE
- Comprehensive assessment throughout the lifecycle of the building
- Assessment of the Built Environment Quality and Built Environment Load
- Assessment based on the newly developed Built Environment Efficiency (BEE) indicator
- Housing Scale (construction)
- Building Scale (construction)
- Urban Scale (town development)
- City Scale (city management)
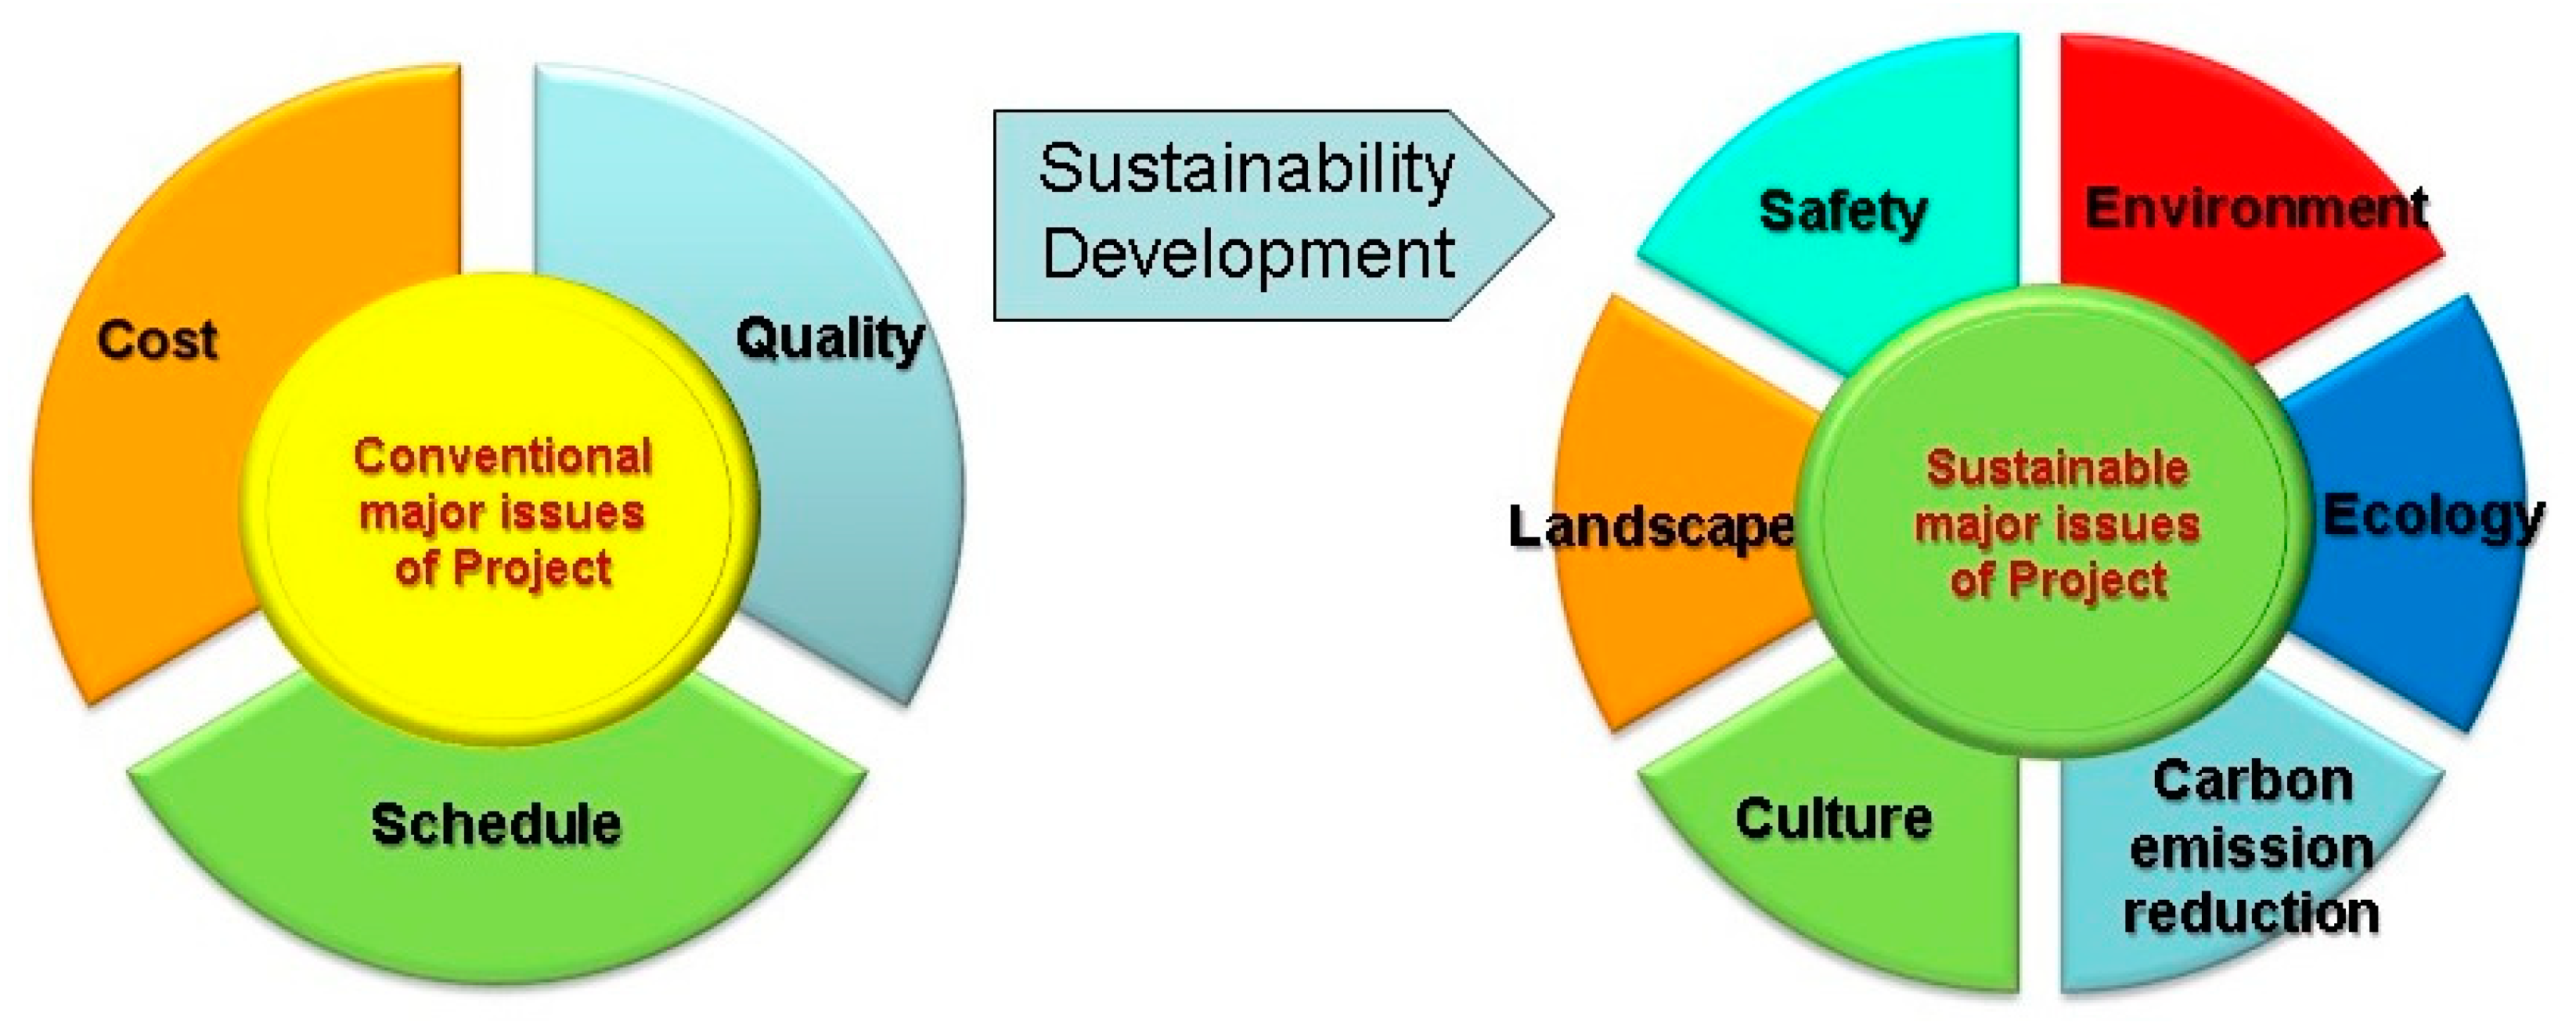
3. Sustainability Practices in Taiwan
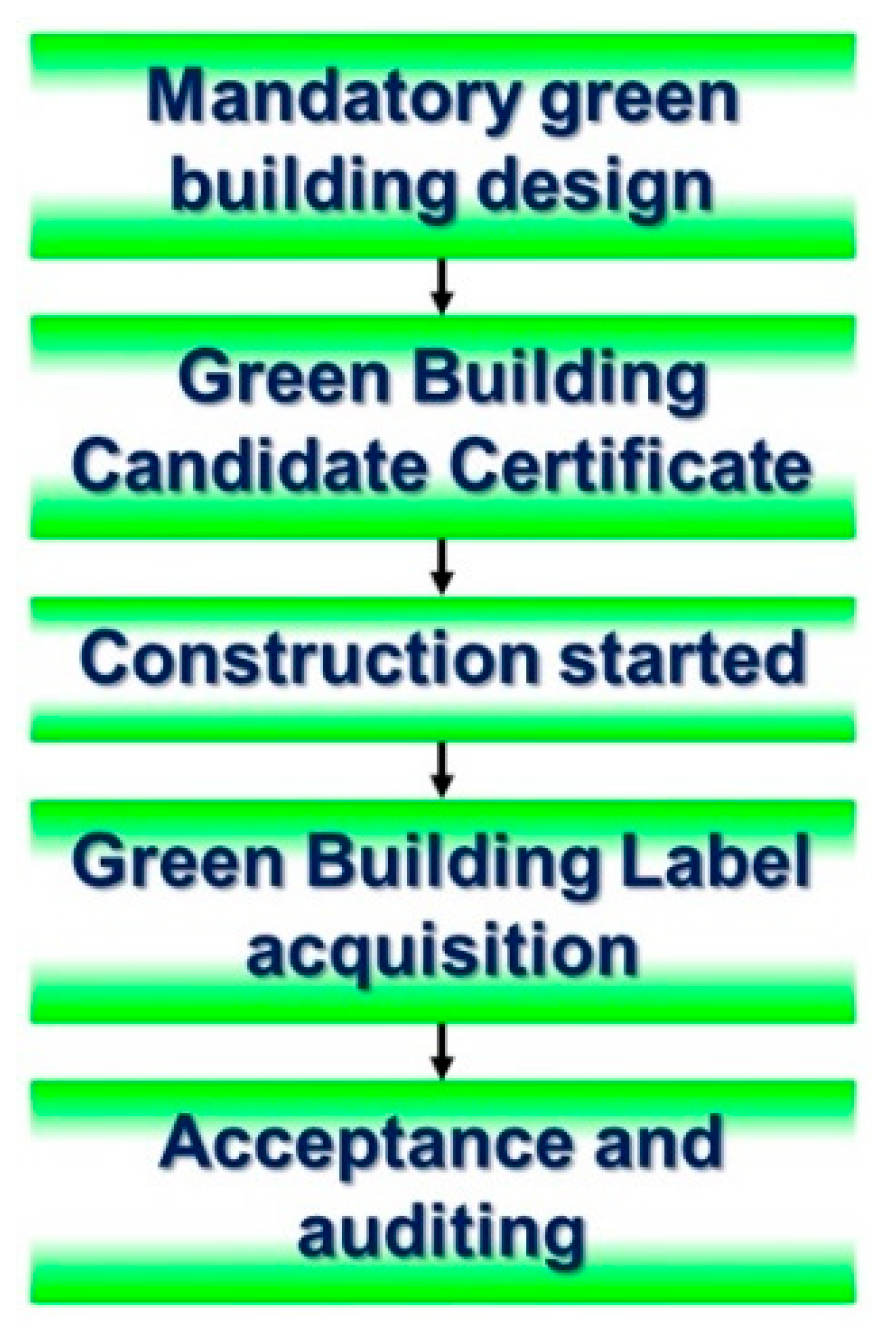
3.1. Assessment System for Green Buildings: EEWH
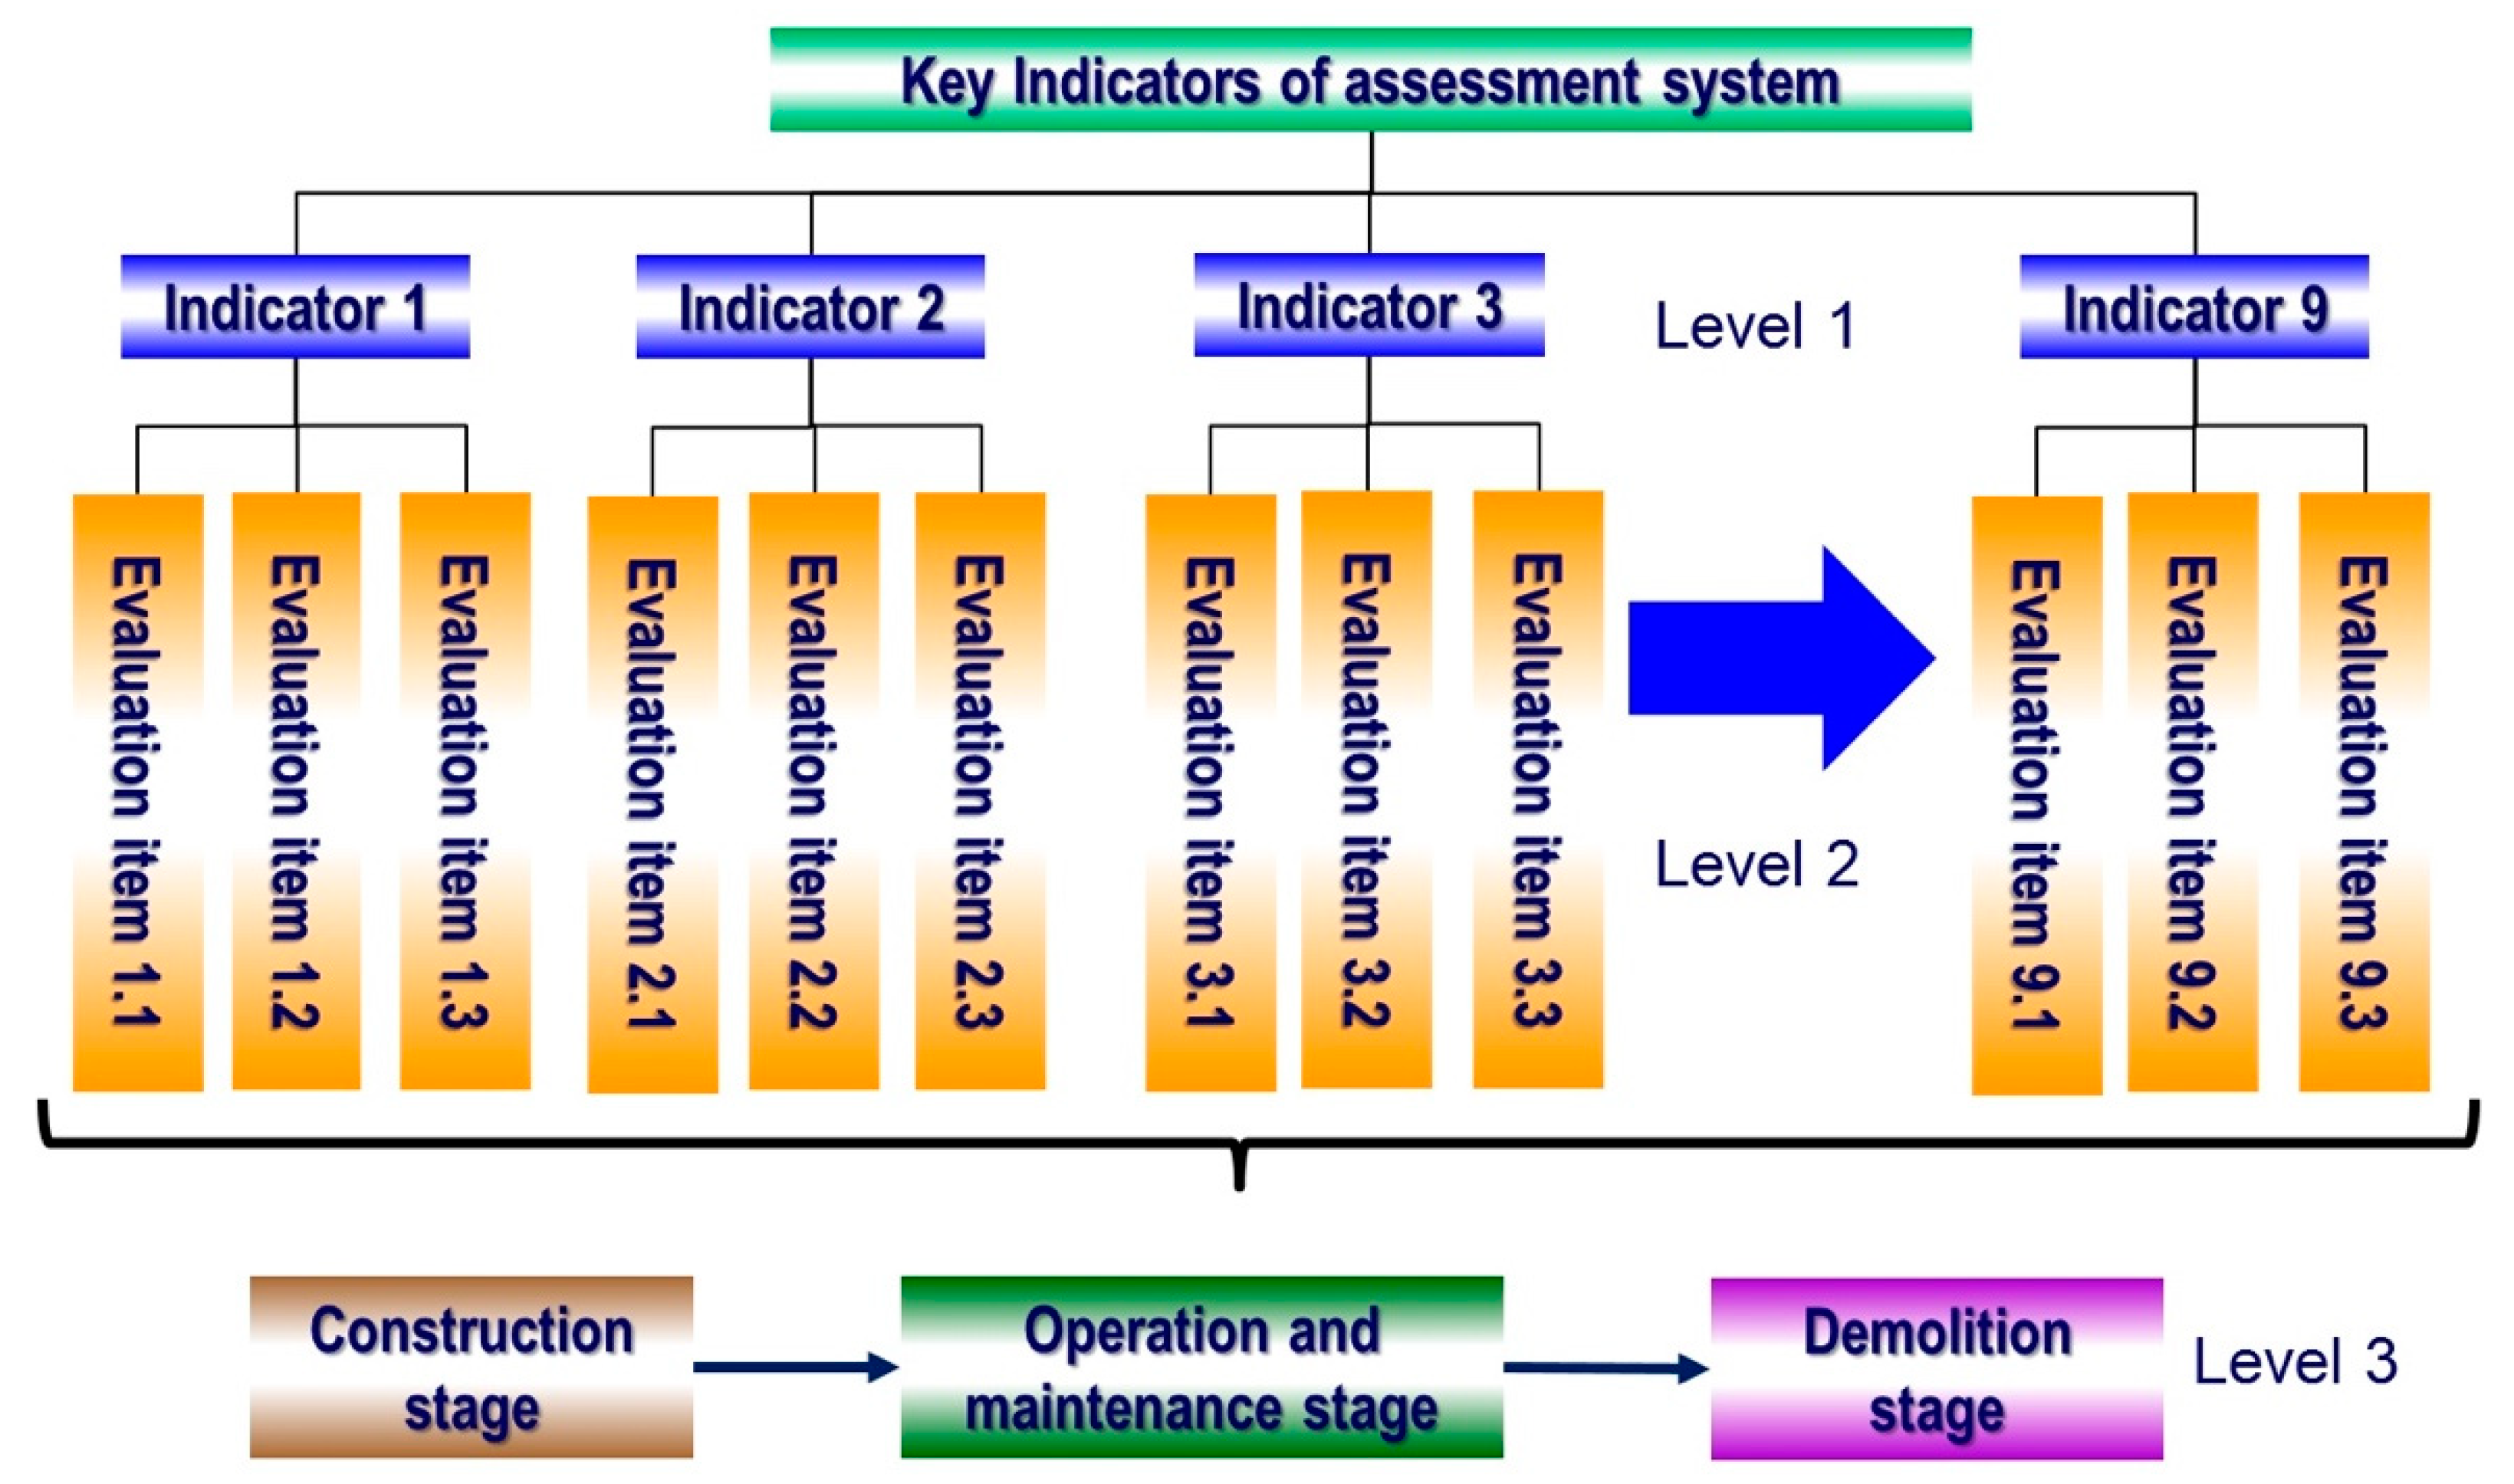
3.2. Key Sustainability Indicators for Green Civil Infrastructure
- Certified grade: A total score greater than or equal to 50 points, but less than 60 points.
- Bronze grade: A total score greater than or equal to 60 points, but less than 70 points.
- Silver grade: A total score greater than or equal to 70 points, but less than 80 points.
- Gold grade: A total score greater than or equal to 80 points, but less than 90 points.
- Diamond grade: A total score greater than or equal to 90 points.
3.3. Case Studies in Taiwan
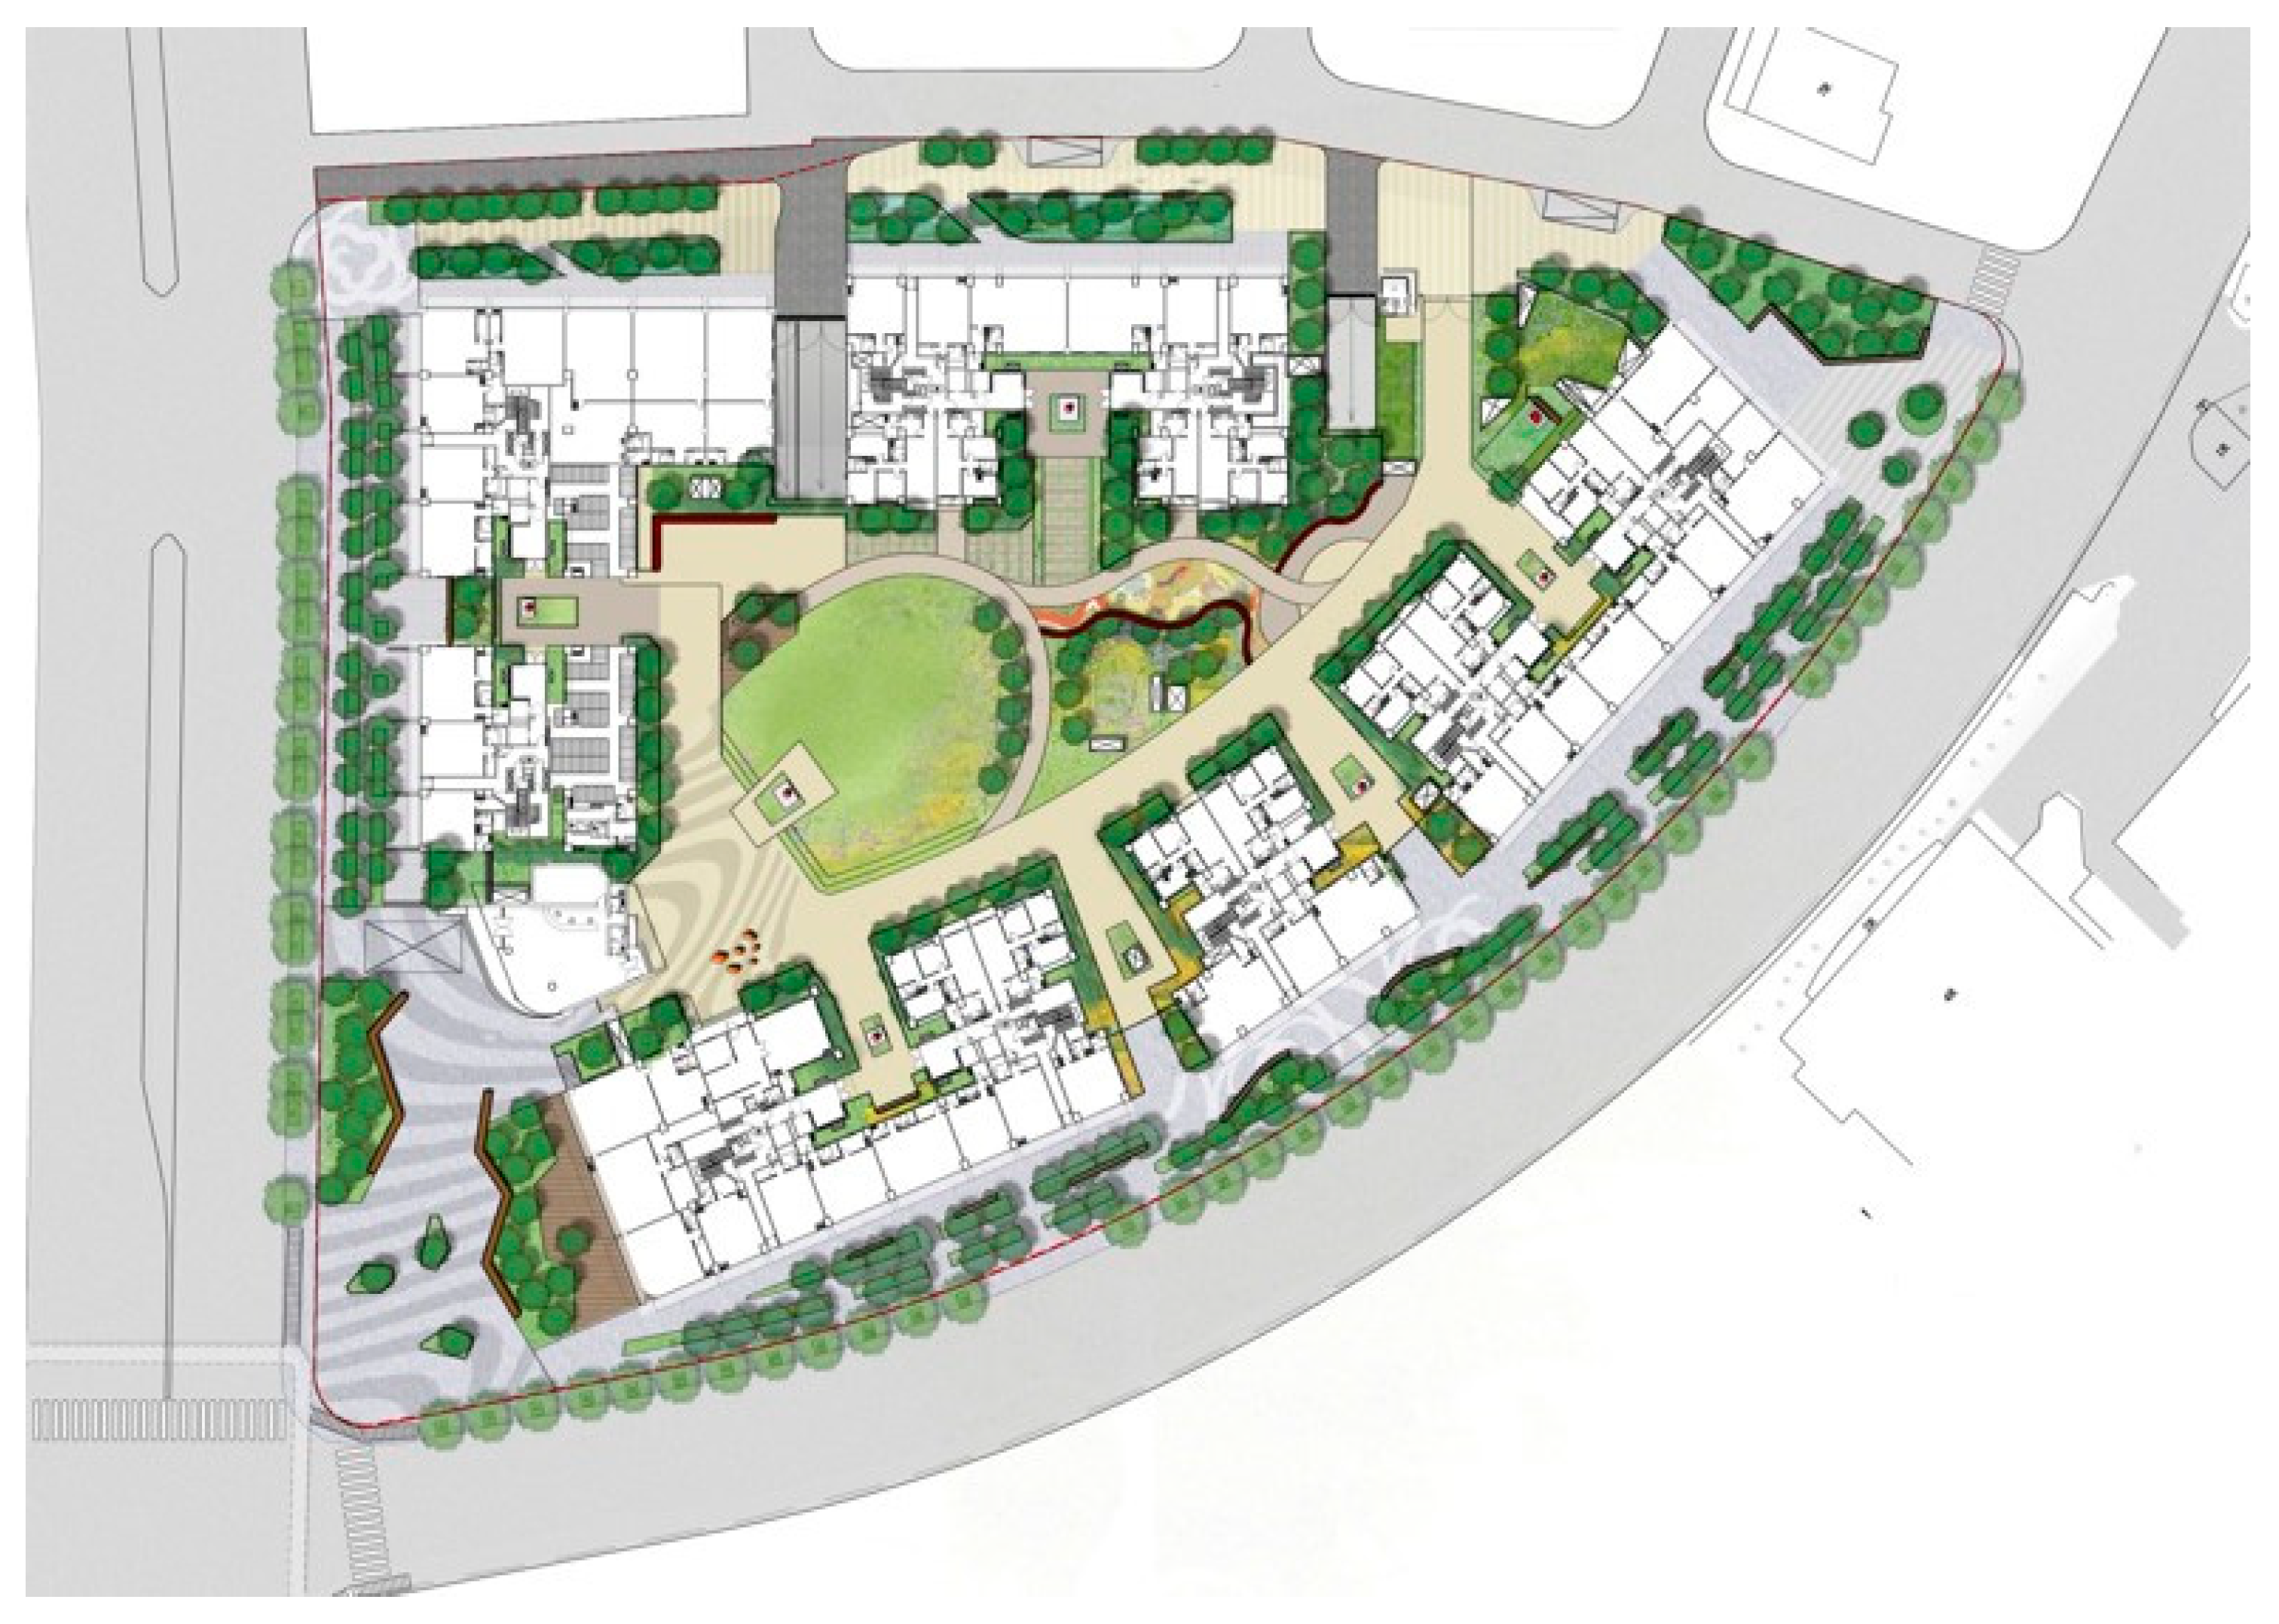
3.3.1. The Taipei 2017 Summer Universiade Athletes’ Village and Linkou Public Housing Project (LPHP)
- Lush greenery: Increasing greenery areas provide more fresh air (high CO2 absorbing capability) and a comfortable environment to the residents.
- Sunlight and ventilation: Three sides of the buildings in LPHP receive good sunlight and ventilation. This helps with energy saving.
- Rainwater recycling: A rainwater recycling system is available and is used for watering plants.
- Permeable pavement: The adoption of permeable bricks increases water infiltration to the underground, reducing the chance of flooding.
- Waste reduction: Reuse of falsework materials minimizes construction waste and its disposal.
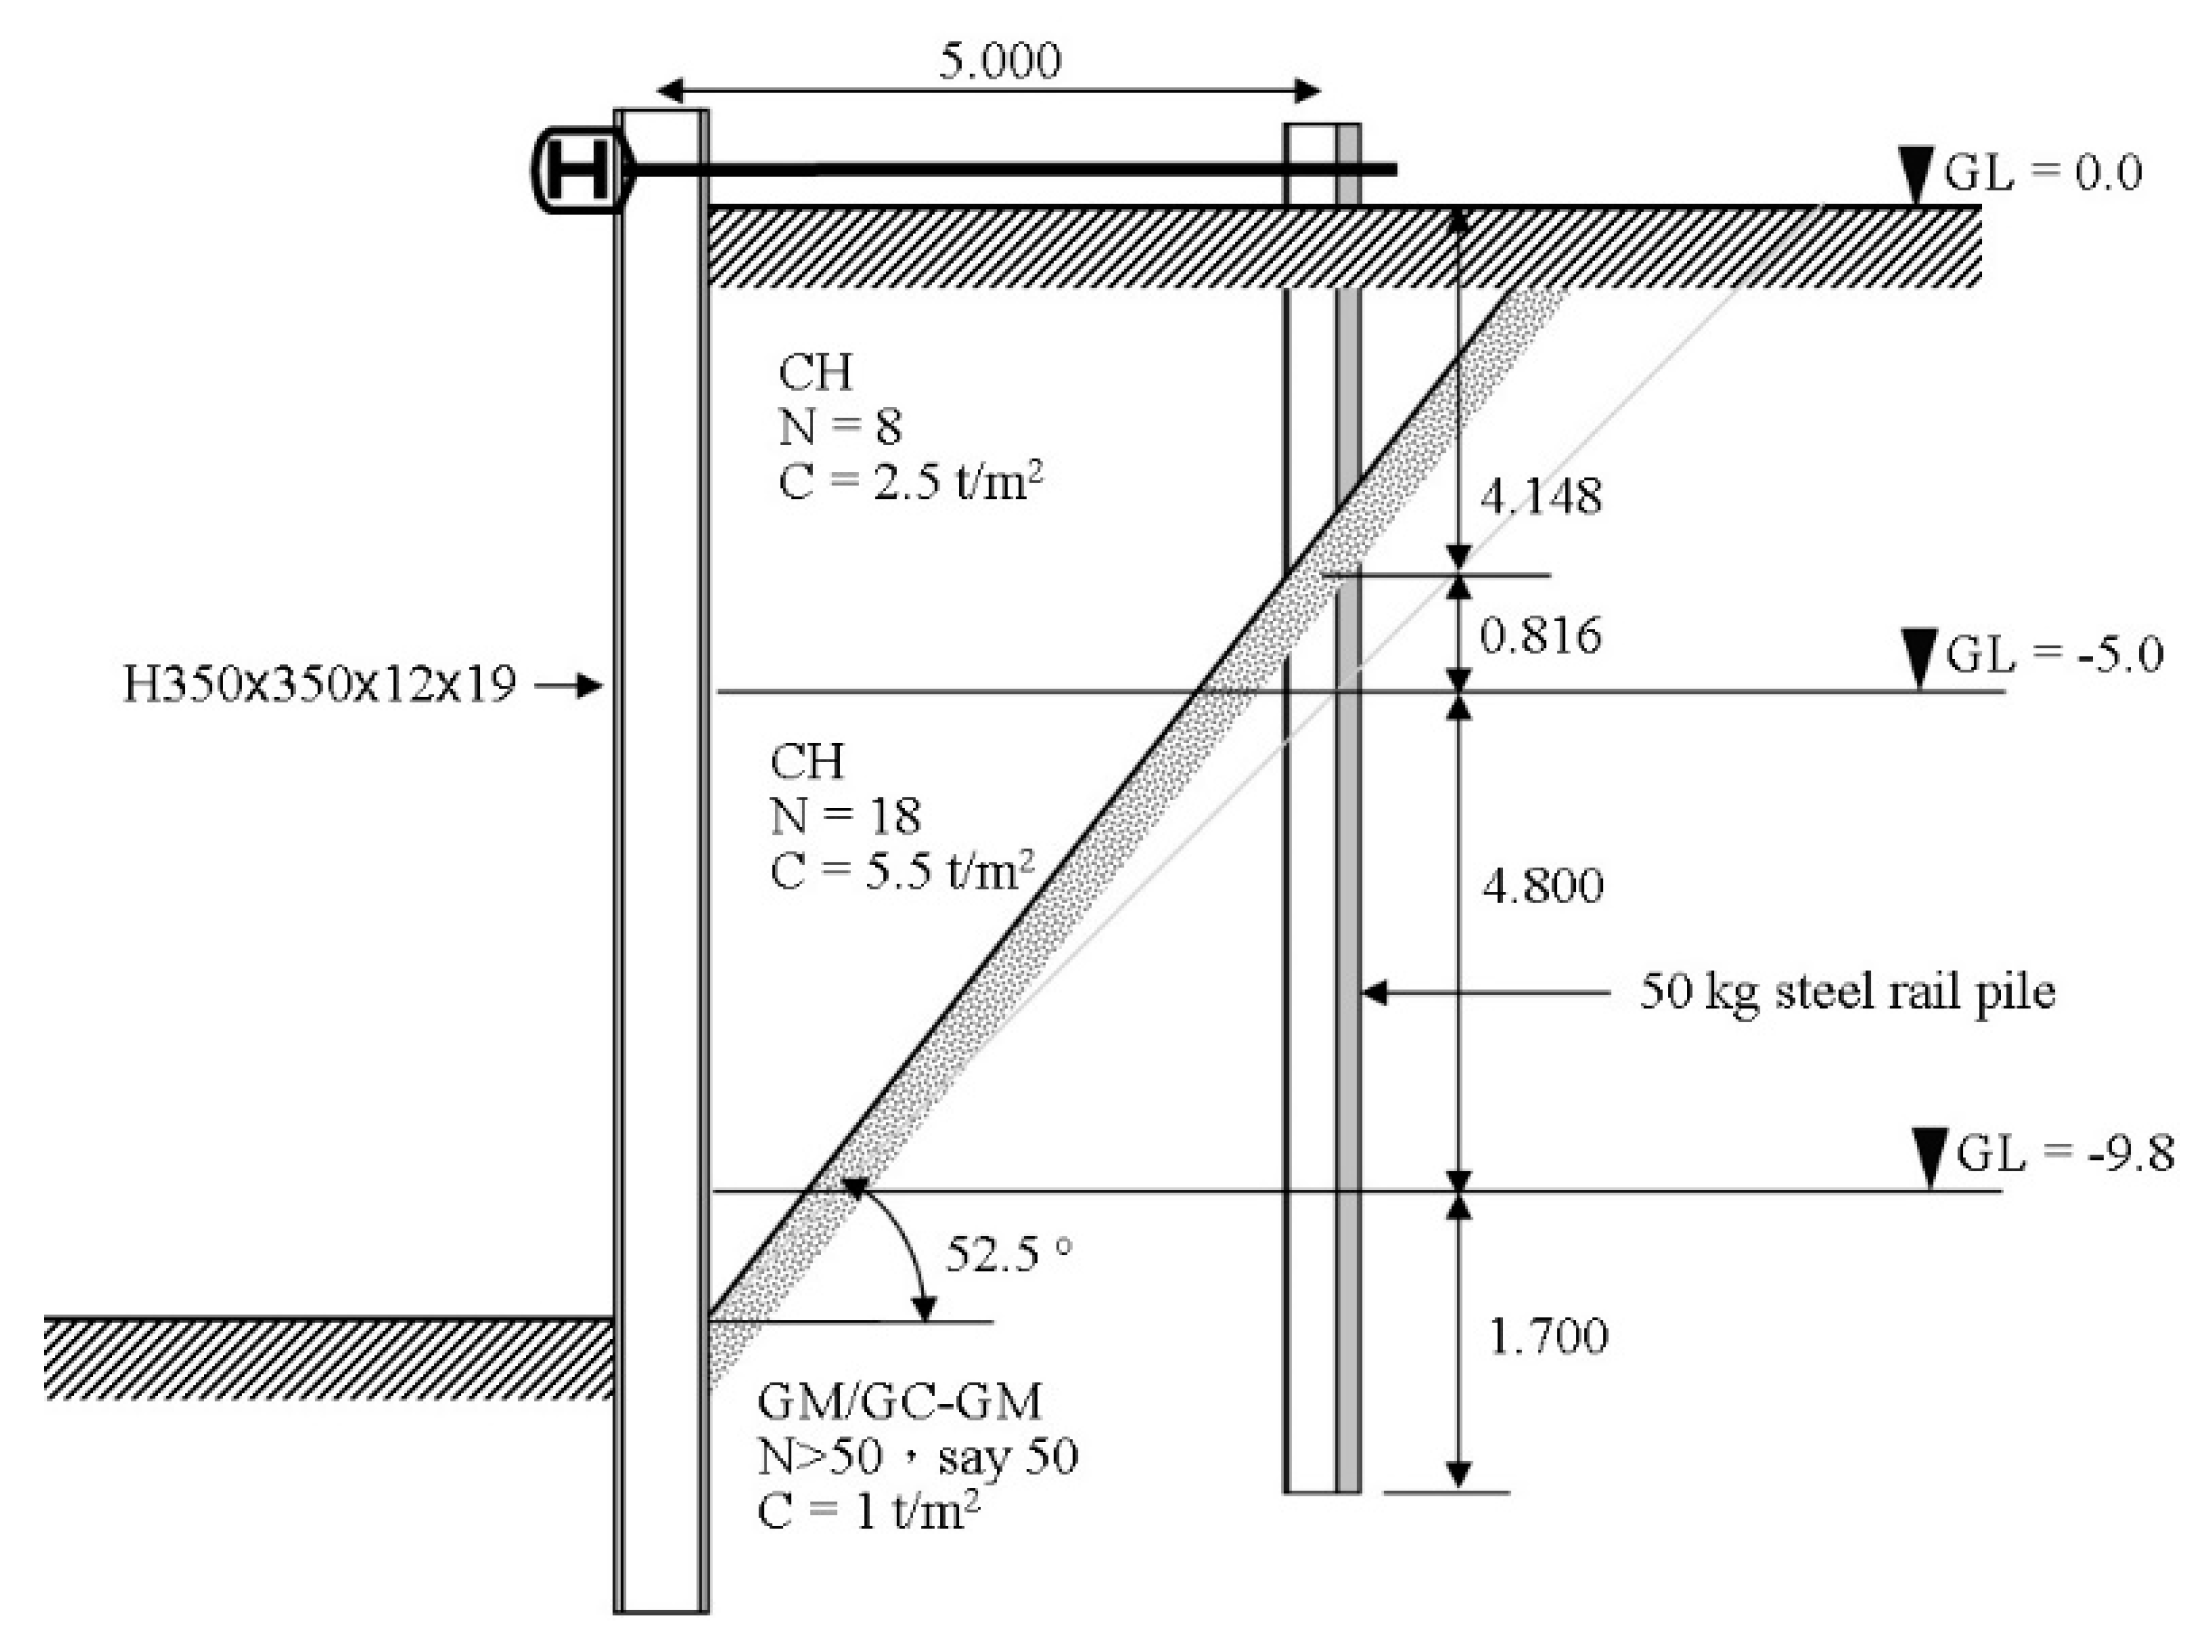
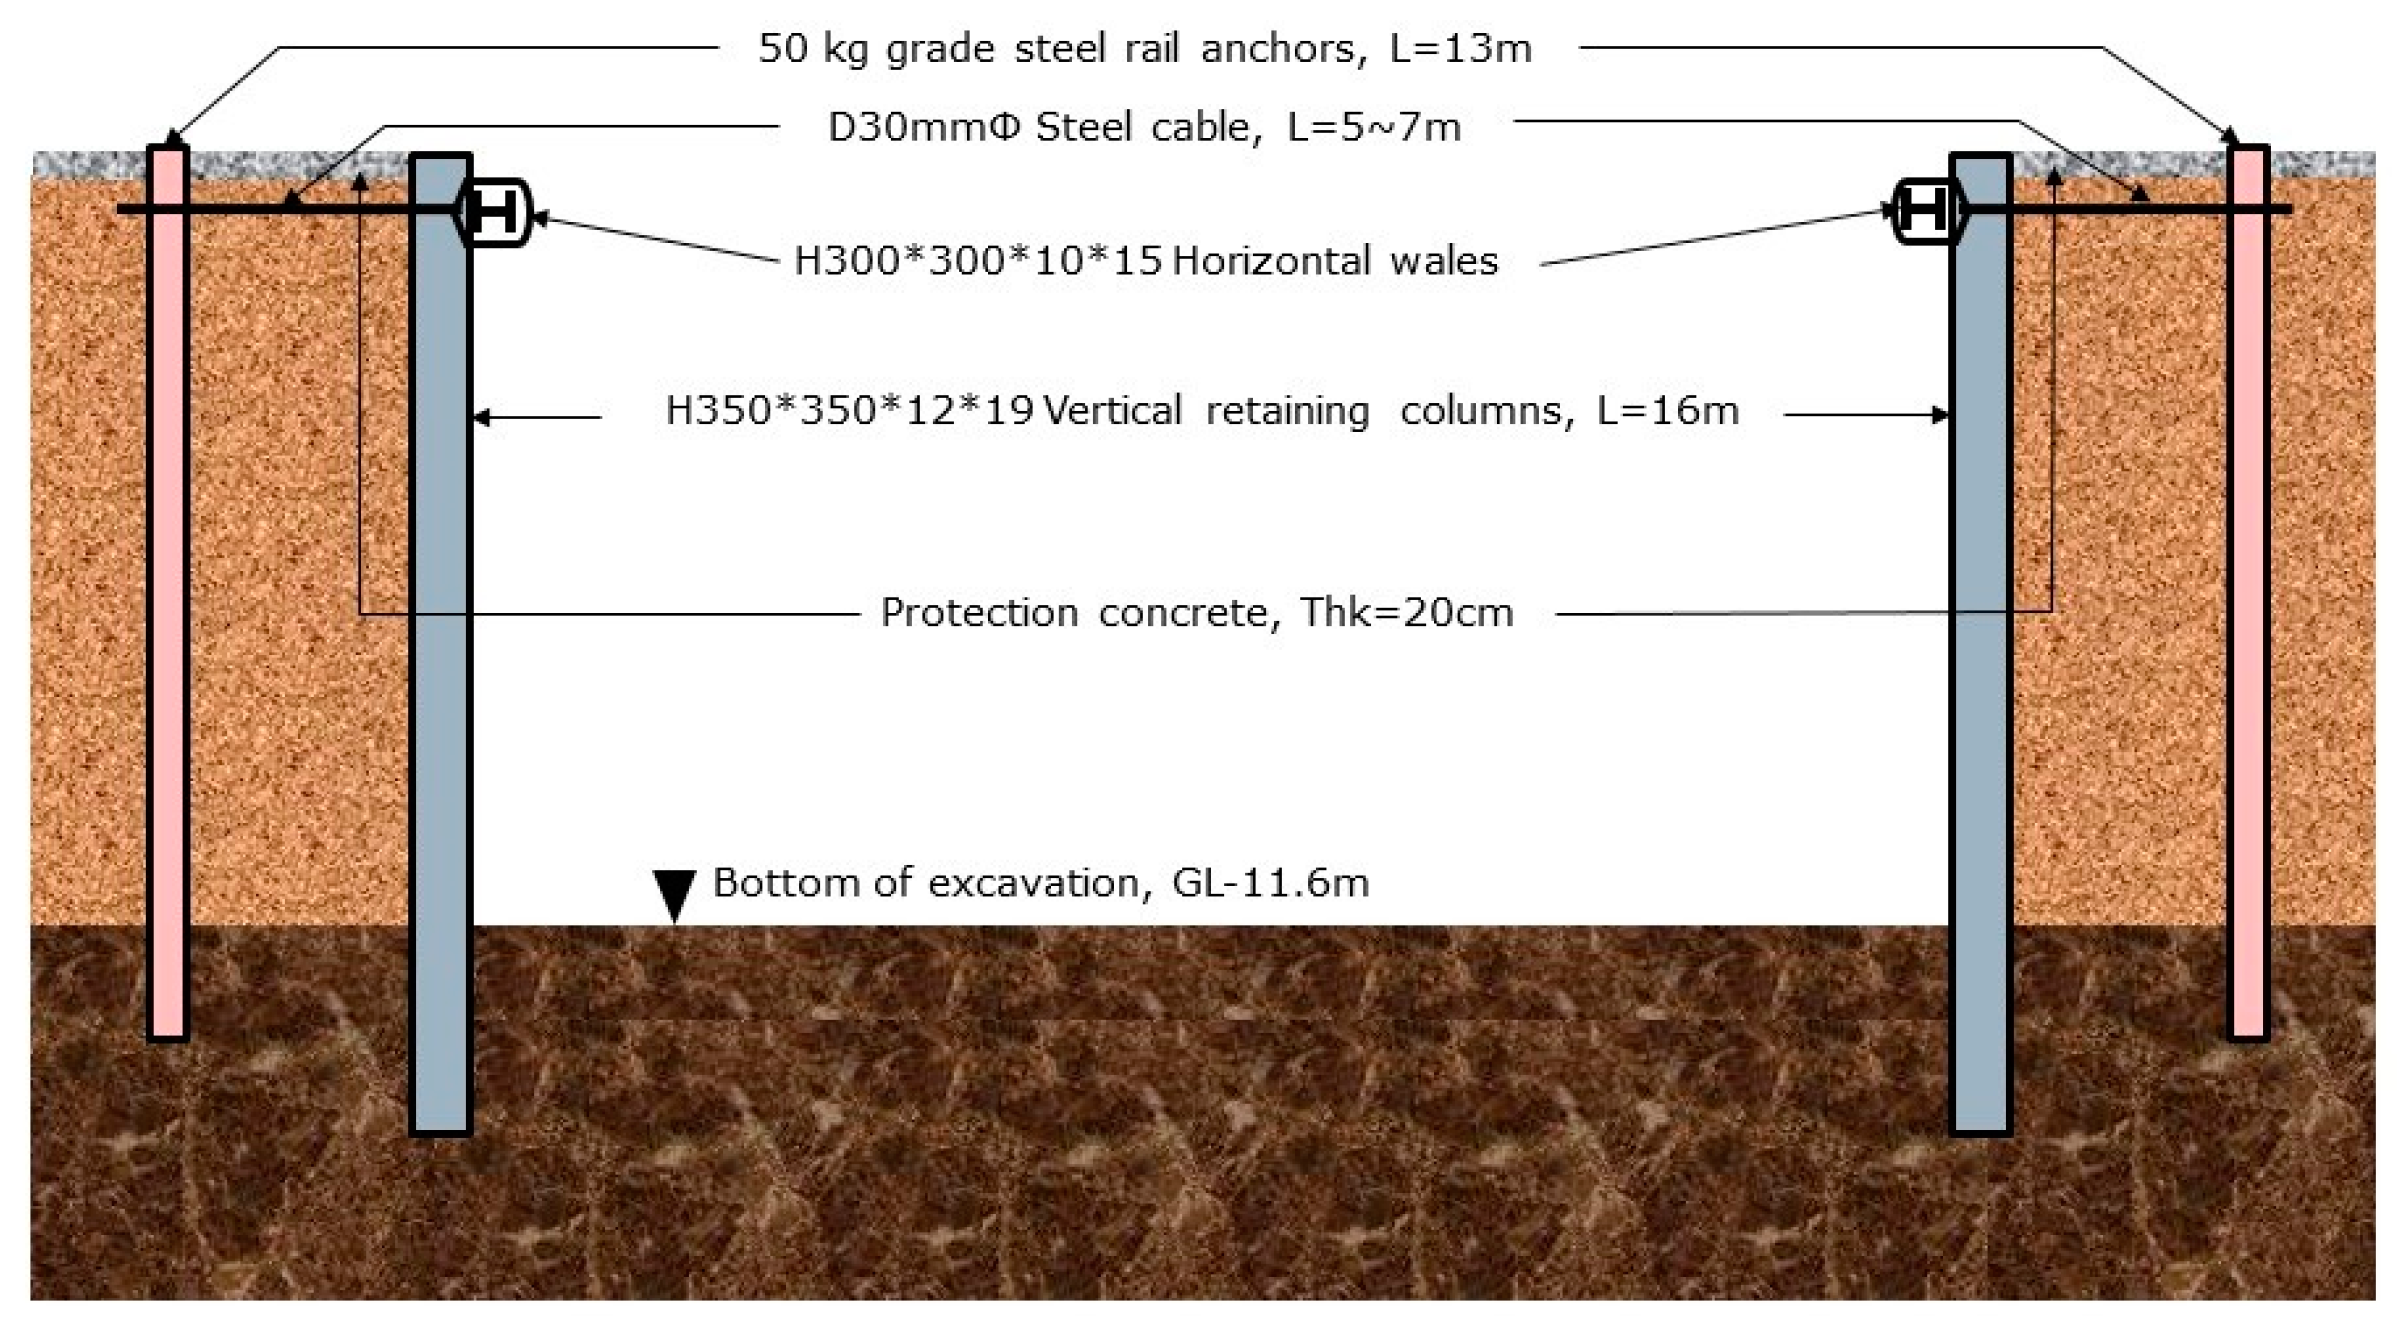
- Work quantity reduction: Adopting a special retaining method to reduce work quantity for basement excavation.
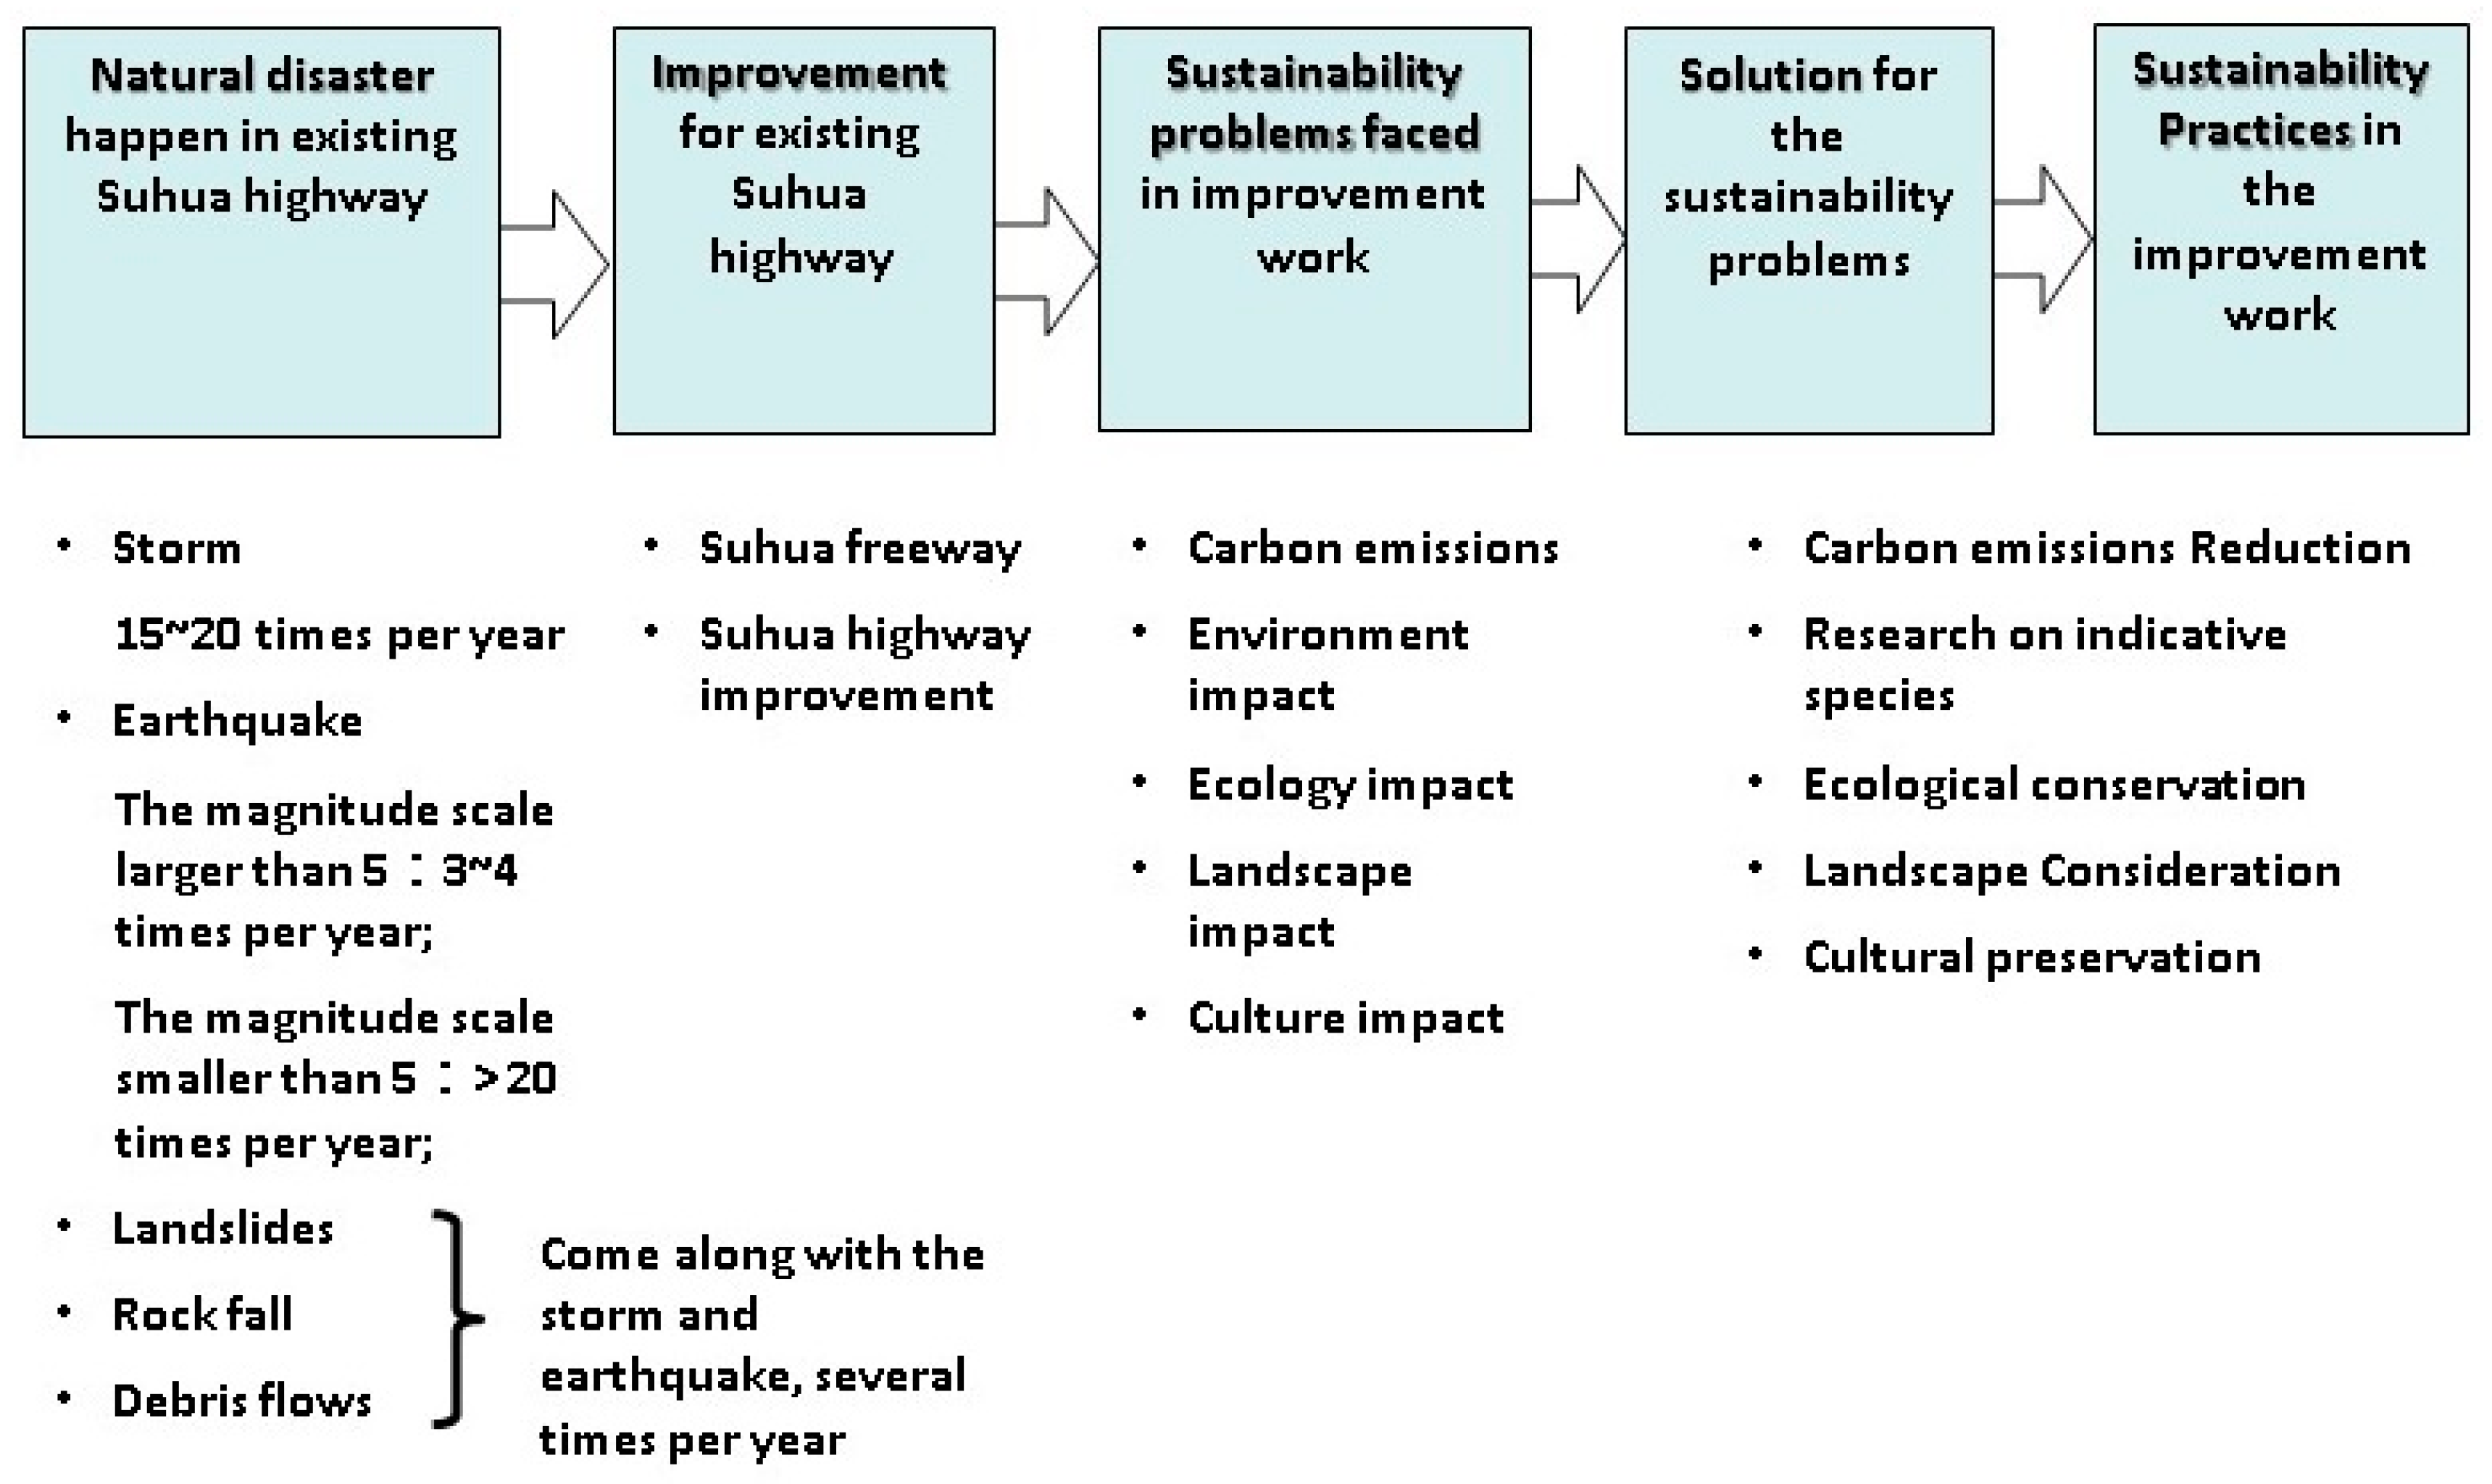
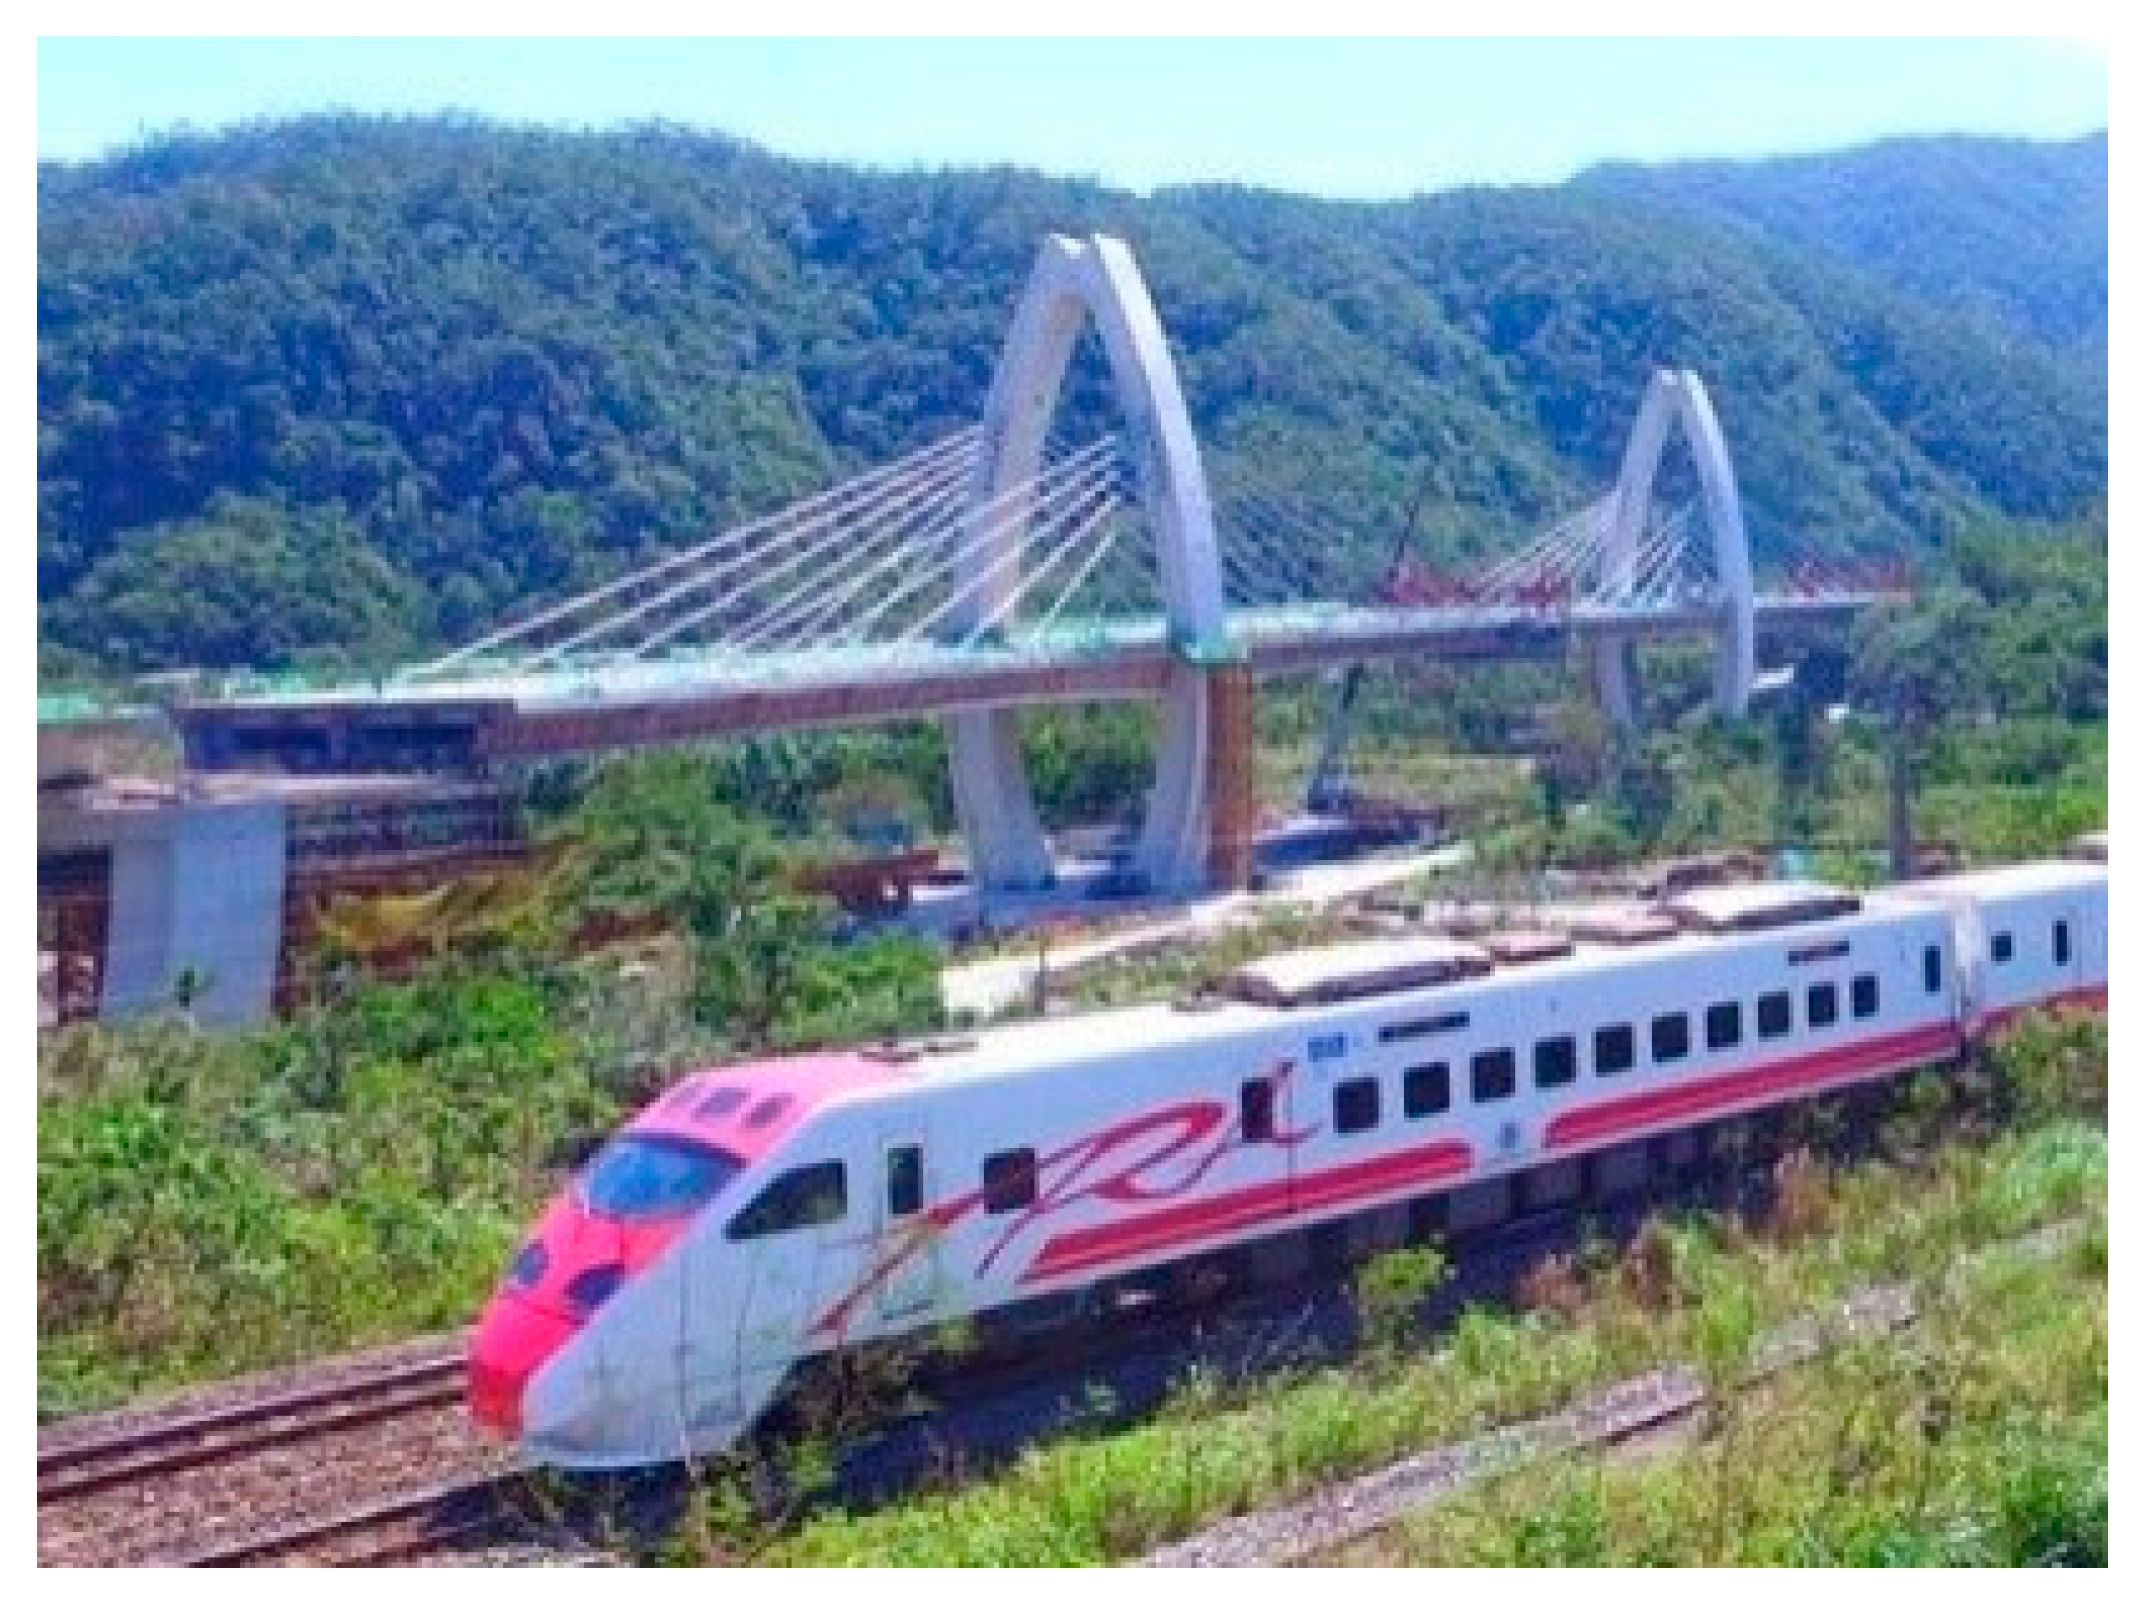
3.3.2. Suhua Highway Improvement Project (SHIP)
- Concrete mixture for carbon reduction [11,23]: In SHIP, the average carbon emission during cement production is 0.58 kg CO2e/kg. The concrete mixture was modified by substituting cement with recyclable materials, such as coal fly ash (CFA) and ground-granulated blast-furnace slag (GGBFS), which was estimated to reduce carbon emission by 13–18% compared to the average value. Table 13 shows the estimated percentages of carbon reduction during the construction phase for the four individual contracts of the SHIP project.
- Efficiency of equipment and machines for carbon reduction: Carbon emission was found to reduce by up to 34–43% from the original estimate. This can be attributed to the adjustment made to the concrete mixture by replacing cement with CFA and GGBFS. Table 14 shows the summary of carbon reduction results for contracts A1 to A3 and C1
- Research on specified species [24]: The habitats of local animal species can be severely impacted by construction activities. In SHIP, the biologists developed a research program to monitor changes in species’ population and health during the construction process. Table 15 shows the observed frequencies of specified species during 2012 to 2016.
- Ecological conservation: The highway alignment has been adjusted carefully, such that the removal or cutting of protected trees will not be required. The electrical control room for the tunnel was built underground to minimize any impact on the aboveground environment. Furthermore, efforts in design have been made to prevent roadkill. Special shading boards and light-cutting devices have been installed along the road edges to protect insects and other small flying species [11].
- Landscape: The highway passes by a village called Baimi Community, which is located between Suao and the Dongao tunnel. The structure of the Baimi Scenic Bridge is an extradosed bridge with a total length of 340M. The engineers introduced the shape of a rice grain in the design of the bridge pylons, as “Baimi” means “rice” in English. This design incorporated local characteristics into the bridge and made it a pleasant addition to the landscape [11].
- Cultural preservation: During the excavation of the bridge foundation near Hanbern, the engineers discovered ancient human ruins, including ancient tools and goods, which led to the name “Hanbern Historic Remains”. These ancient artifacts are considered to be the relics of a Neolithic culture that was prevalent in this area 1100–1800 years ago. Since these artifacts have archeological significance, bridge construction work was suspended for several years until on-site archeological research was completed. Figure 14 shows on-site pictures of the “Baimi Scenic Bridge” [11].
4. Comparisons of Assessment Systems between Green Building and Civil Infrastructure
5. Contribution
6. Conclusions
Author Contributions
Funding
Conflicts of Interest
References
- World Bank. World Development Rep. 1994: Infrastructure for Development; Oxford University Press: Oxford, UK, 1994; pp. 1–12. [Google Scholar]
- World Bank. Infrastructure at the Crossroads: Lessons from 20 Years of World Bank Experience; World Bank: Washington, DC, USA, 2006; pp. 1–9, 65–80. [Google Scholar]
- Shen, L.; Wu, Y.; Zhang, X. Key assessment indicators for the sustainability of infrastructure projects. J. Constr. Eng. Manag. ASCE 2011, 137, 441–451. [Google Scholar] [CrossRef]
- Jiang, L.; Li, Z.; Li, L.; Gao, Y. Constraints on the promotion of prefabricated construction in China. Sustainability 2018, 10, 2516. [Google Scholar] [CrossRef]
- Amoruso, F.M.; Dietrich, U.; Schuetze, T. Development of a building information modeling-parametric workflow based renovation strategy for an exemplary apartment building in Seoul, Korea. Sustainability 2018, 10, 4494. [Google Scholar] [CrossRef]
- Geldermans, B.; Tenpierik, M.; Luscuere, P. Circular and Flexible Infill concepts: Integration of the residential user perspective. Sustainability 2019, 11, 261. [Google Scholar] [CrossRef]
- Intelligent Green Building. EEWH Assessment System. Available online: https://smartgreen.abri.gov.tw/welcome.php (accessed on 15 January 2019).
- Kevern, J.T. Green building and sustainable infrastructure: Sustainability education for civil engineers. ASCE 2011, 137, 107–112. [Google Scholar] [CrossRef]
- Mehmet, A.B.; Islam, H. Managing sustainability assessment of civil infrastructure projects using work, nature, and flow. ASCE 2014, 30, 04014019. [Google Scholar]
- Jang, W.; Lee, S.K.; Han, S.H. Sustainable performance index for assessing the green technologies in urban infrastructure projects. ASCE 2018, 34, 04017056. [Google Scholar] [CrossRef]
- Shau, H.J.; Liu, T.Y.; Chen, P.H.; Chou, N.N.S. Sustainability practices for the Suhua Highway Improvement Project in Taiwan. Int. J. Civ. Eng. 2019, 1–11. [Google Scholar] [CrossRef]
- USGBC. US LEED Assessment System. 2019. Available online: https://new.usgbc.org/leed (accessed on 15 January 2019).
- UK BREEAM. UK BREEAM Assessment System. 2019. Available online: https://www.breeam.com/ (accessed on 15 January 2019).
- Natural Resources Canada. Natural Resources Cananda Assessment System. 2019. Available online: https://www.nrcan.gc.ca/energy/efficiency/buildings/20695 (accessed on 15 January 2019).
- CASBEE. Japan CASBEE Assessment System. 2019. Available online: http://www.ibec.or.jp/CASBEE/english/ (accessed on 15 January 2019).
- Zhong, Y.; Ling, F.Y.Y.; Wu, P. Using multiple attribute value technique for the selection of structural frame material to achieve sustainability and constructability. J. Constr. Eng. Manag. ASCE 2017, 143, 04016098. [Google Scholar] [CrossRef]
- Liu, T.Y.; Chen, P.H.; Chou, N.N.S. Disaster prevention and carbon reduction effectiveness of a special retaining method for excavation. In Proceedings of the 30th KKHTCNN, Symposium on Civil Engineering, Taipei, Taiwan, 2–4 Novemeber 2017. [Google Scholar]
- New Asia Construction and Development Corp. Basement Excavation Plan for Taipei 2017 Summer Universiade Athlete’s Village and Linkou Public Housing Project; New Asia Construction and Development Corp: Taiwan, 2013. (In Chinese) [Google Scholar]
- New Asia Construction and Development Corp. Analysis and Calculation of Basement Excavation Retaining Method for Taipei 2017 Summer Universiade Athlete’s Village and Linkou Public Housing Project; New Asia Construction and Development Corp: Taiwan, 2013. (In Chinese) [Google Scholar]
- New Asia Construction and Development Corp. Site SPT Test Report for Taipei 2017 Summer Universiade Athlete’s Village and Linkou Public Housing Project; New Asia Construction and Development Corp: Taiwan, 2013. (In Chinese) [Google Scholar]
- Chou, S.L. Research Report of Carbon Footprint Inventory for Suhua Highway Improvement Project; Suhua Highway Improvement Project Office: Taiwan, 2014. (In Chinese) [Google Scholar]
- Hsu, P.J. 2013 Annual Progress Report of Carbon Footprint Inventory for Suhua Highway Improvement Project; Suhua Highway Improvement Project Office: Taiwan, 2013. (In Chinese) [Google Scholar]
- Sinotech Engineering Consultants, Ltd. 2013 Annual Report for Suhua Highway Improvement Project; Suhua Highway Improvement Project Carbon Footprint Inventory Report: Taiwan, 2013. (In Chinese) [Google Scholar]
- Endemic Species Research Institute. 2012–2016 Annual Research Report on Indicative Species for Suhua Highway Improvement Project; Suhua Highway Improvement Annual Project: Taiwan, 2012–2016. (In Chinese)


| Key Indicators | Detailed Item No. | Possible Points | Required Item No. |
|---|---|---|---|
| Integrative process | 1 | 1 | 0 |
| Location and transportation | 8 | 16 | 0 |
| Sustainable sites | 7 | 10 | 1 |
| Water efficiency | 7 | 11 | 3 |
| Energy and atmosphere | 11 | 33 | 4 |
| Material and resources | 7 | 13 | 2 |
| Indoor environmental quality | 11 | 16 | 2 |
| Innovation | 2 | 6 | 0 |
| Regional priority | 1 | 4 | 0 |
| Total | 55 | 110 | 12 |
| Environmental Section | Weighting |
|---|---|
| Management | 12% |
| Health and Wellbeing | 15% |
| Energy | 19% |
| Transport | 8% |
| Water | 6% |
| Materials | 12.5% |
| Waste | 7.5% |
| Land Use and Ecology | 10% |
| Pollution | 10% |
| Total | 100% |
| Innovation (additional) | 10% |
| BREEAM Rating | % Score | Performance Percentage |
|---|---|---|
| Outstanding | ≥85 | Less than top 1% of U.K. new non-domestic buildings (innovator) |
| Excellent | ≥70 | Top 10% of U.K. new non-domestic buildings (best practice) |
| Very good | ≥55 | Top 25% of U.K. new non-domestic buildings (advanced good practice) |
| Good | ≥45 | Top 50% of U.K. new non-domestic buildings (intermediate good practice) |
| Pass | ≥30 | Top 75% of U.K. new non-domestic buildings (standard good practice) |
| Unclassified | <30 |
| Category | Indicator | Evaluation Items |
|---|---|---|
| Ecology | 1. Biodiversity | Ecological network, biological habitat, plant diversity, soil ecosystem |
| 2. Greenery | CO2 absorption (kg-CO2/(m2.40yr)) | |
| 3. Water content of the site | Water infiltration and retention, storm water runoff management | |
| Energy Saving | 4. Daily energy conservation (prerequisite) | Building envelope load ENVLOAD (20% higher than building regulation), and other techniques (including HVAC system, lighting, management system) |
| Waste Reduction | 5. CO2 emission reduction | CO2 emission of building materials (kg-CO2/m2) |
| 6. Construction waste reduction | Waste of soil, construction, destruction, utilization of recycled materials | |
| Health | 7. Indoor environment | Acoustics, illumination and ventilation, interior finishing building materials |
| 8. Water conservation (prerequisite) | Water usage (L/person), hygienic instrument with water saving, grey water reuse | |
| 9. Sewage and waste disposal facility improvement | Sewer plumbing, sanitary condition for garbage gathering, compost |
| Indicators | Yes No | Design Score | Basic Score | Deviation Rn * | Score RSi | Score Limitation | ||
|---|---|---|---|---|---|---|---|---|
| 1. Biodiversity | BD = | BDc = | R1 = | RS1 = 9.51 × R1 + 2.0 = | RS1 ≦ 9.0 | |||
| 2. Greenery | TCO2 = | TCO2c = | R2 = | RS2 = 4.29 × R2 + 2.0 = | RS2 ≦ 9.0 | |||
| 3. Water content of the site | λ = | λc = | R3 = | RS3 = 1.41 × R3 + 2.0 = | RS3 ≦ 9.0 | |||
| 4. Daily Energy | Building frame | Office | EEV = | 0.80 | R41 = | RS41 = 29.76 × R41 + 2.0 = | RS41 ≦ 12.0 | |
| Department store | EEV = | 0.80 | R41 = | RS41 = 29.76 × R41 + 2.0 = | ||||
| Hospital | EEV = | 0.80 | R41 = | RS41 = 11.11 × R41 + 2.0 = | ||||
| Hotel | EEV = | 0.80 | R41 = | RS41 = 11.11 × R41 + 2.0 = | ||||
| Residence | EEV = | 0.80 | R41 = | RS41 = 8.93 × R41 + 2.0 = | ||||
| School | EEV = | 0.80 | R41 = | RS41 = 18.94 × R41 + 2.0 = | ||||
| Other | EEV = | 0.80 | R41 = | RS41 = 9.65 × R41 + 2.0 = | ||||
| Air condition | EAC = | 0.80 | R42 = | RS42 = 13.99 × R42 + 2.0 = | RS42 ≦ 10.0 | |||
| Illumination | EL = | 0.70 | R43 = | RS43 = 8.77 × R43 + 2.0 = | RS43 ≦ 6.0 | |||
| 5. CO2 emission reduction | CCO2 = | 0.82 | R5 = | RS5 = 20.11 × R5 + 2.0 = | RS5 ≦ 9.0 | |||
| 6. Construction waste Reduction | PI = | 3.30 | R6 = | RS6 = 15.77 × R6 + 2.0 = | RS6 ≦ 9.0 | |||
| 7. Indoor environment | IE = | 60.0 | R7 = | RS7 = 20.66 × R7 + 2.0 = | RS7 ≦ 12.0 | |||
| 8. Water conservation (prerequisite) | WI = | 2.0 | ------ | RS8 = WI = | RS8 ≦ 9.0 | |||
| 9. Sewage and waste disposal facility improvement | GI = | 10.0 | R9 = | RS9 = 4.29 × R9 + 2.0 = | RS9 ≦ 6.0 | |||
| Total score RS□ = □ΣRSi□ = | ||||||||
| (*): Deviation R1~R9 are equal to |Design value—Basic value|/Basic Value | ||||||||
| Green Building Label (Percentage Distribution) | Certified 0~30% | Bronze 30~60% | Silver 60~80% | Gold 80~95% | Diamond Above 95% | ||
|---|---|---|---|---|---|---|---|
| Total Score of 9 Indicators Distribution | 12 ≦ RS < 26 | 26 ≦ RS < 34 | 34 ≦ RS < 42 | 42 ≦ RS < 53 | 53 ≦ RS | ||
| Basic score deduction | Yes No □ □ | Basic score deduction when no biodiversity item | −0.0 | −1.0 | −1.5 | −1.8 | −2.2 |
| □ □ | Basic score deduction when no air condition energy saving item | −2.0 | −2.3 | −2.7 | −3.2 | −3.9 | |
| □ □ | Basic score deduction when no illumination energy saving item | −2.0 | −1.6 | −2.1 | −2.4 | −2.9 | |
| □ □ | Basic score deduction when no indoor environment item | −0.0 | −3.5 | −4.3 | −5.4 | −6.6 | |
| □ □ | Basic score deduction when no water conservation item | −2.0 | −2.0 | −2.0 | −2.0 | −2.0 | |
| Adjusted total RS score distribution after deduction of not applicable items | □ ≦ RS < □ | □ ≦ RS < □ | □ ≦ RS < □ | □ ≦ RS < □ | □ ≦ RS | ||
| Total evaluated score RS = Evaluated certificate level (please mark as “˅”) | |||||||
| Indicator | Evaluation Items |
|---|---|
| Safety | Considering a 2nd disaster prevention mechanism for the lifecycle of the facility |
| Avoiding geologically sensitive areas | |
| Minimizing the possibility of flooding and disaster | |
| Establishment of risk mitigation mechanism | |
| Periodical disaster prevention drill in the lifecycle | |
| Ecology | Ecological environment investigation, data collection, and impact assessment |
| Original spot’s preservation and indicative tree protection | |
| Ecological environment monitoring | |
| Selection of low impact construction methods and preservation of biodiversity and animal habitat integrity | |
| Establishment of safety facilities for animals | |
| Environmental protection and Carbon emission reduction | Environmental impact assessment |
| Monitoring of carbon emission in the lifecycle | |
| Selection of low carbon emission materials | |
| Establishment of carbon emission reduction mechanism and selection of the construction methods with low-carbon emission | |
| Construction methods and procedures with low air pollution (airborne particles, waste water, wastes, etc.) | |
| Lifecycle soil and water conservation plan | |
| Planting of tress with high carbon-absorption abilities | |
| Underground reservoir design with long-term maintenance for the facility | |
| Energy saving | Adoption of alternative energy (e.g., green energy, solar energy, wind energy, etc.) |
| Selection of energy-saving materials and construction methods | |
| Use of local materials to reduce carbon emission | |
| Use of energy-saving machinery to reduce energy consumption | |
| Design and selection of energy-saving electrical and mechanical equipment | |
| Periodic maintenance for equipment in the lifecycle | |
| Waste reduction | Use of recyclable and environmentally friendly materials |
| Adoption of waste reduction construction methods (e.g., precast, modularization, etc.) | |
| Use of industrial or construction by-product (e.g., fly ash, ground-granulated blast-furnace slag, reservoir silt, etc.) | |
| Garbage classification and water resource recycling | |
| Use fixed-length materials to minimize material waste | |
| Durability | Durable structure design |
| Use of durable materials | |
| Adaptive and upgradable design | |
| Adoption of long earthquake and flood regression periods for design | |
| Establishment of excellent operation and maintenance mechanism | |
| Benefit | Meet the original functional requirement |
| Boost economy and increase career prospect | |
| Enhance the design, construction, and operation quality and ability | |
| Cost down in the lifecycle | |
| Landscape, humanities and culture reservation | Localization of structure design |
| Design of structure for landscape fusion | |
| Beautification of design of structure and landscaping | |
| Provision of participation and communication to the public | |
| Care for minorities | |
| Protection of historical sites and cultural relics | |
| Creation of public art | |
| Creativity | Introduction of new materials, new construction methods, new technologies, etc. |
| Innovation in engineering project design | |
| Combination of project with scenery and culture | |
| Application of value engineering |
| Basic Items | Quantities | Remark |
|---|---|---|
| Site area (m2) | 22,792 | |
| Total floor area (m2) | 115,647 | |
| Stories | 19~21 | |
| 2 rooms type | 66 | 62.7 m2 |
| 3 rooms type | 454 | 99 m2 |
| 4 rooms type | 130 | 112.2 m2 |
| Storefront | 38 | |
| Parking | 688 |
| Items | Description | Quantity | Remarks (G.L. in Reference to Ground Level) |
|---|---|---|---|
| Vertical steel column | H350 × 350 × 12 × 19, L = 16 m | @0.8~1 m | G.L. 0 m~−16 m |
| Horizontal wales | H300 × 300 × 10 × 15 | 1 | G.L. −1 m + |
| Steel cable | D32mmΦ, L = 5m~7 m | @6 m | For anchoring pile to wale |
| Anchor piles | 50 kg grade steel rail, L = 13 m | @6 m | G.L. 0.5 m~−12.5 m |
| Protection concrete | f’c = 140 kg/cm2, Thk = 20 cm | Around the site | With wire mesh |
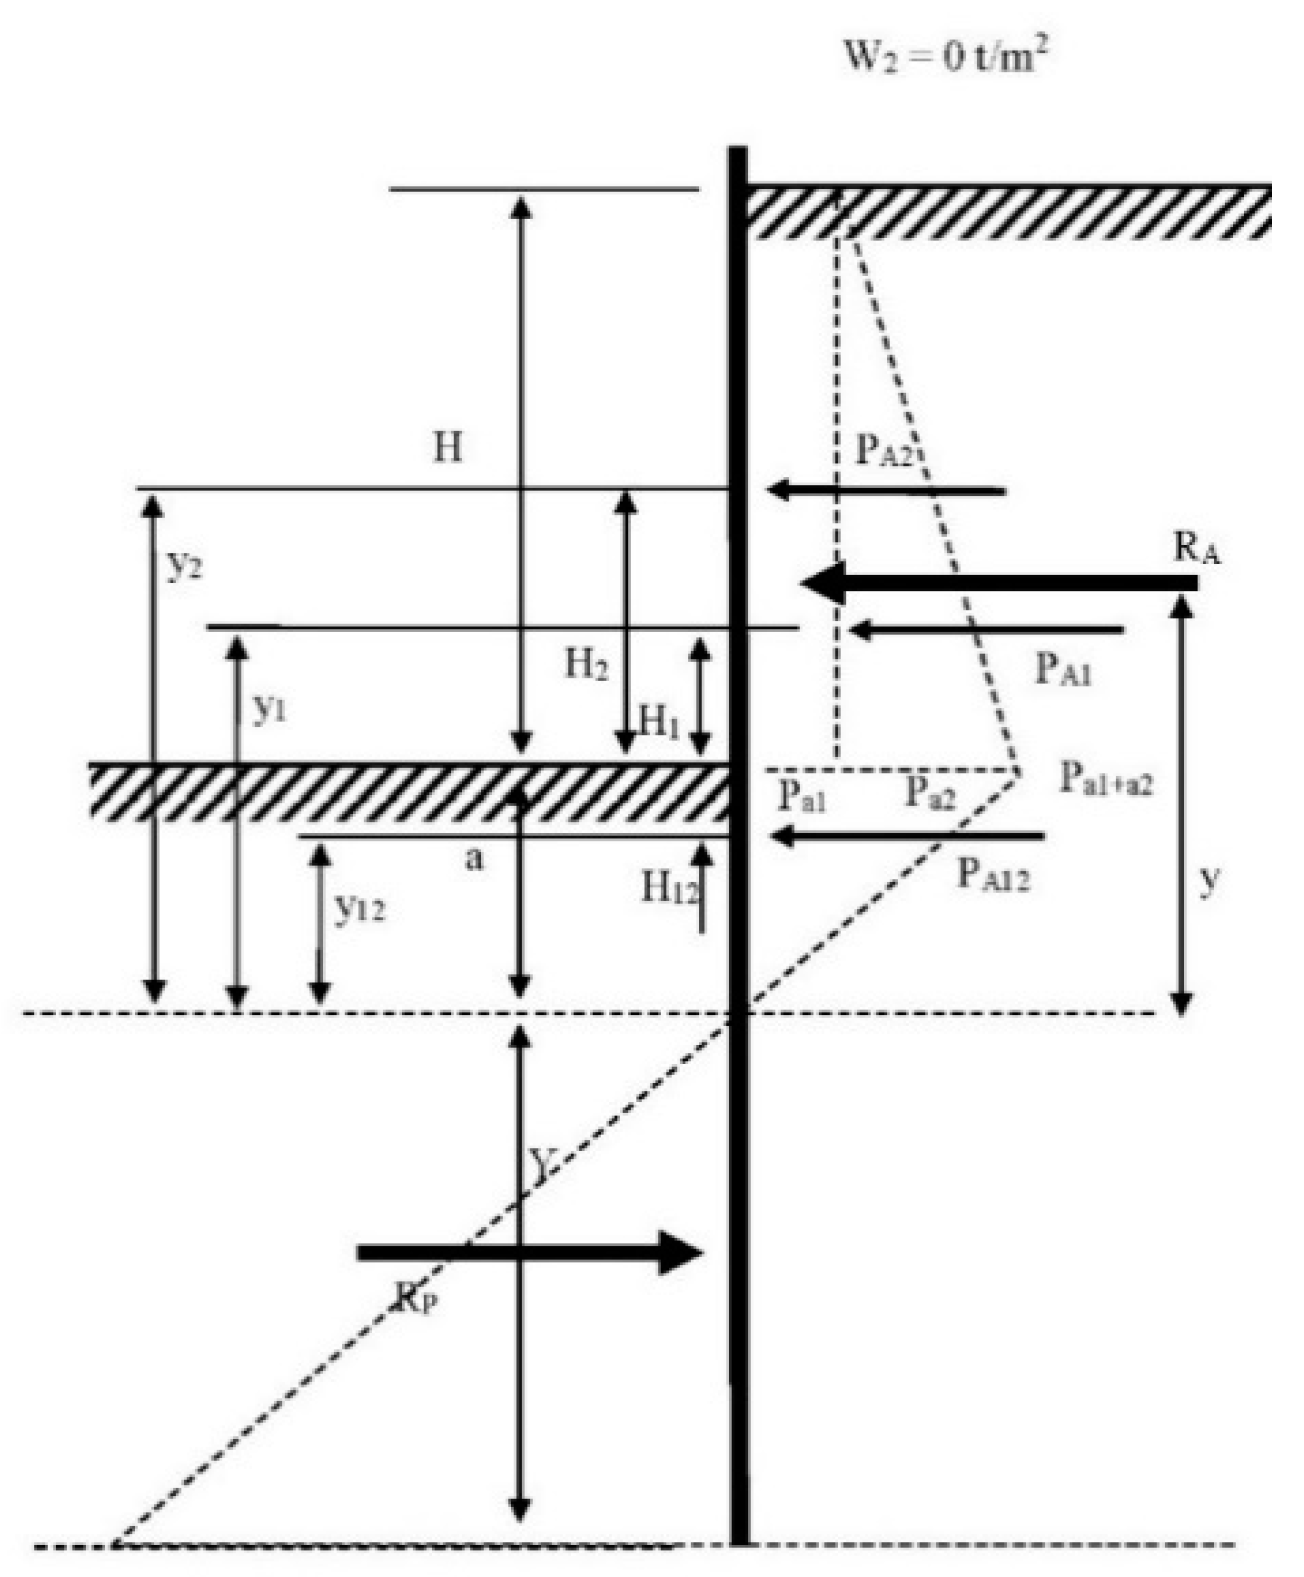
| Parameter | Value |
|---|---|
| Dry density, γd (t/m3) | 2.000 |
| Angle of friction, φ (°) | 35.000 |
| Surcharge (t/m) | - |
| Retaining wall height (m) | 9.600 |
| Coefficient of at rest earth pressure, K0 | 0.426 |
| Coefficient of active earth pressure, KA | 0.271 |
| Coefficient of passive earth pressure, Kp | 3.690 |
| Earth pressure per unit width due to soil pressure, Pa1(t) | 5.203 |
| Earth pressure per unit width due to surcharge, Pa2(t) | - |
| Pa1 + Pa2 | 5.203 |
| Resultant active earth pressure, RA(t) | 24.974 |
| Pmax (kg) | H (cm) | h (cm) | A (cm2) | I (cm4) | Mmax (kg-cm) | σmax (kg/cm2) | τmax (kg/cm2) | Δmax (cm) |
| 24,974 | 960 | 35 | 173.87 | 40,295 | 2,367,905 | 1028 | 144 | 5.44 |
| a (cm) | b (cm) | α | β | E (kg/cm2) | RA (kg) | RB (kg) | ||
| 640 | 320 | 0.666667 | 0.333333 | 2,100,000 | 3700 | 21,274 |
| No. | Item | Unit | Total Reduced Quantity | Carbon Emission Factor | Carbon Reduction (kg) | Remark |
|---|---|---|---|---|---|---|
| 1 | Struts | Kg | 2,450,000 | 2.42 | 592,900 | Ratio=10% |
| 2 | Transportation | t-km | 9800 | 0.24 | 2352 | |
| 3 | Diesel fuel (fixed location) | L | 2700 | 3.42 | 9234 | |
| 4 | Diesel fuel (moved location) | L | 3920 | 3.45 | 13,524 | |
| 5 | Gas fuel | L | 3000 | 3.10 | 9300 | |
| 6 | Power | Set | 300 | 0.69 | 207 | |
| Total | 627,517 |
| A1 | A2 | A3 | C1 | |
|---|---|---|---|---|
| Some cement replaced by CFA and GGBFS (tonCO2e) | 21,939 | 11,588 | 25,920 | 15,672 |
| Reduction percentage | 15% | 13% | 17% | 18% |
| Contract | A1 | A2 | A3 | C1 | |
|---|---|---|---|---|---|
| Items | |||||
| Original estimated carbon emission (kgCO2e) | 2223.00 | 633,181.79 | 13,037,647.05 | 806,164.54 | |
| Carbon reduction due to replacement of some cement with CFA and GGBFS (kgCO2e) | 950.01 | 213,485.17 | 5,262,050.98 | 286,902.41 | |
| Reduction percentage | 43% | 34% | 40% | 36% | |
| Item | Species | Taxonomy | 2012 | 2013 | 2014 | 2015 | 2016 |
|---|---|---|---|---|---|---|---|
| Specified birds | Raptors | Family | 4 | 4 | 4 | 4 | 4 |
| Species | 12 | 17 | 18 | 13 | 13 | ||
| Frequency | 430 | 760 | 697 | 589 | 520 | ||
| Ring-necked pheasants | Frequency | 66 | 98 | 71 | 71 | 61 | |
| Amphibians and reptile | Amphibians | Family | 5 | 5 | 5 | 5 | 5 |
| Genus | 12 | 13 | 13 | ||||
| Species | 15 | 17 | 15 | 14 | 15 | ||
| Frequency | 932 | 5364 | 1420 | 1509 | 1834 | ||
| Reptile | Family | 8 | 10 | 7 | 8 | 10 | |
| Genus | 16 | 21 | 21 | ||||
| Species | 19 | 23 | 16 | 16 | 19 | ||
| Frequency | 184 | 195 | 141 | 176 | 142 | ||
| Migratory fishes | Migratory fishes | Family | 6 | 6 | 9 | 12 | 10 |
| Species | 17 | 17 | 28 | 32 | 22 | ||
| Frequency | 276 | 352 | 1316 | 2279 | 841 | ||
| Freshwater crabs and shrimps | Crabs | Family | 2 | 2 | 2 | 2 | 2 |
| Species | 7 | 4 | 8 | 8 | 6 | ||
| Frequency | 48 | 35 | 185 | 209 | 67 | ||
| Shrimps | Family | 2 | 2 | 2 | 2 | 2 | |
| Species | 12 | 11 | 15 | 17 | 12 | ||
| Frequency | 505 | 367 | 1344 | 1729 | 609 |
| Indicator | Evaluation Item | Taiwan Civil | Taiwan EEWH | U.S. LEED | U.K. BREEAM | Canada GB tools | Japan CASBEE |
|---|---|---|---|---|---|---|---|
| Ecology | Biodiversity | ● | ● | ● | |||
| Greenery | ● | ● | ● | ● | ● | ● | |
| Ecological reservation | ● | ● | ● | ||||
| Resources utilization | Natural | ● | ● | ● | ● | ||
| Recycle | ● | ● | ● | ● | ● | ● | |
| Wooden | ● | ● | ● | ||||
| Water Conservation | ● | ● | ● | ● | ● | ● | |
| Local material | ● | ● | ● | ||||
| Recycle facility | ● | ||||||
| Carbon emission | Carbon footprint inventory | ● | |||||
| Emission reduction | ● | ● | ● | ● | ● | ● | |
| Energy saving | Facilities | ● | ● | ● | ● | ● | ● |
| External structure | ● | ● | ● | ● | ● | ||
| Green power | ● | ● | ● | ● | |||
| Power consumption | ● | ● | ● | ● | ● | ||
| Waste reduction | Construction | ● | ● | ● | ● | ● | |
| Operation and Maintenance | ● | ● | ● | ● | |||
| Indoor environment | Healthy air | ● | ● | ● | ● | ● | |
| Temperature | ● | ● | ● | ● | ● | ||
| Humidity | ● | ● | |||||
| Indoor noise | ● | ● | ● | ||||
| Illumination | ● | ● | ● | ● | ● | ||
| Water reservation | Rainwater recycling | ● | ● | ● | ● | ● | |
| Underground reservoir | ● | ● | ● | ● | ● | ||
| Durability | Material selection | ● | ● | ● | |||
| Design optimization | ● | ||||||
| Benefit | Cost | ● | |||||
| Career prospect increasing | ● | ||||||
| Landscape, Humanities and Culture | Public art | ● | ● | ||||
| Localization | ● | ||||||
| Culture protection | ● | ||||||
| Creativity | New methods and technologies | ● | ● | ||||
| Value engineering | ● |
© 2019 by the authors. Licensee MDPI, Basel, Switzerland. This article is an open access article distributed under the terms and conditions of the Creative Commons Attribution (CC BY) license (http://creativecommons.org/licenses/by/4.0/).
Share and Cite
Liu, T.-Y.; Chen, P.-H.; Chou, N.N.S. Comparison of Assessment Systems for Green Building and Green Civil Infrastructure. Sustainability 2019, 11, 2117. https://doi.org/10.3390/su11072117
Liu T-Y, Chen P-H, Chou NNS. Comparison of Assessment Systems for Green Building and Green Civil Infrastructure. Sustainability. 2019; 11(7):2117. https://doi.org/10.3390/su11072117
Chicago/Turabian StyleLiu, Tai-Yi, Po-Han Chen, and Nelson N. S. Chou. 2019. "Comparison of Assessment Systems for Green Building and Green Civil Infrastructure" Sustainability 11, no. 7: 2117. https://doi.org/10.3390/su11072117
APA StyleLiu, T.-Y., Chen, P.-H., & Chou, N. N. S. (2019). Comparison of Assessment Systems for Green Building and Green Civil Infrastructure. Sustainability, 11(7), 2117. https://doi.org/10.3390/su11072117