1. Introduction
The agricultural sector has been generously supported from the EU budget. It always enjoyed the biggest part of EU budget pie, and though its part has shrunk from 70% in the beginning of 1960s to about 40% in 2010s, agriculture is still the biggest receiver of transfer payments from the EU budget [
1]. Such generous financial support not only stresses the importance of agriculture to the whole of the EU, but also indicates its vulnerability and inability to operate relying only on laissez-faire style economists’ free markets supply–demand principle. These classical economical rules cannot be applied to agriculture and production of food, as lowering the price only insignificantly increases the demand, there is a huge time gap till supply can adopt to the demand changes, the preferences of demand can be met only partially (because of climate factor), unfavorable weather conditions can significantly affect harvest and etc. All these factors, coupled with the fact that agriculture is being cultivated in rural regions and serves as a main source of income and polarizing force in keeping citizens in rural regions maintaining its viability, substantiate the necessity for supporting farming industry in EU. The supporting actions (direct payments) are being undertaken by the financial mechanisms operating under the umbrella of CAP. The CAP takes action with income support, market measures and rural development measures. Direct payments ensure income stability, and remunerate farmers for environmentally friendly farming and delivering public goods not normally paid for by the markets, such as taking care of the countryside. The direct payments (DP) are aimed to assure the long-term and less vulnerable economic viability of farms, making it less dependent on the agricultural production price fluctuations. The substantial part of direct payments is decoupled from production volumes. Funding for direct payments represents 71% of the total CAP funding, which reflects the particular importance of the system of direct payments for EU agriculture [
2].
The abovementioned issues and persistent need for additional funding has raised the justified requests to make agriculture sector more economically resilient and therefore, sustainable in order to make this sector less dependent on EU financial support. The promotion and continuation of sustainability concept persisted in 2013 reforming the CAP as the preparation for the new program period 2014–2020. The prevailing global sustainability trend, in order to preserve resources, has further encouraged CAP makers to take sustainability challenges into account. In addition to this global challenge, CAP had to become more effective in tackling the problems of the EU agriculture as a whole: support for young farmers in order to stimulate human resources in agriculture; eliminate discriminatory elements to reduce income disparities among the entities of different farm groups, etc. [
3].
Such issues were partly addressed by the EU CAP Rural Development Programme (RDP). However, from 2014 onwards, the DP system was first used to address small farms and young farmers’ problems. Thus, its role became more essential. Particular attention was paid to small farms, their viability and sustainable development. There are a number of studies on assessment of socioeconomic sustainability [
4,
5], but the combined assessment to evaluate the impact of DP on socioeconomic sustainability of small farms has not been established. It is both practical and scientifically important to adapt the proper instrument and to measure how the DP system contributes to the social sustainability of small farms in order to evaluate the effectiveness of DP achieving the CAP sustainability goals and consider the possible adjustments of DP mechanism in order to make it more effective Thus the aim of this study is to determine the impact of the DP system on the social sustainability of small farms. In order to achieve this aim, the concept of sustainability was combined with the system of direct payments; the role of small farms in the agricultural economy was established. An expert survey to determine which of the sustainability indicators are most affected by the system of direct payments was conducted. In this way, a composite indicator has been developed to measure the impact of the DP system on the social sustainability of small farms.
Agriculture is a relatively important sector in Lithuania. Indeed, it is dominated by small farms. The agricultural sector employs a large proportion of the national labor force (7.98%) and is a major exporting sector (
Table 1). Agricultural activities are particularly important in the context of social sustainability due to mitigation of depopulation in the countryside.
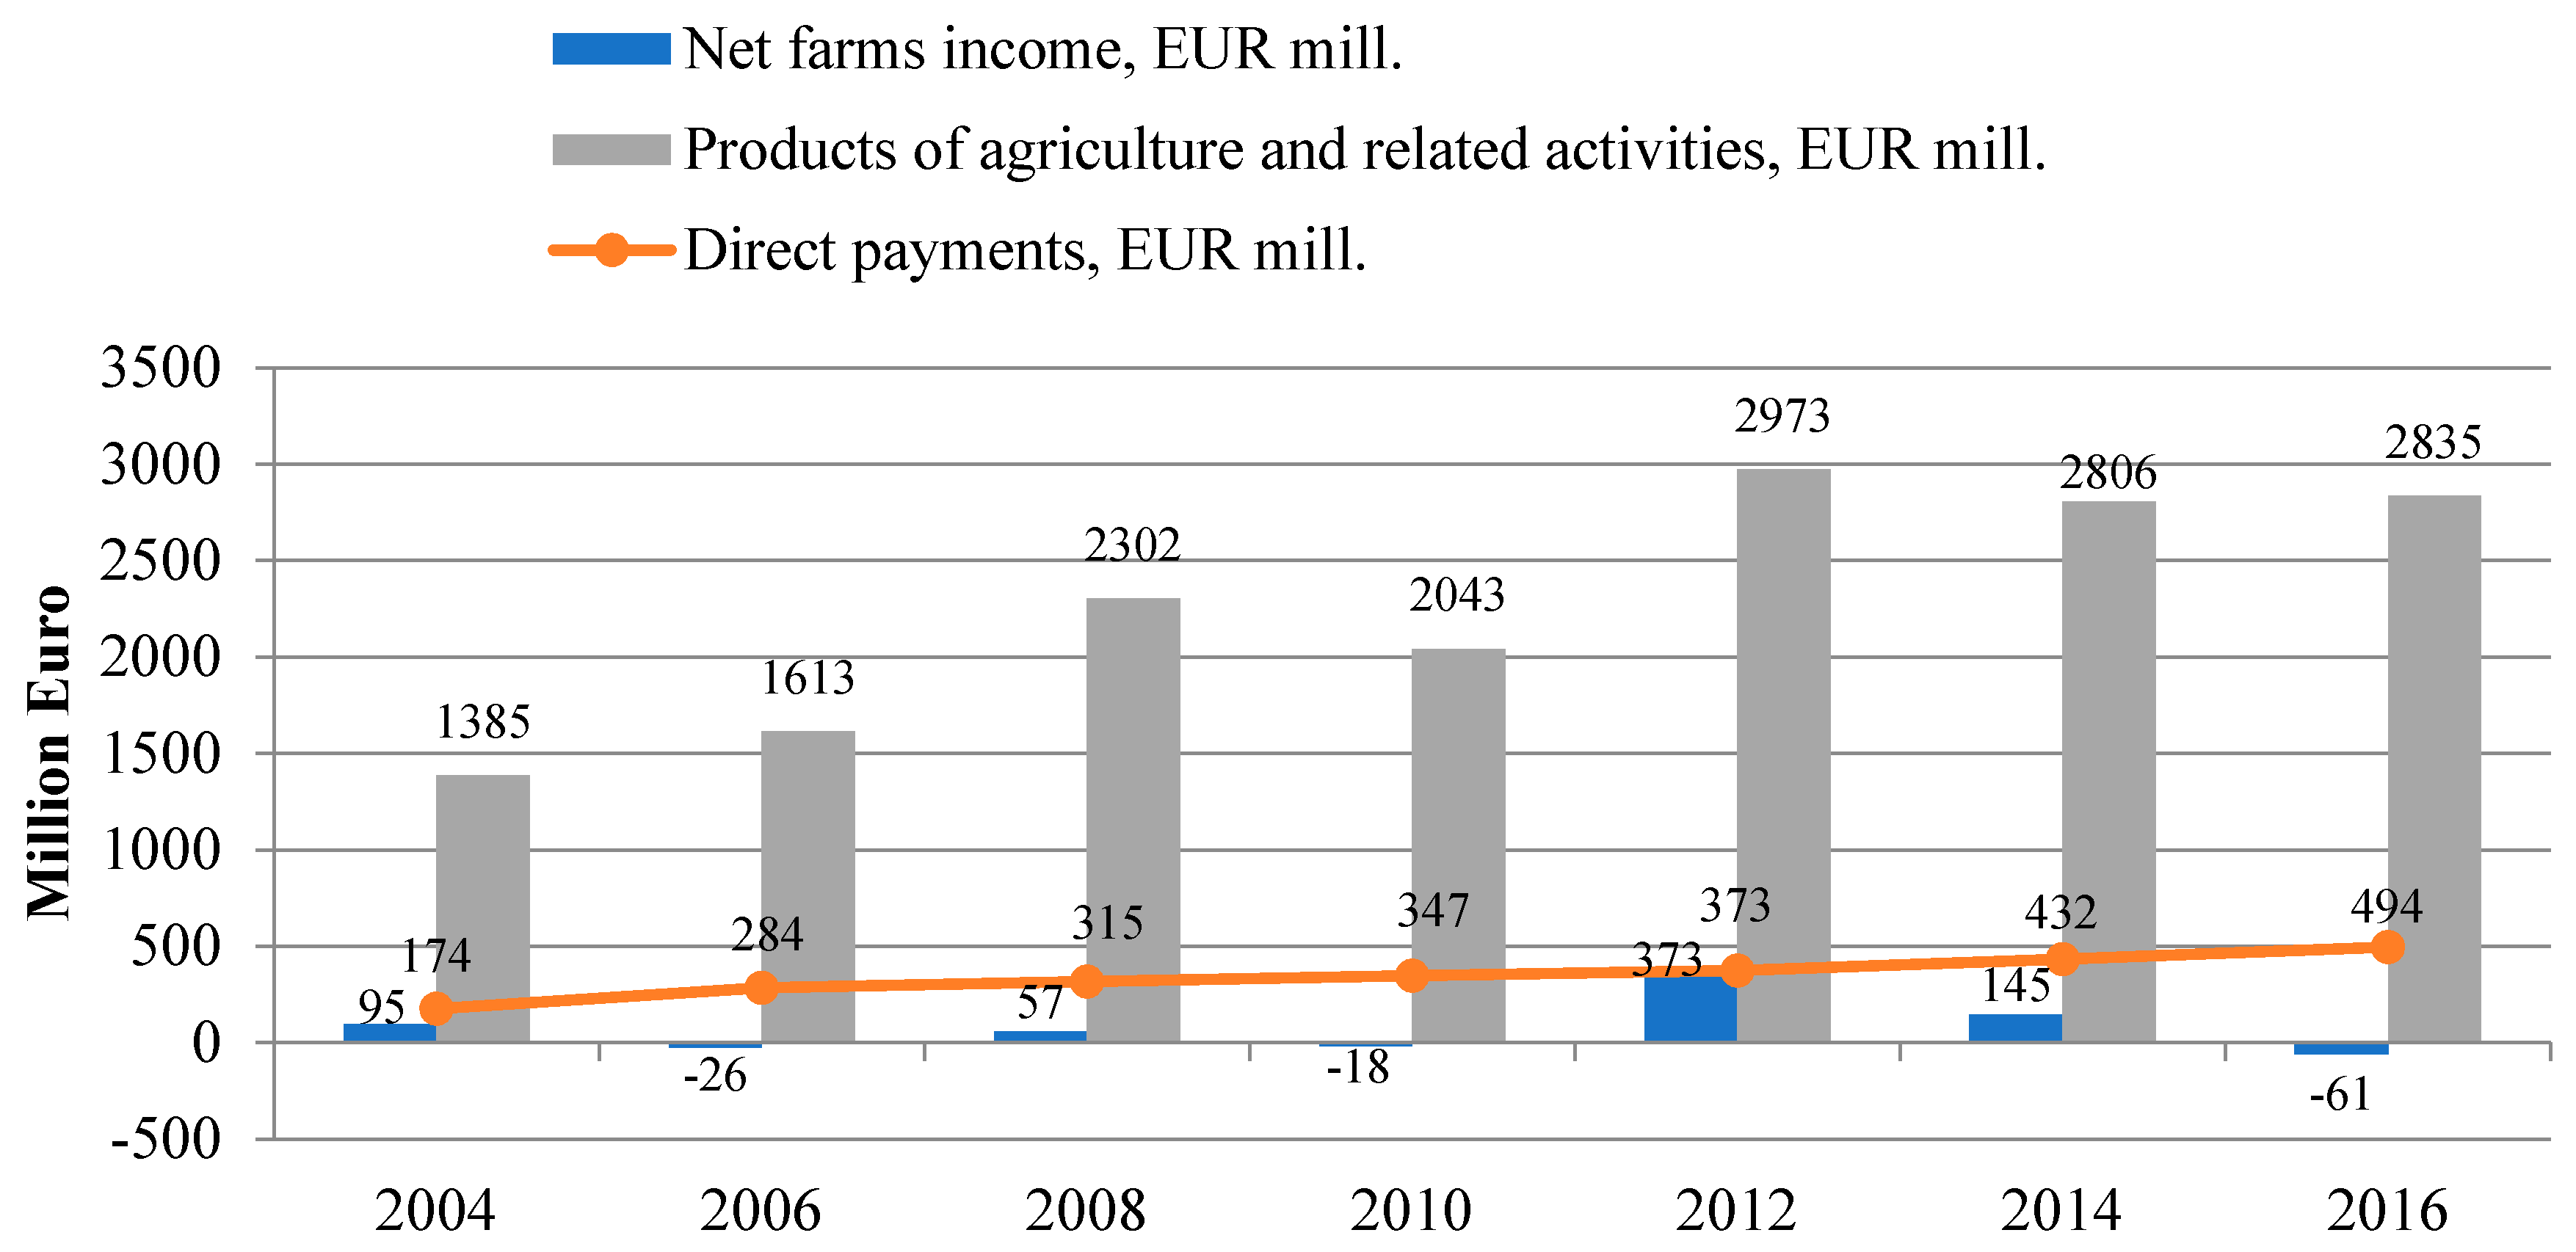
Despite its importance for the Lithuanian economy and society, the agricultural sector faces increased risk and financial volatility [
6]. Economic indicators, representing farming results in Lithuania (considering the period of 2004–2016) show that direct payments play a crucial role in maintaining the farm income (
Figure 1).
Income risk is an important consideration for small farms that dominate the farm structure in Lithuanian agriculture. In order to assess socioeconomical sustainability of the agricultural sector and the effects of the direct support, it is necessary to identify the relevant indicators. In this paper, we focus on family farms which comprise the most vulnerable sub-sector of the agricultural sector. This paper establishes a framework for multi-criteria assessment of the farm social sustainability. The impact of the CAP can be assessed by considering the outcomes of the multi-criteria evaluation. The case of Lithuania is chosen for the analysis.
2. Socioeconomic Sustainability of Farms in Lithuanian
Analyses based on the concept of sustainability often focus on environmental or economic sustainability. Recently, the notion of social sustainability has attracted more attention [
7]. Social sustainability is about the satisfaction of basic human needs and the provision of the right and the freedom to satisfy one’s aspirations for a better life [
8]. This applies as long as the fulfilment of one’s needs does not compromise the ability of others, or of future generations, to do the same. Thus, policies on economic use of natural resources require considerations to social values [
9].
Social sustainability in agriculture relates to society and its members, and the two main categories can be distinguished [
10]: (1) social sustainability that matters at the level of the farm community (related to the well-being of the farmers and their families); (2) social sustainability that matters at the level of society (related to society’s demands, depending on its values and concerns).
Early economic thoughts implied that economic sustainability is the concept that “current decisions should not damage the prospects for maintaining or improving living standards in the future. This implies that our economic systems should be managed so that we live on the dividend of our resources, maintaining and improving the asset base so that the generations that follow will be able to live equally well or better” [
11] (p. 10). It is obvious that economic sustainability was considered as an ability to maintain economic activities creating wealth without posing threats on the rights of the other economic agents. Accordingly, one can assume that economic sustainability is a phenomenon implying the smoothing of economic disparities. Without this, inequalities of wealth distribution may arise with time to the level at which further creation of wealth dampers possibilities of other persons to acquire wealth. Such a social standpoint in analyzing the economic sustainability can be found in broader specter of researches, especially in farming industry [
12]. The economic sustainability in agriculture refers to agricultural entities ability to maintain an economic viability for a long period of time contributing to social satisfaction of farmers, workers, other agents, communities, consumers and society [
13]. It becomes clear that in agriculture, economic and social sustainability concepts overlap and cannot be researched separately—thus, the concept of socioeconomic sustainability was introduced.
The successful application of both of the aforementioned sustainability concepts, called socioeconomic sustainability, helps to mitigate negative consequences of globalization, polarization of markets, preserve small businesses and cultural legacy, and assures relatively high standards of living. Correspondingly to the goals stated in CAP objectives, socioeconomic sustainability was chosen as a reference point to assess the effectiveness of DP financial support to small farms.
The importance of the small farms can be highlighted in different regards. According to International Fund for Agricultural Development [
14] and Otsuka, Liu and Yamauchi [
15], small farms’ competitive advantages over large commercial farms lie principally in their low transaction costs in accessing and supervising motivated family labour and in their intensive local knowledge. However, it is noticed that their small scale leads to high transaction costs per output unit in almost all non-labour transactions (in accessing capital, market and technical information, input and output markets, and in providing product traceability and quality assurance).
Thus, the concept of small farms can be considered in various dimensions. Small agricultural farms, however, not always appropriate, are used as an alternative to small-scale, smallholder, family, subsistence, resource-poor, low-income, low-input, or low-technology farming [
16]. The World Bank’s Rural Strategy defines smallholders as those with a low asset base and operating less than two hectares of cropland [
17]. According to Food and Agriculture Organization (FAO) smallholders are defined as farmers with “limited resource endowments, relative to other farmers in the sector” [
18]. Narayanan and Gulati [
19] defined a smallholder “as a farmer (crop or livestock) practicing a mix of commercial and subsistence production or either, where the family provides the majority of labour and the farm provides the principal source of income”. Thus, the depth of the problem is also determined by the fact that there is no clear cut-off and methodology for determining the boundaries between small-, medium- and large-scale farms [
20].
There have been different criteria the literature used in for establishing the definition of a small farm. These can be grouped into several main groups [
21,
22,
23]: physical criteria (utilized agricultural area or labour input in annual working units); market criteria (the share of production consumed on-farm; sales revenue); economic criteria (economic size or standard output); or combined criteria covering two or more of the abovementioned indicators.
Utilized agricultural area (UAA) is one of the most common criteria for distinguishing between small and the other farms applied in economic analysis. Small farms are often defined as those having less than 2 ha, 5 ha [
21,
23], or 10 ha of UAA [
23]. Besides the aforementioned absolute thresholds, the relative one corresponding to the 10th percentile of the declared UAA [
23] can be applied. However, these definitions are often misleading as they do not take account for differences that exist among countries and farm types. Indeed, farms of the same size can differ in their specialization and income [
23]. Small-sized farms can also be defined in terms of economic viability (expressed as farm income). The latter criterion may be combined with the UAA [
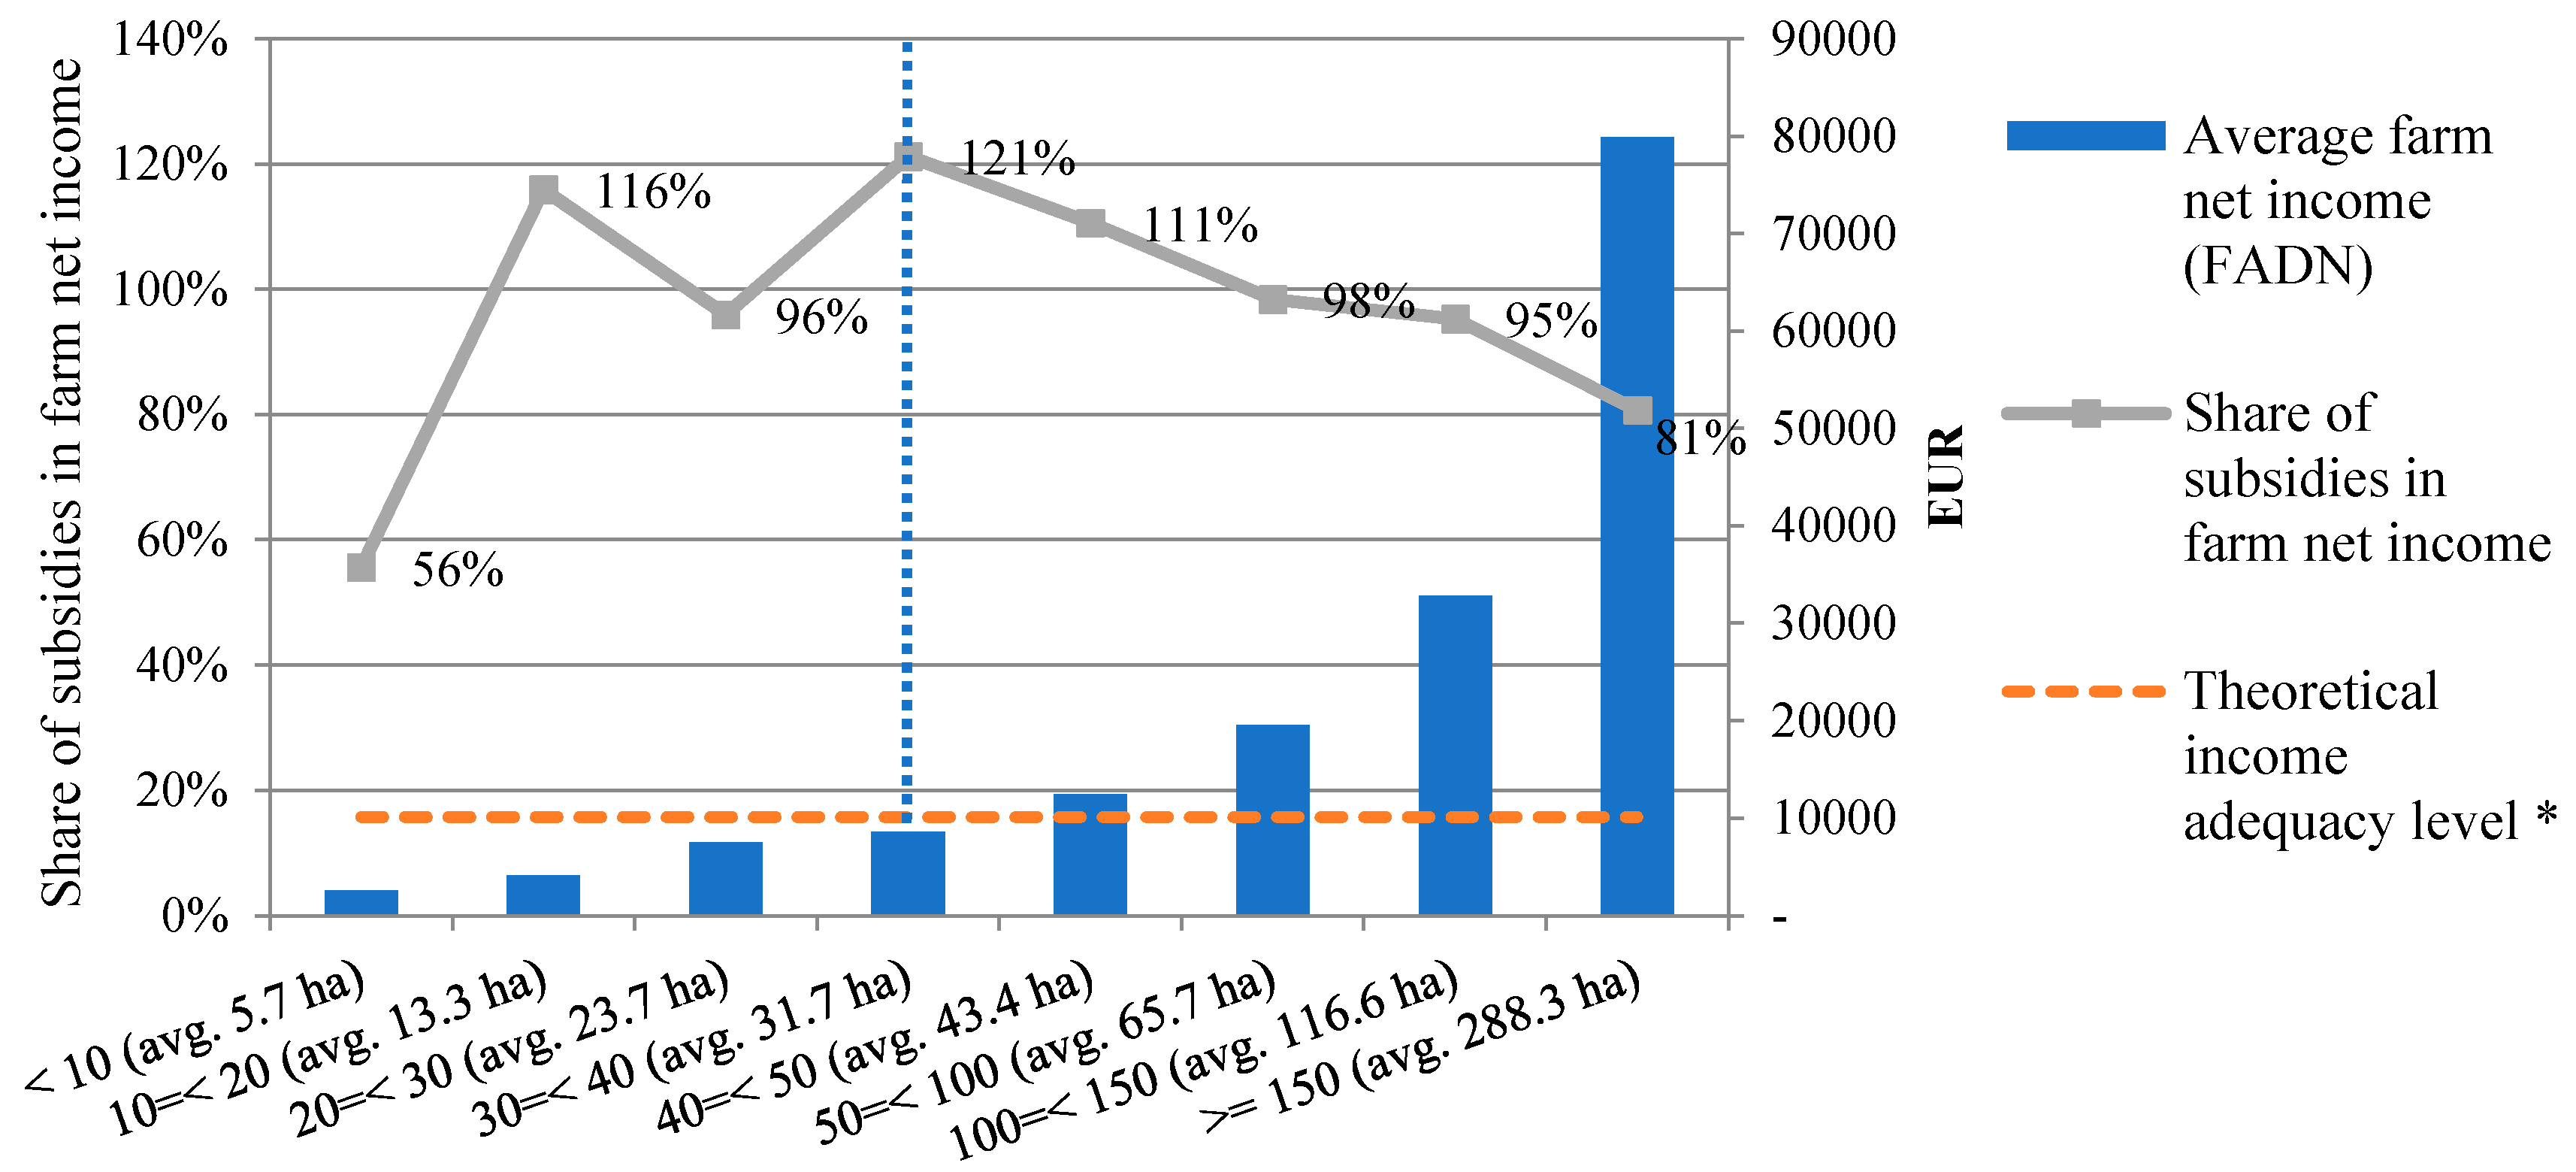
21]. In general, small-scale farming is associated with lower opportunities to generate income from agricultural activities, i.e., small-scale farms may equate to low-income farms (and farmers). To address these issues, the EC launched an additional payment (redistributive payments) in 2013 for the first 30 ha of the UAA (Regulation of the EU No 1307/2013. Taking into account the need for the unified support for farmers on small holdings in order to achieve the objective of income support effectiveness, from 2014 onwards, EU member states are allowed to redistribute direct support among farmers by granting them an extra payment for the first 30 hectares or the average size of agricultural holdings (Regulation of the EU No. 1307/2013). Therefore, farms under 30 ha are assumed to have relatively low viability and are considered small-size ones in economic terms. The Lithuanian case also supports this hypothesis (
Figure 2).
Figure 2 exploits farm income level and structure to show that farms below 30 ha highly depend on CAP subsidies (based on the FADN sample). What is more, the income level of these farms falls below the theoretical level required to meet the income of the two persons engaged in agricultural activities based on the labour statistics by Statistics Lithuania. Therefore, farms below 30 ha can be considered as small holdings in comparison with the other family farms in the FADN sample or the average income generated in the agricultural sector of Lithuania in general. In regards to typology, most of these farms are mixed (various crops and livestock combined), grazing livestock or horticulture farms.
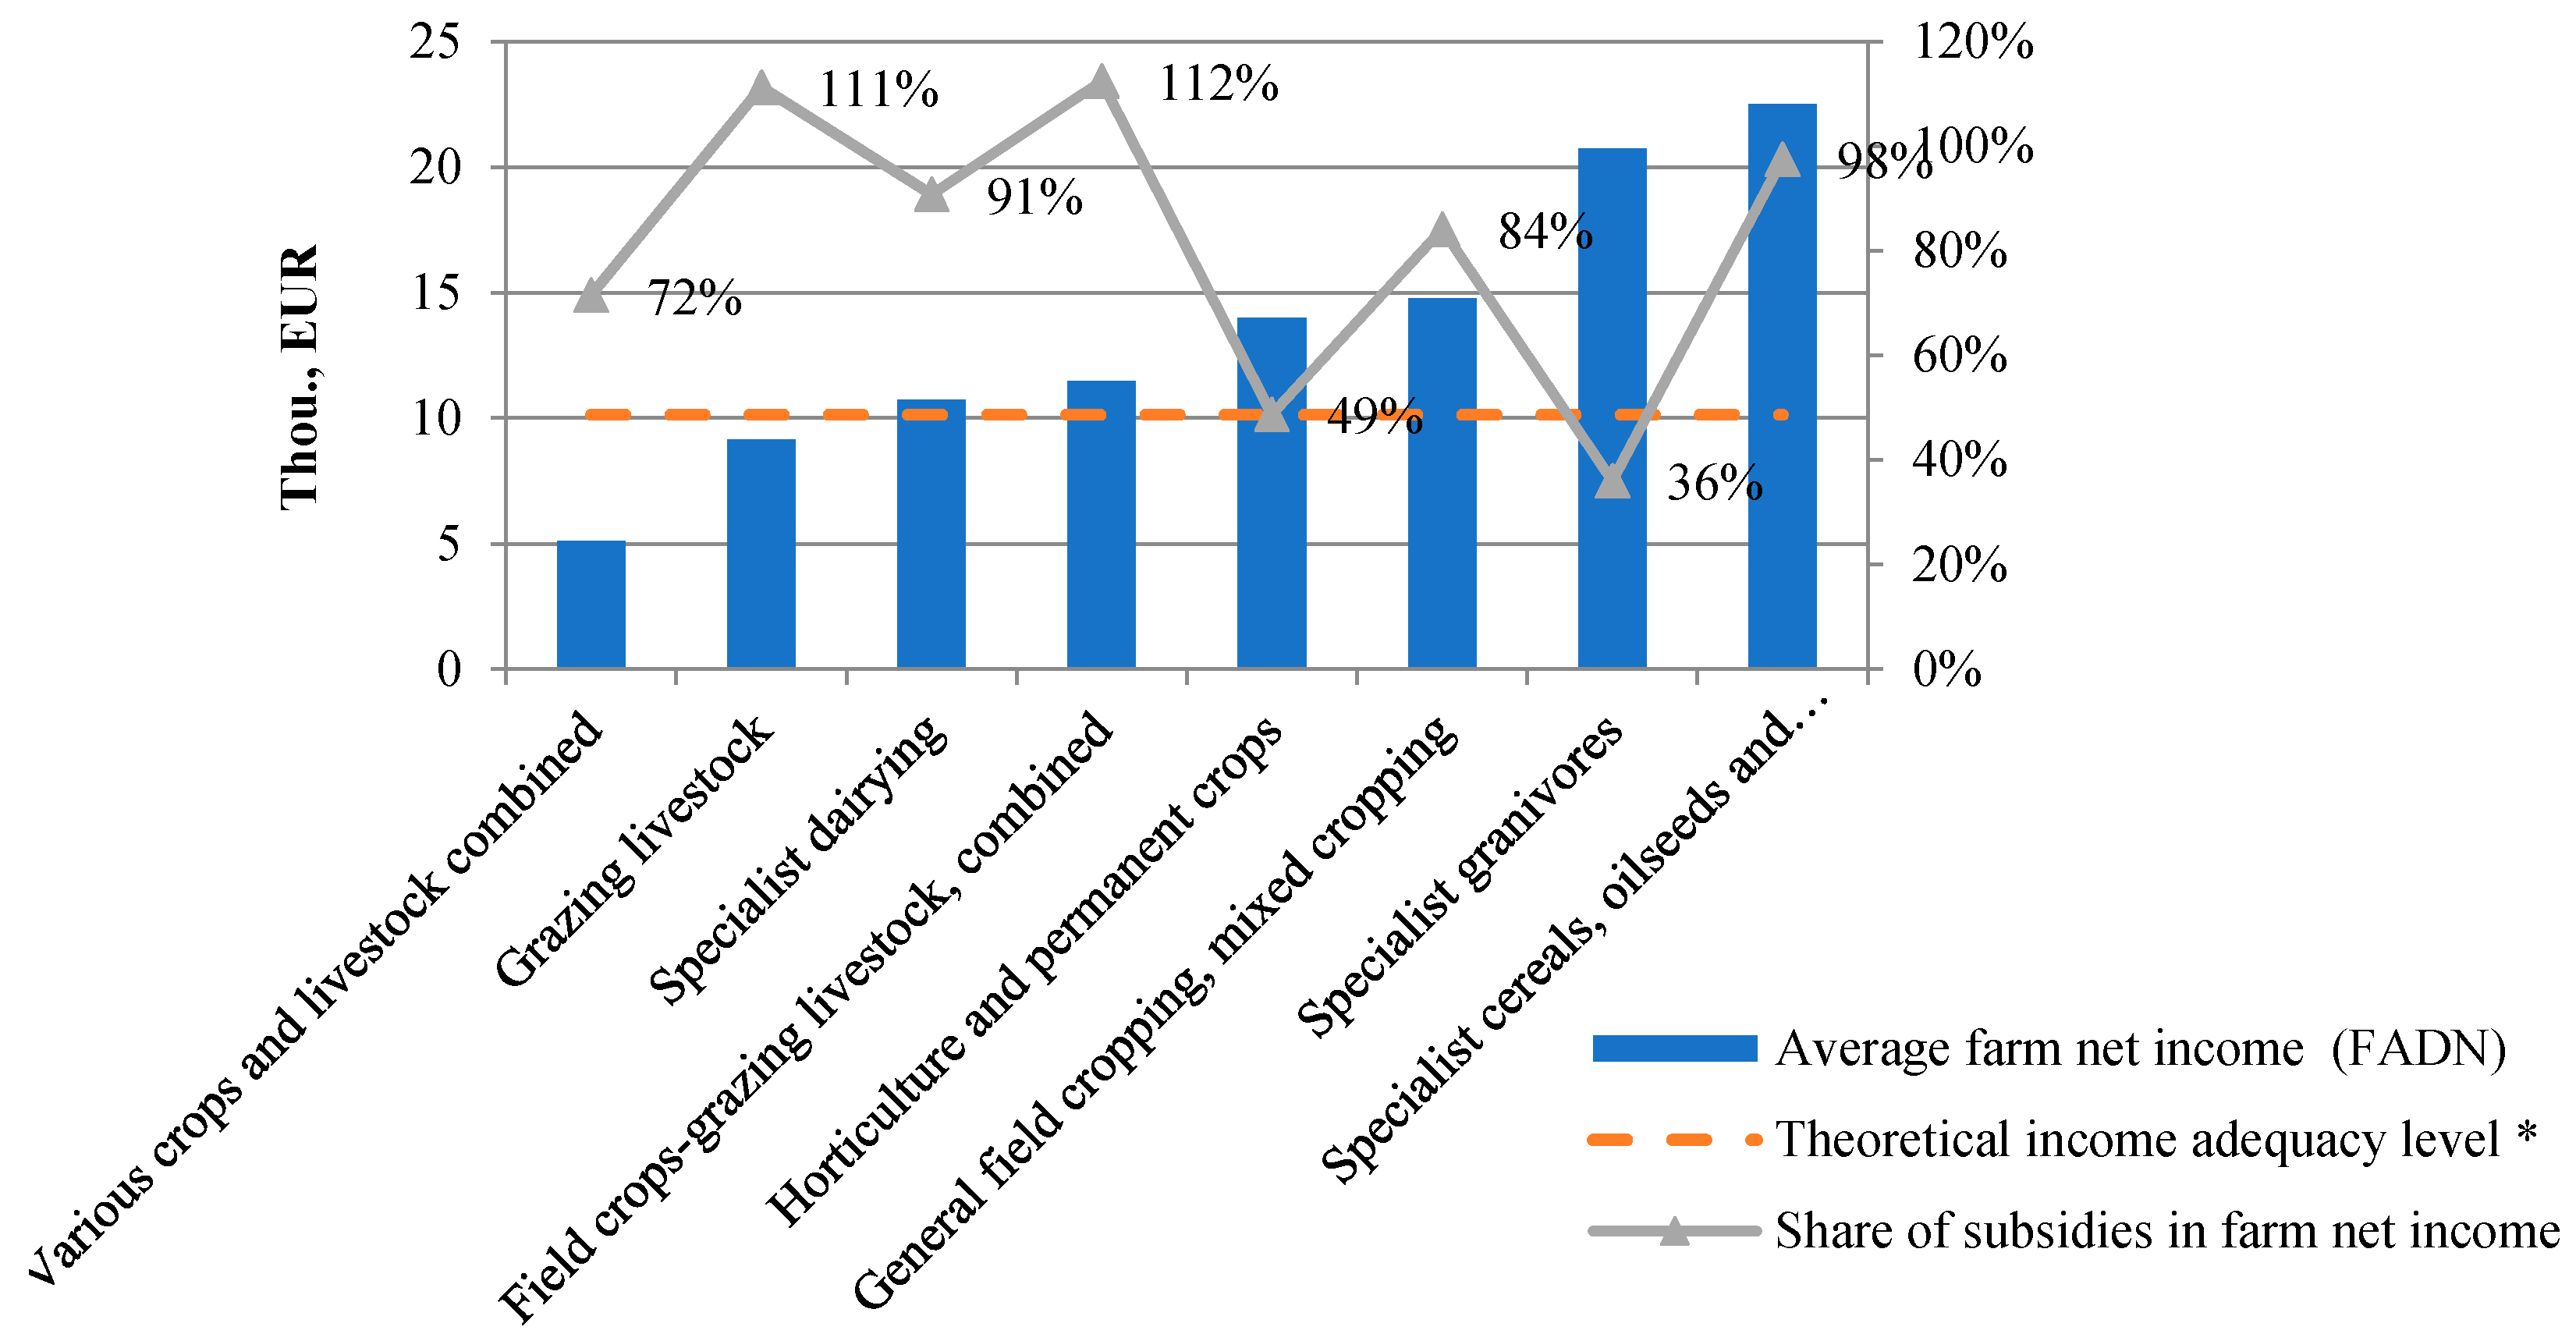
Figure 3 shows the average farm income level in Lithuania across different farm types for 2010–2016 (including all farms in Lithuania according to FADN). The lowest income levels are observed for various crops and livestock combined, grazing livestock farms. The UAA in these farms is small, ranging from 17 to 25 ha. It is these farms that fall below the viability threshold (the theoretical income adequacy level) and should be prioritized in the sense of support.
According to Valdés and Foster [
24], there has been a long history in economic development with regards to the roles of various sectors in development and the choice of strategic sectors for development. One of the most discouraging case is a domestic and global dynamic economy driver, which changes in the structure of agricultural production but does not provide opportunities for low-income farmers, who remain as small farmers without being able to take advantage of nonfarm employment opportunities (for geographic, demographic, and cultural reasons and because of labor market restrictions).
Implementation of various types of agricultural policies to support the economic and social development of small farmers proved to be a particularly successful strategy to reduce rural poverty, migration from rural areas and social conflict among large and small-scale farmers [
25], although it should be mentioned that DP does not eradicate all preconditions for social conflicts of this type, as financial support is directly proportional to the number of land owned, it leads to a situation where larger farmers get bigger volumes of financial injections.
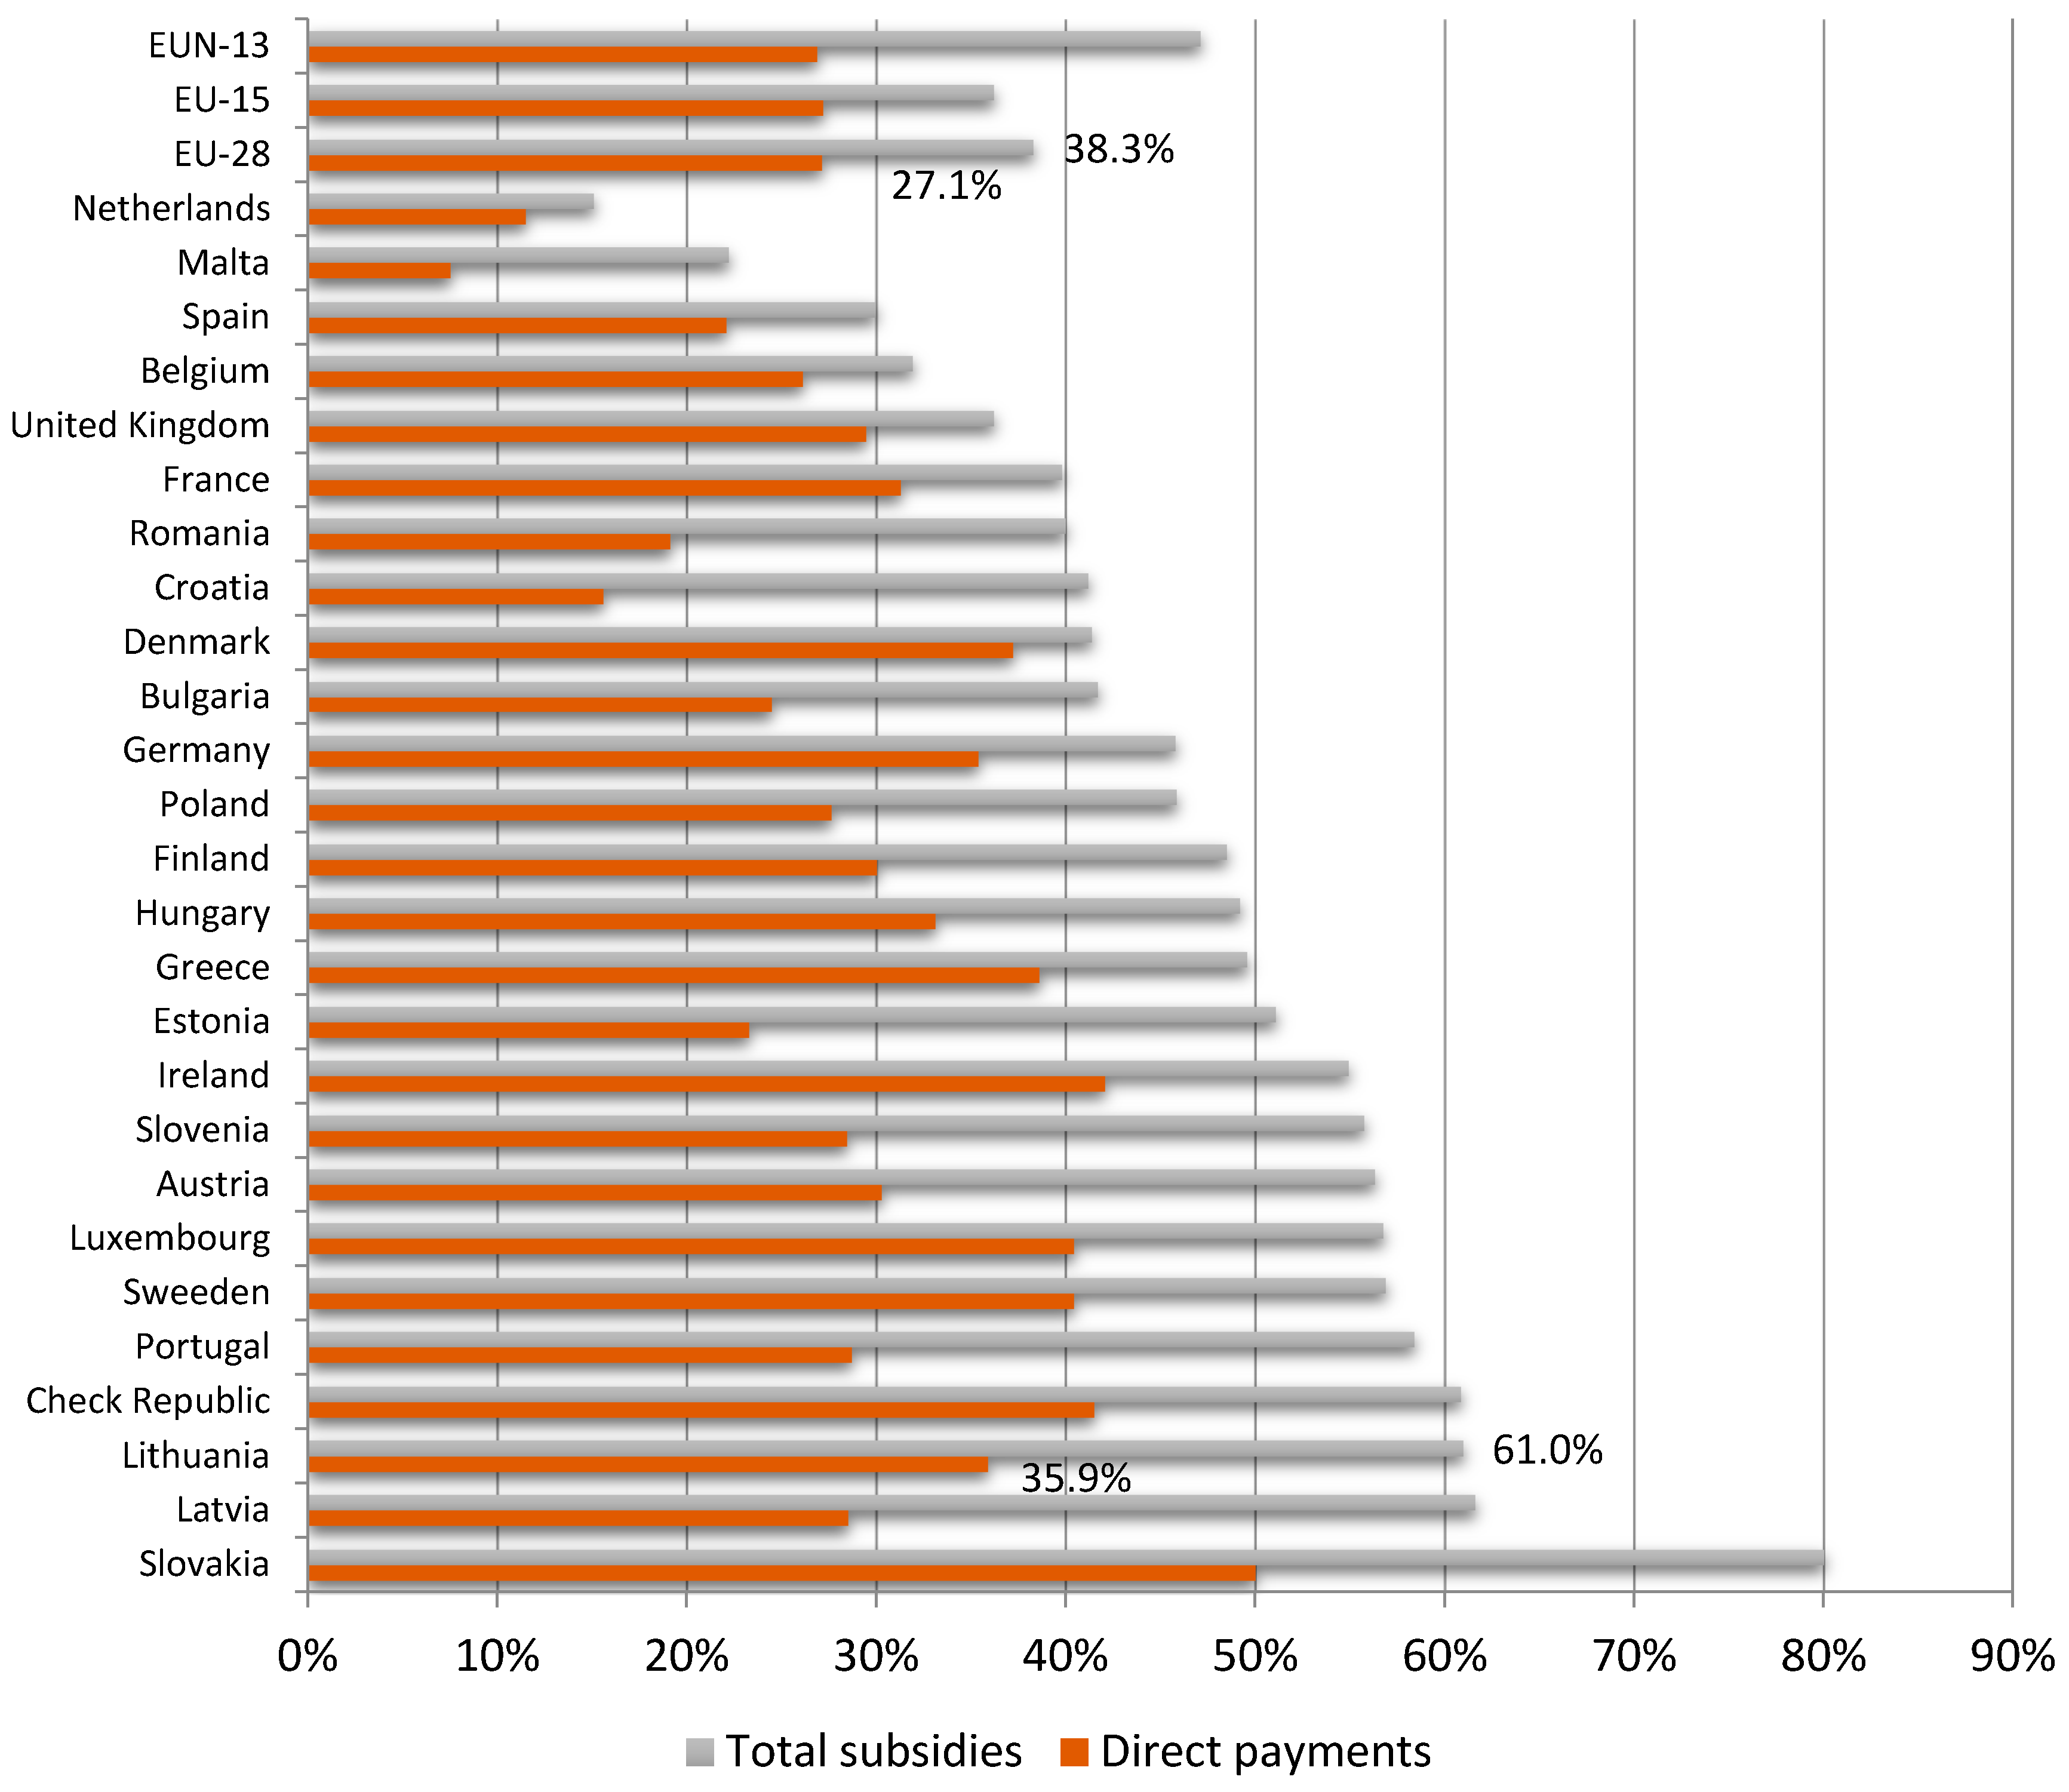
Although earlier studies have examined the CAP’s impact on the economic and social development of small and medium-sized farms [
26], the CAP direct payment system has not been considered in the context of its impact on the social sustainability. Direct payments system has a decisive influence on the level of farms income (
Figure 4) and therefore one of the main aspects of viability and socioeconomical sustainability.
The data in
Figure 4 indicate the level of dependence on direct payments and total CAP subsidies across the EU Member States. An especially strong dependency occurs in such countries as Slovakia, Latvia, Lithuania and the Czech Republic. Over 60% of the aforementioned countries’ farm incomes are covered by CAP support. Small-scale farms are even more vulnerable and more economically sensitive to the fluctuations in the level of income and insufficient financial support have a particularly strong influence on their decision to change the farming type or abandon the agricultural activity [
28].
It is also worth mentioning that in 2011, the EC presented a proposal to the European Parliament and to the Council on regulation for establishing rules for direct payments to farmers under support schemes within the framework of the CAP (COM/2011/0625 final—2011/0280 (COD)). Part of the DP system’s schemes remained unchanged including support for younger farmers and small farms and, therefore, at the end of 2012, the publicly presented proposal for the guidelines of new CAP measures induced adjustment actions by the farmers. Specifically, Lithuanian farmers responded to changes in policy rather rapidly by embarking on splitting of farms (for redistribution payments) and passing farms over to their descendants (for the scheme of young farmers). All in all, both small and young farmers felt the motivation and opportunity to stay in farming.
Analysing the impact of the direct payments system on the sustainability of agriculture, it was found that its impact on the social sustainability of small farms could be assessed in a number of ways: by indicators and indices, by product-specific assessment methods and by integrated assessment [
29]. Indicators and indices are distinguished from other evaluation tools as they allow to quantitative measurement of such complex phenomenon. It is being emphasized that unlike most environmental and economic indicators, many social indicators are qualitative, they are difficult to quantify as they are often subjective. Nevertheless, in order to quantify changes in dynamics, monitor progress towards sustainable development, indicators and indices are one of the best assessment tools [
30] for measuring the impact of DP system on the social sustainability of small farms.
3. Assessment of the Impact on the Social Sustainability of Small Farms
The period covered in this paper coincides with integration of the concept of sustainability into the CAP and the direct payments system. Indeed, it coincided with the large-scale enlargement of the EU. Thus, we set the starting point as year of 2004. In terms of data availability, year 2016 marks the end of the research period.
Taking into account the definitions of small-scale farming used in recent scientific papers, and its relevance to policy measures, size by area plot (in accordance with farm net income) was selected to define a small farm in this research. It was important to select such farms that produce agricultural goods not only for their own purposes (subsistence farming), but to which farming activity is the main source of income. According to the definition of small farms provided in the EU regulation (up to 30 ha) and income level of Lithuanian farms (
Figure 2 suggests 31.8 ha), we look at the performance of farms with less than 30 ha UAA when evaluating the impacts of the DP system on the social sustainability of small farm in Lithuania.
According to principles stipulated by the EU Regulation No. 1307/2013 (up to 30 ha), 88.2% of Lithuanian farms fall into the class of small farms (see
Table 1). Thus, our analysis is related to vast majority of Lithuanian farms. However, according to 2016 statistics on farms declaring UAA for direct payments, small farms use only 28.6% of the total national UAA. Moreover, these farms provide employment to an important share of the population under economic crisis. From 2014 onwards, small farms may participate in DP system’s redistributive scheme and, from 2015 onwards, in young farmer scheme under EU Regulation No. 1307/2013. These measures are expected to contribute to the socioeconomic sustainability of small farms.
Turning to the demographic characteristics of holders of small farms in Lithuania, one can note that the shares of women and men were 50.1% and 49.9% respectively as of 2016. This is a result of the fact that small farms in Lithuania are typically run by family members. Indeed, this gender balance corresponds to that in the cohort of population under the age of 65 years (a threshold determining the possibility to retire) at the national level. This healthy gender distribution may have also been impacted by the DP system. Before the accession to EU, agriculture would often be perceived seen as men‘s business leaving women underemployed in rural regions where agriculture is a major economic activity. For comparison, the shares of genders in 2005 were 58% and 42% for men and women respectively [
31]. This suggests the possible positive impact of DP on the social sustainability of rural regions in Lithuania and, particularly, small farms. As regards the share of migrant workers, small farm sector mostly employs Lithuanian citizens, whereas foreign labor force typically concentrates in large (corporate) farms and, to a much higher extent, in the other sectors of the economy (construction and transport sectors) [
32].
The selection of social sustainability indicators was carried out in two stages. Abridged list of key social indicators for measuring agricultural social progress based on the “sustainability assessment of food and agriculture systems” framework [
33]. A total of 16 indicators of social sustainability were selected. In the second stage, an expert survey was carried out, where 10 experts, working in a Ministry of Agriculture of Lithuanian Republic and in two leading Lithuanian universities associated with agricultural economics decided which of the above indicators the DP system impacted when valuating farms up to 30 ha. The choice of the number of experts was made based on the assumption that the reliability of the aggregate ratings and the number of decision-makers (experts) is related by an exponentially decreasing curve [
34]. The experts involved in the survey have at least three years of experience in the analysis of the effects of the first pillar of the CAP (DP and market regulation). The five main indicators influencing the socioeconomic sustainability of small farms were selected in this way. The main aspect of socioeconomic sustainability—the vulnerability of households—was identified by experts and linked with three indicators: the ratio of farm net income per annual working unit (including DP) to average wages in the country (RA); the ratio of farm non-agricultural income and total farm income (R); employed in agriculture (EA). Experts also stressed the importance of age of farmers (AF) and local food supply (LFS) indicators’ importance for measuring small farms sustainability.
The aggregate Farm Accountancy Data Network (FADN) data were used to calculate RA, R and AF indicators for 2004–2016. The data from Lithuanian Statistics were used for constructing LFS and EA indicators. The aggregate data of all types of Lithuanian family farms less than 30 ha were included in the analysis.
AF’s relationship with social sustainability and DP is being examined from the ongoing process of EU farmers aging [
35]. This phenomenon causes a wide range of socioeconomic problems. First, older persons become less active and participative, paying less attention to community issues. Secondly, they are not able to carry intensive physical work, which is necessary in farming. The latter issue becomes especially acute in small farms. It is typically related to deteriorating health. Indeed, this process can be mitigated in case people start paying more attention to their health and follow more healthy work regime. In order to allow older generation farmers to pay more attention to their life quality, a part of DP is allocated to supporting the younger generation of farmers (up to 35 years old) in order to encourage younger generation—which is more flexible, receptive to innovation, energetic to take over their parents’ business, and keeping the older generation in business too, as their experience, long accumulated knowledge and participation in those activities are invaluable. In addition, the free time of the older generation helps them participate in local community’s events, preserve tradition and etc.
LFS is important to social sustainability not only from the macro perspective (food security of the country), but also from the micro social standpoint. Traditionally, local food has been strongly associated with traditional habits and cultural identity [
36]. Thus, by maintaining the production of local food, countries are able to preserve their culture. It is especially relevant to rural communities, which have been considered as the source of the cultural heritage. Traditions and community lifestyle contribute to increase in the social capital, which, in turn, improves social sustainability.
As regards
R indicator, farmers are vulnerable when they do not have any other income accept from farming [
33]. This idea is being underscored by other scholars who emphasize not only the policy, but also the responsibility of the farmers for the level of income received, the promotion of diversification of agricultural activity [
20,
37].
Turning to the
RA indicator, empirical studies show that the separate payment schemes of the direct payments system (for example: coupled support, redistributive payments, young farmers’ payments, etc.) impacts the choice of farmers to engage in some form of agricultural activity especially in those countries where hectare payments (not entitlements) are being paid. Farmers’ choice or change in agricultural activity and area determine the need for a number of employees according to these choices. Therefore, it is very likely that employment in agriculture is an indicator of the impact of the DP system. Given the change in the number of employees and the fact that direct payments reach up to 50% of income level, the farm income per working unit also depends on the DP system’s elements change. Empirical studies show that the DP system influences the standard of living, income inequality, as one of the criteria for social sustainability [
38]. In order to assess the impact of the DP system on social protection and the standard of living the ratio of net or gross profit (incl. DP) per working unit to average wages in the country is widely used [
38].
The
EA indicator is justified by the fact that the impact of the DP system on the employment level in the context of socioeconomic sustainability is represented by the equitable distribution of the direct payments among different farm sizes or different farm types [
39]. In assessing socioeconomic sustainability it is important to pay attention to main attributes of these two aspects of sustainability. Employment, as a focal point of social sustainability, has been acknowledged in the literature. The importance of employment in the sense of various social sustainability concepts was documented by Vallance, Perkins and Dixon [
40], Zahm et al. [
41]. Employment was considered as an important dimension of social sustainability by Suopajärvi et al. [
42] and Tiainen [
43]. Azapagic, Stamford, Youds & Barteczko-Hibbert [
44] integrated economic, environmental and social sustainability and found employment as an integral part of social sustainability dimension. Motivated by these researches, we also included employment into our research of the socioeconomic sustainability of small farms.
There exists a possibility that increasing employment in agricultural sector may push an economy from equilibrium in case labour productivity in agriculture is lower than that in the other sectors. These relationships should also be taken into account in the long run. In this paper, we focus on the social dimension of sustainability which is primarily related to growth of the economically viable rural population.
Although the agricultural sector is criticized for undeclared work [
45] and low labor productivity [
46], it remains an important employer in the developing world and a major one in rural regions in developed countries [
47]. Higher employment levels not only allow maintaining competitive labor force in the rural regions, but also create demand for other economic sectors there. Thus, agricultural sector allowing for higher employment and labor productivity may contribute to economic viability of the regions where industrial development is not economically sound. The
EA indicator is calculated on the basis of the FADN data for 2004–2016. The average number of hours worked (hired and family labour included) on farms smaller than 30 ha is considered.
Following the suggestions by the experts, the impact of the DP system may be measured in terms of the local food security (LFS, which is defined as the self-sufficiency ratio of production quantity to domestic consumption quantity) as direct payments, applied both prior to and after 2013, are partly coupled to the specific products. Thus, according to experts, the distribution of support may impact the LFS. This idea was supported by 8 out of 10 experts. The LFS indicator for Lithuanian agricultural products was calculated as follows:
where
and
are the volumes of imports of crop and agricultural products, respectively, necessary to satisfy the domestic demand and
and
are the domestic consumption volumes of the crop and livestock products, respectively. The quantity data come from Statistics Lithuania, whereas the price data come from FADN.
Moreover, 7 out of 10 experts mentioned the inclusion of farmers’ age (AF) indicator to the list. On the one hand, this indicator appeared to be very distant from the impact of DP. On the other, according to DP system regulations (EU Regulation No. 1307/2013) presented from 2014, the creation and development of new economic activity in the agricultural sector by young farmers is financially challenging and constitutes an element that should be considered in the allocation and targeting of direct payments. According to the survey of young farmers conducted by the Lithuanian Institute of Agrarian Economics, it was found that young farmers’ payments scheme was an incentive not only to continue agricultural activity but also to stay in the countryside. Such a decision was determined both by the fact of receiving the support and by the information published in 2013 that such support measure is mandatory and will be implemented at the state level.
4. Multi-Criteria Framework
In order to quantify the impact of the DP system on the socioeconomic sustainability of small farms, the multi-criteria analysis is applied. In order to determine the weighting scheme, the expert evaluation is carried out.
The indicators weights of the ten experts were calculated according to the formulas [
48]:
where
cik (
i = 1, …,
m;
k = 1, …,
r) are experts evaluations with
m = 5 being the number of indicators and
r = 10 being the number of experts.
In order to check if the expert opinions are statistically consistent, the compatibility of experts answers were verified using the Kendall concordance coefficient [
49]:
where
is the overall mean
, that is calculated according to the formula:
The concordance coefficient is defined as the ratio of the calculated
S and
Smax for the 10 experts [
49]:
The TOPSIS (
Technique for Order Preference by Similarity to an Ideal Solution) method was chosen for combining the indicators into the composite indicator. This method is one of the multi-criteria methods, which has a profound theoretical and practical meaning. The basic principle of this method is that from all the alternatives (in our case –years) the one having the shortest distance to the positive ideal point and the longest distance to the negative ideal point is selected [
48].
The TOPSIS method normalizes the initial data and relies on the distance between two ideal points. The vector normalization is carried out as follows [
49]:
where
represents the
ith indicator for the
jth alternative after the normalization.
After the normalization of values, the ideal solution
V* is preliminarily selected, i.e., the maximum value of each maximizing indicator (multiplied by the corresponding weights
) was selected, and the minimum value of the minimizing. The ideal solution
V* is calculated according to the formulas [
48]:
The anti-ideal solution
is calculated by formula [
48]:
Here I1 is a set of benefit indicators and I2 is a set of cost indicators, —the weight of the ith indicator.
Then, the total distance
of each comparative solution (i.e., the values of the indicators for 2004–2016) to the best solutions
V* and the distance
to the worst solutions
was calculated according to the formulas [
48]:
The result of the calculations following the TOPSIS is the composite indicator
—in our case, we seek to measure the impact of the DP system on the social sustainability of small farms by considering the latter composite indicator. The resulting composite indicator is obtained as follows [
48]:
The resulting values are dimensionless numbers ranging in between 0 and 1, i.e., a higher value of the composite indicator reflects a greater positive impact of the DP system on the social sustainability of small farms in a given year.
5. Results and Discussion
The selected indicators for assessing the impact of the DP system on the social sustainability of small farms were divided into maximizing and minimizing, thus determining which indicator has a greater negative or positive effect on the socioeconomic sustainability of the mentioned farms and based on the results of the survey of experts in Lithuania, the indicators’ weights
were determined (
Table 2).
Four of the five indicators are of maximizing nature, which means, that their higher values determine a greater positive impact of the DP system on the socioeconomic sustainability of small farms. According to the expert evaluation on the indicators, they were ranked: the most significant indicator is the ratio of farm net income to the average wage in the country (ω = 0.32); the lowest was the ratio of farm income and total other farm income (ω = 0.09).
The compatibility of expert opinions was verified by the concordance coefficient. It was found that the opinions were matched, as the concordance coefficient is very close to 1:
The interdependency among the variables was verified by a correlation analysis (
Table 3).
Despite the strong correlation between EA and AF, and AF and RAiw, the indicators do not interfere with each other in general. Therefore, their validity is sufficient to use for establishing the composite indicator. In addition, the correlation matrix includes direct payments in different years, in order to determine their interaction with selected indicators. This shows that although the correlation coefficients are high, this does not mean that the indicators should be rejected as they are not of the same socioeconomic nature. It also has been noticed that their correlation with indicators is not unambiguous. Increasing financing of DP for small farms led to the possibility of using more innovative solutions in farming activities, to minimize the labor force, the acquisition of new equipment and tools, and thus a negative correlation with EA indicator. Another interesting correlation link is between DP and RAiw, which is also negative, and shows that the growing proportion of DP in small farms is inadequate, not able to maintain a level of income per annual working unit in relation to the average wage in the country.
In order to calculate TOPSIS-based indicators’ estimates the weighted normalized values
were used (
Table 4).
By considering the normalized values, the best and worst vectors and the distances to them were calculated. The TOPSIS-based values relying on the selected indicators were obtained (
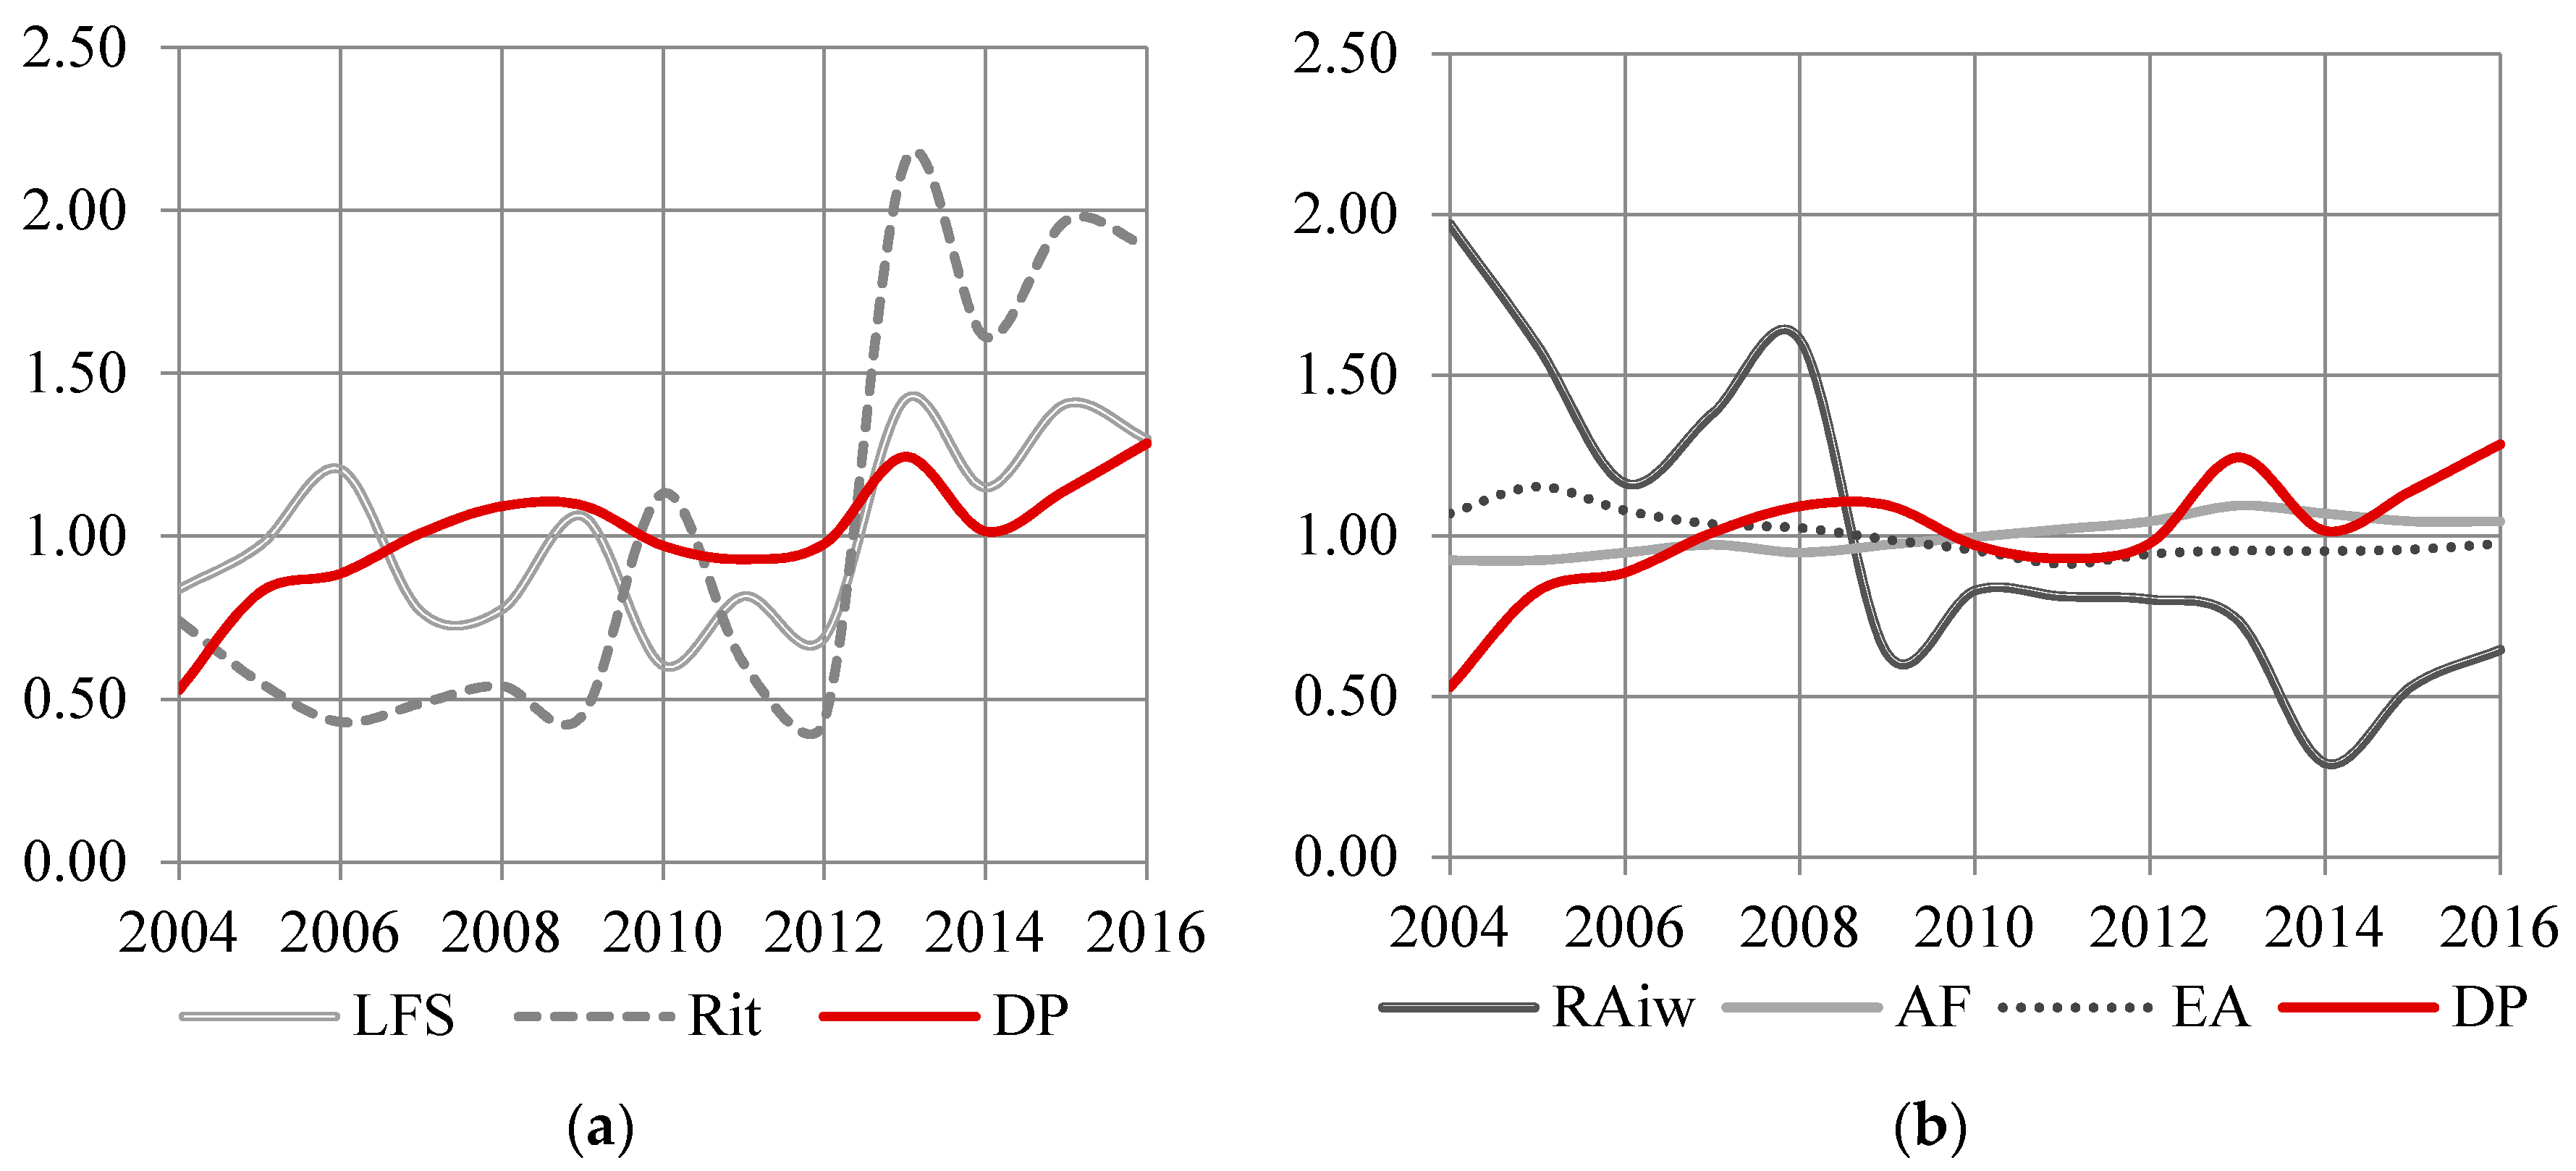
Figure 5). A more detailed analysis of the indicators allowed establishing dynamic relationships between time series and changes in the values of the indicators.
Figure 5 shows that the indicators linked to small-farm income fluctuate the most with respect to the average values, i.e., the ratio of farm net income per annual working unit to average wages in the country (RA) and the ratio of farm income and total other farm income (R). As regards the RA indicator, it fluctuated prior to the year 2009 and remained below the average value afterwards. This indicates insufficient level of the DP to mitigate the effects of crisis, which, in turn, encouraged the diversification of the income of small farms. Consequently, R remained above its average values following year 2010. It is worth mentioning, that crisis of 2009 affected Lithuania rather severely, as GDP level dropped by 14.8%, inflation rose to 4.2% (second highest level in the EU), and unemployment level reached 17.8% [
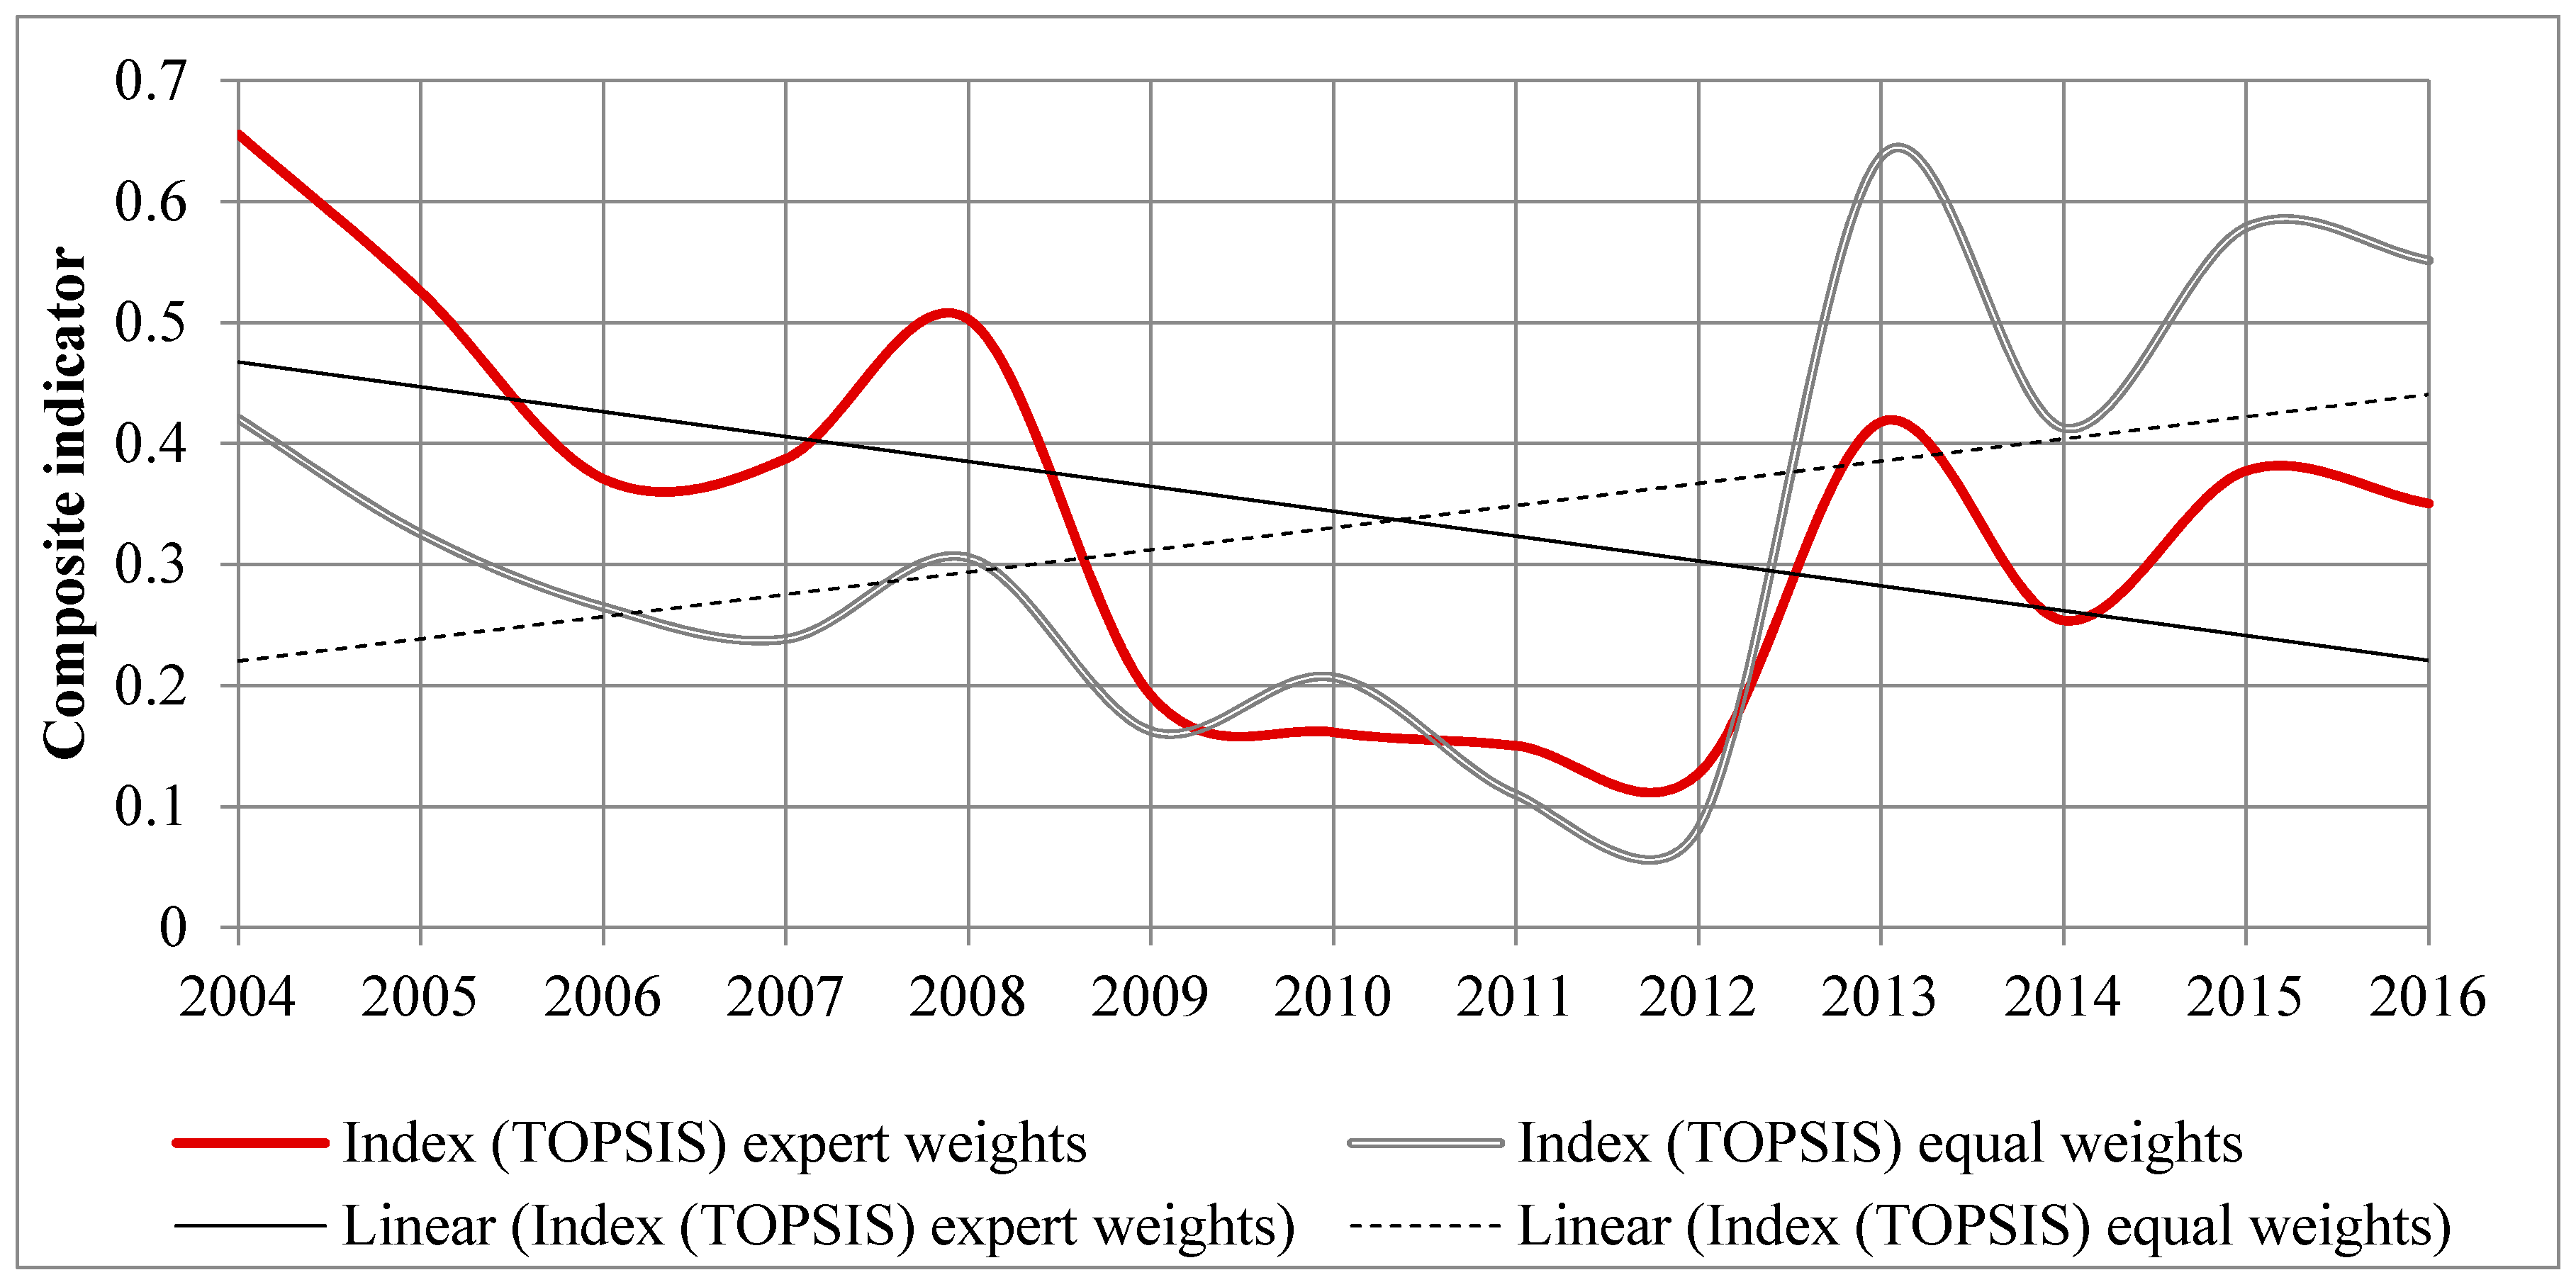
50]. It brought also structural changes, whose consequences are still felt by the agricultural sector. The relative share of food processing sector dropped from 5.52% to 4.47% indicating not only lower consumption, but also decreasing prices for food products, what, in turn, were reflected by the pressure on the prices for agriculture products lowering the income levels of farmers, and especially small farms, who have the lower bargaining position compared to food processing companies or retailers. Although the system of direct payments had to address the socioeconomic sustainability of small farmers, it can be seen that it was difficult to achieve in the case of Lithuania. Such results are also supported by the composite indicator, which values are calculated based on expert weights. However, in another case, using the equal weights, the DP systems influence is stronger and more positive (
Figure 6).
The composite indicator of the impact of the direct payments system on the socioeconomic sustainability of small farms shows (irrespective of weights, whether experts or equal) that in the years 2004–2016, the social development of small farms can be divided into three stages: 2004–2008; 2009–2012 and 2013–2016, respectively named as inadequate DP system for the social development of small farms, the years of crisis, and the stages of adaptation and development of the socioeconomic sustainability of small farms.
This result is also explained by the fact that by the year 2013, the DP system, partly decoupling part of the payments and indirectly coupling them with the area of agricultural land per hectare, determined the economic and, in part, social development of large farms, thus reducing the competitive potential of the vital economic resources (land, technical equipment, financial loans, etc.) to expand the small farms economy and socioeconomic sustainability. The crisis years has further exacerbated the poor development of the socioeconomic sustainability of small farms in agriculture. And only with the elements of the reformed CAP that was officially launched in 2013, there is a sharp shift towards the social and economic sustainability of small farms. The system of direct payments has addressed two issues of relevance to the socioeconomic sustainability of small holdings: additional support for young farmers in the framework of the DP system scheme and additional support for farms up to 30 ha (redistributive payments). In addition, at the beginning of the 2014–2020 CAP implementation, the Member States could voluntarily opt for a scheme for the support of small farms through direct payments, but Lithuania was not among those selected because of the low utility in the proposed financing conditions.
Assessing the results obtained by different weights (expert and equal), it can be stated that the expert assessment suggests the DP system contributed positively to the socioeconomic sustainability of farms up to 30 ha in 2013–2016, however, failed to rebuild it before the crisis level. Meanwhile, the results of the assessment of uniform weights indicate that the DP system contributed most to the sustainable development of small farms in 2013–2016. This contradiction from one side is a significant result, which justifies the specificity of the indicators, examining the social dimension quantitatively in the context of the CAP direct payments system. Despite the differences in results, the ongoing CAP (since 2014), has a positive effect on the socioeconomic sustainability of small farms in Lithuania.
6. Conclusions
Though sustainability is a widely researched concept in scientific literature, it shows its ambiguity in the context of agriculture. Unlike in other economic sectors, the economic and social dimensions of sustainable agriculture cannot be separated and researched independently, as it constitutes an integral and indivisible concept of socioeconomic sustainability. The specific peculiarities of agricultural sectors across various EU Member States leads to a confusion in determining the maximum upper threshold of agricultural lands ownership, which still allows for the agricultural entity to be defined as a small one in terms of size. In order to solve this haziness, the 30-ha boundary has been set based on an analysis of scientific literature and administrative documents.
Assessing the impact of the system of DP on the social sustainability of small farms, and due to the empirical research involving expert survey, a system of quantitative indicators and their weights was developed. The indicator system allowed measuring the contribution of the DP system to the sustainability of farms up to 30 hectares in Lithuania—a small nation and new EU Member State. The application of a multi-criteria decision-making method—TOPSIS allowed—aggregating multiple indicators into a composite indicator which reflects the social sustainability of small farms. Combining the developments of the DP system and the resulting composite indicator allowed drawing conclusions on the effects of the DP system in Lithuania. It was shown the DP system contributed negatively to the diversity of local production in Lithuania in 2004–2016.
The results indicate that the outcomes of the multi-criteria assessment of the social sustainability of farms are highly sensitive to the weighting schemes. This discrepancy can be explained by the qualitative nature of expert survey. Indeed, the equal weighting may mask the importance of certain factors which are particularly relevant for certain regions and time periods. Following the global economic crisis of 2009 and Russian embargo that affected the Lithuanian agrifood sector in 2012, the Lithuanian government encouraged a shift towards fintech and the service sector in general. This led to a decrease in the average salary in agricultural sector as compared to the national average. The subjectivity stemming from the use of expert ratings needs to be taken into consideration. In our study, we applied equal weighting to circumvent this issue. However, other techniques can be used to further check the robustness of the results.
It was also found that DP support for small farms incomes was not timely, sufficient and less resilient compared to the level of rising prices and income in the general market by 2012; thereby contributing to the reduction of the social sustainability of these farms. Meanwhile, it has been established that from 2013 onwards, changing the principles of the CAP DP schemes and payment rates with more support allocated for small and young farmers, the values of the composite indicator for social sustainability has increased. This indicates improvement in the social situation of small farms in Lithuania.
However, further research is needed to test the causality among the underlying variables. Yet another limitation pertinent to our research is the use of the aggregate data; due to its nature, certain characteristics and mechanisms of farming decisions might be hidden. Thus, further research could embark on exploiting farm-level data from FADN and the National Paying Agency to model farm behaviour in a more detailed manner.


