Abstract
Industrial energy efficiency is important for reducing CO2 emissions and could be a competitive advantage for companies because it can reduce costs. However, cost-effective energy efficiency measures are not always implemented because there are barriers inhibiting their implementation. Drivers for energy efficiency could provide means for overcoming these barriers. The aim of this article was to study the importance of different barriers to and drivers for improved energy efficiency in the Swedish aluminium industry and foundries that cast aluminium. Additionally, the perceived usefulness of different information sources on energy efficiency measures was studied. The data were collected through a questionnaire covering 39 barriers and 48 drivers, divided into different categories. Both the aluminium and foundry industries considered technological and economic barriers as the most important categories. The most important category of drivers for the aluminium industry was organisational drivers, while the foundries rated economic drivers as the most important. Colleagues within the company, the company group and sector, and the trade organisation were considered the most useful information sources. Important factors for driving work with improved energy efficiency included access to knowledge within the company, having a culture within the company promoting energy efficiency, and networking within the sector. The policy implications identified included energy labelling of production equipment, the law on energy audit in large companies and subsidy for energy audits in small- and medium-sized companies, voluntary agreements that included long-term energy strategies, increased taxes to improve the cost-effectiveness of energy efficiency measures, and EUs Emission Trading System.
1. Introduction
The Paris Agreement aims for a maximum increase of well below 2 °C in the global average temperature compared to pre-industrial levels, with efforts to limit this increase to 1.5 °C [1]. Additionally, the Paris Agreement aims to make financial flows lead towards low greenhouse gas (GHG) emissions [1]. In 2016, the industrial sector accounted for 38% of final energy use globally and 24% of the direct global CO2 emissions [2]. Industrial energy efficiency is important for reducing CO2 emissions [3], and thus meeting the goals of the Paris Agreement, but could also be a competitive advantage for companies because of its potential to reduce energy costs.
Previous research has shown that cost-effective energy efficiency measures are not always implemented in industry [4,5,6,7,8]. This implies the existence of an energy efficiency gap [4,6,7,8], which is the difference between the optimal and actual implementation of energy efficiency measures [5,8]. The energy efficiency gap is commonly explained by barriers inhibiting the implementation of possible measures [4,5,6,7,8]. Drivers for energy efficiency could provide means for overcoming these barriers, and are therefore interesting to study along with the barriers [5]. Barriers to, and drivers for, improved energy efficiency have been described and categorised in previous research (see e.g., [4,5,7,9,10,11,12,13,14,15,16]). Barriers to and drivers for improved energy efficiency have been studied in different industry sectors worldwide (see e.g., [17,18,19,20,21,22,23,24,25,26,27,28,29,30,31,32,33]).
Aluminium can be produced either from primary or secondary sources. The production of primary aluminium starts with the mining of aluminium ore, bauxite [34]. Bauxite is refined to aluminium oxide, also called alumina, which is then electrically reduced in the electrolytic process called the Hall–Héroult process to produce pure aluminium [34]. Holding furnaces are used when adding alloying elements to the aluminium [34] to achieve the desired properties of the metal. Secondary aluminium is produced by melting post-consumer scrap [34]. Alloying elements and/or pure aluminium are added to the metal to ensure that the proportions of different elements in the alloy are within desired limits. Both primary and secondary aluminium are cast into ingots, slabs, or billets [34] depending on the application. Profile extrusion uses hydraulic pressure to push a preheated billet through a steel die to produce an elongated shape with a uniform cross-section [34]. Rolling uses counter-rotating steel rolls to reduce the thickness of slabs to produce aluminium sheets with a desired thickness [34]. In foundries, shape casting is used to produce components of desired shapes by pouring molten aluminium into moulds, and there are different methods that can be used for this [34]. The aluminium industry is here defined as companies dealing with the primary and secondary production of aluminium, profile extrusion, and rolling. Foundries will be presented separately in the article. This categorisation is based on the Swedish Standard Industrial Classification (see [35]), where aluminium production, profile extrusion, and rolling belong to code 24.420, and the casting of aluminium into semi-finished products belongs to code 24.530 [36].
Both the aluminium industry and the foundry industry are energy-intensive and use substantial amounts of fossil fuels (for energy purposes) and electricity. The use of fossil fuels and electricity (depending on how the electricity is generated) results in energy-related GHG emissions. Energy efficiency in the aluminium and foundry industries is thus important for reducing GHG emissions. Additionally, electrolysis uses fossil coal in the form of carbon anodes as reaction material, which results in process-related GHG emissions [34,37,38]. These process-related GHG emissions could be eliminated by using so-called inert anodes, which is a technology not fully developed yet [34]. Another possibility for reducing these GHG emissions would be to use industrial carbon capture and storage (ICCS) [39]. However, negative or reluctant attitudes, including so-called “not-in-my-backyard” (NIMBY) attitudes, toward ICCS exist in many countries, which may hamper further developments of the ICCS technology [40]. Carbon capture and utilisation (CCU), where the CO2 is used to make products, could be a better solution than CCS since CCU is perceived as better than CCS by the public [41], and the problems associated with the storage of CO2 are eliminated.
The countries mining the largest amount of bauxite in the world are Australia, China, Brazil, Guinea, and India [42,43] who accounted for 28.9%, 23.5%, 13.6%, 10.7%, and 8.5% of the world’s total annual production of 289 Mton (year 2016), respectively [42]. The largest producers of alumina are China, Australia, Brazil, India, and Russia [42,43] who accounted for 51.2%, 17.4%, 9.2%, 4.9%, and 2.3% of the world’s total annual production of 118.9 Mton (year 2016), respectively [42]. Sweden does not have any mining of bauxite nor any production of alumina. The largest producers of primary aluminium in the world are China, Russia, Canada, India, and United Arab Emirates [42,43] who accounted for 54.2%, 6.1%, 5.5%, 4.9%, and 4.2% of the world’s total annual production of 58.8 Mton (year 2016), respectively [42]. Sweden ranks 32nd place regarding production of primary aluminium and accounts for 0.2% of the world’s total production (year 2016) [42]. Statistics on the annual production of secondary aluminium and semi-finished products (extruded, rolled, and casted products) are scarce. One reason for this is that the amount of delivered semi-finished products are considered confidential to the industry in many regions [44].
The Swedish aluminium industry consists of five companies and includes the primary (from electrolysis onwards) and secondary production of aluminium, profile extrusion, and rolling. In Sweden, there is no mining of bauxite or alumina production. The Swedish foundry industry has 100 foundries in total [45], of which 36 cast aluminium. About 80% of the produced tonnage of aluminium castings is produced using pressure die casting, with chill casting and sand casting accounting for about 10% each [45].
Barriers to and drivers for improved energy efficiency have previously been studied in different sectors within the Swedish industry. The studied sectors are the foundry industry [6], pulp and paper industry [4], iron and steel industry [11,46], non-energy-intensive manufacturing industry [7], manufacturing small- and medium-sized enterprises (SMEs) [47], and industrial companies in Oskarshamn municipality as well as industrial companies participating in the Swedish policy programme “Uthållig kommun” (“Sustainable municipality”) [13]. Barriers to [48] and drivers for [49] improved energy efficiency in European foundries, including Swedish foundries, have also been studied. Johansson and Thollander [50] conducted a review of previous studies on barriers to and drivers for improved energy efficiency in the Swedish industry. They include the studies previously mentioned in this paragraph. Barriers to and drivers for improved energy efficiency in compressed air systems have also been studied [5]. Lawrence et al. [51] studied barriers to and drivers for energy management in the Swedish pulp and paper industry.
Batterham [52] reviewed the drivers for technology innovation in alumina production that may drive the companies to improve their processes. A part of this process improvement is to improve energy efficiency [52]. Bailey and Ditty [53] studied whether economic policy instruments in the UK provide sufficient incentives to overcome barriers to investment in improved energy efficiency in energy-intensive sectors (aluminium, chemicals, and cement). Su et al. [54] studied improved energy efficiency in a Chinese foundry and identified a number of barriers to improved energy efficiency. Nagesha and Balachandra [55] studied barriers to improved energy efficiency in a foundry cluster in India. Haraldsson and Johansson [56] studied improved energy efficiency in the supply chains of the Swedish aluminium industry and how demands from actors both within and outside the supply chains affected the work with energy efficiency. These demands could act as either barriers to or drivers for improved energy efficiency [56]. However, Haraldsson and Johansson [56] did not study how important these demands were as barriers to or drivers for improved energy efficiency. Additionally, many of the demands focused on the products rather than the companies [56].
The perceived usefulness of information sources on energy efficiency measures in industry is a relatively unexplored area in previous research on energy efficiency in industry. It has been studied in Swedish foundries [6], industrial companies in Oskarshamn municipality, as well as industrial companies participating in the Swedish policy program “Uthållig kommun” (“Sustainable municipality”) [13], and Ghana’s largest industrial area [33]. Credibility and trust in the information sources are important for effective information dissemination [13] and for the information regarding energy efficiency investments to be accepted [6]. This makes it interesting to study how companies perceive the usefulness of different information sources.
The importance of barriers to and drivers for improved energy efficiency within the companies that comprise the Swedish aluminium industry has not yet been studied. The same applies for the perceived usefulness of information source on energy efficiency measures. Sector- and region-specific studies on barriers to improved energy efficiency are needed since the importance of barriers differ depending on sector- and region-specific conditions [4,6]. The same applies to drivers and information sources. This makes it interesting to study the Swedish aluminium industry. Rohdin et al. [6], Trianni et al. [48], and Thollander et al. [49] studied foundries that cast different types of metals (not only aluminium), while our article focuses on foundries that cast aluminium. In their analysis, Trianni et al. [48] present their results by metal and by country, but it is not possible to identify which barriers are important for the Swedish foundries that cast aluminium. The paper by Rohdin et al. [6] was published about 12 years ago and things might have changed since then.
The aim of this article is to study the importance of different barriers to and drivers for the implementation of cost-effective energy efficiency measures in the companies comprising the Swedish aluminium industry and Swedish foundries that cast aluminium alloys. Additionally, the perceived usefulness of different information sources on energy efficiency measures will be studied. The following research questions will be covered in the article:
- Is there an energy efficiency gap in the Swedish aluminium industry and Swedish foundries that cast aluminium alloys?If so:
- Do the companies perceive that their priority of energy issues has changed over time?
- What barriers are inhibiting the implementation of cost-effective energy efficiency measures in the Swedish aluminium industry and Swedish foundries that aluminium alloys?
- What drivers are stressing the implementation of cost-effective energy efficiency measures in the Swedish aluminium industry and Swedish foundries that cast aluminium alloys?
- How do the Swedish aluminium industry and Swedish foundries that cast aluminium alloys perceive the usefulness of different information sources on energy efficiency measures?
2. Materials and Methods
A questionnaire was used for collecting the data. The questions were based to a large extent on previous questionnaires and studies on the Swedish industry (e.g., [5,50,51]). However, some additional questions were added. Most questions were closed-ended and many of the questions used Likert scales in order to facilitate comparisons between the different respondents’ answers in order to gain a rating of the barriers, drivers, and information sources. A closed-ended question has a number of predetermined answers that the respondents can choose from [57]. The Likert scale is a tool for measuring the intensity in a feeling, experience, or attitude, and includes a number of options reflecting different levels of intensity [57]. Questionnaires were chosen as a method due to the relatively large number of respondents (41), and because most of the questions were closed-ended. This is in line with Bryman [57], who stated that questionnaires commonly have mostly closed-ended questions and are advantageous for a large number of respondents.
The barriers and drivers included in the questionnaire are shown in Table 1 and Table 2, respectively. The respondents were asked to rate each barrier and driver on a Likert scale with the options “Never important”, “Rarely important”, “Fairly important”, “Often important”, and “Always important”.

Table 1.
Barriers included in the questionnaire. The table also lists references that previously studied barriers to improved energy efficiency (or energy management) in the Swedish industries or in aluminium and foundry industries in countries other than Sweden.
Table 2.
Drivers included in the questionnaire. The table also lists references that previously studied drivers for improved energy efficiency (or energy management) in Swedish industries or in aluminium and foundry industries in countries other than Sweden.
The respondents were asked to rate the usefulness of different information sources for energy efficiency measures on a Likert scale with the options “Do not use”, “Not very good”, “Fairly good”, “Good”, and “Excellent”. The information sources were:
- Colleagues within the company or company group
- Colleagues within the sector
- The trade organisation
- The Swedish Energy Agency
- Written information sources (e.g., journals)
- Conferences and seminars
- Information from energy companies
- Product information from suppliers
- Consultants (performing energy audits)
- Energy audits
- The Swedish county administrative board
- The municipality
Respondents were asked to rate the changes in their companies’ prioritising of energy issues during different time intervals (before 1996, 1996–2000, 2000–2005, 2005–2010, 2010–2015, and 2015–2018). The change in priority was rated on a Likert scale with the options “Do not know”, “Decreased priority”, “Unchanged priority”, and “Increased priority”. A question about how many years the respondents have worked at their respective companies was added to verify the answers to the question about the priority. The respondents were asked to what extent they agreed with the following statement: “There exist energy efficiency measures that are not yet implemented at the company and that are cost-effective according to the company’s payback criteria.” The respondents rated their agreement with this statement on a Likert scale with the options “Fully agree”, “Partially agree”, “Neutral”, “Partially disagree”, “Fully disagree”, and “Do not know”. This question was used to identify whether there existed an energy efficiency gap in the Swedish aluminium industry and foundries casting aluminium alloys. This was considered sufficient for answering the first research question, and no measurement of the size of the energy efficiency gap was conducted. Questions about the number of employees and annual turnover, whether the company was profitable over the past three years, what the company’s payback criteria for energy efficiency measures were, whether the company had a written long-term energy strategy, and how the company allocated energy costs among divisions were added to the questionnaire.
As already mentioned, this questionnaire was based on questionnaires used in previous studies, which meant that many of the questions had already been tested in action. However, a draft of the questionnaire was discussed during a workshop with representatives from four large aluminium companies in Sweden, one person from the Swedish Aluminium Association, and individuals from another research institute. The discussions revolved around whether the phrasing of the questions was understandable. Another person from the Swedish Aluminium Association sent comments by e-mail. Two PhD students within the same research field also gave their comments on the draft. There is always the risk that respondents could misinterpret the questions, but the rigorous testing of the questionnaire minimized this risk.
The web-based software Survey&Report was used for the questionnaire, which was first sent out by e-mail during spring 2018. The first two reminders were sent by e-mail. The next two reminders were conducted by telephone, where the respondents were given the opportunity to choose to answer the questionnaire either by telephone or online.
The questionnaire was sent to 41 companies covering primary and secondary aluminium production, profile extrusion, and rolling as well as foundries that cast aluminium alloys. The Swedish aluminium industry consists of five companies, as stated in the introduction, and all of these were included in the study. The remaining 36 companies were all the foundries in Sweden that cast aluminium alloys. Energy managers at the companies were prioritised as respondents. If the companies had no energy manager appointed, the questionnaire was sent to the CEO, production manager, or corresponding positions. In addition, the respondents were given the opportunity to forward the questionnaire to an employee at the company that was considered better suited to answer the questionnaire. The response rate for the aluminium industry was 100% since all five companies answered the questionnaire. For the foundries, ten complete answers and two partial answers were received, resulting in a response rate of 28% and 33% out of the 36 foundries, respectively. The total response rate for the entire population (41 companies) was 37% for complete answers, and 41% when including partial answers. The two partial answers were a result of technical difficulties with the software Survey&Report. After the difficulties were identified and corrected, the respondents were asked to answer the remaining questions, but they did not do so.
3. Results and Analysis
All respondents in the aluminium industry agreed that there were energy efficiency measures that were cost-effective according to the companies’ payback criteria, but they were not yet implemented. For the foundries, nine respondents agreed that such energy efficiency measures existed, and one respondent was neutral. This verified that there was an energy efficiency gap in both the aluminium industry and the foundries, which answered the first research question and made it worth studying the rest of the research questions.
Table 3 shows the perceived changes in the companies´ prioritising of energy issues. Answers for the time intervals before the respondents began to work at their respective companies should be taken with caution. There was a trend of increased prioritising of energy issues in both the aluminium industry and the foundries during the period 2010–2015 onwards. In some companies, the increase started earlier than that.
Table 3.
Perceived change in the companies’ prioritising of energy issues. The two partial answers did not include answers to this question. + = increased priority, 0 = unchanged priority, − = decreased priority, ? = the respondent did not know.
Figure 1 shows the top-ranked barriers for the aluminium industry and foundries. The figure shows each respondent’s rating and the mean rating. The rating for all barriers is shown in Table A1 and Table A2 in the Appendix. For both the aluminium industry and the foundries, there were variations in the answers for all barriers (see Table A1 and Table A2 in the Appendix). However, the sizes of the variations were different for the different barriers. Smaller variations indicated a more unanimous view on the importance of the barrier.
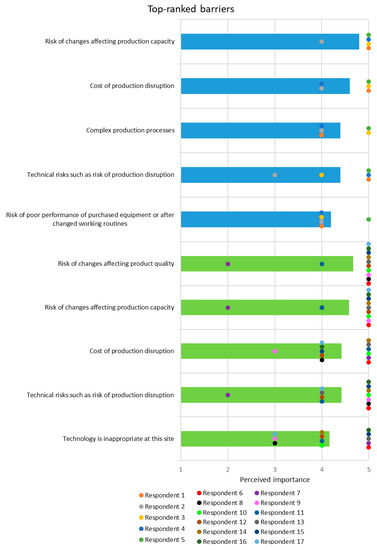
Figure 1.
Top-ranked barriers for aluminium industry and foundries. The barriers were evaluated based on a Likert scale from “Never important” (1) to “Always important” (5). The bars show the mean values of the rating and the circles show each respondent’s individual rating. Blue bars represent the aluminium industry and green bars the foundries.
Figure 2 shows the top-ranked drivers for the aluminium industry and foundries. The figure shows each respondent’s rating and the mean rating. Note that the two most important drivers for the aluminium industry showed no variations in the answers. The ratings for all drivers are shown in Table A3 and Table A4 in the Appendix.
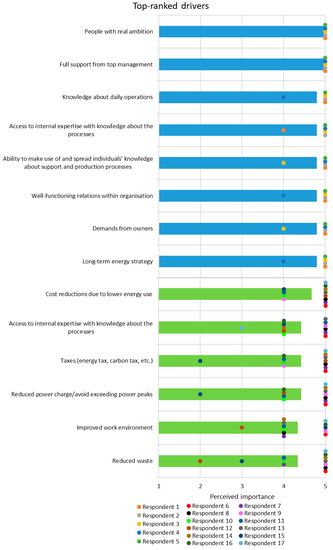
Figure 2.
Top-ranked drivers for aluminium industry and foundries. The drivers were evaluated based on a Likert scale from “Never important” (1) to “Always important” (5). The bars show the mean values of the rating and the circles show each respondent’s individual rating. Blue bars represent the aluminium industry and green bars the foundries. Note that the two most important drivers for the aluminium industry had no variations in the answers.
For the aluminium industry, there were five drivers for which all the respondents chose the same answer for rating the importance and were, thus, totally unanimous. This was for the drivers “people with real ambition”, “full support from top management”, “network within sector or trade organisation”, “network outside company or company group”, and “pressure from different environmental NGOs”. For the other drivers, there were variations in the answers from the respondents in the aluminium industry. For the foundries, there were variations in the answers for all drivers (see Table A3 and Table A4 in the Appendix). The sizes of the variations for both the aluminium industry and the foundries were different for the different drivers. As for the barriers, smaller variations indicated a more unanimous view on the importance of the driver.
The drivers “people with real ambition”, “full support from top management”, “well-functioning relations within organisation”, and “demands from owners” could be categorised as the culture within the company. This meant that having a culture within the company that promoted work with improved energy efficiency was beneficial.
Access to knowledge about the processes and their operation, and the ability to make use of and spread this knowledge, was another important factor for driving the work with improved energy efficiency.
Figure 3 shows the rating of the categories of barriers and drivers.
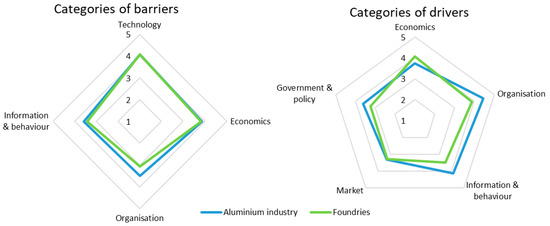
Figure 3.
Rating of categories of barriers and drivers divided into aluminium industry and foundries. The ratings were calculated as the average of the ratings for the barriers and drivers in each category. The barriers and drivers were evaluated based on a Likert scale from “Never important” (1) to “Always important” (5).
Figure 4 shows the top-ranked information sources on energy efficiency measures divided into aluminium industry and foundries. The figure shows each respondent’s rating and the mean rating. The rating for all information sources is shown in Table A5 and Table A6 in the Appendix. There were large variations in the rating of most of the information sources for both the aluminium industry and the foundries. These variations made it harder to draw general conclusions.
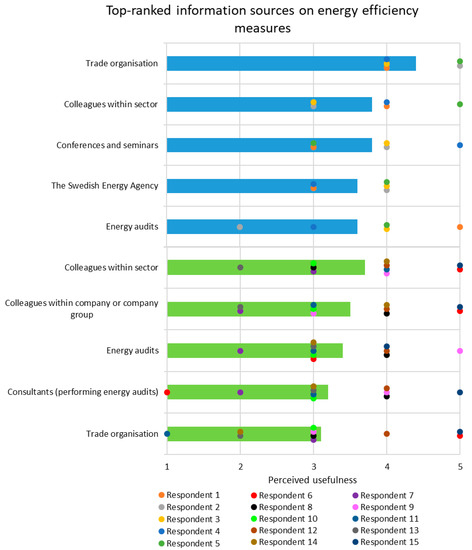
Figure 4.
Top-ranked information sources on energy efficiency measures divided into aluminium industry and foundries. The bars show the mean values of the rating and the circles show each respondent’s individual rating. Blue bars represent the aluminium industry and green bars the foundries. The usefulness was evaluated based on a Likert scale from “Do not use” (1) to “Excellent” (5). The two partial answers did not include answers to this question.
Networks within the sector or trade organisation appeared to be an important factor for the work with improved energy efficiency. This was because the trade organisation and colleagues within the sector were ranked among the most useful information sources by both the aluminium industry and the foundries. Additionally, the driver “network within sector or trade organisation” was ranked “often important” by the aluminium industry and “fairly important” by the foundries.
The aluminium industry ranked product information from suppliers as among the least useful information sources on energy efficiency. Additionally, this industry ranked “risk of poor performance of purchased equipment or after changed working routines” among the most important barriers. Furthermore, both the aluminium industry and the foundries ranked “difficulty of obtaining information on the energy use of purchased equipment” as being a “fairly important” barrier. This implied that the product information from technology suppliers could be improved regarding the energy use/efficiency and performance of the equipment.
The companies in the aluminium industry were typically larger than the foundries, in terms of both number of employees and turnover (see the text in conjunction with Table A7 in the Appendix). This was one reason for the differences between them regarding their rating of the barriers, drivers, and information sources.
The aluminium industry rated the barriers “lack of technical skills regarding energy efficient technology”, “lack of internal expertise”, and “lack of knowledge about daily operation” slightly higher in importance than the foundries. It also rated the drivers “access to internal expertise with knowledge about the processes”, “knowledge about daily operations”, and “ability to make use of and spread individuals´ knowledge about support and production processes” slightly higher than the foundries. The aluminium industry rated the barrier “complex production processes” higher than the foundries, which was one reason why the aluminium industry perceived barriers and drivers regarding knowledge as more important than the foundries did. Complex production processes placed higher demands on the competences of employees and their knowledge about how the processes work.
Some of the companies were not profitable over the past three years (see Table A7 in the Appendix). The profitability of a company may affect the amount of focus it places on energy efficiency, especially when it comes to measures requiring investment. If the company is not profitable, there may not be enough budget funding for investing in energy efficiency. However, there was no clear difference in the importance of the barriers “lack of access to capital”, “lack of budget funding for energy efficiency”, and “lack of budget funding for energy management” between the companies that were profitable for all or two of the past three years and those that were profitable for none or one of the past three years. The same applied to the driver “access to capital/budget funding for energy efficiency”. This meant that the profitability of a company did not appear to affect how it perceived the importance of access/lack of money to invest in energy efficiency. Both the aluminium industry and the foundries were energy-intensive, which implied that there was an incentive for the studied companies to work with energy efficiency, regardless of their profitability. Another interesting result was that there was no clear difference in the importance of the barrier “uncertainty regarding the company’s future” between the companies that were profitable for all or two of the past three years and those that were profitable for none or one of the past three years. This meant that the profitability of the companies did not appear to affect how they perceived the importance of “uncertainties regarding the company’s future”.
Most of the companies either allocated energy costs based on sub-metering or did not allocate such costs at all (see Table A7 in the Appendix). There was no clear difference in the importance of the barrier “department/workers not accountable for energy costs” between those companies that allocated based on sub-metering and those that did not allocate at all. There was a tendency for companies that had sub-metering to perceive the driver “allocation of energy costs based on sub-metering” as more important than the companies that did not allocate energy costs at all.
4. Discussion
All companies in the aluminium industry answered the questionnaire, which makes their results valid for the entire Swedish aluminium industry. Due to the relatively low response rate for the foundries, it is hard to say anything general about all the foundries that cast aluminium. The variation in the respondents´ rating for some barriers, drivers, and information sources were small for both the aluminium industry and the foundries, and there were some drivers for which all respondents in the aluminium industry chose the same rating. This means that these barriers, drivers, and information sources are general to the aluminium industry and the foundries. For both the aluminium industry and the foundries, there were variations in the rating of many barriers, drivers, and information sources. These variations, especially the larger ones, make it hard to draw general conclusions, since larger variations indicate a lower consensus between the companies. The larger variations indicate that results may be more applicable to individual companies than to the entire population.
Table 4 and Table 5 show the barriers and drivers that were ranked as often and always important (or corresponding Likert-scale options) in our study and previous studies. The barrier “technical lifetime of equipment decides when energy efficiency measures are implemented” was raised in Batterham [52], but not ranked in importance. Similar to our study, Nagesha and Balachandra [55] found that financial and economic barriers were the top obstacle to improved energy efficiency in a foundry cluster in India. Those barriers and drivers that were perceived as often or always important in both our study and previous studies were thus verified as important for industrial companies.
Table 4.
The barriers that were ranked as often or always important (or corresponding Likert-scale options) in both our study and previous studies. The barriers are not sorted based on importance.
Table 5.
The drivers that were ranked as often or always important (or corresponding Likert-scale options) in both our study and previous studies. The drivers are not sorted based on importance.
It can be seen in Table 4 and Table 5 that there were two barriers and three drivers that were ranked as often or always important by the foundries in both our study and Rohdin et al. [6]. Additionally, all three barriers that were ranked as often or always important by the foundries in our study were also ranked as important by the foundries in Trianni et al. [48]. Furthermore, six drivers were ranked as often or always important by the foundries in both our study and Thollander et al. [49]. Those barriers and drivers that are similar can be seen as generally important for the foundries. The differences could be explained by the fact that the studies were conducted at different points in time, and perceptions of barriers and drivers may change over time. However, some differences may be explained by the existence of differences between foundries that cast aluminium and foundries that cast other metals, or between Swedish and European foundries.
The barriers and drivers ranked as often or always important in our study, but not in previous studies, gained a lower rank in the previous studies. However, none of these barriers or drivers were ranked as never important (or the corresponding Likert-scale option) in the previous studies. The different rankings for these barriers and drivers, as well as for others, could be due to actual differences between the industry sectors, or because the studies were conducted at different points in time, and perceptions of barriers and drivers may change over time.
Respondents in the foundries ranked economic drivers as the most important category of drivers. Respondents in the aluminium industry ranked economic drivers as the third most important category. They perceived that both organisational, and informational and behavioural drivers were more important categories than economic drivers. It is hard to identify the exact reason for this since the questionnaire did not include any question about this. However, the companies in the aluminium industry have been profitable for all or two of the past three years, while some of the foundries have not been profitable at all or for only one of the past three years (see Table A7 in the Appendix). Thus, one reason could be that other types of drivers become more important than economic drivers when the company is profitable, while economic drivers become more important when the company is not profitable. Nevertheless, the aluminium industry’s rank of the economic drivers in third place is an interesting result, since both the aluminium industry and the foundries use energy-intensive production processes, and most companies are driven by the generation of economic profits. Additionally, Haraldsson and Johansson [56] found the economic aspect to be an important driver for improved energy efficiency in the supply chains of the aluminium industry. The result might be interpreted as meaning that the economic aspect is not sufficient to drive work with improved energy efficiency, and that organisational, informational, and behavioural aspects are at least as important in the aluminium industry. Additionally, Haraldsson and Johansson [56] found that demands from customers and the authorities provided an additional driver for improved energy efficiency in the supply chains of the aluminium industry. This supports the statement that reduced costs for energy may not be the only driver for improved energy efficiency, and that there may be other drivers that are at least as important.
Access to knowledge within the company about the processes and daily operations, and the ability to make use of and spread this knowledge, were raised as important drivers for the aluminium industry and to some extent for the foundries. Such knowledge would help to overcome some of the barriers perceived as most important by the companies. For example, the aluminium industry ranked “complex production processes” among the most important barriers. Complex processes demand more knowledge about the processes themselves and their operation in order to avoid negative effects on processes and products when making changes. Other barriers that were ranked among the most important were “risk of changes affecting production capacity” and “product quality”, “technical risks such as risk of production disruption” and “risk of poor performance of purchased equipment or after changed working routines”. Knowledge about the processes could help to foresee such risks and decide how best to deal with them. Knowledge about the processes and their operation is also important for being able to identify potential energy efficiency measures. The companies should provide education for their employees to improve their knowledge about the processes and their operation, and about energy efficiency measures and energy efficient operation of the processes.
An important factor for driving the work with energy efficiency is having a culture within the company that promotes work with improved energy efficiency. It is important to have one or more employees who are passionate about energy efficiency (having real ambition) and who are supported by top management and the company owners. A person with real ambition could, for example, influence other employees through his/her work or propose potential energy efficiency measures. It would be preferable if the person with real ambition is represented in the top management of the company [6]. It is important to have well-functioning relations within the company, which helps in utilising the knowledge of employees. Two-way communication between top management and production is needed for improving energy efficiency. A long-term energy strategy would provide a basis for work with energy efficiency and would be something that employees can relate to in their daily work. This is important for being able to drive the work with improved energy efficiency within the company and to achieve continuous improvements. The aluminium industry ranked “long-term energy strategy” among the most important drivers. A long-term energy strategy is an important part of successful energy management [50] and serves as a driver for overcoming strict payback criteria [7,49] and other barriers [4]. The government is not allowed to demand the implementation of an energy strategy in a company, but such a strategy could be a part of a voluntary agreement policy measure [50].
The foundries ranked “taxes (energy tax, carbon tax, etc.)” and “cost reductions due to lower energy use” among the most important drivers. Taxes are something that policy-makers can affect directly, and they have indirect effects on cost reductions from energy efficiency. Increasing taxes would increase the cost-effectiveness of energy efficiency measures.
Networking within the sector is an important factor for driving work with improved energy efficiency. This could provide companies with information about potential energy efficiency measures as well as inspiration for working with energy efficiency. The trade organisation could play an important role by providing an arena for networking between companies. Colleagues within the sector and the trade organisation are familiar with the production processes used and the conditions within the specific industry. Additionally, targeted information from close range through such channels as meetings and networks is the best way to reach out to the companies [13].
Colleagues within the sector, the company or company group, and the trade organisation are among the most important information sources in both our study and previous studies [6,13]. The companies’ perception of the usefulness of the information sources could be affected by several factors, for example the type of information needed, the required information quality, the accessibility of the information sources, and the company’s willingness to use a specific information source. Such factors could be one explanation to the variations in how the companies rated the usefulness of the information sources. However, our article did not study the reasons for why they perceived a certain information source as useful or not.
As discussed previously, product information from technology suppliers could be improved regarding the energy use/efficiency and performance of equipment. Such improvements could be facilitated by a policy demand for the energy labelling of industrial equipment similar to that of household appliances. Suppliers should also provide information on how the equipment can be operated in an energy efficient manner.
Energy audits were ranked among the most useful information sources on energy efficiency measures by both the aluminium industry and the foundries. Additionally, the aluminium industry ranked demands for conducted energy audits as being “often important” as a driver for improved energy efficiency. Energy audits provide an overview of a company’s energy use, which processes are the largest energy users, as well as providing a list of potential energy efficiency measures that could be conducted within the company. There is a law requiring large companies to conduct an energy audit at least every fourth year [58]. For small- and medium-sized companies, it is possible until 30 April 2019 to apply for economic support when conducting an energy audit, which corresponds to 50% of the cost (max 50,000 SEK) [59]. We therefore recommend that the requirement on large companies and the subsidy for small- and medium-sized companies are kept as policy instruments.
The EU Emission Trading System (EU ETS) was perceived as often important by the aluminium industry. A way to increase the EU ETS as a driver is to reduce the amount emission allowances distributed, which will increase the price of the allowances. Another way is to cover more sectors and smaller emitters in the EU ETS.
Despite the relatively low response rate for the foundries casting aluminium, some of the results may be viewed as more general. The reason is that some barriers, drivers, and information sources received a similar rating in our study as in previous research on foundries.
5. Conclusions
The aim of this article was to study the importance of different barriers to and drivers for the implementation of cost-effective energy efficiency measures in the Swedish aluminium industry and Swedish foundries that cast aluminium alloys. Additionally, the perceived usefulness of different information sources on energy efficiency measures was studied. There is an energy efficiency gap, in both the aluminium industry and the foundries, which makes it worthwhile to study the barriers to and drivers for improved energy efficiency as well as information sources on energy efficiency. Energy issues have generally increased in priority in both the aluminium industry and the foundries during the period 2010–2015 onwards.
Technological and economic barriers were ranked as the two most important categories of barriers by both the aluminium industry and the foundries. Among the most important barriers are, for example, risk of production disruption and the associated cost, risk of changes affecting production capacity and product quality, and risk of poor performance of purchased equipment or after changed working routines.
The aluminium industry ranked organisational drivers as the most important category of drivers, including full support from top management, having a long-term energy strategy and demands from owners. The foundries ranked economic drivers as the most important category of drivers, including cost reductions due to lower energy use, reduced power charge/avoiding exceeding power peaks, and an improved work environment. Moreover, access to knowledge within the company about the processes and daily operations, along with the ability to make use of and spread this knowledge, were considered important drivers. Therefore, it is recommended that the companies provide education for their employees to improve their knowledge about the processes and their operation, and energy efficiency measures. Another factor is having a culture within the company that promotes the work with improved energy efficiency, including one or more employees with real ambition, support from top management and the owners of the company, well-functioning relations within the company, and a long-term energy strategy. Networking within the sector is another relevant factor, and the trade organisation could play an important role by providing an arena for networking between companies.
Colleagues within the sector, colleagues within the company or company group, and the trade organisation were shown to be the most useful information sources. More research regarding which information sources on energy efficiency measures are perceived as most useful by industrial companies is needed since this is a relatively unexplored area in previous research. Future research could study both the perceived usefulness of different information sources in more sectors and the underlying reasons for why certain information sources are perceived as useful or not. This could provide a basis for giving recommendations on how to best formulate and distribute information on energy efficiency measures.
The policy implications identified in the article include the introduction of an energy labelling system for production equipment, and keeping the requirement on large companies and the subsidy for small- and medium-sized companies regarding energy audits. Other policy implications are voluntary agreements that commit the companies to implementing long-term energy strategies and increased taxes to improve the cost-effectiveness of energy efficiency measures. Additionally, fewer emission allowances and coverage of more sectors and smaller emitters in the EU ETS were also identified as a policy implication.
The results given in this article are relevant to policy-makers due to the policy implications we proposed in the previous paragraph. Moreover, the companies studied will benefit from the results since they could help the companies to improve their work with energy efficiency. Furthermore, the results contribute to the research community as they provide a basis for comparison with similar studies conducted in other industrial sectors, countries, or regions and contribute to the knowledge on the existing energy efficiency gap in industry. As stated in the introduction, sector- and region-specific studies on barriers, drivers, and information sources are needed because there are differences between sectors and regions. Therefore, our study contributes to the scientific literature since the Swedish aluminium industry has not been studied before.
Author Contributions
Conceptualisation, J.H. and M.T.J.; methodology, J.H.; formal analysis, J.H.; investigation, J.H.; resources, J.H. and M.T.J.; data curation, J.H.; writing—original draft preparation, J.H.; writing—review and editing, J.H. and M.T.J.; visualisation, J.H.; supervision, M.T.J.; project administration, M.T.J.; funding acquisition, M.T.J.
Funding
This research was funded by the Swedish Energy Agency, project number 40552-1. The APC was funded by the Linköping University Library.
Acknowledgments
We appreciate the valuable information received from the Swedish Aluminium Association. We would like to thank our colleagues at the Division of Energy Systems at Linköping University for their valuable comments on the draft article. We would like to thank Patrik Thollander and Elias Andersson for sharing the questionnaires used in their research. We would like to thank Elias Andersson and Vlatko Milić for reviewing the draft questionnaire. We would like to thank Gustav Andersson for his valuable work in telephoning the respondents with the aim of improving the response rate. We would like to thank the respondents for their time and the valuable information they provided by answering the questionnaire.
Conflicts of Interest
The authors declare no conflict of interest. The funders had no role in the design of the study; in the collection, analyses, or interpretation of data; in the writing of the manuscript, or in the decision to publish the results.
Appendix A
Table A1 and Table A2 show the ratings for the barriers for the aluminium industry and the foundries, respectively. The tables show each respondent’s rating and the mean rating. The barriers within each category are ranked in descending order based on the mean rating. For barriers with the same mean rating, the ranking is based on the size of the variations in the respondents’ ratings (smaller variations are ranked higher since they indicate a more unanimous view on the importance of the barrier). One respondent did not want to answer the questionnaire. However, this respondent stated that uncertainties about the company’s future, based on profitability reasons, and lack of budget funding for energy efficiency inhibited their work with energy efficiency.
Table A1.
The aluminium industry’s rating of the barriers. The table shows each respondent’s rating and the mean rating. The barriers are evaluated based on a Likert scale ranging from “Never important” (1) to “Always important” (5). The barriers within each category are ranked in descending order based on the mean rating. For barriers with the same mean rating, the ranking is based on the size of the variations in the respondents’ ratings (smaller variations are ranked higher since they indicate a more unanimous view on the importance of the barrier).
| Respondent | |||||||
|---|---|---|---|---|---|---|---|
| Category | Barrier | 1 | 2 | 3 | 4 | 5 | Mean |
| Technology | Risk of changes affecting production capacity | 5 | 4 | 5 | 5 | 5 | 4.8 |
| Complex production processes | 4 | 4 | 5 | 4 | 5 | 4.4 | |
| Technical risks such as risk of production disruption | 5 | 3 | 4 | 5 | 5 | 4.4 | |
| Risk of poor performance of purchased equipment or after changed working routines | 4 | 4 | 4 | 4 | 5 | 4.2 | |
| Technology is inappropriate at this site | 3 | 5 | 4 | 3 | 5 | 4 | |
| Lack of sub-metering on machine or division level | 4 | 4 | 4 | 3 | 4 | 3.8 | |
| Risk of changes affecting product quality | 2 | 2 | 5 | 5 | 5 | 3.8 | |
| Technical lifetime of equipment decides when energy efficiency measures are implemented | 5 | 2 | 3 | 3 | 3 | 3.2 | |
| Economics | Cost of production disruption | 5 | 4 | 5 | 4 | 5 | 4.6 |
| Cost of identifying opportunities and analysing cost-effectiveness | 3 | 5 | 4 | 4 | 4 | 4 | |
| Lack of budget funding for energy management | 4 | 5 | 4 | 3 | 4 | 4 | |
| Other priorities for capital investments | 4 | 4 | 4 | 3 | 4 | 3.8 | |
| The benefits of energy efficiency are not expected to outweigh the costs | 3 | 4 | 4 | 3 | 5 | 3.8 | |
| Uncertainties regarding future energy prices and economic policies | 3 | 5 | 4 | 3 | 4 | 3.8 | |
| Lack of access to capital | 2 | 4 | 4 | 4 | 5 | 3.8 | |
| Lack of budget funding for energy efficiency | 3 | 4 | 4 | 3 | 4 | 3.6 | |
| Uncertainties regarding hidden or indirect costs | 3 | 3 | 4 | 5 | 3 | 3.6 | |
| Cost of staff replacement, retirement, and retraining | 2 | 3 | 4 | 4 | 5 | 3.6 | |
| Organisation | Slim organisation | 4 | 5 | 3 | 4 | 4 | 4 |
| Lack of time or other priorities | 5 | 3 | 3 | 5 | 4 | 4 | |
| Non-energy related work tasks have higher priority | 4 | 4 | 3 | 4 | 4 | 3.8 | |
| Top management not prioritising energy issues | 3 | 3 | 4 | 5 | 4 | 3.8 | |
| Energy manager lacks influence | 4 | 2 | 4 | 5 | 4 | 3.8 | |
| Long decision chain | 2 | 5 | 2 | 5 | 4 | 3.6 | |
| Energy efficiency not part of core activities | 4 | 3 | 3 | 3 | 4 | 3.4 | |
| Difficulties in collaborating between divisions | 3 | 4 | 2 | 4 | 4 | 3.4 | |
| Energy objectives not integrated into operating, maintenance, or purchasing procedures | 3 | 2 | 4 | 4 | 4 | 3.4 | |
| Department/workers not accountable for energy costs | 2 | 3 | 4 | 4 | 4 | 3.4 | |
| Conflicts of interest within the company | 3 | 3 | 3 | 3 | 4 | 3.2 | |
| No opportunities for improved energy management | 2 | 3 | 3 | 3 | 4 | 3 | |
| Uncertainty regarding the company’s future | 1 | 3 | 2 | 3 | 4 | 2.6 | |
| Information & behaviour | Lack of technical skills regarding energy efficient technology | 4 | 2 | 4 | 5 | 5 | 4 |
| Lack of internal expertise | 4 | 4 | 3 | 4 | 4 | 3.8 | |
| Lack of external expertise | 4 | 4 | 3 | 4 | 4 | 3.8 | |
| Lack of knowledge about daily operations | 3 | 4 | 3 | 4 | 5 | 3.8 | |
| Lack of staff awareness regarding energy issues | 5 | 4 | 3 | 3 | 4 | 3.8 | |
| Poor information quality regarding energy efficiency opportunities | 3 | 2 | 3 | 4 | 4 | 3.2 | |
| Staff reluctant to changes they have no experience of | 4 | 2 | 3 | 3 | 4 | 3.2 | |
| Difficult to obtain information on the energy use of purchased equipment | 3 | 1 | 4 | 4 | 3 | 3 | |
Table A2.
The foundries’ rating of the barriers. The table shows each respondent’s rating and the mean rating. The barriers are evaluated based on a Likert scale ranging from “Never important” (1) to “Always important” (5). The barriers within each category are ranked in descending order based on the mean rating. For barriers with the same mean rating, the ranking is based on the size of the variations in the respondents’ ratings (smaller variations are ranked higher since they indicate a more unanimous view on the importance of the barrier).
| Respondent | ||||||||||||||
|---|---|---|---|---|---|---|---|---|---|---|---|---|---|---|
| Category | Barrier | 6 | 7 | 8 | 9 | 10 | 11 | 12 | 13 | 14 | 15 | 16 | 17 | Mean |
| Technology | Risk of changes affecting product quality | 5 | 2 | 5 | 5 | 5 | 4 | 5 | 5 | 5 | 5 | 5 | 5 | 4.67 |
| Risk of changes affecting production capacity | 5 | 2 | 4 | 5 | 5 | 4 | 5 | 5 | 5 | 5 | 5 | 5 | 4.58 | |
| Technical risks such as risk of production disruption | 5 | 2 | 5 | 5 | 5 | 4 | 4 | 4 | 5 | 5 | 5 | 4 | 4.42 | |
| Technology is inappropriate at this site | 5 | 5 | 3 | 3 | 4 | 4 | 4 | 5 | 4 | 5 | 5 | 3 | 4.17 | |
| Technical lifetime of equipment decides when energy efficiency measures are implemented | 5 | 4 | 4 | 5 | 4 | 5 | 2 | 3 | 4 | 4 | 4 | 4 | 4 | |
| Risk of poor performance of purchased equipment or after changed working routines | 5 | 4 | 3 | 4 | 4 | 4 | 3 | 3 | 4 | 4 | 5 | 4 | 3.92 | |
| Lack of sub-metering on machine or division level | 5 | 2 | 3 | 5 | 4 | 4 | 2 | 3 | 4 | 3 | 3 | 3 | 3.42 | |
| Complex production processes | 5 | 4 | 3 | 1 | 4 | 4 | 3 | 4 | 1 | 5 | 4 | 3 | 3.42 | |
| Economics | Cost of production disruption | 5 | 5 | 4 | 3 | 5 | 5 | 4 | 5 | 5 | 4 | 4 | 4 | 4.42 |
| Uncertainties regarding future energy prices and economic policies | 5 | 5 | 3 | 4 | 4 | 4 | 3 | 5 | 5 | 3 | 3 | 5 | 4.08 | |
| Other priorities for capital investments | 5 | 5 | 3 | 3 | 3 | 4 | 5 | 4 | 4 | 3 | 5 | 3 | 3.92 | |
| Cost of identifying opportunities and analysing cost-effectiveness | 5 | 4 | 3 | 4 | 3 | 5 | 4 | 5 | 4 | 3 | 3 | 4 | 3.92 | |
| The benefits of energy efficiency are not expected to outweigh the costs | 5 | 4 | 3 | 3 | 4 | 4 | 3 | 5 | 3 | 4 | 5 | 3 | 3.83 | |
| Lack of access to capital | 5 | 5 | 3 | 4 | 2 | 4 | 4 | 4 | 3 | 5 | 3 | 4 | 3.83 | |
| Cost of staff replacement, retirement, and retraining | 5 | 5 | 3 | 3 | 3 | 5 | 2 | 5 | 3 | 3 | 3 | 4 | 3.67 | |
| Uncertainties regarding hidden or indirect costs | 5 | 4 | 2 | 5 | 3 | 4 | 3 | 5 | 3 | 3 | 3 | 3 | 3.58 | |
| Lack of budget funding for energy efficiency | 5 | 4 | 2 | 3 | 3 | 4 | 5 | 3 | 4 | 3 | 4 | 2 | 3.5 | |
| Lack of budget funding for energy management | 5 | 4 | 2 | 3 | 3 | 4 | 5 | 3 | 3 | 3 | 4 | 2 | 3.42 | |
| Organisation | Non-energy-related work tasks have higher priority | 5 | 5 | 3 | 3 | 3 | 3 | 5 | 5 | 4 | 3 | 4 | 3 | 3.83 |
| Lack of time or other priorities | 5 | 4 | 2 | 2 | 3 | 4 | 5 | 5 | 3 | 4 | 3 | 5 | 3.75 | |
| Slim organisation | 5 | 5 | 2 | 2 | 2 | 5 | 3 | 5 | 4 | 3 | 3 | 4 | 3.58 | |
| Energy efficiency not part of core activities | 5 | 3 | 3 | 4 | 3 | 3 | 4 | 5 | 3 | 2 | 3 | 4 | 3.5 | |
| No opportunities for improved energy management | 5 | 3 | 2 | 4 | 2 | 4 | 3 | 5 | 1 | 3 | 3 | 3 | 3.17 | |
| Energy objectives not integrated into operating, maintenance, or purchasing procedures | 5 | 4 | 3 | 2 | 3 | 4 | 2 | 5 | 1 | 3 | 3 | 3 | 3.17 | |
| Energy manager lacks influence | 5 | 3 | 2 | 5 | 2 | 4 | 3 | 4 | 1 | 3 | 3 | 2 | 3.08 | |
| Uncertainty regarding the company’s future | 5 | 3 | 3 | 3 | 2 | 4 | 3 | 2 | 1 | 2 | 4 | 4 | 3 | |
| Department/workers not accountable for energy costs | 5 | 3 | 2 | 5 | 2 | 3 | 2 | 4 | 1 | 2 | 4 | 2 | 2.92 | |
| Top management not prioritising energy issues | 5 | 3 | 2 | 2 | 2 | 4 | 4 | 4 | 1 | 3 | 1 | 3 | 2.83 | |
| Difficulties in collaborating between divisions | 5 | 3 | 2 | 2 | 2 | 4 | 3 | 2 | 1 | 2 | 1 | 2 | 2.42 | |
| Long decision chain | 5 | 3 | 2 | 2 | 2 | 3 | 3 | 2 | 1 | 2 | 2 | 1 | 2.33 | |
| Conflicts of interest within the company | 5 | 3 | 2 | 3 | 2 | 3 | 3 | 2 | 1 | 1 | 1 | 1 | 2.25 | |
| Information & behaviour | Lack of internal expertise | 5 | 3 | 3 | 3 | 3 | 3 | 4 | 5 | 4 | 3 | 3 | 4 | 3.58 |
| Lack of staff awareness regarding energy issues | 5 | 3 | 3 | 5 | 3 | 2 | 4 | 5 | 4 | 2 | 3 | 4 | 3.58 | |
| Poor information quality regarding energy efficiency opportunities | 5 | 3 | 2 | 4 | 3 | 4 | 4 | 5 | 3 | 3 | 3 | 3 | 3.5 | |
| Lack of technical skills regarding energy efficient technology | 5 | 3 | 3 | 3 | 3 | 3 | 4 | 5 | 4 | 3 | 2 | 4 | 3.5 | |
| Difficult to obtain information on the energy use of purchased equipment | 5 | 3 | 2 | 5 | 3 | 4 | 4 | 2 | 3 | 3 | 3 | 4 | 3.42 | |
| Lack of external expertise | 5 | 3 | 2 | 4 | 3 | 3 | 4 | 5 | 2 | 2 | 4 | 4 | 3.42 | |
| Staff reluctant to changes they have no experience of | 5 | 3 | 3 | 5 | 3 | 4 | 3 | 4 | 3 | 1 | 3 | 4 | 3.42 | |
| Lack of knowledge about daily operations | 5 | 3 | 3 | 4 | 3 | 2 | 2 | 3 | 2 | 3 | 3 | 3 | 3 | |
Table A3 and Table A4 show the rating of the drivers for the aluminium industry and the foundries, respectively. The tables show each respondent’s rating and the mean rating. The drivers within each category are ranked in descending order based on the mean rating. For drivers with the same mean rating, the ranking is based on the size of the variations in the respondents’ ratings (smaller variations are ranked higher since they indicate a more unanimous view on the importance of the driver).
Table A3.
The aluminium industry’s rating of the drivers. The table shows each respondent’s rating and the mean rating. The drivers are evaluated based on a Likert scale ranging from “Never important” (1) to “Always important” (5). The drivers within each category are ranked in descending order based on the mean rating. For drivers with the same mean rating, the ranking is based on the size of the variations in the respondents’ ratings (smaller variations are ranked higher since they indicate a more unanimous view on the importance of the driver).
| Respondent | |||||||
|---|---|---|---|---|---|---|---|
| Category | Driver | 1 | 2 | 3 | 4 | 5 | Mean |
| Economics | Cost reductions due to lower energy use | 4 | 5 | 4 | 5 | 5 | 4.6 |
| Improved work environment | 5 | 4 | 4 | 4 | 5 | 4.4 | |
| Access to capital/budget funding for energy efficiency | 3 | 5 | 4 | 4 | 5 | 4.2 | |
| Reduced power charge/avoid exceeding power peaks | 3 | 5 | 4 | 4 | 5 | 4.2 | |
| Reduced waste | 3 | 4 | 4 | 4 | 5 | 4 | |
| Reduced maintenance | 4 | 4 | 4 | 3 | 5 | 4 | |
| Threat of rising energy prices | 4 | 4 | 4 | 2 | 5 | 3.8 | |
| Investment subsidies for energy efficient technologies | 2 | 3 | 3 | 4 | 4 | 3.2 | |
| Incentive agreement/Third-party financing/Energy performance contracting | 2 | 2 | 4 | 3 | 2 | 2.6 | |
| Beneficial loans for energy efficiency investments | 2 | 2 | 3 | 2 | 3 | 2.4 | |
| Organisation | Full support from top management | 5 | 5 | 5 | 5 | 5 | 5 |
| Long-term energy strategy | 5 | 5 | 5 | 4 | 5 | 4.8 | |
| Demands from owners | 5 | 5 | 4 | 5 | 5 | 4.8 | |
| Well-functioning relations within organisation | 5 | 5 | 5 | 4 | 5 | 4.8 | |
| Environmental company profile | 5 | 3 | 4 | 4 | 5 | 4.2 | |
| Allocation of energy costs based on sub-metering | 4 | 4 | 5 | 4 | 4 | 4.2 | |
| Environmental management system | 5 | 4 | 5 | 2 | 5 | 4.2 | |
| Energy management system | 3 | 5 | 5 | 2 | 5 | 4 | |
| Quality or other management systems | 5 | 3 | 5 | 2 | 5 | 4 | |
| Information & behaviour | People with real ambition | 5 | 5 | 5 | 5 | 5 | 5 |
| Ability to make use of and spread individuals´ knowledge about support and production processes | 5 | 5 | 4 | 5 | 5 | 4.8 | |
| Access to internal expertise with knowledge about the processes | 4 | 5 | 5 | 5 | 5 | 4.8 | |
| Knowledge about daily operations | 5 | 5 | 5 | 4 | 5 | 4.8 | |
| Detailed support from energy experts when implementing energy efficiency investments | 4 | 5 | 4 | 4 | 4 | 4.2 | |
| Internal education | 4 | 4 | 4 | 4 | 5 | 4.2 | |
| Network outside company or company group | 4 | 4 | 4 | 4 | 4 | 4 | |
| Network within the sector or trade organisation | 4 | 4 | 4 | 4 | 4 | 4 | |
| Network within the company or company group | 3 | 4 | 4 | 5 | 4 | 4 | |
| Access to external expertise with knowledge about the processes | 2 | 4 | 4 | 5 | 5 | 4 | |
| Information and support through trade organisation | 3 | 4 | 4 | 4 | 4 | 3.8 | |
| General energy advice through seminars | 3 | 5 | 4 | 4 | 3 | 3.8 | |
| General energy advice through journal/brochure | 3 | 5 | 4 | 3 | 3 | 3.6 | |
| Local authority energy consultancy | 1 | 3 | 4 | 2 | 3 | 2.6 | |
| Market | International competition | 3 | 5 | 3 | 3 | 5 | 3.8 |
| Demands and questions from customers | 5 | 4 | 3 | 3 | 4 | 3.8 | |
| Pressure from different environmental NGOs | 3 | 3 | 3 | 3 | 3 | 3 | |
| ESCOs responsible for operation and maintenance of buildings | 2 | 2 | 3 | 3 | 3 | 2.6 | |
| Government & policy | Energy efficiency requirements due to current law (e.g., the Swedish Environmental Code) | 5 | 4 | 4 | 4 | 5 | 4.4 |
| EU ETS | 5 | 4 | 4 | 3 | 5 | 4.2 | |
| Demands for a conducted energy audit with proposed energy efficiency measures | 5 | 3 | 4 | 4 | 5 | 4.2 | |
| The municipality’s energy plan/energy strategy | 3 | 4 | 3 | 4 | 4 | 3.6 | |
| Electricity Certificate Systems | 3 | 3 | 4 | 3 | 5 | 3.6 | |
| Demands for efficiency from the Swedish county administrative boards | 4 | 2 | 4 | 3 | 5 | 3.6 | |
| Taxes (energy tax, carbon tax, etc.) | 4 | 1 | 4 | 4 | 5 | 3.6 | |
| Publicly financed energy audits by energy consultant or sector organisation | 3 | 3 | 3 | 4 | 4 | 3.4 | |
| Annual environmental report to the Swedish county administrative boards, including an energy plan and proposed efficiency measures | 4 | 2 | 4 | 3 | 4 | 3.4 | |
| Voluntary long-term agreements with tax exemption (PFE) | 3 | 2 | 4 | 3 | 5 | 3.4 | |
| Public sector as role model | 1 | 2 | 3 | 3 | 3 | 2.4 | |
Table A4.
The foundries’ rating of the drivers. The table shows each respondent’s rating and the mean rating. The drivers are evaluated based on a Likert scale ranging from “Never important” (1) to “Always important” (5). The drivers within each category are ranked in descending order based on the mean rating. For drivers with the same mean rating, the ranking is based on the size of the variations in the respondents’ ratings (smaller variations are ranked higher since they indicate a more unanimous view on the importance of the driver).
| Respondent | ||||||||||||||
|---|---|---|---|---|---|---|---|---|---|---|---|---|---|---|
| Category | Driver | 6 | 7 | 8 | 9 | 10 | 11 | 12 | 13 | 14 | 15 | 16 | 17 | Mean |
| Economics | Cost reductions due to lower energy use | 5 | 5 | 5 | 4 | 4 | 4 | 5 | 5 | 5 | 4 | 5 | 5 | 4.67 |
| Reduced power charge/avoid exceeding power peaks | 5 | 5 | 5 | 5 | 4 | 4 | 4 | 5 | 5 | 2 | 4 | 5 | 4.42 | |
| Improved work environment | 5 | 4 | 4 | 5 | 4 | 4 | 3 | 4 | 4 | 5 | 5 | 5 | 4.33 | |
| Reduced waste | 5 | 4 | 5 | 5 | 4 | 4 | 2 | 5 | 5 | 3 | 5 | 5 | 4.33 | |
| Reduced maintenance | 5 | 5 | 4 | 5 | 4 | 4 | 2 | 5 | 4 | 3 | 5 | 5 | 4.25 | |
| Threat of rising energy prices | 5 | 5 | 4 | 4 | 4 | 4 | 3 | 5 | 4 | 3 | 4 | 5 | 4.17 | |
| Access to capital/budget funding for energy efficiency | 5 | 4 | 3 | 3 | 4 | 4 | 5 | 5 | 3 | 3 | 4 | 5 | 4 | |
| Investment subsidies for energy efficient technologies | 5 | 5 | 2 | 2 | 4 | 4 | 4 | 5 | 4 | 2 | 3 | 4 | 3.67 | |
| Incentive agreement/Third-party financing/Energy performance contracting | 5 | 3 | 1 | 3 | 4 | 4 | 3 | 5 | 3 | 3 | 4 | 3 | 3.42 | |
| Beneficial loans for energy efficiency investments | 5 | 5 | 1 | 2 | 3 | 4 | 4 | 5 | 4 | 2 | 2 | 4 | 3.42 | |
| Organisation | Full support from top management | 5 | 4 | 4 | 5 | 4 | 4 | 5 | 5 | 2 | 4 | 5 | 3 | 4.17 |
| Quality or other management systems | 5 | 3 | 4 | 5 | 4 | 4 | 5 | 3 | 4 | 4 | 5 | 3 | 4.08 | |
| Long-term energy strategy | 5 | 4 | 4 | 5 | 4 | 4 | 2 | 4 | 5 | 3 | 5 | 3 | 4 | |
| Environmental management system | 5 | 4 | 4 | 5 | 4 | 4 | 3 | 3 | 4 | 3 | 5 | 3 | 3.92 | |
| Environmental company profile | 5 | 5 | 4 | 5 | 4 | 4 | 2 | 4 | 3 | 3 | 5 | 3 | 3.92 | |
| Well-functioning relations within organisation | 5 | 5 | 4 | 5 | 4 | 3 | 4 | 5 | 3 | 2 | 4 | 3 | 3.92 | |
| Energy management system | 5 | 3 | 4 | 5 | 4 | 4 | 2 | 4 | 4 | 3 | 5 | 3 | 3.83 | |
| Allocation of energy costs based on sub-metering | 5 | 4 | 4 | 5 | 4 | 4 | 2 | 4 | 3 | 2 | 3 | 3 | 3.58 | |
| Demands from owners | 5 | 2 | 4 | 5 | 4 | 4 | 2 | 4 | 2 | 3 | 4 | 3 | 3.5 | |
| Information & behaviour | Access to internal expertise with knowledge about the processes | 5 | 5 | 5 | 5 | 4 | 5 | 4 | 5 | 4 | 4 | 4 | 3 | 4.42 |
| Knowledge about daily operations | 5 | 5 | 4 | 5 | 4 | 4 | 4 | 5 | 4 | 4 | 4 | 3 | 4.25 | |
| Ability to make use of and spread individuals´ knowledge about support and production processes | 5 | 5 | 3 | 5 | 4 | 5 | 4 | 5 | 4 | 3 | 5 | 3 | 4.25 | |
| People with real ambition | 5 | 5 | 4 | 5 | 4 | 5 | 3 | 5 | 3 | 4 | 5 | 3 | 4.25 | |
| Internal education | 5 | 5 | 3 | 5 | 4 | 4 | 3 | 4 | 5 | 4 | 4 | 3 | 4.08 | |
| Access to external expertise with knowledge about the processes | 1 | 5 | 2 | 5 | 4 | 4 | 2 | 5 | 5 | 4 | 5 | 3 | 3.75 | |
| Detailed support from energy experts when implementing energy efficiency investments | 1 | 5 | 4 | 4 | 3 | 3 | 3 | 5 | 4 | 4 | 5 | 2 | 3.58 | |
| Information and support through trade organisation | 1 | 3 | 4 | 4 | 4 | 3 | 3 | 5 | 4 | 2 | 5 | 2 | 3.33 | |
| Network outside company or company group | 5 | 3 | 3 | 4 | 3 | 3 | 2 | 5 | 2 | 2 | 4 | 3 | 3.25 | |
| Network within the company or company group | 5 | 4 | 3 | 3 | 3 | 3 | 2 | 3 | 2 | 2 | 4 | 1 | 2.92 | |
| Network within the sector or trade organisation | 1 | 3 | 3 | 4 | 3 | 3 | 2 | 4 | 2 | 2 | 5 | 2 | 2.83 | |
| General energy advice through seminars | 1 | 4 | 2 | 4 | 3 | 3 | 2 | 3 | 3 | 2 | 4 | 1 | 2.67 | |
| Local authority energy consultancy | 1 | 4 | 2 | 4 | 3 | 3 | 2 | 1 | 3 | 2 | 4 | 2 | 2.58 | |
| General energy advice through journal/brochure | 1 | 3 | 2 | 2 | 3 | 3 | 2 | 3 | 3 | 2 | 4 | 1 | 2.42 | |
| Market | International competition | 5 | 5 | 3 | 4 | 3 | 5 | 4 | 5 | 4 | 2 | 5 | 4 | 4.08 |
| Demands and questions from customers | 5 | 2 | 4 | 4 | 4 | 5 | 5 | 2 | 3 | 2 | 5 | 5 | 3.83 | |
| Pressure from different environmental NGOs | 1 | 3 | 3 | 2 | 4 | 3 | 2 | 2 | 4 | 2 | 5 | 4 | 2.92 | |
| ESCOs responsible for operation and maintenance of buildings | 1 | 3 | 3 | 2 | 4 | 2 | 2 | 2 | 4 | 1 | 1 | 2 | 2.25 | |
| Government & policy | Taxes (energy tax, carbon tax, etc.) | 5 | 5 | 5 | 4 | 4 | 4 | 5 | 5 | 5 | 2 | 4 | 5 | 4.42 |
| Energy efficiency requirements due to current law (e.g. the Swedish Environmental Code) | 5 | 5 | 5 | 5 | 4 | 3 | 2 | 3 | 3 | 3 | 4 | 5 | 3.92 | |
| Voluntary long-term agreements with tax exemption (PFE) | 5 | 5 | 3 | 2 | 4 | 4 | 4 | 4 | 3 | 2 | 3 | 5 | 3.67 | |
| Publicly financed energy audits by energy consultant or sector organisation | 2 | 5 | 4 | 2 | 4 | 3 | 4 | 4 | 4 | 3 | 3 | 3 | 3.42 | |
| Electricity Certificate Systems | 5 | 1 | 3 | 2 | 4 | 4 | 2 | 3 | 4 | 2 | 4 | 5 | 3.25 | |
| Demands for a conducted energy audit with proposed energy efficiency measures | 2 | 4 | 5 | 3 | 4 | 3 | 2 | 3 | 3 | 2 | 4 | 3 | 3.17 | |
| Annual environmental report to the Swedish county administrative boards, including an energy plan and proposed efficiency measures | 2 | 3 | 3 | 3 | 4 | 3 | 2 | 3 | 3 | 3 | 5 | 3 | 3.08 | |
| Demands for efficiency from the Swedish county administrative boards | 2 | 3 | 3 | 2 | 4 | 3 | 2 | 4 | 4 | 3 | 3 | 3 | 3 | |
| EU ETS | 5 | 1 | 3 | 2 | 4 | 3 | 2 | 3 | 3 | 1 | 4 | 4 | 2.92 | |
| The municipality’s energy plan/energy strategy | 2 | 4 | 3 | 2 | 3 | 3 | 2 | 3 | 3 | 2 | 3 | 3 | 2.75 | |
| Public sector as role model | 1 | 4 | 3 | 1 | 2 | 3 | 2 | 1 | 2 | 2 | 1 | 3 | 2.08 | |
Table A5 and Table A6 show the rating of the usefulness of the information sources on energy efficiency measures for the aluminium industry and the foundries, respectively. The tables show each respondent’s rating and the mean rating. The information sources are ranked in descending order based on the mean rating. For information sources with the same mean rating, the ranking is based on the size of the variations in the respondents’ ratings (smaller variations are ranked higher since they indicate a more unanimous view on the importance of the information source).
Table A5.
The aluminium industry’s rating of the usefulness of information sources on energy efficiency measures. The table shows each respondent’s rating and the mean rating. The usefulness is evaluated based on a Likert scale ranging from “Do not use” (1) to “Excellent” (5). The information sources are ranked in descending order based on the mean rating. For information sources with the same mean rating, the ranking is based on the size of the variations in the respondents’ ratings (smaller variations are ranked higher since they indicate a more unanimous view on the importance of the information source).
| Respondent | ||||||
|---|---|---|---|---|---|---|
| Information Source | 1 | 2 | 3 | 4 | 5 | Mean |
| Trade organisation | 4 | 5 | 4 | 4 | 5 | 4.4 |
| Colleagues within sector | 4 | 3 | 3 | 4 | 5 | 3.8 |
| Conferences and seminars | 3 | 4 | 4 | 5 | 3 | 3.8 |
| The Swedish Energy Agency | 3 | 4 | 4 | 3 | 4 | 3.6 |
| Energy audits | 5 | 2 | 4 | 3 | 4 | 3.6 |
| Written information sources (e.g., journals) | 4 | 3 | 4 | 2 | 3 | 3.2 |
| Colleagues within company or company group | 5 | 2 | 2 | 3 | 4 | 3.2 |
| Product information from suppliers | 1 | 3 | 4 | 2 | 4 | 2.8 |
| Consultants (performing energy audits) | 4 | 2 | 1 | 4 | 3 | 2.8 |
| Information from energy companies | 3 | 1 | 3 | 2 | 4 | 2.6 |
| The Swedish county administrative boards | 2 | 1 | 4 | 2 | 3 | 2.4 |
| Municipality | 2 | 1 | 3 | 2 | 2 | 2 |
Table A6.
The foundries’ rating of the usefulness of information sources on energy efficiency measures. The table shows each respondent’s rating and the mean rating. The usefulness is evaluated based on a Likert scale ranging from “Do not use” (1) to “Excellent” (5). The two partial answers did not include answers to this question. The information sources are ranked in descending order based on the mean rating. For information sources with the same mean rating, the ranking is based on the size of the variations in the respondents’ ratings (smaller variations are ranked higher since they indicate a more unanimous view on the importance of the information source).
| Respondent | |||||||||||
|---|---|---|---|---|---|---|---|---|---|---|---|
| Information Source | 6 | 7 | 8 | 9 | 10 | 11 | 12 | 13 | 14 | 15 | Mean |
| Colleagues within sector | 5 | 3 | 3 | 4 | 3 | 4 | 4 | 2 | 4 | 5 | 3.7 |
| Colleagues within company or company group | 5 | 2 | 4 | 3 | 3 | 3 | 4 | 2 | 4 | 5 | 3.5 |
| Energy audits | 3 | 2 | 4 | 5 | 3 | 3 | 4 | 3 | 3 | 4 | 3.4 |
| Consultants (performing energy audits) | 1 | 2 | 4 | 4 | 3 | 3 | 4 | 3 | 3 | 5 | 3.2 |
| Trade organisation | 5 | 3 | 3 | 3 | 3 | 1 | 4 | 2 | 2 | 5 | 3.1 |
| Product information from suppliers | 5 | 1 | 4 | 2 | 3 | 4 | 3 | 2 | 4 | 2 | 3 |
| Information from energy companies | 5 | 1 | 2 | 2 | 3 | 4 | 3 | 2 | 3 | 3 | 2.8 |
| The Swedish Energy Agency | 4 | 1 | 3 | 3 | 3 | 1 | 2 | 2 | 3 | 4 | 2.6 |
| The Swedish county administrative boards | 3 | 1 | 3 | 2 | 3 | 2 | 2 | 2 | 4 | 3 | 2.5 |
| Municipality | 3 | 1 | 3 | 2 | 3 | 2 | 2 | 2 | 4 | 2 | 2.4 |
| Written information sources (e.g., journals) | 1 | 1 | 3 | 2 | 3 | 3 | 2 | 2 | 4 | 3 | 2.4 |
| Conferences and seminars | 1 | 3 | 2 | 2 | 3 | 2 | 2 | 2 | 3 | 2 | 2.2 |
Table A7 shows some information about the companies. The number of employees in the aluminium industry companies ranges from 104 to 1100, with all except one having more than 400 employees. The number of employees for the foundries ranges from 15 to 224, with 60% having fewer than 45 employees and 40% having 100 employees or more. The approximate annual turnover for the companies in the aluminium industry ranges from 1200 to 4000 MSEK and from 16 to 597 MSEK for the foundries, of which all except one is below 200 MSEK/year.
Table A7.
Information about the companies. The two partial answers did not include answers to these questions.
Table A7.
Information about the companies. The two partial answers did not include answers to these questions.
| Has the Company Been Profitable the Past Three Years? | Payback Criteria for Energy Efficiency Measures | Has the Company a Written Long-Term Energy Strategy? | How Are Energy Costs Allocated among Divisions? | |
|---|---|---|---|---|
| Aluminium industry | ||||
| Respondent 1 | All 3 years | <3 years | Yes | Sub-metering |
| Respondent 2 | 2 of 3 years | <3 years | No | Sub-metering |
| Respondent 3 | All 3 years | Other 1 | Yes | Sub-metering |
| Respondent 4 | All 3 years | <3 years | No | Sub-metering |
| Respondent 5 | All 3 years | <2 years | Yes | Sub-metering |
| Foundries | ||||
| Respondent 6 | All 3 years | <2 years | Yes | Sub-metering |
| Respondent 7 | None of the years | Missing | Yes | Sub-metering |
| Respondent 8 | 1 of 3 years | Missing | Yes | Sub-metering |
| Respondent 9 | All 3 years | <3 years | Yes | Other 2 |
| Respondent 10 | All 3 years | Missing | No | Not allocated |
| Respondent 11 | All 3 years | <1 year | No | Sub-metering |
| Respondent 12 | None of the years | Missing | No | Not allocated |
| Respondent 13 | 2 of 3 years | Missing | No | Not allocated |
| Respondent 14 | 1 of 3 years | Missing | No | Sub-metering |
| Respondent 15 | All 3 years | >3 years | No | Not allocated |
1 The respondent stated that it depends on the investment. 2 Based on the number of working hours.
References
- United Nations. Paris Agreement; UNFCC: Bonn, Germany, 2015. [Google Scholar]
- International Energy Agency. Industry: Tracking Clean Energy Progress. Available online: https://www.iea.org/tcep/industry/ (accessed on 13 February 2019).
- International Energy Agency. Energy Technology Perspectives 2017: Catalysing Energy Technology Transformation; IEA: Paris, France, 2017. [Google Scholar]
- Thollander, P.; Ottosson, M. An energy efficient Swedish pulp and paper industry: Exploring barriers to and driving forces for cost-effective energy efficiency investments. Energy Effic. 2008, 1, 21–34. [Google Scholar] [CrossRef]
- Nehler, T.; Parra, R.; Thollander, P. Implementation of energy efficiency measures in compressed air systems: Barriers, drivers and non-energy benefits. Energy Effic. 2018, 11, 1281–1302. [Google Scholar] [CrossRef]
- Rohdin, P.; Thollander, P.; Solding, P. Barriers to and drivers for energy efficiency in the Swedish foundry industry. Energy Policy 2007, 35, 672–677. [Google Scholar] [CrossRef]
- Rohdin, P.; Thollander, P. Barriers to and driving forces for energy efficiency in the non-energy intensive manufacturing industry in Sweden. Energy 2006, 31, 1836–1844. [Google Scholar] [CrossRef]
- Backlund, S.; Thollander, P.; Palm, J.; Ottosson, M. Extending the energy efficiency gap. Energy Policy 2012, 51, 392–396. [Google Scholar] [CrossRef]
- Jaffe, A.B.; Stavins, R.N. The energy-efficiency gap: What does it mean? Energy Policy 1994, 22, 804–810. [Google Scholar] [CrossRef]
- Sorrell, S.; Schleich, J.; Scott, S.; O’Malley, E.; Trace, F.; Boede, E.; Ostertag, K.; Radgen, P. Reducing Barriers to Energy Efficiency in Public and Private Organizations; University of Sussex: Sussex, UK, 2000. [Google Scholar]
- Johansson, M.T. Improved energy efficiency within the Swedish steel industry: The importance of energy management and networking. Energy Effic. 2015, 8, 713–744. [Google Scholar] [CrossRef]
- Thollander, P.; Palm, J. Improving Energy Efficiency in Industrial Energy Systems: An Interdisciplinary Perspective on Barriers, Energy Audits, Energy Management, Policies, and Programs; Springer: London, UK; New York, NY, USA, 2013. [Google Scholar]
- Trygg, L.; Thollander, P.; Backlund, S.; Olsson, L. Uthålliga Energisystem i Praktiken: Implementering av Energieffektivitet Inom Industrier (Sustainable Energy Systems in Practice: Implementation of Energy Efficiency in Industries) (In Swedish); Linköping University: Linköping, Sweden, 2010. [Google Scholar]
- Sudhakara Reddy, B. Barriers and drivers to energy efficiency—A new taxonomical approach. Energy Convers. Manag. 2013, 74, 403–416. [Google Scholar] [CrossRef]
- Trianni, A.; Cagno, E.; Marchesani, F.; Spallina, G. Classification of drivers for industrial energy efficiency and their effect on the barriers affecting the investment decision-making process. Energy Effic. 2017, 10, 199–215. [Google Scholar] [CrossRef]
- Reddy, A.K.N. Barriers to improvements in energy efficiency. Energy Policy 1991, 19, 953–961. [Google Scholar] [CrossRef]
- Hasanbeigi, A.; Menke, C.; du Pont, P. Barriers to energy efficiency improvement and decision-making behavior in Thai industry. Energy Effic. 2010, 3, 33–52. [Google Scholar] [CrossRef]
- Trianni, A.; Cagno, E.; Worrell, E.; Pugliese, G. Empirical investigation of energy efficiency barriers in Italian manufacturing SMEs. Energy 2013, 49, 444–458. [Google Scholar] [CrossRef]
- Timilsina, G.R.; Hochman, G.; Fedets, I. Understanding energy efficiency barriers in Ukraine: Insights from a survey of commercial and industrial firms. Energy 2016, 106, 203–211. [Google Scholar] [CrossRef]
- Hassan, M.T.; Burek, S.; Asif, M. Barriers to Industrial Energy Efficiency Improvement—Manufacturing SMEs of Pakistan. Energy Procedia 2017, 113, 135–142. [Google Scholar] [CrossRef]
- Cagno, E.; Trianni, A. Evaluating the barriers to specific industrial energy efficiency measures: An exploratory study in small and medium-sized enterprises. J. Clean. Prod. 2014, 82, 70–83. [Google Scholar] [CrossRef]
- Singh, R.; Lalk, J. An investigation into the barriers to energy efficiency within medium to large manufacturing firms operating within the Ethekwini municipal area. S. Afr. J. Ind. Eng. 2016, 27, 287–302. [Google Scholar] [CrossRef][Green Version]
- Manrique, R.; Vásquez, D.; Vallejo, G.; Chejne, F.; Amell, A.A.; Herrera, B. Analysis of barriers to the implementation of energy efficiency actions in the production of ceramics in Colombia. Energy 2018, 143, 575–584. [Google Scholar] [CrossRef]
- Venmans, F. Triggers and barriers to energy efficiency measures in the ceramic, cement and lime sectors. J. Clean. Prod. 2014, 69, 133–142. [Google Scholar] [CrossRef]
- Kostka, G.; Moslener, U.; Andreas, J. Barriers to increasing energy efficiency: Evidence from small-and medium-sized enterprises in China. J. Clean. Prod. 2013, 57, 59–68. [Google Scholar] [CrossRef]
- Cagno, E.; Trianni, A.; Abeelen, C.; Worrell, E.; Miggiano, F. Barriers and drivers for energy efficiency: Different perspectives from an exploratory study in the Netherlands. Energy Convers. Manag. 2015, 102, 26–38. [Google Scholar] [CrossRef]
- Walsh, C.; Thornley, P. Barriers to improving energy efficiency within the process industries with a focus on low grade heat utilisation. J. Clean. Prod. 2012, 23, 138–146. [Google Scholar] [CrossRef]
- Trianni, A.; Cagno, E. Dealing with barriers to energy efficiency and SMEs: Some empirical evidences. Energy 2012, 37, 494–504. [Google Scholar] [CrossRef]
- Soepardi, A.; Pratikto, P.; Santoso, P.B.; Tama, I.P.; Thollander, P. Linking of barriers to energy efficiency improvement in Indonesia’s steel industry. Energies 2018, 11, 234. [Google Scholar] [CrossRef]
- Trianni, A.; Cagno, E.; Farné, S. Barriers, drivers and decision-making process for industrial energy efficiency: A broad study among manufacturing small and medium-sized enterprises. Appl. Energy 2016, 162, 1537–1551. [Google Scholar] [CrossRef]
- Trianni, A.; Cagno, E.; Farnè, S. An empirical investigation of barriers, drivers and practices for energy efficiency in primary metals manufacturing SMEs. Energy Procedia 2014, 61, 1252–1255. [Google Scholar] [CrossRef]
- Soepardi, A.; Thollander, P. Analysis of relationships among organizational barriers to energy efficiency improvement: A case study in Indonesia’s steel industry. Sustainability 2018, 10, 216. [Google Scholar] [CrossRef]
- Apeaning, R.W.; Thollander, P. Barriers to and driving forces for industrial energy efficiency improvements in African industries—A case study of Ghana’s largest industrial area. J. Clean. Prod. 2013, 53, 204–213. [Google Scholar] [CrossRef]
- Haraldsson, J.; Johansson, M.T. Review of measures for improved energy efficiency in production-related processes in the aluminium industry—From electrolysis to recycling. Renew. Sustain. Energy Rev. 2018, 93, 525–548. [Google Scholar] [CrossRef]
- Statistics Sweden. Swedish Standard Industrial Classification (SNI). Available online: https://www.scb.se/en/documentation/classifications-and-standards/swedish-standard-industrial-classification-sni/ (accessed on 13 February 2019).
- Statistics Sweden. Sökning Efter SNI-kod (Search by SNI-code) (In Swedish). Available online: http://www.sni2007.scb.se/ (accessed on 12 February 2019).
- Haraldsson, J.; Johansson, M.T. Impact analysis of energy efficiency measures in the electrolysis process in primary aluminium production. In Proceedings of the 3rd International Conference on Energy, Environment and Economics, Edinburgh, UK, 14–16 August 2018; pp. 177–184. [Google Scholar]
- European Integrated Pollution Prevention and Control Bureau. Best Available Technique (BAT) Reference Document for the Non-Ferrous Metals Industries; European Commission’s Joint Research Centre: Seville, Spain, 2014. [Google Scholar]
- Dismukes, D.E.; Layne, M.; Snyder, B.F. Understanding the challenges of industrial carbon capture and storage: An example in a U.S. petrochemical corridor. Int. J. Sustain. Energy 2019, 38, 13–23. [Google Scholar] [CrossRef]
- Kashintseva, V.; Strielkowski, W.; Streimikis, J.; Veynbender, T. Consumer attitudes towards industrial CO2 capture and storage products and technologies. Energies 2018, 11, 2787. [Google Scholar] [CrossRef]
- Linzenich, A.; Arning, K.; Offermann-van Heek, J.; Ziefle, M. Uncovering attitudes towards carbon capture storage and utilization technologies in Germany: Insights into affective-cognitive evaluations of benefits and risks. Energy Res. Soc. Sci. 2019, 48, 205–218. [Google Scholar] [CrossRef]
- Brown, T.J.; Idoine, N.E.; Raycraft, E.R.; Shaw, R.A.; Hobbs, S.F.; Everett, P.; Deady, E.A.; Bide, T. World Mineral Production 2012–2016; British Geological Survey: Keyworth, UK, 2018.
- U.S. Geological Survey. Mineral Commodity Summaries 2018; U.S. Geological Surveys: Reston, VA, USA, 2018.
- Bertram, M.; Ramkumar, S.; Rechberger, H.; Rombach, G.; Bayliss, C.; Martchek, K.J.; Müller, D.B.; Liu, G. A regionally-linked, dynamic material flow modelling tool for rolled, extruded and cast aluminium products. Resour. Conserv. Recycl. 2017, 125, 48–69. [Google Scholar] [CrossRef]
- The Swedish Foundry Association. The Swedish Foundry Association’s Homepage (In Swedish). Available online: http://www.gjuteriforeningen.se/ (accessed on 5 February 2019).
- Brunke, J.C.; Johansson, M.T.; Thollander, P. Empirical investigation of barriers and drivers to the adoption of energy conservation measures, energy management practices and energy services in the Swedish iron and steel industry. J. Clean. Prod. 2014, 84, 509–525. [Google Scholar] [CrossRef]
- Thollander, P.; Danestig, M.; Rohdin, P. Energy policies for increased industrial energy efficiency: Evaluation of a local energy programme for manufacturing SMEs. Energy Policy 2007, 35, 5774–5783. [Google Scholar] [CrossRef]
- Trianni, A.; Cagno, E.; Thollander, P.; Backlund, S. Barriers to industrial energy efficiency in foundries: A European comparison. J. Clean. Prod. 2013, 40, 161–176. [Google Scholar] [CrossRef]
- Thollander, P.; Backlund, S.; Trianni, A.; Cagno, E. Beyond barriers: A case study on driving forces for improved energy efficiency in the foundry industries in Finland, France, Germany, Italy, Poland, Spain, and Sweden. Appl. Energy 2013, 111, 636–643. [Google Scholar] [CrossRef]
- Johansson, M.T.; Thollander, P. A review of barriers to and driving forces for improved energy efficiency in Swedish industry: Recommendations for successful in-house energy management. Renew. Sustain. Energy Rev. 2018, 82, 618–628. [Google Scholar] [CrossRef]
- Lawrence, A.; Nehler, T.; Andersson, E.; Karlsson, M.; Thollander, P. Drivers, barriers and success factors for energy management in the Swedish pulp and paper industry. J. Clean. Prod. 2019, 223, 67–82. [Google Scholar] [CrossRef]
- Batterham, R.J. Opportunities for improvements in alumina production: Balancing incremental and breakthrough innovation. In Proceedings of the 26th International Mineral Processing Congress, Innovative Processing for Sustainable Growth, New Dehli, India, 24–28 September 2012; pp. 396–411. [Google Scholar]
- Bailey, I.; Ditty, C. Energy markets, capital inertia and economic instrument impacts. Clim. Policy 2009, 9, 22–39. [Google Scholar] [CrossRef]
- Su, M.; Deng, J.; He, J. Energy efficiency and CO2 abatement in China township and village foundries. Int. J. Glob. Energy Issues 2004, 21, 69–78. [Google Scholar] [CrossRef]
- Nagesha, N.; Balachandra, P. Barriers to energy efficiency in small industry clusters: Multi-criteria-based prioritization using the analytic hierarchy process. Energy 2006, 31, 1633–1647. [Google Scholar] [CrossRef]
- Haraldsson, J.; Johansson, M.T. Energy efficiency in the supply chains of the aluminium industry: The cases of five products made in Sweden. Energies 2019, 12, 245. [Google Scholar] [CrossRef]
- Bryman, A. Samhällsvetenskapliga Metoder Social Research Methods; Liber AB: Malmö, Sweden, 2011. [Google Scholar]
- International Energy Agency. Law on Energy Audits in Large Companies. Available online: https://www.iea.org/policiesandmeasures/pams/sweden/name-167642-en.php (accessed on 7 January 2019).
- The Swedish Energy Agency. Stöd För Energikartläggning i Små Och Medelstora Företag (Support for Energy Audits in Small- and Medium-Sized Companies) (In Swedish). Available online: http://www.energimyndigheten.se/nrp/stod-for-energikartlaggning-i-sma-och-medelstora-foretag/ (accessed on 7 January 2019).
© 2019 by the authors. Licensee MDPI, Basel, Switzerland. This article is an open access article distributed under the terms and conditions of the Creative Commons Attribution (CC BY) license (http://creativecommons.org/licenses/by/4.0/).