1. Introduction
Urban transit transportation plays an important role in the sustainability of the economy, environment, and even the whole society, as it helps to improve traffic resource efficiency and effectively alleviate the contradiction between traffic supply and demand [
1,
2]. In particular, reasonable network structures contribute to reduce road congestion, travel difficulties, and related environmental problems such as air and noise pollution [
3,
4]. With the reduction of traffic congestion, a lot of energy and non-renewable resources can be saved, and traffic accidents, related deaths and injuries, direct and indirect economy losses can be avoided [
5,
6].
Although the contributions of urban transit transportation to sustainability are significant, the holistic construction of a public transportation system for many cities is seriously lagging behind [
7,
8]. Especially, with the increasing number of private cars, the proportion of transit transportation has declined and been replaced by other modes with low resource utilization ratios. It therefore results in increasing travel time by public transportation and lowering the service level of it. This problem is extremely obvious in China, where the proportion of people choosing public transportation in the world’s major developed cities is between 45% and 60%, while that in China is less than 30% [
9].
The methods in the realm of complex networks and systems are well developed and applied in transport systems. System dynamics as an important branch of system science was used to consider the transportation supply and demand dynamic balance and their interaction with urban development [
10]. Due to the comprehensive consideration of sustainability problems, modern control theory has been applied in the fields of transportation [
11,
12]. The former has applicability and superiority in dealing with complex interactions, especially urban traffic complexities. The latter plays an important part in transportation management control. These two methods inspire systematic studies on urban transit transportation networks.
An urban public transport network can be viewed as a complex system of the urban transport system and socio-economic environment. Both the transportation department administration and professional scholars are working hard to explore how to improve the performance of the system, so that it can provide transportation services that are smooth, convenient, and environmentally friendly [
5]. Urban transit transportation networks present the characteristics of complex systems. Complex network theory is a favorable method for studying complex systems. It emphasizes the topological nature of system architecture; complex networks provide a theoretical approach to the study of complexity [
13,
14]. Complex theory based on multidisciplinary knowledge can be used to study the complexity of urban transit transportation networks, so a network’s space–time complexity and evolution mechanism can be explored. It provides theoretical guidance for the scientific planning of urban public transport structures. Complex networks highlight the topological characteristics of the system structure. Because the geometric properties of complex systems play a primary role in the network’s dynamic behavior, public transportation can be depicted by traffic flows on complex networks involving bus lines and docking stations. Therefore, the advantages and disadvantages of the public transport network’s structure have greatly affected the efficiency of passenger transportation in the entire public transport system. The topology of the public transport network deserves further research. By analyzing the characteristics of the existing network, a better public transportation system can be designed, and thus its utility can be improved [
15,
16].
Research on the complexity of urban transportation networks generally focus on the structural characteristics of transportation networks’ topology. Additionally, it is increasingly important to analyze the impact of network structure on traffic. Different urban transportation networks may call for specific theoretical guidance for planning, design, and management. Research on these areas help to explore general rules and special features for different types of cities. Evolutionary mechanisms of urban transportation networks can be achieved, and the time and space complexity of networks can be explored [
5].
In summary, the research on urban public transport networks’ complexity is still in its early stage. Although the research on urban public transport network models have provided the basic statistical characteristics of the network, the models rarely consider the spatial features of the transit transportation network. This study looks at the urban transit network’s topology features from the perspective of complexity, measures the hierarchical relationship of nodes in the network, develops an optimization method based on complexity features presenting an effective method to improve the utilization rate of the urban public transport system, cut down traffic congestion, and reduce environmental pollution. The Xi’an urban bus network was chosen for its representation. Due to the presence of historical reasons, the layout of the road network in Xi’an is believed to be unreasonable. The population in the central area of the city is dense; the distribution of the population and road space is extremely uneven; the construction of transportation facilities is restricted; and the transit network has serious structural defects [
17]. Additionally, the total construction of the public transportation system is seriously lagging behind, and the proportion of the structure is out of balance. Compared with other developed and advanced large cities around the world, Xi’an, as a new rising first-tier large city in China, is going to achieve a large increase in economy and transportation which means the public transportation is going to face challenges as well. How to optimize the network structure and make it consistent with economic and social development is not only meaningful and valuable for Xi’an, but for similar urban transportation systems around the world.
The rest of the manuscript is organized as follows:
Section 2 presents a review on related studies;
Section 3 introduces the methods used for urban transit network properties analysis;
Section 4 explains the data sources and network construction images, and presents the urban public transportation network’s features;
Section 5 focuses on the formulation and optimization of the sustainable public transportation network design.
Section 6 demonstrates the discussions on improvement of sustainable public transportation networks. Finally, conclusions and further research prospects are presented in
Section 7.
2. Literature Review
Complex network theory can be used to capture and describe the evolutionary mechanisms, laws and functions of systems by means of graph theory and some statistics methods [
13,
18]. At the end of the 20th century, the study of complex network theory was no longer limited to the field of mathematics. Scholars began to consider the overall characteristics of a large number of actual networks with complex connections. Two groundbreaking articles have been recognized as the beginning of a new era of complex network research. One is entitled “Collective Dynamics of ‘Small-world’ Networks” [
19]. The other is entitled “Emergence of Scaling in Random Networks” [
20]. These two articles reveal the small-world characteristics and scale-free nature of complex networks, and establish corresponding models to illustrate the mechanisms of these characteristics. With the extensive research on complex systems, the research on the real world from various perspectives has spread to many disciplines and fields, such as cooperation networks in social networks, company directors’ networks, research citation networks, language networks, and computer technologies networks, the neural network, the power network, telephone networks, and urban transportation networks, etc. [
21].
Applying complex network theory to analyze the complexity of urban transportation network topology is a key to the study of complex urban transportation networks, and it is also one of the basic issues of urban transportation network research. It has been gradually realized that it is not enough to use some local data for traffic analysis and road planning to solve traffic congestion in cities. It is necessary to conduct a comprehensive analysis of the routes or the road network.
In recent years, research on weighted networks have been rapidly developed. Weighted networks introduce weight as a dimension to distinguish the difference between edges, as the strength between network nodes may be different. In 2006, Boccaletti [
22] published the latest review on complex network research. Complex weighted networks can describe actual complex systems. At present, the research work on weighted networks mainly focuses on modeling research [
23], complex characteristics [
24], and dynamics on complex-weighted networks [
22]. The results of some studies in many practical weighted networks have shown that vertex weight and edge weight also follow the power-law distribution. After giving weights to the connections, it provides a new method for characterizing the system. Adjusting the weights also provides a new means for optimizing the nature of the network and its functions. Complex networks are also important for the prediction and processing of emergencies. The network is found to be stable after the nodes are randomly deleted, but if the key connectivity nodes in the network are deleted, the network is easily destroyed [
18].
Many scholars have conducted a lot of theoretical studies and empirical analyses of complex networks. The existing research mainly focuses on the empirical analysis of subways, streets, and public transportation networks, and studies the basic topology of the network, like the degree distribution, mean shortest distance, clustering system, etc. Latora and Marchiori carried out a preliminary study of the network characteristics of the Boston Metro [
25]. Sen et al. studied the small-world characteristics of the Indian railway network [
26]. Seaton et al. calculated the small world effect of the railway line network between Boston and Vienna [
27]. Sienkiewicz analyzed the topological characteristics of the bus transportation network in 22 cities in Poland, and then further analyzed the clustering, match degree, and median characteristics of the Polish urban public transportation network [
28]. The complex-weighted network has also received widespread attention in recent years. Li et al. [
29], Bagler et al. [
30], Barrat et al. [
31], and Guimera et al. [
32] studied the weighted network characteristics of airports in China, India, and the world, respectively. Among them, Barrat et al. [
31] used real-world data to deeply explore the correlation between weights and topologies in weighted networks, and introduced the definition of some characteristics in weighted networks. Domestically, the complexity of urban transport networks has just begun. Wu and Gao [
33] carried out theoretical and empirical research on complex networks earlier, and analyzed the scale-free characteristics of the Beijing public transport network. Wei et al. [
34], Di [
35], Zhao et al. [
36], Zhang [
17], and Zheng et al. [
37] carried out empirical studies on urban transit transportation networks in Chengdu, Tianjin, and Xi’an based on complex network theory. These studies have shown that urban transportation networks have the structural characteristics of complex networks.
To sum up, although the research on networks has developed rapidly [
38,
39], it still faces many challenges in the study of urban public transportation. As far as urban public transportation is concerned, the existing research has just started, and there are still many problems to be solved. The characteristics of different network topologies need to be further analyzed. In particular, it is necessary to theoretically explore models that can optimize the network.
3. Method
The nature of the network that does not depend on the specific location of the node and the specific form of the edge can be described by the topological property. The corresponding structure is called the topology of the network. Topological parameters, also known as the static geometry of the network, are the basis for studying complex networks [
13]. This study focuses on the four most important topological parameters of the network according to complex theory: degree distribution, path length, clustering coefficient, and betweenness. Two software, UCINET [
40] and Netdraw [
41], are used to obtain the regarding results and visual picture. The former is one of the most popular social network analysis software tools. It includes centrality analysis, cluster analysis, and statistical analysis, etc. Netdraw is generally used for visualization. It is integrated within UCINET software.
3.1. Node Degree
Node degree
is defined as the number of connections to the node and is the basic parameter for studying the topology of a complex network [
24,
42], as denoted by Equation (1). In Equation (1),
is the total number of nodes,
indicates whether node
and
are connected or not. Here,
means that
and
are connected, while
means no connection. The average node degree of the network composed of
nodes is given in Equation (2). If the node is randomly selected from the network, the probability of degree
is
. Then, denote
as the network degree distribution, which shows the change of
according to the value of
.
In the actual bus network analysis process, the node degree indicator indicates the number of bus routes directly connected to the station. The greater the node degree, the more bus lines are connected. This indicator describes the extent to which the site has a direct impact on other connected lines. The results of complex network research indicate that subsequent bus routes tend to be connected to sites with higher node degrees.
3.2. Path Length
In a complex network, the number of edges included in a route between any two points represents the path length of these two points. The average of the shortest path lengths between any two points reflects the size of the network, called the feature path length. If there is no path between the two points, the path length between the two points is infinite.
The length of the feature path is computed by Equation (3). In Equation (3),
is the length of the network feature;
refers to the number of network nodes; and
is the path length between two points. The maximum path length between all pairs of nodes represents the diameter of the network. The path length and network diameter measure the transmission performance and efficiency of the network.
3.3. Clustering Coefficient
Given a node in the network, all nodes associated with the node form a sub-network. is the ratio of the number of arcs in the sub-network to the number of all possible arcs in the sub-network, and is the average of all .
The clustering coefficient can show the aggregation of nodes in the network, i.e., how close is the network. In real-world networks, especially in specific networks, nodes tend to establish a tight set of organizational relationships due to the relative high-density connection points. In public transportation networks, the distribution of the clustering coefficient means the bus lines’ intensity near each station, and the average of the clustering coefficient depicts the intensity of the bus lines in the entire transportation network. Doragovtsev [
43] pointed out that there are three different parameters for measuring cohesion characteristics, namely:
(1) Local clustering coefficient . In Equation (4), denotes the average connections between neighbors of the node with degree .
(2) Average clustering coefficient. In Equation (5), is the distribution of the node degree .
(3) Clustering coefficient. In Equation (6),
shows the second moment of node degree, while
indicates the average node degree. This manuscript uses the average clustering coefficient to measure the aggregation characteristics of urban public transit networks.
3.4. Betweenness (b)
The betweenness of node
is defined as Equation (7), where
is the number of all the shortest paths connecting the nodes
and
, and
is the number of paths passing through the node
among these paths. Similarly, the number of shortest paths through a certain edge can be used to define the betweenness of the edges.
4. Evaluation of Transportation Network Properties
4.1. Network Data
4.1.1. Assumptions
Some hypotheses are made before the study, as follows:
(1) Sites with the same name are treated as one docking site, and sites with different names are treated as different docking sites. Ignore the case where the individual docking sites have the same name but different docking locations.
(2) Ignore the situation that the uplink and downlink lines are different, and abstract the urban bus network into an undirected network. That is, if the site A can be reached from the site B through a certain line, the site B can also be reached from site A along the same line.
(3) Regardless of the difference in the frequency of vehicle departures and the number of bus lines connecting the two stations, that is, regardless of the connection weight problem in the network, the network is abstracted into an unweighted network.
(4) Due to the intersection of urban roads, T-junctions, etc., there are many places where bus lines meet. The point at which the bus line space intersects is not necessarily the bus stop site, so different bus lines are not connected here.
4.1.2. Data Selected
The public transport network consists of two basic elements: the station and the route. A line consists of several sites. This manuscript analyzes the Xi’an public transportation system. According to the above assumptions, the network includes 473 lines and 2808 docking stations.
4.1.3. Bus Network
The idea of establishing a bus station model is to use a docking station as a node. Since the geographical location of the bus stop was not considered, the cyclic operation of the bus line was ignored in the statistical process, and the first and last bus stops on each line were not connected. The shortest path length between the two nodes represents the minimum number of bus stops that pass from the point of departure to the destination.
According to the above modeling method, all stations were numbered, and 0/1 adjacency matrix of
was generated using Python, and UCINET and Netdraw drew the network topology map of the bus stations. Then, we performed the centrality analysis, selected “centrality measures” in the menu of “analysis”, and chose “degree” when setting the node size. The connection represents the direct connection between the sites. The size of the point reflects the importance of the node. The final bus network is visualized in
Figure 1.
4.2. Evaluation Results of Transportation Network Property
This part uses complex network theory and UCINET, and takes the Xi’an bus station network as an example to calculate and analyze the characteristic and topological properties of the network.
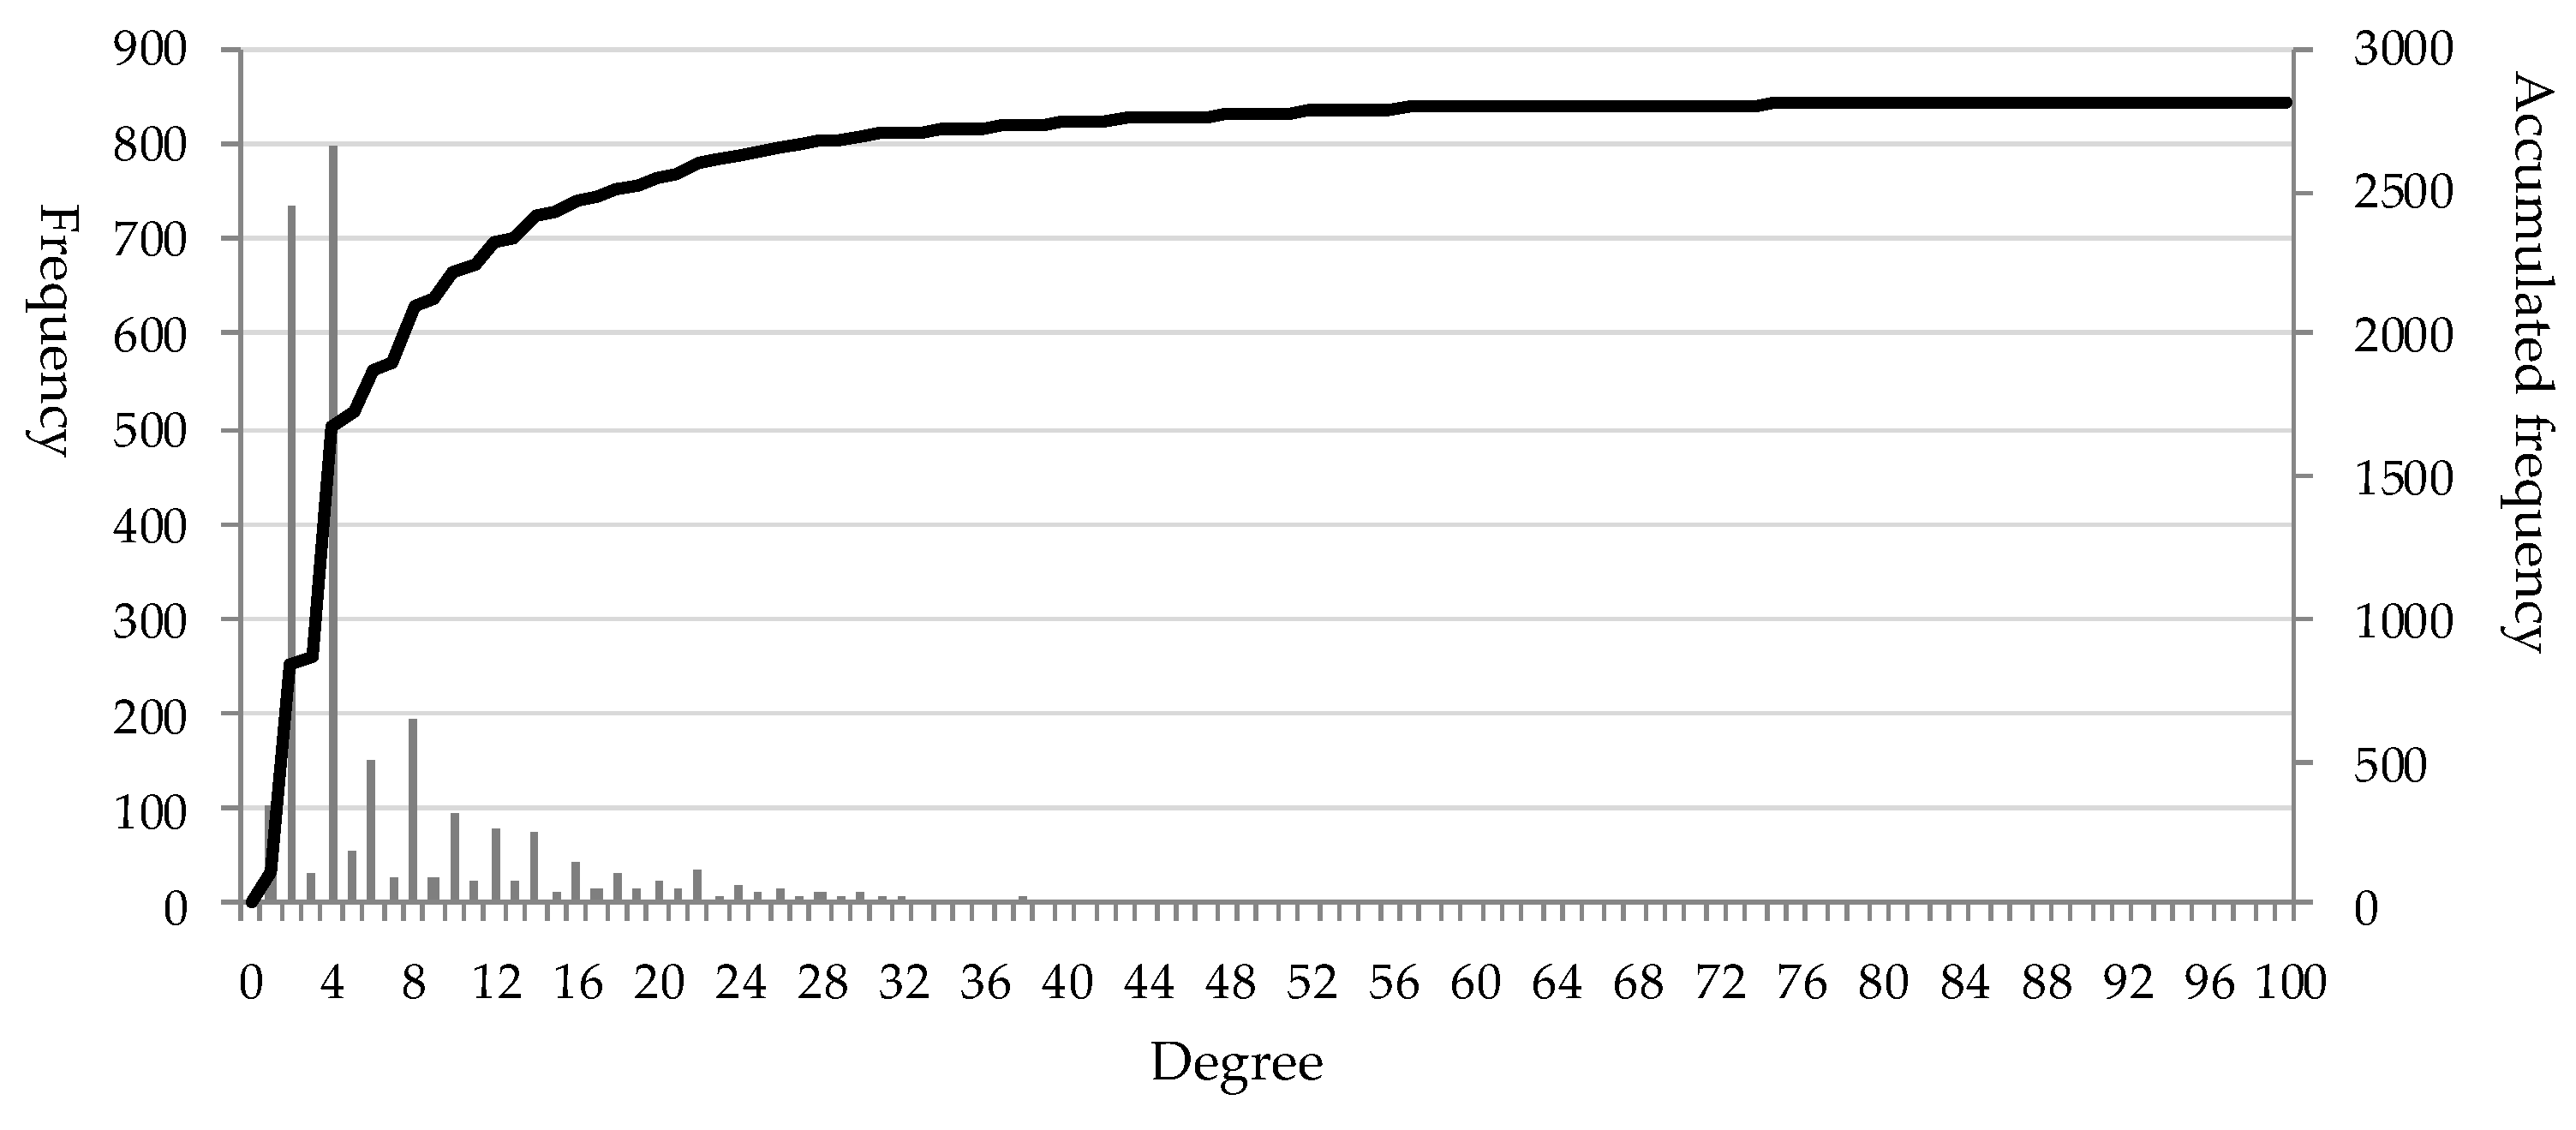
4.2.1. Degree of the Network
For a weightless network, the node degree represents the number of connected edges between nodes. The greater the degree of node, the higher the connectivity, the better the traffic conditions in the actual geospatial space, or it is more likely to be the hub or transfer station in the actual bus network. The node degree statistics in the bus complex network are shown in
Figure 2 and
Table 1 below, and some nodes are shown in
Table 2.
The above table indicates that the highest value of node degree in the Xi’an public transport complex network is 99, with an average of 8.047, indicating that there are eight lines per site, the intensity distribution is extremely uneven, and the number of nodes with intensity below 10 is 2215, accounting for 78.9% of the total, the ratio of high nodes intensity above 52 is 1.1%.
4.2.2. Path Length
The shortest path represents a path from one node to another with the fewest edges. The average shortest path is the average of the shortest paths between all the nodes in the network. In the network model based on the adjacent site, it reflects an average number of sites between any two stations in the bus network, an elementary indicator for evaluating the convenience of the bus network model. After calculation, the average path length is 28.455, the distance-based cohesion is 0.035, and the distance-weighed fragmentation is 0.965, which means that the degree of isolation between nodes is higher. Xi’an residents take an average of 28 stations per one trip.
4.2.3. Clustering Coefficient
For the bus station network, the clustering coefficient reflects the intensity of the bus lines near each station, and the network is analyzed. The average clustering coefficient of the bus station network in Xi’an is
, and the low clustering coefficient indicates less neighbor node connection. Therefore, when the traffic flow of neighbor nodes passes through the node, it is easy to cause the node to be heavily loaded and congested.
Figure 3 presents the clustering coefficient value of different nodes.
4.2.4. Betweenness
The betweenness of node is defined as the number of shortest paths passing through a node in the network, reflecting the impact of the node on the network. It is calculated that the minimum betweenness of the bus station in Xi’an is 0, the maximum is 1,283,175.750, and the average is 54,134.063,
Figure 4 shows the betweenness value of different nodes.
A bus stop with a high betweenness is close to the topology of many other sites. It is usually a more important bus transfer site and has a greater influence in the network. As can be seen from
Table 3, the betweenness and the number of bus routes that have passed are seemingly not correlated. In the planning of public transportation, it is necessary to recognize the importance of high degree or high betweenness sites, and improve the passenger flow and vehicle throughput performance of these stations, which have a very significant effect on improving the entire public transportation efficiency.
5. Sustainable Transit Transportation Network Optimization
Research on the application of complex networks in public transportation systems showed that a scale-free network (BA network) has more adaptability. A few nodes have large degrees and the distribution of betweenness is not even. Links with high betweenness are responsible for the main passenger flow transportation, and are normally the public transportation hub points in the L-space public transportation network. The general bus congestion is also gathered on the links with high betweenness. The solution may focus on optimization of these key links. So, in order to solve urban public transportation congestion and maximize the capacity of the network, it is better to adopt the scale-free network topology structure. Whether in early planning or in later optimization, the corresponding driving mechanism can be used and the scale-free network topology developed to increase the capacity and sustainability of transportation networks.
The bus network optimization model is developed based on complex network theory. The complex network topology parameter is set as the objective, with the constraints of evaluation index of real bus network.
5.1. Objective
The link betweenness is the sum of the ratio of the shortest path number to the shortest path number between all the two nodes in the network. It characterizes the influence of nodes or edges on the whole network. The minimum number of edges is the smallest, which can effectively ensure that the shortest path of the network is small (Equation (8)). This goal indirectly shortens the total travel time of passengers and ensures the efficiency of the network. In Equation (8),
is the number of arcs between
;
refers to the betweenness of arc
; and
is the resistance of arc
.
5.2. Constraints
The influencing factors and constraints of urban public transportation network planning are multi-faceted, and they can generally be divided into two categories: the constraints of a single line and the constraints of the overall line network.
As for single line, the manuscript presents the following constraints.
(1) Line Length
The length of the line is related to factors such as the size of the city, the distance traveled by residents, and the speed of bus operation. Long line will inevitably increase its operating costs; otherwise, it will make the dispatching difficult, and increase the number of transfer times for public transportation, so there must be a reasonable range of line lengths, as denoted by Equation (9), where,
is normally set as 5 m in Equation (10). Here,
refers to the average speed of a bus, the value depends on the specific situation of each city, and
means the maximum travel time that depends on the city scale.
(2) The Non-linear Coefficient of Line
The non-linear coefficient of line refers to the ratio of line distance and the linear length of the city bus line. Equation (11) calculates the non-linear coefficient. Here,
is the distance of bus line
,
is the linear length of the bus line. According to the regulation of urban traffic planning and design, the maximum of the ratio is 1.4.
(3) Station Capacity
The capacity of the station depends on the stopping capacity of the station, its size, and the bus stop time, etc. In an actual urban public transport network, stations often serve multiple lines, and the total number of passengers carried by these lines should not exceed the capacity of the station, as constrained by Equation (12). Here,
is the capacity of the station;
is the passenger volume of line
in the station;
is the coefficient considering the number of multiple lines and the actual impact of traffic around the site.
is decided considering actual cases.
(4) Road Section Unevenness Coefficient
Road section unevenness coefficient
refers to the ratio of the flow of a certain section and the average flow of the line, as denoted by Equation (13), where
is the flow of a certain section and
is the average flow of the line.
The total network is constrained by Equations (14)–(18):
(1) The Density of the Transportation Network
The density of the transportation network (
) refers to the bus line length. It directly reflects the degree of proximity to the line when the residents travel by bus. For the urban central area, Equation (14) is met, while for the downtown area, Equation (15) is met.
(2) The Average Transfer Coefficient
The average transfer coefficient
is the ratio between the sum of the bus trips number and transfer passengers number and bus trips number, which is computed by Equation (16). Here,
is the average transfer coefficient,
is the number of direct trips from site
to
;
is the number of trips with one transfer from site
to
;
is the number of trips with two or more than two transfer from site
to
;
is the number of total trips from site
to
. Normally, for large cities, Equation (17) is met and for medium and small cities, Equation (18) is met.
5.3. Solution
A four-step solution procedure was developed to solve the model defined in Equations (8)–(18).
Step 1. Take one origin and destination (OD) pair to be optimized. The Dijkstra shortest-path algorithm is used to search for the shortest route, . If can meet the line length constraints, it will be used as the alterative line and then choose the next OD pair. Otherwise, go to Step 2.
Step 2. Search for
after
is confirmed. Mark the node and as for any node,
. Its mark value is computed by Equation (19), where
is given in Equation (20)
If and go through node , then refresh the mark of . If there is no adjacent point at this point, the mark is updated to infinity. is the set of points through which the shortest path passes. is the set of nodes on the shortest route. is the distance between node and starting point ; is the distance between neighbor nodes and ; and is the length of m shortest route.
Step 3. Check whether meets the line length constraints. If it does meet it, it can be chosen as the alternative route; otherwise go back to Step 2.
Step 4. Check if all the OD pairs are searched. If found, the alterative line set is obtained; otherwise, go back to Step 1.
6. Results and Discussion
The main purpose of the experimental study is to investigate the properties of an urban public sustainable transportation network and optimize it. Complex network theory was used to construct the neighboring site-type undirected network model. An urban sustainable public transportation network was optimized based on the betweenness. The urban transit network’s properties were evaluated by complex network theory and related methods, and the possibility of optimization was formulated as Equations (8)–(20), with a solution procedure. Weaker sustainability gives rise to quite a lot of problems in the current urban transit system. Therefore, sustainable development should be highlighted when conducting the optimization of public transport networks. In the experiments, we analyzed three scenarios. First, the optimization model based on the betweenness centrality helped cut down the path length and improved sustainability. Second, the constraints of a single line and the overall line network were analyzed and compared. Finally, the Dijkstra algorithm in an effort to easily obtain an effective solution and its implementation steps were analyzed. Sustainability analysis was embedded in the above scenarios and discussed in the following.
(1) In the results of the network analysis, the degree distribution of the bus transportation network in Xi’an was uneven, showing obvious polarization. The number of nodes with intensity below 10 was 2215, accounting for 78.9% of the all nodes, and the proportion of nodes with intensity above 52 was nearly 1.1%. High valuable sites are often assumed to be important transfer hub functions. Thus, they deserve to be the focus of construction, and the surrounding road surface needs to be widened as well. Traffic congestion will accordingly be reduced and the speed of bus traffic will be improved.
(2) From the average path length, the average value was 28.445. The maximum value was 80. The results mean that residents of Xi’an travel about 28.445 bus stops on average when taking a bus. By contrast, the maximum value of path length for the Shanghai bus network is only 32, and the average value is 7.585; while the maximum for Beijing is 103, and the average is 17.3866. As for such large cities as Shanghai and Beijing, the number of bus stations is several times more than that of Xi’an, and the average path length is smaller than that of Xi’an, indicating that the bus systems in these two large cities are more developed than the Xi’an bus network. Although the average distance of Beijing bus stations is smaller than that of Xi’an, the bus number in Beijing is three to four times larger than that in Xi’an. On the other hand, the scale of Chengdu’s public transport network is similar to that of Xi’an, but the average path length is 10.81, which is smaller than that of Xi’an. It can be seen from these data that the average path length of the bus network in Xi’an is relatively large, which is closely related to the lack of public transportation routes to the outer suburbs and the unreasonable layout of Xi’an bus lines, which means that the convenience of Xi’an citizens is not high. What is more, the convenience of citizens also depends on the traffic flow and non-linear coefficient. The non-linear coefficient refers to the ratio of the actual traffic distance between the starting points of the road and the linear distance between the two points.
(3) The clustering coefficient was used to describe the aggregation of nodes in the network, that is, how close is the network. The average clustering coefficients reflect the intensity of the bus lines in the entire bus network. The clustering coefficient of each station in the Xi’an bus station network was calculated, and the values of 1934 stations were found to be 0, indicating that there are many neighboring stations in Xi’an that are not connected with each other. As the clustering coefficient of the station is relatively low, the connection between its neighbors is sparse, and most of the traffic between these neighbors has to pass through the station, resulting in its heavy load. Thus, stations with a high clustering coefficient are more likely to be blocked than stations with a low clustering coefficient. The number of stations with a high clustering coefficient in the bus network of Xi’an is small, and only 208 of them have clustering coefficients of 1 or above. Therefore, the average clustering coefficient of the whole network is not high, which is 0.223. However, it is higher than that of Shanghai and Beijing, which is respectively 0.064 and 0.14. This indicates that the bus lines in Xi’an are relatively denser.
(4) The betweenness characterizes the influence of nodes or edges on the entire network, and has a strong practical significance for solving real network problems. The betweenness of the Xi’an bus station network was calculated. The bus stations with larger betweenness were compared. It was found that the larger betweenness and number of bus lines passing through were not correlated. Increasing the traffic and bus throughput performance of these nodes had a very significant effect on improving the operational efficiency of the entire network. Thus, the urban sustainable transportation network optimization model was established and solved based on betweenness.
(5) From the data visualization results, we found that one of the most obvious features of the Xi’an bus lines was that the lines are too long. The lines pass across three districts or even more to connect the urban center to the suburbs. Long-distance travel cannot ensure full loads and so decreases the sustainability of the routes. In experiments we found that the line detour time can be reduced when the regular bus lines were shortened. The regular buses in the suburban–urban–suburb areas should be adjusted to the suburban–suburban and suburban–urban edge as much as possible. By such a method, the sustainability of the bus lines and tours can be improved. At the same time, some small-bus routes leading to the outer suburbs are considered to be restricted to enter the urban area and just reach the bus hub in the suburbs. This can reduce the repeated and disorderly crossing of buses, and reduce the occupation rate of buses on major roads, thereby reducing traffic congestion and improving the overall operational efficiency and sustainability of the public transportation system.
(6) We also considered the network resilience in the experiment analysis by simulating node failures and through time. That is to say, it was able to provide and maintain an acceptable level of service in the face of faults and challenges to normal operation. A local failure of the network will increase the burden on other parts of the network, especially the key nodes and branch lines. Their faults are likely to cause the entire network to collapse. Congestion and its spread have a greater impact. The overall stability of the public transport network is robust and fragile due to its heterogeneity in scale-free performance. The key nodes and branch networks play a vital role in the connectivity of the entire network, reflecting the complexity and intrinsic dynamics of the public transport network. Relevant literature [
15,
17] also confirms that improving the capabilities of key nodes and the micro-circulation capability of the feeder roads is an important approach for improving the overall network capabilities.
(7) From the perspective of complex networks, it is feasible to split the central hub, so that the work originally undertaken by one node is decomposed into several interconnected nodes, and the synchronization capability of the network is significantly enhanced. This feature is also tested by visualization and simulation upon the network. When the bearing capacity of the original single station is weakened, a new station can be set up at intervals of about 100 m, and the bus lines that are docked can be diverted to reduce the queue waiting for the bus, which can enhance the network transportation capacity.
7. Remarks and Conclusions
Complex network theory offers meaningful ideas for urban transit network studies. With the extensive development and application of the theory, increasingly more scholars are interested in deep study on complexity of transportation engineering. Urban transportation network design and optimization requires a combination of application and actual operation. It should not be limited to the topological structure analysis, instead, a concentration on the guidance of planning and design should be highlighted. The ultimate purpose is to actually improve the efficiency and sustainability of the network and society.
Firstly, this study used the complex network theory method and conducted a practical study on the urban transit network in Xi’an. The topological properties of the network were investigated and showed some insights into the public transportation network.
Secondly, a betweenness-based model and solution method was developed to improve the public transportation network’s sustainability.
Thirdly, discussions on the features of the Xi’an transit network were presented. Some problems of public transportation were discovered from the perspective of sustainable development.
Urban traffic network structures have numerous impacts on traffic congestion and related challenges. Apart from network design optimization, possible directions of future policy could help maintain the network and avoid potential problems. First, the government should clarify the principle of prioritizing the development of public transportation and enhancing the ability of public transportation to lead the city’s development. Second, infrastructure construction needs to be highlighted. In the bus hub station, charging facilities and other supporting facilities ought to be equipped to facilitate the use of trams. Simultaneously, the connection between urban public transportation and other modes can be strengthened to improve interchange efficiency. Third, investment in intelligent bus systems should be stressed and the application of information technology in urban public transportation operation management, service supervision, and industry management should be promoted. Guidance on improving information sharing and resource integration of urban public transportation and other modes needs to be strengthened. Fourth, measures incorporating urban logistics into urban transit are to be encouraged. With online shopping and e-commerce growing tremendously, express delivery vehicles are crowding urban traffic. In case some urban transit facilities are not well utilized, they can be used to share some urban logistics contributing to less traffic congestion.
To sum up, this study constructed the bus transit network of Xi’an, analyzed the topological characteristics of its complex network, and proposed an optimization model based on betweenness centrality and policy guidance. However, further research should be carried out considering the weight and directionality of the edge, the traffic flow, and robustness. Additionally, a novel trend combining complex network theory and data mining will be prospected. Furthermore, due to data acquisition problems, we could not obtain the flow data at each leg between any pair of bus stations in each bus line; we also did not use the spatial properties of the bus stations and attached communities. When we are able to obtain the related data, the limitations of this study will be further studied. First, the optimization procedure will be improved to consider the above origin–destination flow and spatial data. Second, the sustainability instruments will be examined by considering the impacts of node and edge dynamics on the network’s structures. As so the infrastructure, development strategies will be tested upon the network. Third, due to the openness of the study on network optimization, interviews and grounded studies will be conducted as a base of network simulation and analysis.


