Article

Assessing the Ecological Carrying Capacity Based on Revised Three-Dimensional Ecological Footprint Model in Inner Mongolia, China

1
Key Laboratory of Urban Environment and Health, Institute of Urban Environment, Chinese Academy of Sciences, Xiamen 361021, China
2
University of Chinese Academy of Sciences, Beijing 100049, China
*
Author to whom correspondence should be addressed.
Sustainability 2019, 11(7), 2002; https://doi.org/10.3390/su11072002
Submission received: 5 March 2019 / Revised: 24 March 2019 / Accepted: 30 March 2019 / Published: 4 April 2019

Abstract

:
Under the concept of green development, accurately mapping ecological carrying capacity to effectively evaluate regional sustainability has already become an important issue in China. This study introduced ecological carrying capacity intensity (ECintensity) based on the revised three-dimensional ecological footprint (3DEF) model to describe the temporal–spatial patterns of three-dimensional ecological carrying capacity (EC3D) in Inner Mongolia in 2010–2016 and to explore factors affecting socioeconomic sustainable development. The results showed that ecological footprint size (EFsize) differed between cities/leagues but changed little during the study period. Ecological footprint depth (EFdepth) far exceeded the original value of 1.00. Ecological carrying capacity (EC) varied in cities/leagues, while ECintensity increased slowly with stronger potential for regional development. Three-dimensional ecological deficits (ED3D) of cities/leagues were divided into five categories: Hohhot, Hulunbuir and Banyannur were in larger ecological surplus; Hinggan was in slight surplus; Baotou, Chifeng, Tongliao, Ulanqab, Xilin Gol and Erdos were in slight deficit; Wuhai was in stronger deficit; and Alxa was in severely intense deficit. Woodland of cities/leagues was continuously in slight ecological surplus, while cropland and grassland had crucial impacts on deficit. There was a significant positive linear correlation between gross domestic product (GDP) and footprint, while a negative correlation was seen with deficit. These results would help coordinate resource utilization and industrial structure adjustment in Inner Mongolia.

Graphical Abstract

1. Introduction

With the acceleration of industrialization and urbanization, population expansion, resource shortage, environmental pollution and ecological destruction have become prominent in recent decades. With harsh natural conditions, fragile ecological status and frequent human activities, there are more environment problems in Northwest China, which limit the regional socioeconomic sustainable development. The ecological footprint (EF) model proposed by Wackernagel [1,2] provides an effective tool to assess regional sustainable development and has been widely applied by scholars. On the demand side, EF represents the natural capital and ecosystem service requirements of a given population in terms of biologically productive areas. The area of EF depends on the population size, material living standards, ecological productivity and technology level [2]. Correspondingly, on the supply side, ecological carrying capacity (EC) represents the renewing ability of ecosystems to produce useful biological materials and to absorb wastes generated by humans using current management and technologies. Herein, the total area of biologically productive land that can provide this ability for a specific population is calculated as EC. EF and EC can be directly compared as they are measured in the same units. ‘Ecological surplus’ (ES) refers to the case where EF is lower than EC. In this case, we can export surplus resources to promote regional economic growth. Conversely, overshoot that occurs is called ‘ecological deficit’ (ED). Under this circumstance, sustainable development can only be maintained by importing resources or consuming local natural capital stock.
EF models have been continually modified for various purposes [3]. Net primary productivity was integrated into an EF model by Venetoulis [4] to refine EF rather than using agricultural productivity. Gernot [5] modified an EF model with the substitution of fossil energy by renewable energy carriers for assessing sustainable energy supplies. An emergy-based EF framework was proposed regarding the ability of environmental services to mitigate or eliminate impact of emissions [6]. Field surveys were carried out in rural areas based on an EF model in Reference [7]. Researchers combined an EF model with pinch analysis to devise the optimal energy mixes and quantify environmental pressures for decreasing the carbon footprint [8]. EF and EC were evaluated and predicted based on the grey model to provide effective inspiration for reducing ED in the Yangtze River urban agglomeration [9]. Monfreda [10] established national natural capital accounts based on detailed EF and EC assessments by using more comprehensive data. The current means of EF accounting could not represent resource depletion associated with resource flows [3].
Natural capital is the resource stock that yields flows of natural services and tangible natural resources to serve human needs. Ecological footprint size (EFsize) and ecological footprint depth (EFdepth) were introduced into the three-dimensional ecological footprint (3DEF) model by Niccolucci [11,12] to distinguish the natural capital flows and stocks. Fang et al. [13,14] introduced the 3DEF model to China and made optimizations to resolve the mutual offset problem of different land uses. They also introduced two indicators, namely capital flow occupancy rate and stock flow utilization ratio and evaluated the natural capital utilization of 11 countries. These two modified indicators were selected to represent the provincial pattern of China’s natural capital use and then cluster analysis was conducted to classify provincial regions. Li et al. [15] developed an ecological footprint contribution index to evaluate the ecological security of the typical prairie in China. Du et al. [16] observed that all 13 cities in the Beijing–Tianjin–Hebei urban agglomeration showed ecological deficits and that EFdepth was affected by the quantity and structure of energy consumption. Peng et al. [17] presented a multidimensional ‘ecology–equity–efficiency’ framework using the Gini coefficient of EFsize and variation coefficient of EFdepth to characterize the equality of capital flow consumption and capital stock occupation in Beijing. The occupation of regional natural capital flows and stocks and differences between land types in other regions were calculated and estimated based on 3DEF coupled with other prediction models [18,19,20]. The driving factors of EFsize and EFdepth were also revealed and the relationship between economic development and EF was explored [18,20]. The 3DEF model was found to be more accurate for depicting regional development, while economic level and energy consumption had substantial impacts on the footprint.
According to the National Footprint Accounts, humanity’s EF initially surpassed the Earth’s biocapacity in the early 1970s and recent results indicated 64% overconsumption in 2012 [21]. Current research showed that ED continued in past decades, causing a global overshoot and potentially leading to a depletion of the underlying natural stocks [11,22]. The EF fails to recognize factors such as consumer preferences and property rights which have a major influence on the allocation and sustainable use of resources. EF is not simply linearly correlated with economic development [18,23] and EF demonstrates robust influence on foreign direct investment. International trade blurs the responsibility for the ecological effects of production and consumption [24]. The environmental Kuznets curve displays different tendencies for developed and developing regions [25,26]. A bidirectional causality link between economic growth and EF was found to have a U-shaped Kuznets curve for China [25]. Rashid et al. [27] evaluated the living style standards through questionnaires to calculate EF and found that urbanization in Pakistan was moving away from sustainable development. The impact of the affluence and technology on regional EF could not be ignored. The innovation activity and the degree of economic freedom would have a significant direct influence on the variability of EF [24,28], while the conventional model may overestimate ED during rapid socioeconomic development. Over the course of human history, our lifestyles and concepts have changed along with institutions and culture, while the traditional EC is productivity and carrying capacity represented in the past and present. We should take into account physical senses, psychological perceptions, socioeconomic perspectives, process risk and associated aspects alongside natural elements in working toward sustainable development [29]. Science and technology constitute a primary productive force. The regional sustainable development is coupled with potential from social capital as well as natural capital [30,31]. Thus, the actual EC is difficult to measure or evaluate. This confuses the resource consumption threshold within the planetary boundaries [32]. No studies have yet overcome this deficiency. Multiplicative-innovation synergies arise from combining greater proportions of diverse technologies and their effects have longer duration [33,34]. Therefore, we introduced one multiplicative technological factor, namely ecological carrying capacity intensity (ECintensity), to represent the potential of regional carrying capacity more accurately.
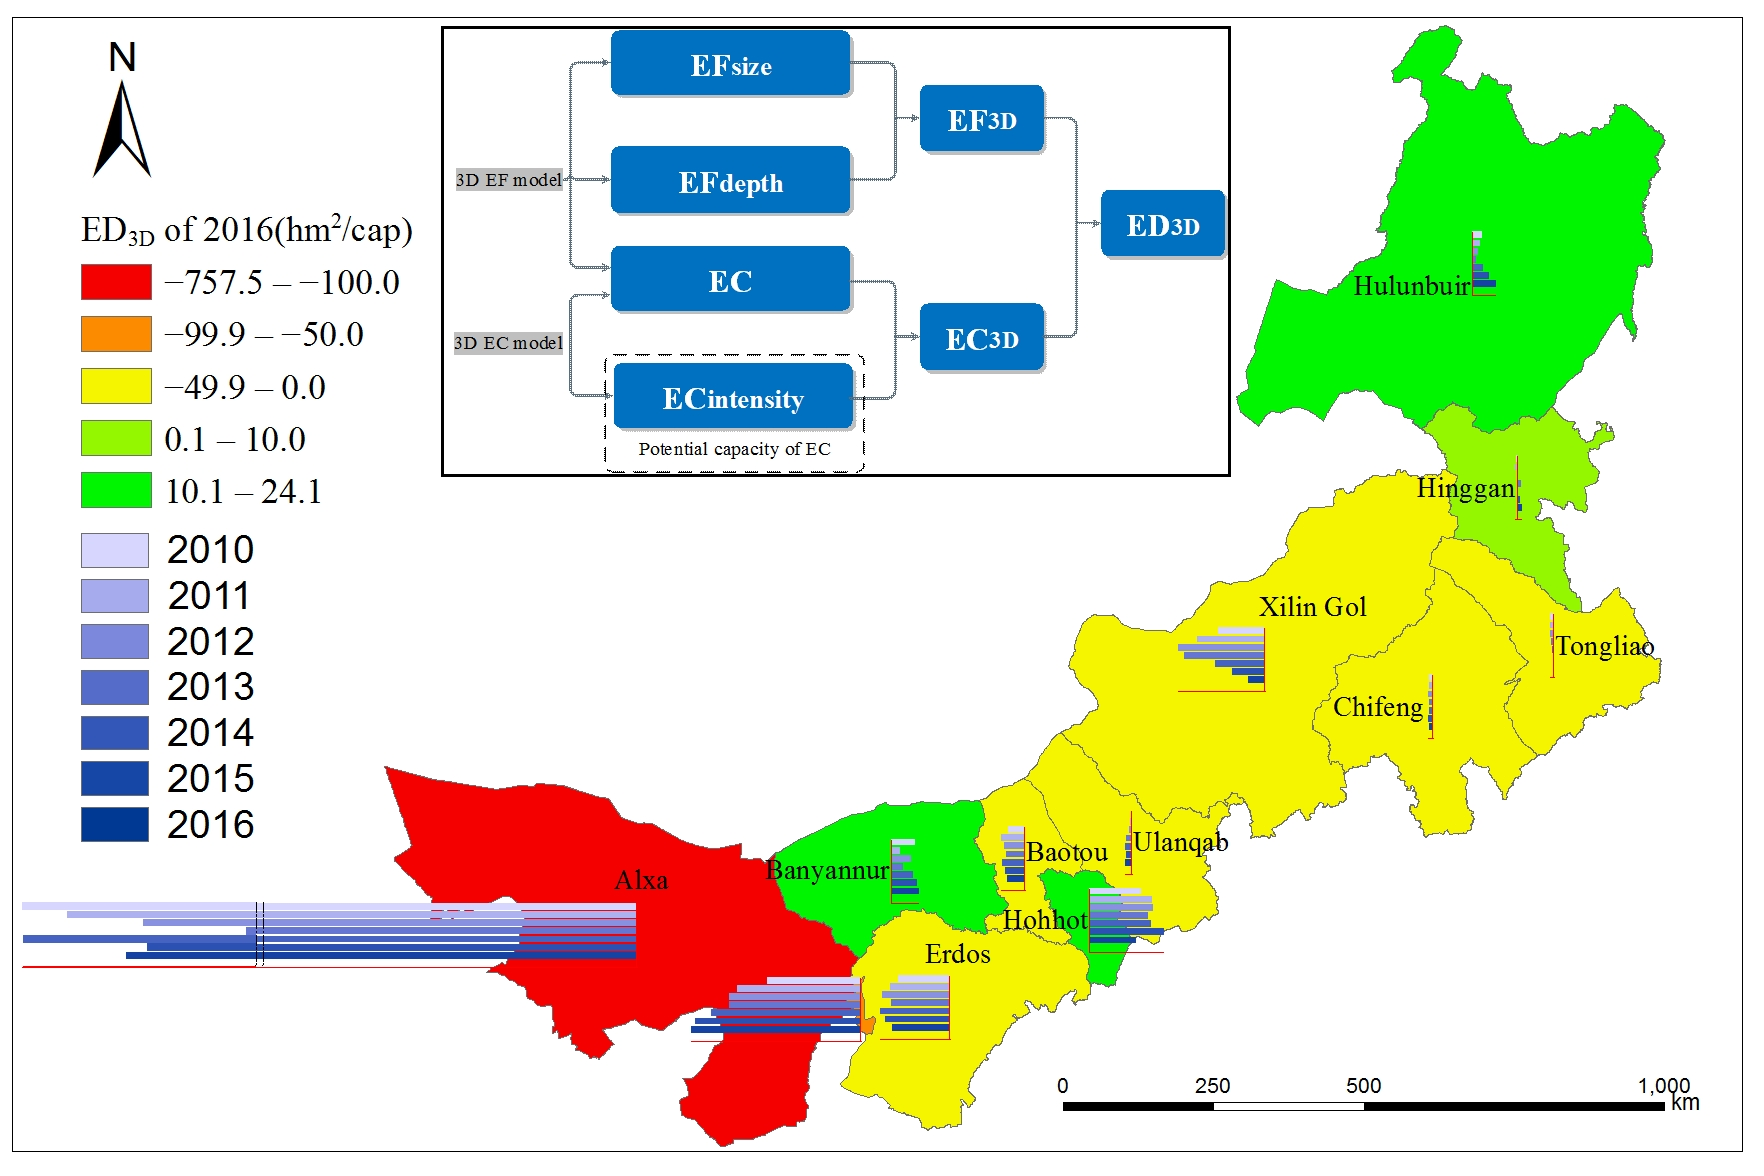
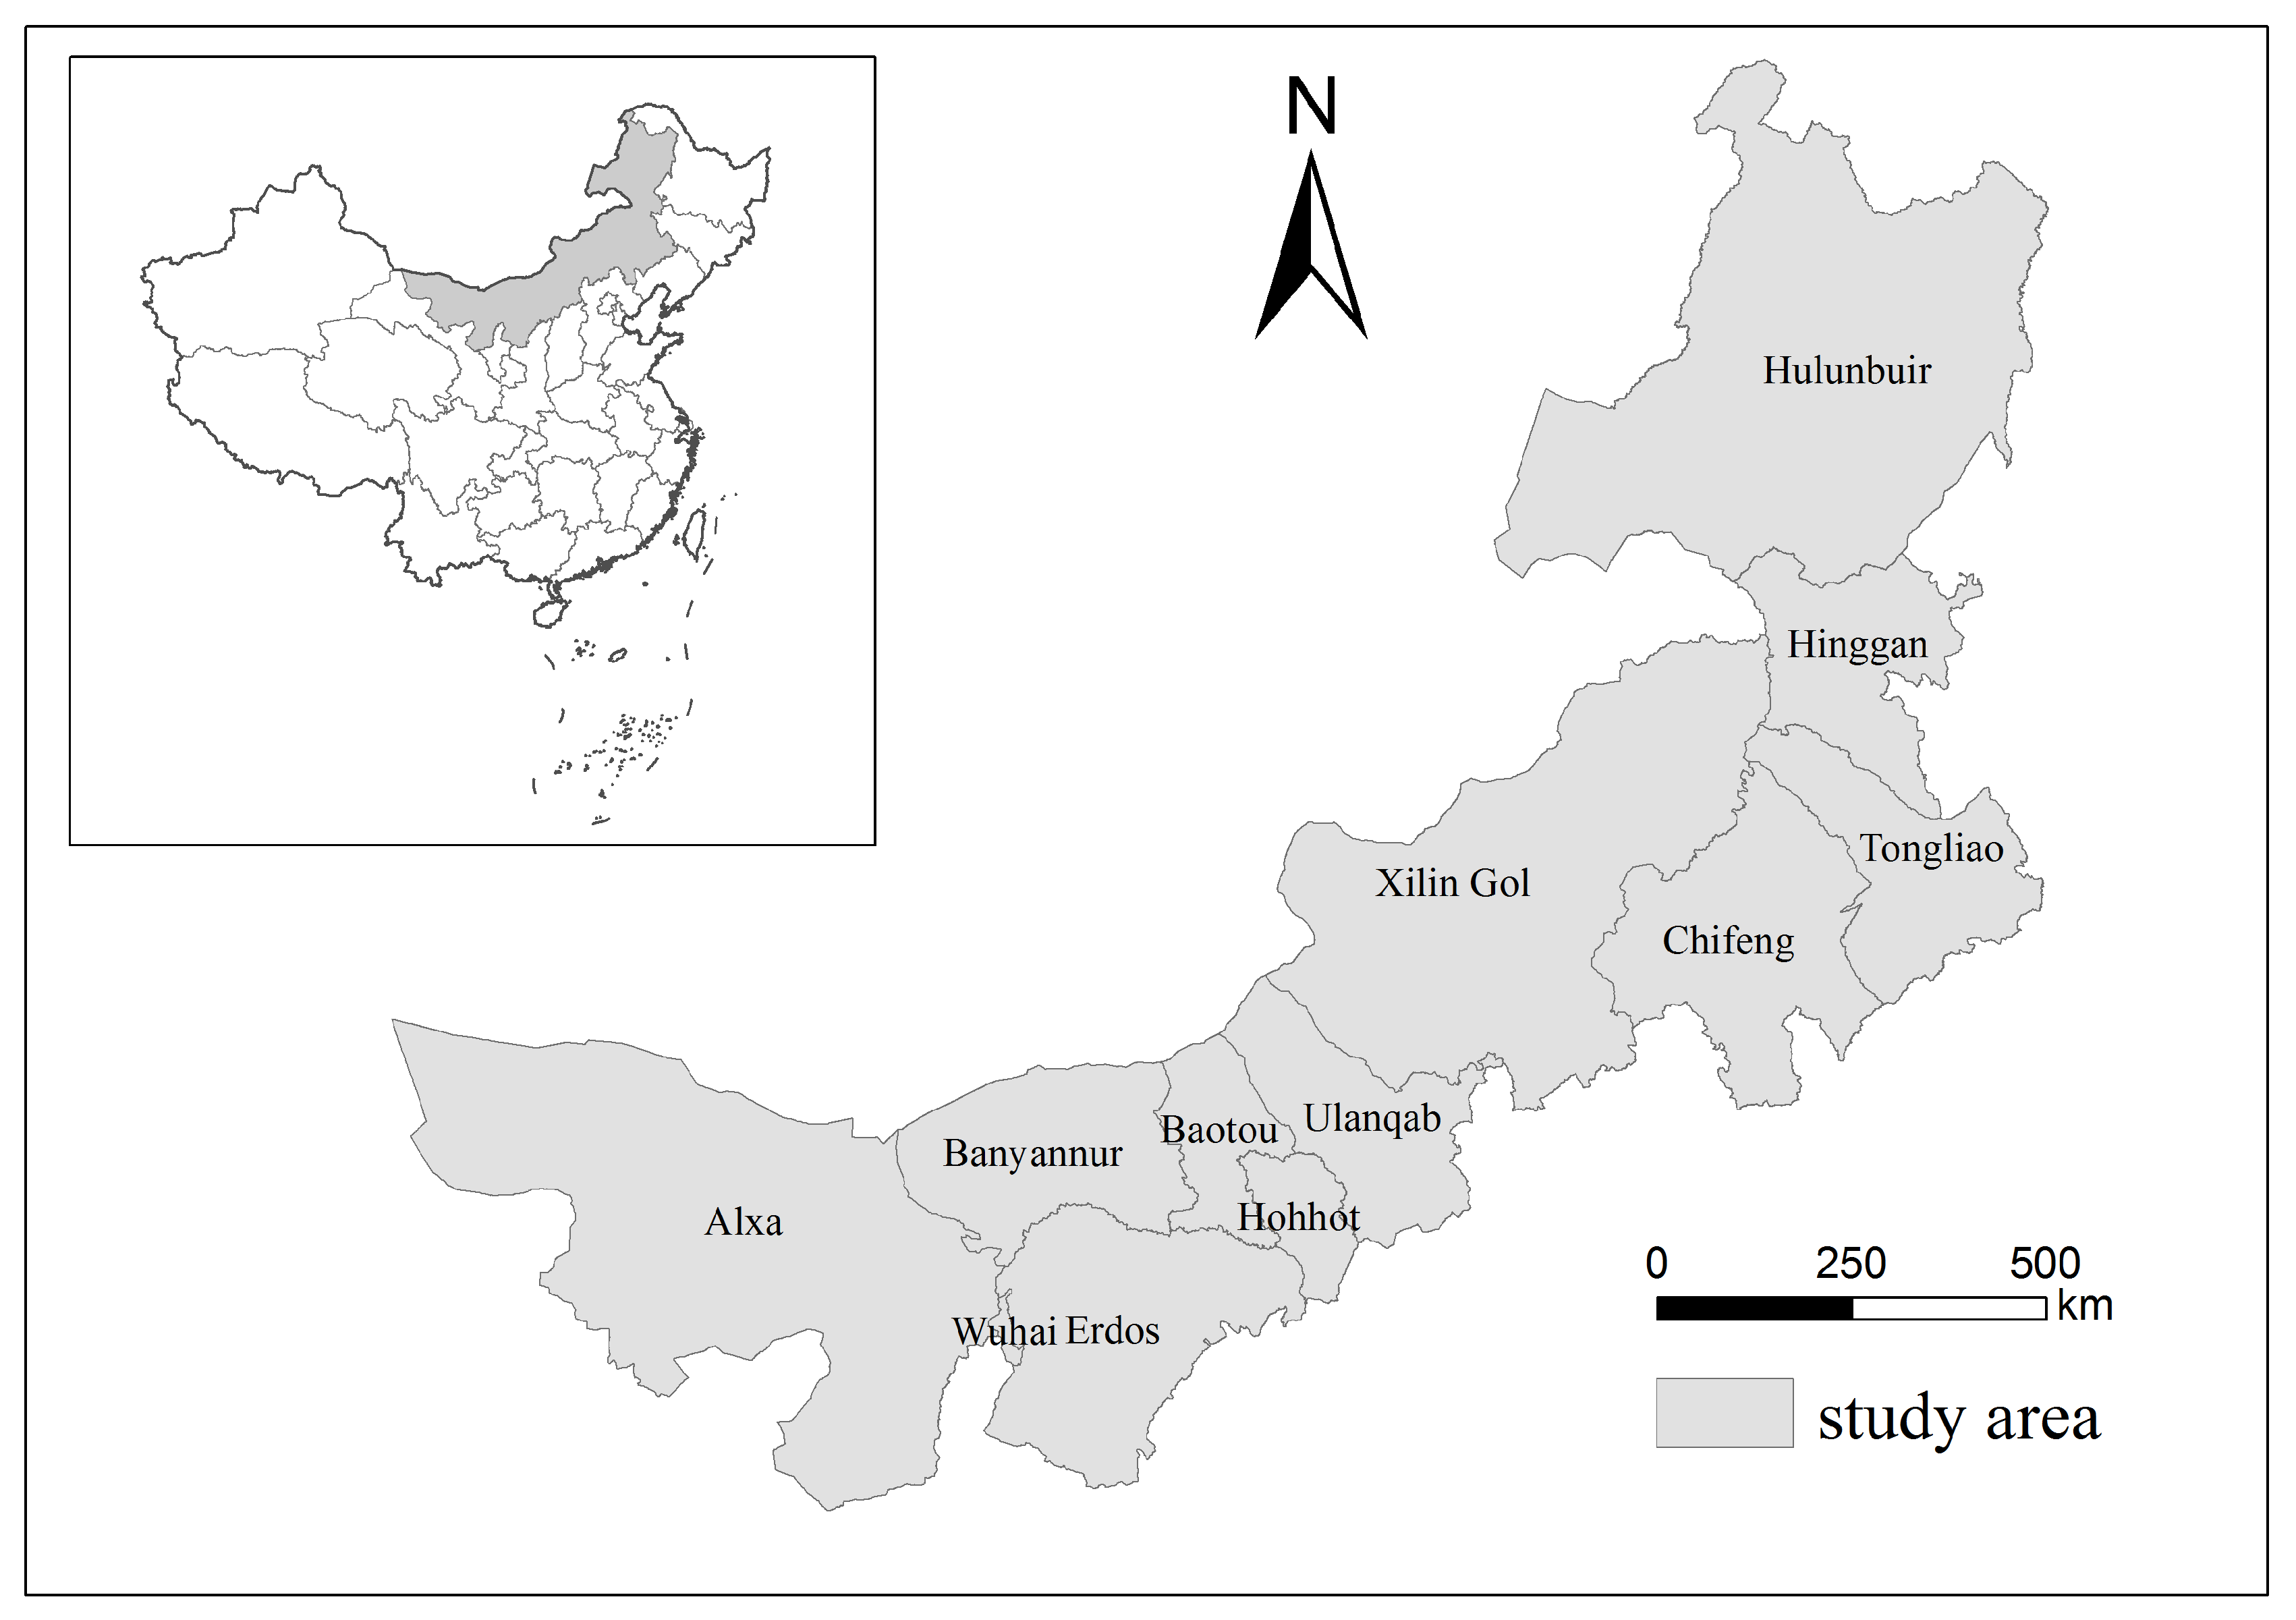
The EF and EC of the Inner Mongolia Autonomous Region (IMAR) were calculated using resource and environmental data based on an EF model. We calculated the three-dimensional ecological carrying capacity (EC3D) during the period of 2010–2016 to improve the accuracy and reliability of EC. Meanwhile, the supply and demand of different land types were described, the relationship between ecological deficit and economy was analyzed and the limiting factors affecting carrying capacity were explored. The results could provide basic data support for industrial structure adjustment and ecological redline identification for regional development planning and management.
This paper is organized as follows: Section 2 describes the study area, Inner Mongolia. Section 3 introduces materials and revised methods, including data sources, the construction of the ECintensity and the revised three-dimensional ecological footprint model. Section 4 presents results of the temporal–spatial patterns of the three-dimensional ecological footprint, carrying capacity and surplus/deficit in 12 cities/leagues. Analysis of factors influencing EFsize, EFdepth and ECintensity are discussed comprehensively in Section 5. Finally, conclusions and proposed future work are presented in Section 6.

2. Study Area

IMAR is located in the northern frontier of China, extending from the northeast to the southwest. It has nine cities: Hohhot, Baotou, Wuhai, Chifeng, Tongliao, Erdos, Hulunbuir, Ulanqab and Banyannur; and three leagues: Hinggan, Alxa and Xilin Gol (Figure 1). The total land area is 1.183 million square kilometers, accounting for 12.3% of the country’s total area. At the end of 2017, the permanent population of the whole region was 25.286 million, of which the urban population was 15.628 million. Per capita arable land, grassland, forest area and mineral resources rank among the top of regions of China and it is an important source of energy and raw materials in China. In 2017, 11,701 patents were applied for and 6271 patents were granted. The region’s GDP reached 1610.32 billion yuan with an increase of 4.0% over the previous year calculated at comparable prices. The GDP contributions of the three main industries were 10.2%, 39.8% and 50.0%, respectively [35].

3. Materials and Methods

3.1. Materials

This research used primarily socioeconomic data mainly from the Inner Mongolia Statistical Yearbook 2011–2017, Food and Agriculture Organization of the United Nations and Agrotechnical Economics Manual (Revised). The data calculated for EF herein included biological resource and energy consumption (Table 1). The biomass products were specifically agricultural products, animal products, forest products and aquatic products; energy resources included coal, oil, gasoline, natural gas, electricity and so forth. These indicators were chosen according to the actual conditions in IMAR based on the World Wide Fund for Nature or World Wildlife Fund classification criteria. The selected data covered most of the components needed for ecological footprint accounting. All biomass was calculated by production volume and energy was calculated by consumption to conform to true ecological pressure status. Thus, the import and export adjustment were not included herein.
The EF of all items were classified into 5 land types: cropland, grassland, woodland, water area and construction land. Cropland, grassland, woodland and water area all provide a large number of products as mentioned by the conventional ecological footprint model. Fossil energy land is used to account for the land needed for local forests to absorb carbon dioxide. However, it is not just woodland that can absorb greenhouse emissions; in particular, prairie land is also important in this. Therefore, fossil energy land and construction land were merged into construction land as calculated below. The missing data of cities/leagues were processed and converted as follows. Cropland and grassland EF were calculated according to statistical data of each item; honey and fruit products were distributed according to the proportion of agricultural GDP in each city/league within IMAR and wood according to the proportion of forestry GDP. The aquatic products were distributed according to the proportion of fishery GDP and the total energy consumption of each city/league was calculated as construction land EF. The energy component was directly estimated using standard coal consumption due to detailed data being inaccessible for 12 cities/leagues. Meanwhile, in order to conveniently compare results with other regions, the global average production data in 1993 extracted from the Food and Agriculture Organization of the United Nations was used as the benchmark and the energy component was based on the average calorific value of fossil energy [2,36].
Based on the integrity and accessibility of data, the yearly patent data of 12 cities/leagues were extracted from the SOOPAT website (http://www1.soopat.com/Home/IIndex), while the scientific and technological activities’ personnel and research funding were taken from the Inner Mongolia Statistical Yearbook. The calculation of ECintensity was based on 1993 data in order to be conducive to model unification.
Land use data were derived from the Land Survey Results Sharing Application Service Platform (http://tddc.mlr.gov.cn/to_Login). The data were adjusted according to the connotations of EF based on current land use classification. The cultivated land and grassland were categorized as cropland and grassland, respectively. The garden land and forest land were merged into woodland. Urban villages, industrial and mining land and transportation land were merged into construction land. Waters and water conservancy facilities were combined as water area and other land (such as swamps, sands, etc.) would not be considered.

3.2. Methods

EF is herein divided into cropland, grassland, woodland, water area and construction land. Equivalence factors and yield factors are combined to align the measurement units. EC is the amount of land supplied in the study area; ES/ED is the difference when comparing EF with EC to represent the regional sustainability. The traditional EF model is shown below [1,2]:
E F = N × e f = N × i ( e f i × r i ) = N × i j ( C i j P i j × r i )
r i = j ( C i j × γ i j ) S i / i j ( C i j × γ i j ) i S i
where N is the population (cap); e f is per capita EF (hm2/cap); i is land use type; j is an item produced or consumed; r i is the equivalence factor; C i j is the production or consumption of i and j in the study area (kg; m3; kW·h); P i j is the production or consumption of i and j in the world (kg; m3; kW·h); γ i j is the average calorific value of i and j ; and S i is the biological production area of i in the study area (hm2).
The EC is calculated as follows:
E C = N × e c = N × i ( S i × r i × y i )
y i = j ( C i j × γ i j ) S i / j ( C i j × γ i j ) S i
where e c is per capita EC (hm2/cap); y i is the yield factor of i ; C i j is the production or consumption of i and j in the upper level area (kg; m3; kW·h); and S i is the biological production area of i in the upper level area (hm2). Note that the equivalence and yield factors of construction land are adjusted to the sum of 1/4, 1/4 and 1/2 of cropland, woodland and grassland, respectively, according to the actual occupation of the land use type.
Based on the above EF model, EFsize and EFdepth are introduced to represent natural capital flow occupancy and capital stock consumption, respectively. The formulas are as follows [11,14]:
E F s i z e = N × e f s i z e = N × i min { e f i , e c i }
E F d e p t h = e f d e p t h = 1 + i max { e f i e c i , 0 } i e c i
E F 3 D = E F s i z e × E F d e p t h
where E F s i z e , E F d e p t h , E F 3 D are ecological footprint size (hm2), ecological footprint depth and three-dimensional ecological footprint(hm2), respectively. e f s i z e , e f d e p t h are per capita ecological footprint size (hm2/cap) and ecological footprint depth, respectively. Smaller E F s i z e and larger E F d e p t h indicate a lower capacity for regional sustainable development.
EC calculated above is representing current productivity not involved in the potential of science and technology. We introduced a new metric, referred to as ECintensity, to estimate the EC3D needed to absorb the technology productivity to give more accurate prediction.
E C i n t e n s i t y = ( 1 + P k P 0 ) × ( 1 + M k M 0 ) × ( 1 + F k F 0 ) 3
E C 3 D = E C × E C i n t e n s i t y
where E C i n t e n s i t y is ecological carrying capacity intensity; k is the city/league of IMAR; P k , M k , F k are the numbers of patent applications per capita, scientific and tech researcher ratio and funds per capita ratio of R&D in the city/league (k), respectively; P 0 , M 0 , F 0 are the numbers of patent applications, scientific and tech researcher ratio and funds ratio of R&D in IMAR (relative to 1993 data), respectively; and E C 3 D is three-dimensional ecological carrying capacity.
E D 3 D = E C 3 D E F 3 D
where E D 3 D is the three-dimensional ecological deficit, meaning ecological surplus if E D 3 D > 0 and ecological deficit if E D 3 D < 0.

4. Results

4.1. Analysis of Ecological Footprint

4.1.1. Ecological Footprint Size and Composition

EFsize represented the capital flow occupancy (Figure 2). EFsize of IMAR representing the region average value showed a downward trend from 4.20 hm2/cap to 3.74 hm2/cap. The spatial differences between cities/leagues were relatively large and varied little over time, except for Hohhot and Alxa. Due to higher equivalence factors of cropland, EFsize in Alxa League was the highest, decreasing from 64.26 hm2/cap to 41.11 hm2/cap; EFsize values for Hulunbuir, Xilin Gol, Banyannur and Erdos were also higher than the average of IMAR, with different fluctuation ranges. Others that were lower than the mean value of region indicated less occupation of capital flow. Among them, Hohhot had the largest decline of 44.05%, while interannual fluctuations of Baotou, Tongliao and Ulanqab were relatively small.
The land use type EFsize values were further analyzed (Figure 3). Cropland EFsize of IMAR constituted the highest proportion, representing 70.43–75.24%; grassland decreased from 21.63% to 16.42%; construction land showed a steady growth trend (6.79–7.98%); woodland decreased rapidly from 0.98% to 0.15%; and the water area stabilized at around 0.20%. EFsize had different proportions of land use in various cities/leagues. Grassland EFsize of Hohhot accounted for the highest proportion and reduced from 79.68% to 68.86%. The dominant land use type with respect to EFsize in Baotou was changed from grassland to cropland in 2014. Similarly, grassland EFsize of Ulanqab still dominated during the study period and it was expected to be replaced by cropland in the subsequent few years. Cropland EFsize in Hulunbuir, Hinggan, Tongliao, Chifeng, Erdos, Banyannur and Alxa accounted for the largest proportion, at around 90.00% and the other land use types had minimal impacts. Grassland EFsize of Xilin Gol accounted for the largest proportion (56.00%), followed by cropland, with an inverted U-shaped trend (33.58%). Excluding a significant proportion (55.70–58.75%) of construction land in Baotou due to its larger built-up area, the other land use types’ EFsize varied little over time.

4.1.2. Ecological Footprint Depth

EFdepth indicated the degree of capital stock consumption. In the 12 cities/leagues, EFdepth values all exceeded the original value of 1.00 (Figure 4). During the study period, the average EFdepth of IMAR reached 7.00, indicating that capital flow was far from meeting the demand and that capital stock was largely occupied. EFdepth differed significantly between cities/leagues, with features reduced from west to east. EFdepth of Wuhai reached up to 71.52 and values for Alxa, Erdos, Baotou and Xilin Gol were all higher than the average of IMAR. The minimum was 2.30 in Hohhot, with more sustainable development relatively. Temporally, Wuhai held the largest EFdepth (50.03–81.15), with a downward trend from 2015, indicating that its stock consumption rate was decreasing while still remaining relatively high. Contrary to the trend of EFsize, EFdepth in Erdos and Baotou exceeded the average depth of the region and stabilized in recent years. EFdepth of Xilin Gol was inverted with a U-shaped trend, reaching a maximum of 10.79 in 2012. EFdepth in Ulanqab held the highest annual growth rate (13.66%), indicating severely consumed capital stock. EFdepth in Hohhot was the smallest and roughly weakened over time.

4.1.3. Three-Dimensional Ecological Footprint

The EF3D analysis results were further analyzed. EF3D per capita of Alxa was the highest among the 12 cities/leagues, with an average value of 985.60 hm2/cap. Wuhai, Xilin Gol and Erdos surpassed the mean IMAR value of 28.03 hm2/cap. Hohhot held the smallest value of 6.07 hm2/cap, which was consistent with the spatial distribution of EFsize. Temporally, EF3D in Alxa decreased from 965.47 hm2/cap in 2010 to 901.87 hm2/cap in 2013, then rebounded to 986.88 hm2/cap, which was determined by EFsize reduction and EFdepth increase; EF3D of Wuhai and Erdos were on the rise, while the former’s rate (10.26%) was much higher than the latter’s (4.29%). Xilin Gol first increased and then decreased and reached the highest value of 70.32 hm2/cap in 2013. The fluctuation trend was greatly affected by EFdepth. The remaining eight cities/leagues’ values were lower than the average EF3D value of IMAR. The trend of Hulunbuir, Tongliao, Tongliao and Hinggan fluctuated similarly and tended to be flat after steady growth. Hohhot reached a peak of 7.43 hm2/cap in 2011 and rapidly dropped to 4.48 hm2/cap in 2016 and was the only city with EF3D decreased due to the reduced EFsize.

4.2. Analysis of Ecological Carrying Capacity

4.2.1. Ecological Carrying Capacity

EC indicated the current carrying capacity of the existing land and the trends were obtained. The per capita EC of IMAR showed a downward trend from 4.69 hm2/cap in 2010 to 3.94 hm2/cap in 2016. The differences between cities/leagues were remarkable. Temporally, EC of each city/league except Hohhot and Alxa varied little over time. Alxa had the highest value (65.32–41.65 hm2/cap), mainly being affected by the large equivalence factors of cropland and construction land and was consistent with the EFsize curve. EC of cities/leagues were similar to their EFsize ranking. EC in Hohhot gradually declined from 4.24 hm2/cap to 2.17 hm2/cap, indicating that its unsustainable state was becoming more severe; Ulanqab and Baotou held the lowest EC, with downward trends. Different cities/leagues held significantly different proportions of land use types. The trend curves of the EC ratios were roughly similar to EFsize, except for woodland.

4.2.2. Ecological Carrying Capacity Intensity

ECintensity indicated the potential carrying capacity of resources and social capital. In all 12 cities/leagues, ECintensity exceeded the basic value of 1.00, representing higher potential support (Figure 5). This showed that the social capital can help regional development to meet the higher EC. During the study period, the average ECintensity value of IMAR reached 5.20, indicating that the potential carrying capacity of IMAR was not yet fully developed. ECintensity differed significantly between cities/leagues; the values in central IMAR were higher than others. As the capital and science and education center of IMAR, ECintensity in Hohhot reached 10.54, indicating that the potential for the development of current technology had increased by more than tenfold compared to 1993 under the same conditions; the next was Erdos (5.78), being directly related to its GDP ranking and higher patent possession per capita. ECintensity of other cities/leagues without obvious variation difference were lower than the regional value. The smallest were Hinggan (2.70) and Ulanqab (2.52), with lower patent ownership, technician numbers and funding, resulting in low technological innovation capacity. With the progress of socioeconomic level, the technological level improved significantly. The overall mean ECintensity of IMAR continued to increase from 3.82 in 2010 to 6.65 in 2016. Hohhot had the highest value, rising from 7.80 to 10.54, being much higher than that of other areas with slightly slowing growth rates; ECintensity of Baotou rapidly increased from 3.42 to 7.48 and the per capita patent ownership even surpassed that of Hohhot in some years and investment in research funding had also rapidly increased, indicating great potential for regional development; ECintensity values of Tongliao, Hulunbuir and Chifeng were relatively close and had similar trend curves; the lowest values in Hinggan (2.06–3.24) and Ulanqab (1.92–3.18) showed a upward trend in line with lower per capita patent ownership and GDP.

4.2.3. Three-Dimensional Ecological Carrying Capacity

The EC3D results could be divided into three levels. Alxa was much higher than the others (220.05 hm2/cap), as influenced by its high EC. Hohhot, Xilin Gol, Hulunbuir, Erdos and Banyannur were distributed in the range of 20.00–40.00 hm2/cap and the remaining ones fell into the range of 5.00–10.00 hm2/cap. Excluding Hohhot, the spatial distribution of EC3D was relatively consistent with EC. Temporally, the EC3D of Hohhot reached a peak of 43.68 hm2/cap in 2015 and plummeted to 28.61 hm2/cap in 2016. Increased ECintensity did not reverse the downward trend of EC, resulting in Hohhot being the only city reduced in EC3D during the study period; Xilin Gol and Hulunbuir showed a steady growth trend with average annual growth rates of 18.40% and 8.14%, respectively. Erdos and Banyannur experienced a stepwise fluctuation and reached their maximum EC3D values in 2016. With no change during the period of 2010–2014, EC3D in Wuhai grew rapidly and surpassed Ulanqab due to increasing ECintensity.

4.3. Three-Dimensional Ecological Deficit Analysis

ED3D was further analyzed compared EC3D with EF3D. As shown in Figure 6, the green color represents a lower ecological deficit or surplus, while the yellow and red colors represent a higher deficit value. There was no obvious agglomeration effect on the spatial pattern. ED3D of Alxa was the highest and the average value reached 765.55 hm2/cap. Values for Wuhai, Erdos, Xilin Gol and Baotou exceeded the average value of IMAR (5.70 hm2/cap). Chifeng, Ulanqab and Tongliao stayed in deficit, while Hohhot, Banyannur, Hulunbuir and Hinggan possessed a surplus. Temporally, ED3D in IMAR decreased from 5.74 hm2/cap in 2010 to 3.65 hm2/cap, indicating that the sustainability improved but it was still in a deficient state during the study period; ED3D of Alxa fell from 810.95 hm2/cap to 757.52 hm2/cap, indicating that it had a tendency to turn deficit into surplus; ED3D in Wuhai showed a significant increasing trend from 47.74 hm2/cap to 86.90 hm2/cap, which should be paid more attention. Xilin Gol had a U-shaped trend reaching a maximum of 44.28 hm2/cap (2012) and decreasing to 7.89 hm2/cap (2016). Hinggan was the only area that reversed deficit into surplus during the research period (2013) and possessed continuous surplus related to abundant natural resources. The surplus of Hulunbuir changed linearly from 5.12 hm2/cap (2010) to 1.75 hm2/cap (2013) and then rapidly increased to 12.28 hm2/cap in 2016; Hohhot’s surplus was the highest, rising from 26.82 hm2/cap (2010) to 38.48 hm2/cap (2015) but fell to 24.13 hm2/cap, which was related to the very steep decline of EC3D in 2016.
The land use type ED3D values were further analyzed. Cropland ED3D of IMAR constituted the highest proportion, representing 86.93–102.70%. The deficit of cropland in 2015–2016 was even higher than the total deficit, followed by grassland, accounting for 24.66%. The deficits of construction land and water area were small and basically unchanged. Woodland surplus was showing a downward trend (1.79–1.32 hm2/cap). The surplus/deficit of land use types between cities/leagues were quite different. All land use types in Hohhot were surplus and grassland surplus was the largest, followed by construction land and cropland. ED3D of Hinggan turned deficit into surplus in 2014, while woodland held a surplus during study period. The land use types, except for woodland, of seven cities/leagues, namely Baotou, Xilin Gol, Ulanqab, Tongliao, Chifeng, Erdos and Alxa, were insufficient, as influenced by cropland and grassland deficits. Wuhai only held a surplus in 2015–2016. Construction land deficit accounting for the largest proportion (56.61–59.04%) was directly related with high urbanization rate (94.7%).

5. Discussion

5.1. Analysis of Factors Influencing EFsize

Herein, GDP1, GDP2 and GDP3 respectively represent the GDP of primary, secondary and tertiary industry. Abundant resources tend to have higher EFsize with larger GDP1. EFsize of construction land, cropland and grassland in IMAR were relatively large, representing high occupancy of natural capital flows. As an important energy base and the main grain-producing area in China, energy consumption (construction land) and mutton (grassland) had large EF, indicating high resource utilization. Mutton production was important to grassland EFsize, reflecting a climate suitable for stockbreeding. There were slight differences in various land use types between cities/leagues. The increases of EFsize in Hinggan and Xilin Gol were explored; the continuously improved yield factors of cropland, being the dominant land use type, were the main factor in Hinggan. Rapid increases of built-up area in Xilin Gol contributed to an increase of construction land EFsize, even with downward equivalence factors, resulting in a steady increase in EFsize. Also, we revised the local equivalence and yield factors in various cities/leagues in order to directly improve accuracy of the results [37].
Population density (POPdensity) in the 12 cities/leagues can be ranked as follows: Wuhai > Hohhot > Baotou > Tongliao > Chifeng > Ulanqab > Hinggan > Banyannur > Erdos > Hulunbuir > Xilin Gol > Alxa. POPdensity changed little during the study period and was significantly negatively correlated with EFsize in various cities/leagues, as found using SPSS 23 software. Pearson correlation coefficient was −0.294 (Table 2) and the regression equation was most suitable with the power function (R2 = 0.84). Areas with lower POPdensity correspondingly tend to have higher EFsize per capita. Population concentration should be controlled to improve EFsize, especially in industrial regions.
EFsize per unit of GDP could be used to characterize the demand of natural capital in the local economy. The relationship between GDP per capita and EFsize per capita was further explored (Table 2). It was found that EFsize was extremely significantly correlated with GDP, with a Pearson correlation coefficient of 0.416. There was no significant correlation with GDP1 and GDP3, while there was a significant positive correlation with GDP2, with a still-higher correlation coefficient (0.602). Therefore, the structure of the second industry should be prioritized for improving energy efficiency to increase EFsize.

5.2. Analysis of Factors Influencing EFdepth

Larger EFdepth indicated that capital stock consumption had intensified and factors affecting the changes in various cities/leagues were explored. Construction land and cropland EF were the dominant sources for the ED. Herein, all energy consumptions were compiled to calculate construction land EF, resulting in the highest EFdepth far exceeding the original value (1.00). Due to high-yield production, especially of grain and lack of sufficient arable land, cropland EFdepth also contributed a larger proportion of total EFdepth. Among them, grain (cropland) and mutton (grassland) had higher EF, while the factors affecting the EFdepth between cities/leagues were slightly different. For Wuhai, Alxa and Baotou, construction land was absolutely dominant in EFdepth, while croplands had more influence in Hinggan and Tongliao. An analysis of changes in woodland EFsize and EFdepth during the period of 2010–2016 revealed a significantly negative correlation (R2 = 0.42). That indicated the achievement of protecting forest resources to improve woodland EC. Construction land EF3D and EFdepth changes were significantly positive, with a larger linear regression coefficient (R2 = 0.62), which was consistent with other studies [16,18]. Control of energy consumption can effectively relieve natural capital stock depletion. Energy reduction requires decreasing the amount of energy consumption and optimizing of the energy consumption structure. This essay used energy consumption instead of production to characterize EF in order to be more realistic, while the energy use such as through coal was transmitted to Central China and North China through trade and energy EF was still high in the total amount. Economically developed regions can make up for ED through import. It is difficult to reduce the total amounts of energy needed for social and economic development nowadays. Priority should be given to adjust the industrial structure, improve the utilization of clean energy and improve energy efficiency.
As a new industrial city, Wuhai had a higher energy consumption and its EFdepth was the highest. Xilin Gol and Erdos possess rich mineral resources, such as coal and natural gas; therefore; the resource exploitation is the major driving force for increasing EFdepth. In 2012, the renewable energy microgrid demonstration project and grid-connected photovoltaic power generation project carried out in Xilin Gol were of great significance for energy efficient utilization. The EFdepth was reduced since 2013, with obvious effects of energy saving and emission reduction.
The POPdensity was significantly positively correlated with EFdepth, with the Pearson correlation coefficient reaching 0.776 (Table 2) and regression equation was most suitable with a parabolic polynomial function (R2 = 0.68). Areas with lower or higher POPdensity tended to have higher EFdepth values. It indicated that the medium-density population was most suitable and population concentration should be controlled reasonably, which was similar with compact cities’ results [38].
The relationship between per capita GDP and EFdepth was evaluated (Table 2). It was found that EFdepth was positively correlated with GDP and the Pearson correlation coefficient was 0.333. EFdepth was very significantly negatively correlated with the GDP1, while being positively correlated with GDP2 and GDP3; Pearson correlation coefficient was 0.388 and 0.216, respectively. The linear regression equation of EFdepth and GDP1, GDP2 and GDP3 was: EFdepth = 38.183 − 45.875 * GDP1 + 1.619 * GDP2 − 2.211 * GDP3 (R2 = 0.47). It showed that adjusting the industrial structure and reducing the GDP2 played an important role in reducing EFdepth.
Lower GDP1 and large GDP2 indicated that natural resources are scarce and energy consumption is vigorously consumed. Among the cities/leagues, GDP2 in Wuhai, Alxa, Baotou and Erdos accounted for the highest proportion, which corresponded to high EFdepth. Xilin Gol and Erdos have national key coal-fired power bases, reflecting relatively larger EFsize and lower EFdepth. The rapid economic growth in IMAR was largely due to the rapid development of the secondary industry. Therefore, we should continue to adjust the industrial structure, adhere to the new agricultural and animal husbandry industrialization and urbanization strategies, enlarge and strengthen the dominant industries and constantly upgrade the industrial level to enhance the vitality of economic development.
To further explore the relationship between per capita EF3D and GDP, a significantly positive correlation was found, with a high Pearson correlation coefficient (0.471) and higher coefficient (0.645) for GDP2. The linear regression equation of EF3D and GDP was: EF3D = 2.939 − 59.529 * GDP1 + 71.34*GDP2 − 65.169 * GDP3 (R2 = 0.58). It showed that improving the primary and tertiary industries would weaken EF3D. Moreover, the annual GDP2 change had a significantly negative correlation with EF3D change, indicating that the rapid growth of the economy contributed to a higher decline rate of EF3D.
Further analysis of the relationship between EF3D and GDP during the period of 2010–2016 produced inflection points similar to those in the Kuznets curve (Figure 7). It indicated that there may be an inverted N-type curve between EF3D and economic development in IMAR, which was different compared with the results of Shandong [18], as proved by the ecosystem services footprint model [39]. EF3D and GDP were negatively correlated when per capita GDP was and GDP were negatively correlated when per capita GDP was <5.29 and >16.37 and possessed an upward trend between 5.29 and 16.37. The decrease in EF3D in the former was related to energy efficiency improvement and clean energy expansion through high technology levels. EF3D was continually reduced in the earlier years. When GDP reached a certain level, prospects for improvements in energy efficiency would stagnate, resulting in an increase of EF3D, while the latter one was more contributed to energy transmission to other regions, such as East China, as discussed above. It should be noted that resources were still being consumed for economic prosperity and this trend could not change in the near future due to the National Energy Strategy. Although the relationship between economy and EF3D should be verified further, the results still could guide population migration, formulation of industrial policies and rational development of energy in IMAR.

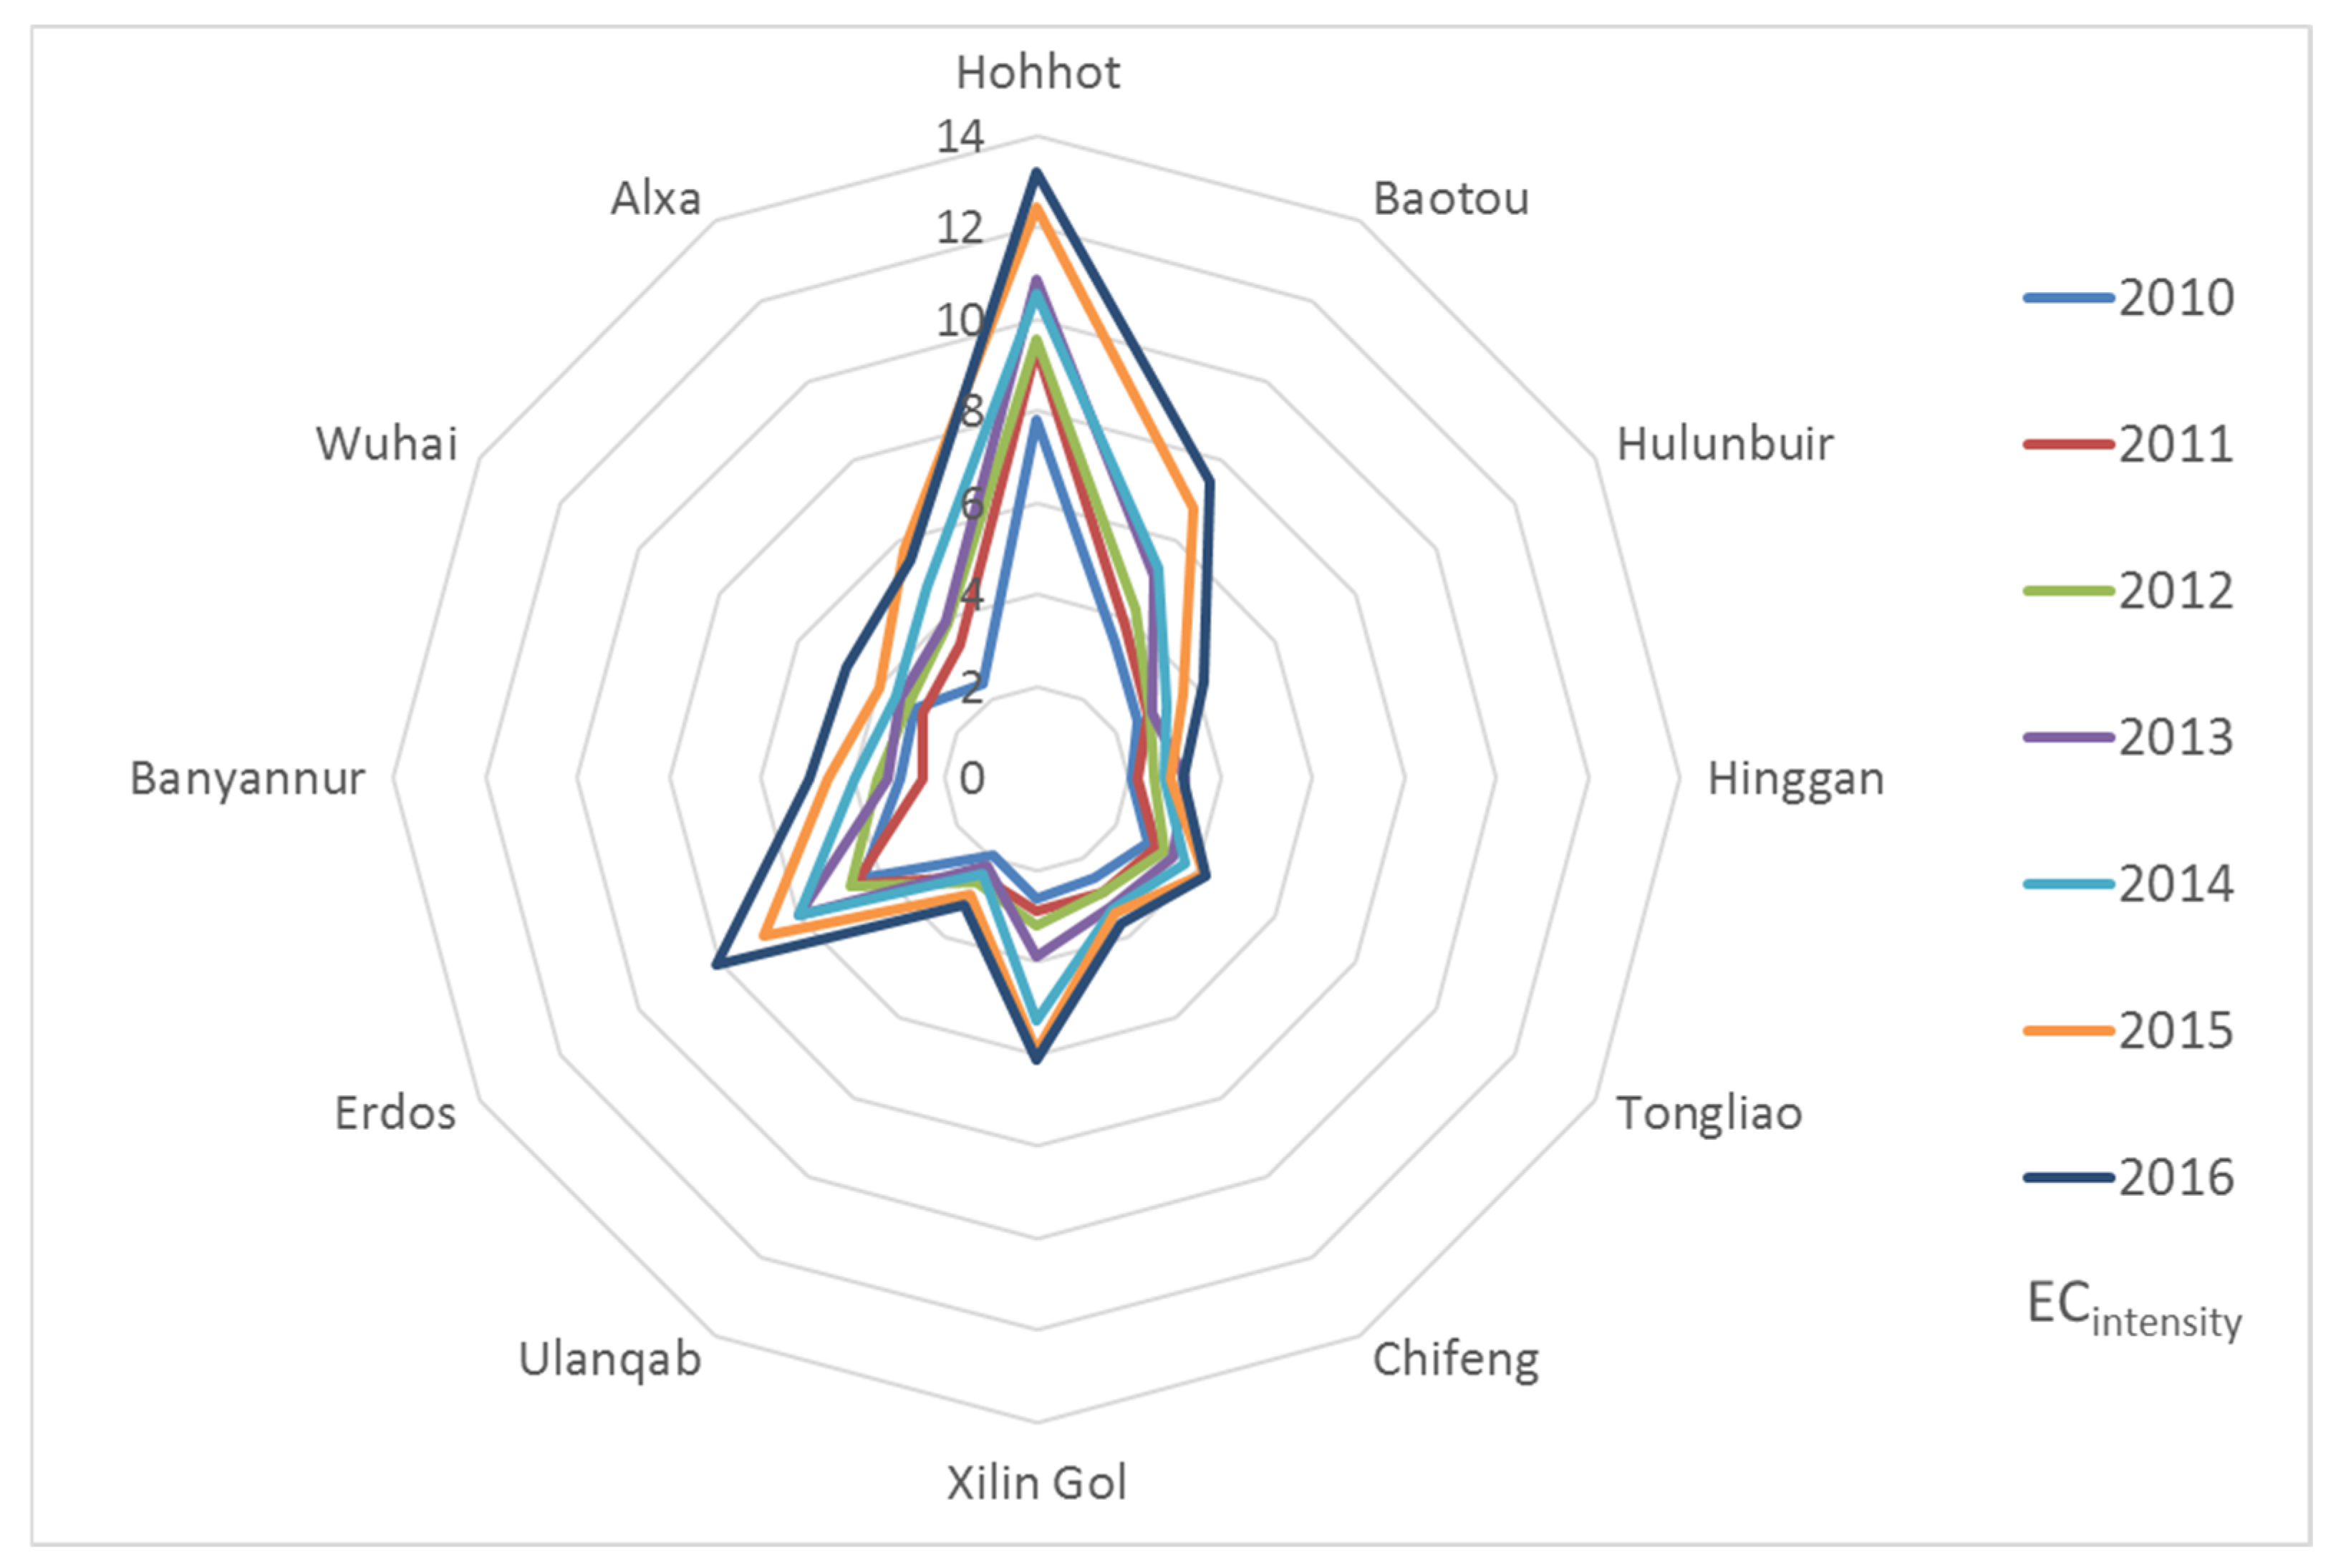
5.3. Analysis of Factors Influencing ECintensity

Due to comprising the primary productive forces, the science and technology level has a crucial impact on ECintensity besides the natural endowments of the region. The input of human and financial resources is most closely related to the region’s economy, science and education and talent policies. This paper selected the input of scientific and technical personnel and funding coupled with patent output to construct the factor. ECintensity showed an upward trend during the study period and the capital city of Hohhot had more advantages. The per capita patent ownerships of Baotou, Hohhot and Erdos were the highest, indicating that the technological output capacity was relatively stronger. The proportion of researchers in Hohhot was much higher than in other cities/leagues and the sharp rise of researchers in Xilin Gol in 2014 led to a rapid increase of ECintensity, which was directly related to talent policies. As for per capita funding, Hohhot and Baotou showed a steady rise, while Erdos showed a downward trend and the increase rate of investment was slightly lower than that of researchers. From the geographical analysis, it was found that cities/leagues with higher ECintensity had a significant industrial location effect related to the concentration of national key laboratories and high-tech zones. Meanwhile, it was related to the promotion of interregional scientific and technological activities. The innovation capability of IMAR will be stronger with implementation of the Medium and Long-Term Talent Development Plan and “Prairie Talents.”
Upon further exploration of the relationship between ECintensity and GDP (Table 2), it was found that ECintensity was positively correlated with per capita GDP and especially with GDP3. It showed that economic prosperity had a positive effect on ECintensity. Also, it reflected the promotion function of the mutual transformation of economic and technological interaction. Adjusting the industrial structure and increasing GDP3 plays an important role in EC3D improvement.
With continuous development and optimization of the EF model, numerous studies have been performed on the relationship between EF and economy. Studies have shown that the economy has a significant impact on EFdepth and that drives relationships that can be used to effectively alleviate environmental pressures arising from economic development [40,41]. However, due to the relatively limited number of years selected in the cross-sectional data, the relationship between economic development and EFdepth requires further verification, especially considering technological innovation and talent cultivation. The policy formulation of the industrial system toward a sustainable future should be made, taking into account the balance between EFdepth and ECintensity.

5.4. Method Comparison and Policy Suggestions

The occupancy ratios of natural capital stock and flow in the study area are identified based on the 3DEF model. The contradiction between resource consumption and supply can be more intuitively represented, which compensates for the shortcomings of the traditional two-dimensional model on human environmental impact assessment. It can reflect laterally that there is still room for improvement in EC when coupled with ECintensity. On the one hand, it emphasizes the ecosystem function integrity and quality of land use; on the other hand, it is more directly related to the human production lifestyle. In a certain sense, it corrects the shortcomings of only paying attention to the quantity of land in the traditional model. Compared with previous evaluations of the 3DEF model, developed regions [16,28,40] are more unsustainable, which is inconsistent with the actual nature of the social and economic development, while using net primary production or emergy [6,42] for calculating EF and EC still ignores the impacts of social and economic factors. The introduction of ECintensity as part of the carrying capacity plays an important role in reducing the research gap. Essentially, it is the correction of equivalence and yield factors coupling with social components. We hope to work together with scholars to identify the natural EC boundary under the framework of the social–economic–natural complex ecosystem.
Increased carrying capacity for sustainable development should stem from reducing EFdepth and elevating EFsize and ECintensity. EFsize is significantly affected by natural endowments, EFdepth is widely affected by resource consumption and ECintensity is largely affected by science and technology. Therefore, it is necessary to correspondingly reduce the energy consumption, optimize the industrial structure and improve the technological innovation ability. Numerous studies have shown that IMAR was unsustainable at the time of research. However, previous studies did not consider the human subjective initiative in social development. This study conducted an empirical study taking the potential productivity of science and technology into account. Gobi-land cultivation systems and rotational grazing systems could be sustainable management tools for IMAR [43,44]. Different farming methods produced different results, particularly in the carbon footprint, besides grain production and soil carbon storage [45]. As an example, semi-intensive pond farming is more sustainable than intensive cage farming in Lake Kariba [46]. When promoting the economy, each city/league should engage in development opportunities and optimize industrial and energy structures based on local conditions. For instance, Hulunbuir and Xilin Gol should implement the guiding concepts ‘lucid waters and lush mountains are invaluable assets’ based on their current natural resources in order to maintain carrying capacity.

6. Conclusions

Using the revised 3DEF model, we calculated the per capita EFsize and EFdepth of 12 cities/leagues in IMAR in 2010–2016 and analyzed the factors influencing these values. ECintensity was introduced when calculating EC3D as a potential intensity for sustainable development to avoid excessively conservative estimates. In different cities/leagues, the results indicated a state of ecological surplus/deficit; most of them held relatively high ecological pressure, even considering the potential productivity of technology. EFdepth and ECintensity all sharply exceeded the original value of 1.00. Capital flow deficit led to heavy capital stock consumption, while technological innovation could improve potential carrying capacity. Resource overutilization continued even with the high technological level in eight cities/leagues in Midwest Inner Mongolia. The surplus/deficit was determined by population density, industrial structures and scientific and technological level besides natural endowment. Meanwhile, based on the spatial scale of the city/league, it is more appropriate to focus on the interregional trade adjustment and industrial upgrading than to evaluate a provincial administrative region separately. The revised model emphasizes the subjective initiative of human beings, which explains to some extent that the sustainability of cities is superior to rural areas, which is obviously more in line with the reality of social and economic development. The results can support decision-making regarding the distribution and regulation of urban populations, industrial layout and economic policy in regions such as IMAR.
The inventory and driving factors for EC3D should be further studied. Scientific and technological activities in enterprises accounted for about half of the related industry in IMAR, as we constructed ECintensity only using the government’s personnel and funds. There still remains a problem regarding accessing the data in common databases which would be beneficial to apply to other regions with essential datasets. It is necessary to establish the EF inventory and more accurate results of EC3D should be estimated with long-time series data. Simultaneously, spatial correlation characteristics need to be further analyzed. The global effects of material circulation, energy transmission and information exchange must be considered. It is difficult to identify the dynamic source and sink relationship of each city/league due to the inaccessibility of internal and external trade data. Generally, as the developed animal husbandry and key national energy base, IMAR plays an important ‘source’ role for other regions. The results are significant for the rational allocation of resources, optimization of industrial structures and promotion of socioeconomic development to achieve harmony between nature and human beings.

Author Contributions

Y.W. conceived and performed the research. H.W. conceived and made valuable comments and suggestions on the writing and revision of the paper. Y.J. and Y.Z. participated in data collection and paper correction. All authors had read and approved this manuscript.

Funding

This research is supported by the National Natural Science Foundation of China (41571148), the National Key R&D Program of China (2016YFC0501101) and Strategic Priority Research Program (A) of the Chinese Academy of Sciences (XDA23030103).

Acknowledgments

The authors would like to thank Jingzhu Zhao at the Institute of Urban Environment, Chinese Academy of Sciences for the generous comments and inspiration, which greatly improved the manuscript. The authors also thank the anonymous referees for their comments.

Conflicts of Interest

The authors declare no conflict of interest.

Nomenclature

Acronyms
EFecological footprint
ECecological carrying capacity
ESecological surplus
EDecological deficit
EFsizeecological footprint size
EFdepthecological footprint depth
EF3Dthree-dimensional ecological footprint
ECintensityecological carrying capacity intensity
EC3Dthree-dimensional ecological carrying capacity
ED3Dthree-dimensional ecological deficits
GDPGross Domestic Product
GDP1GDP of primary industry
GDP2GDP of secondary industry
GDP3GDP of tertiary industry
POPdensitypopulation density
IMARInner Mongolia Autonomous Region

References

  1. Ress, W.E.; Wackernagel, M. Ecological Footprints and Appropriated Carrying Capacity: Measuring the Natural Capital Requirements of the Human Economy. Focus 1994, 6, 121–130. [Google Scholar]
  2. Wackernagel, M.; Rees, W.E. Perceptual and structural barriers to investing in natural capital: Economics from an ecological footprint perspective. Ecol. Econ. 1997, 20, 3–24. [Google Scholar] [CrossRef]
  3. Zhang, L.; Dzakpasu, M.; Chen, R.; Wang, X.C.C. Validity and utility of ecological footprint accounting: A state-of-the-art review. Sust. Cities Soc. 2017, 32, 411–416. [Google Scholar] [CrossRef]
  4. Venetoulis, J.; Talberth, J. Refining the ecological footprint. Environ. Dev. Sustain. 2008, 10, 441–469. [Google Scholar]
  5. Stöglehner, G. Ecological footprint—A tool for assessing sustainable energy supplies. J. Clean. Prod. 2003, 11, 267–277. [Google Scholar] [CrossRef]
  6. Pan, H.Y.; Zhuang, M.F.; Geng, Y.; Wu, F.; Dong, H.J. Emergy-based ecological footprint analysis for a mega-city: The dynamic changes of Shanghai. J. Clean. Prod. 2019, 210, 552–562. [Google Scholar] [CrossRef]
  7. Nakajima, E.S.; Ortega, E. Carrying capacity using emergy and a new calculation of the ecological footprint. Ecol. Indic. 2016, 60, 1200–1207. [Google Scholar]
  8. Balezentis, T.; Streimikiene, D.; Melnikiene, R.; Zeng, S.Z. Prospects of green growth in the electricity sector in Baltic States: Pinch analysis based on ecological footprint. Resour. Conserv. Recycl. 2019, 142, 37–48. [Google Scholar] [CrossRef]
  9. Peng, B.H.; Wang, Y.Y.; Elahi, E.; Wei, G. Evaluation and Prediction of the Ecological Footprint and Ecological Carrying Capacity for Yangtze River Urban Agglomeration Based on the Grey Model. Int. J. Environ. Res. Public Health 2018, 15, 2543. [Google Scholar] [CrossRef] [PubMed]
  10. Monfreda, C.; Wackernagel, M.; Deumling, D. Establishing national natural capital accounts based on detailed Ecological Footprint and biological capacity assessments. Land Use Policy 2004, 21, 231–246. [Google Scholar] [CrossRef]
  11. Niccolucci, V.; Bastianoni, S.; Tiezzi, E.B.P.; Wackernagel, M.; Marchettini, N. How deep is the footprint? A 3D representation. Ecol. Model. 2009, 220, 2819–2823. [Google Scholar] [CrossRef]
  12. Niccolucci, V.; Galli, A.; Reed, A.; Neri, E.; Wackernagel, M.; Bastianoni, S. Towards a 3D National Ecological Footprint Geography. Ecol. Model. 2011, 222, 2939–2944. [Google Scholar] [CrossRef]
  13. Kai, F.; Reinout, H. A Review on Three-Dimensional Ecological Footprint Model for Natural Capital Accounting. Prog. Geogr. 2012, 31, 1700–1707. [Google Scholar]
  14. Kai, F. Assessing the natural capital use of eleven nations: An application of a revised three-dimensional model of ecological footprint. Acta Ecol. Sin. 2015, 35, 3766–3777. [Google Scholar]
  15. Xiaobing, L.I.; Tian, M.; Wang, H.; Wang, H.; Jingjing, Y.U. Development of an ecological security evaluation method based on the ecological footprint and application to a typical steppe region in China. Ecol. Indic. 2014, 39, 153–159. [Google Scholar]
  16. Yueyue, D.U.; Peng, J.; Gao, Y.; Zhao, H. Sustainability evaluation of natural capital utilization based on a three-dimensional ecological footprint model:A case study of the Beijing-Tianjin-Hebei Metropolitan region. Prog. Geogr. 2016, 35, 1186–1196. [Google Scholar]
  17. Peng, J.; Jian Sheng, W.U.; Jiang, Y.Y.; Min Ting, Y.E. Shortcomings of applying ecological footprints to the ecological assessment of regional sustainable development. Acta Ecol. Sin. 2006, 26, 2716–2722. [Google Scholar]
  18. Xun, F.F.; Hu, Y.C. Evaluation of ecological sustainability based on a revised three-dimensional ecological footprint model in Shandong Province, China. Sci. Total Environ. 2019, 649, 582–591. [Google Scholar] [CrossRef]
  19. Yi, Y.; Hu, D. Natural capital utilization based on a three-dimensional ecological footprint model: A case study in northern Shaanxi, China. Ecol. Indic. 2018, 87, 178–188. [Google Scholar]
  20. Yi, Y.; Sun, L.; Zhang, T.; Yao, C. Three-Dimensional Ecological Footprint Assessment for Ecologically Sensitive Areas: A Case Study of the Southern Qin Ling Piedmont in Shaanxi, China. J. Clean. Prod. 2018, 194, 540–553. [Google Scholar]
  21. Global Footprint Network, The National Footprint Accounts, 2016th ed.; Global Footprint Network: Oakland, CA, USA, 2016.
  22. Lin, D.; Wackernagel, M.; Galli, A.; Kelly, R. Ecological Footprint: Informative and evolving—A response to van den Bergh and Grazi (2014). Ecol. Indic. 2015, 58, 464–468. [Google Scholar] [CrossRef]
  23. Wetzel, K.R.; Wetzel, J.F. Sizing the earth: Recognition of economic carrying capacity. Ecol. Econ. 1995, 12, 13–21. [Google Scholar] [CrossRef]
  24. Andersson, J.O.; Lindroth, M. Ecologically unsustainable trade. Ecol. Econ. 2001, 37, 113–122. [Google Scholar] [CrossRef]
  25. Destek, M.A.; Sarkodie, S.A. Investigation of environmental Kuznets curve for ecological footprint: The role of energy and financial development. Sci. Total Environ. 2019, 650, 2483–2489. [Google Scholar] [CrossRef]
  26. Liddle, B. What are the carbon emissions elasticities for income and population? Bridging STIRPAT and EKC via robust heterogeneous panel estimates. Glob. Environ. Chang. 2015, 31, 62–73. [Google Scholar] [CrossRef] [Green Version]
  27. Rashid, A.; Irum, A.; Malik, I.A.; Ashraf, A.; Liu, R.; Liu, G.; Ullah, H.; Ali, M.U.; Yousaf, B. Ecological footprint of Rawalpindi; Pakistan’s first footprint analysis from urbanization perspective. J. Clean. Prod. 2017, 170, 362–368. [Google Scholar] [CrossRef]
  28. Mcdonald, G.W.; Patterson, M.G. Ecological Footprints and interdependencies of New Zealand regions. Ecol. Econ. 2004, 50, 49–67. [Google Scholar] [CrossRef]
  29. Zhao, J.; Xin, L.; Dong, R.; Shao, G. Landsenses ecology and ecological planning toward sustainable development. Int. J. Sustain. Dev. World Ecol. 2016, 23, 293–297. [Google Scholar] [CrossRef]
  30. Pickett, S.T.A.; Cadenasso, M.L.; Grove, J.M. Resilient cities: Meaning, models, and metaphor for integrating the ecological, socio-economic, and planning realms. Landsc. Urban Plan. 2004, 69, 369–384. [Google Scholar] [CrossRef]
  31. Chojnacka, K.; Kowalski, Z.; Kulczycka, J.; Dmytryk, A.; Gorecki, H.; Ligas, B.; Gramza, M. Carbon footprint of fertilizer technologies. J. Environ. Manag. 2019, 231, 962–967. [Google Scholar] [CrossRef]
  32. Steffen, W.; Richardson, K.; Rockström, J.; Cornell, S.E.; Fetzer, I.; Bennett, E.M.; Biggs, R.; Carpenter, S.R.; Vries, W.D.; Wit, C.A.D. Planetary boundaries: Guiding human development on a changing planet. Science 2015, 347, 1259855. [Google Scholar] [CrossRef]
  33. Harrigan, K.R.; Guardo, M.C.D.; Bo, C. Multiplicative-innovation synergies: Tests in technological acquisitions. J. Technol. Transf. 2017, 42, 1212–1233. [Google Scholar] [CrossRef]
  34. Chertow, M.R. The IPAT Equation and Its Variants. J. Ind. Ecol. 2000, 4, 13–29. [Google Scholar] [CrossRef]
  35. About Inner Mongolia. (In Chinese). Available online: http://www.nmg.gov.cn/col/col4191/index.html (accessed on 13 December 2018).
  36. Wackernagel, M.; Onisto, L.; Bello, P.; Callejas Linares, A.; Susana López Falfán, I.; Méndez García, J.; Isabel Suárez Guerrero, A.; Guadalupe Suárez Guerrero, M. National natural capital accounting with the ecological footprint concept. Ecol. Econ. 1999, 29, 375–390. [Google Scholar] [CrossRef]
  37. Wang, Z.; Lin, Y.; Yin, J.; Zhang, B. Assessment and prediction of environmental sustainability in China based on a modified ecological footprint model. Resour. Conserv. Recycl. 2017, 132, 301–313. [Google Scholar] [CrossRef]
  38. Zhao, J.; Song, Y.; Tang, L.; Shi, L.; Shao, G. China’s cities need to grow in a more compact way. Environ. Sci. Technol. 2011, 45, 8607–8608. [Google Scholar] [CrossRef] [PubMed]
  39. Feng, Z.; Cui, Y.Z.; Zhang, H.B.; Gao, Y. Assessment of human consumption of ecosystem services in China from 2000 to 2014 based on an ecosystem service footprint model. Ecol. Indic. 2018, 94, 468–481. [Google Scholar] [CrossRef]
  40. Jian, P.; Du, Y.; Jing, M.; Liu, Z.; Liu, Y.; Hai, W. Sustainability evaluation of natural capital utilization based on 3D EF model: A case study in Beijing City, China. Ecol. Indic. 2015, 58, 254–266. [Google Scholar]
  41. Wang, J.; Dong, K. What drives environmental degradation? Evidence from 14 Sub-Saharan African countries. Sci. Total Environ. 2019, 656, 165–173. [Google Scholar] [CrossRef]
  42. Siche, R.; Agostinho, F.; Ortega, E. Emergy Net Primary Production (ENPP) as basis for calculation of Ecological Footprint. Ecol. Indic. 2010, 10, 475–483. [Google Scholar] [CrossRef]
  43. Perotti, E.; Probo, M.; Pittarello, M.; Lonati, M.; Lombardi, G. A 5-year rotational grazing changes the botanical composition of sub-alpine and alpine grasslands. Appl. Veg. Sci. 2018, 21, 647–657. [Google Scholar] [CrossRef]
  44. Xie, J.M.; Yu, J.H.; Chen, B.H.; Feng, Z.; Lyu, J.; Hu, L.L.; Gan, Y.T.; Siddique, K.H.M. Gobi agriculture: An innovative farming system that increases energy and water use efficiencies. A review. Agron. Sustain. Dev. 2018, 38, 16. [Google Scholar] [CrossRef]
  45. Lu, C.Q.; Yu, Z.; Tian, H.Q.; Hennessy, D.A.; Feng, H.L.; Al-Kaisi, M.; Zhou, Y.Y.; Sauer, T.; Arritt, R. Increasing carbon footprint of grain crop production in the US Western Corn Belt. Environ. Res. Lett. 2018, 13, 124007. [Google Scholar] [CrossRef]
  46. Berg, H.; Michélsen, P.; Troell, M.; Folke, C.; Kautsky, N. Managing aquaculture for sustainability in tropical Lake Kariba, Zimbabwe. Ecol. Econ. 1996, 18, 141–159. [Google Scholar] [CrossRef]
Figure 1. Location of study area.
Sustainability 11 02002 g001
Figure 2. Ecological footprint size (EFsize) per capita of cities/leagues from 2010 to 2016 in the Inner Mongolia Autonomous Region (IMAR).
Sustainability 11 02002 g002
Figure 3. EFsize composition ratio of cities/leagues from 2010 to 2016 in IMAR.
Sustainability 11 02002 g003
Figure 4. EFdepth of cities/leagues from 2010 to 2016 in IMAR.
Sustainability 11 02002 g004
Figure 5. Ecological carrying capacity (ECintensity) of cities/leagues from 2010 to 2016 in IMAR.
Sustainability 11 02002 g005
Figure 6. Ecological deficit (ED3D) spatial distribution in IMAR.
Sustainability 11 02002 g006
Figure 7. Relationship between per capita EF3D and GDP in IMAR.
Sustainability 11 02002 g007
Table 1. Biological and energy resource data selected for model calculation in the Inner Mongolia Autonomous Region (IMAR).
Biological Products/Energy Consumption ItemsLand Categories
Cereals, tubers, beans, oil-bearing crops, pork, poultry eggsCropland
Beef, mutton, milks, sheep wool, goat wool, cashmereGrassland
Honey, wood, fruitWoodland
Aquatic productsWater area
Coal, coke, crude oil, gasoline, kerosene, diesel oil, fuel oil, natural gas, electricityConstruction land
Table 2. Pearson correlation coefficients between GDP/POPdensity and footprint, capacity and deficit.
CoefficientEFsizeEFdepthEF3DECECintensityEC3DED3D
GDP1−0.036−0.639 **1−0.169−0.026−0.200−0.0440.201
GDP20.602 **0.388 **0.645 **0.596 **0.1760.595 **−0.651 **
GDP3−0.0140.216 *20.058−0.0200.745 **0.106−0.044
GDP0.416 **0.333 **0.471 **0.410 **0.436 **0.463 **−0.467 **
POPdensity−0.294 **0.776 **−0.182−0.298 **0.261 *−0.255 *0.159
1 ** Significantly related at the 0.01 level (both sides). 2 * Significantly related at the 0.05 level (both sides).

