Multilevel Governments’ Decision-Making Process and Its Influencing Factors in Watershed Ecological Compensation


 and
and
Abstract
1. Introduction
2. Method
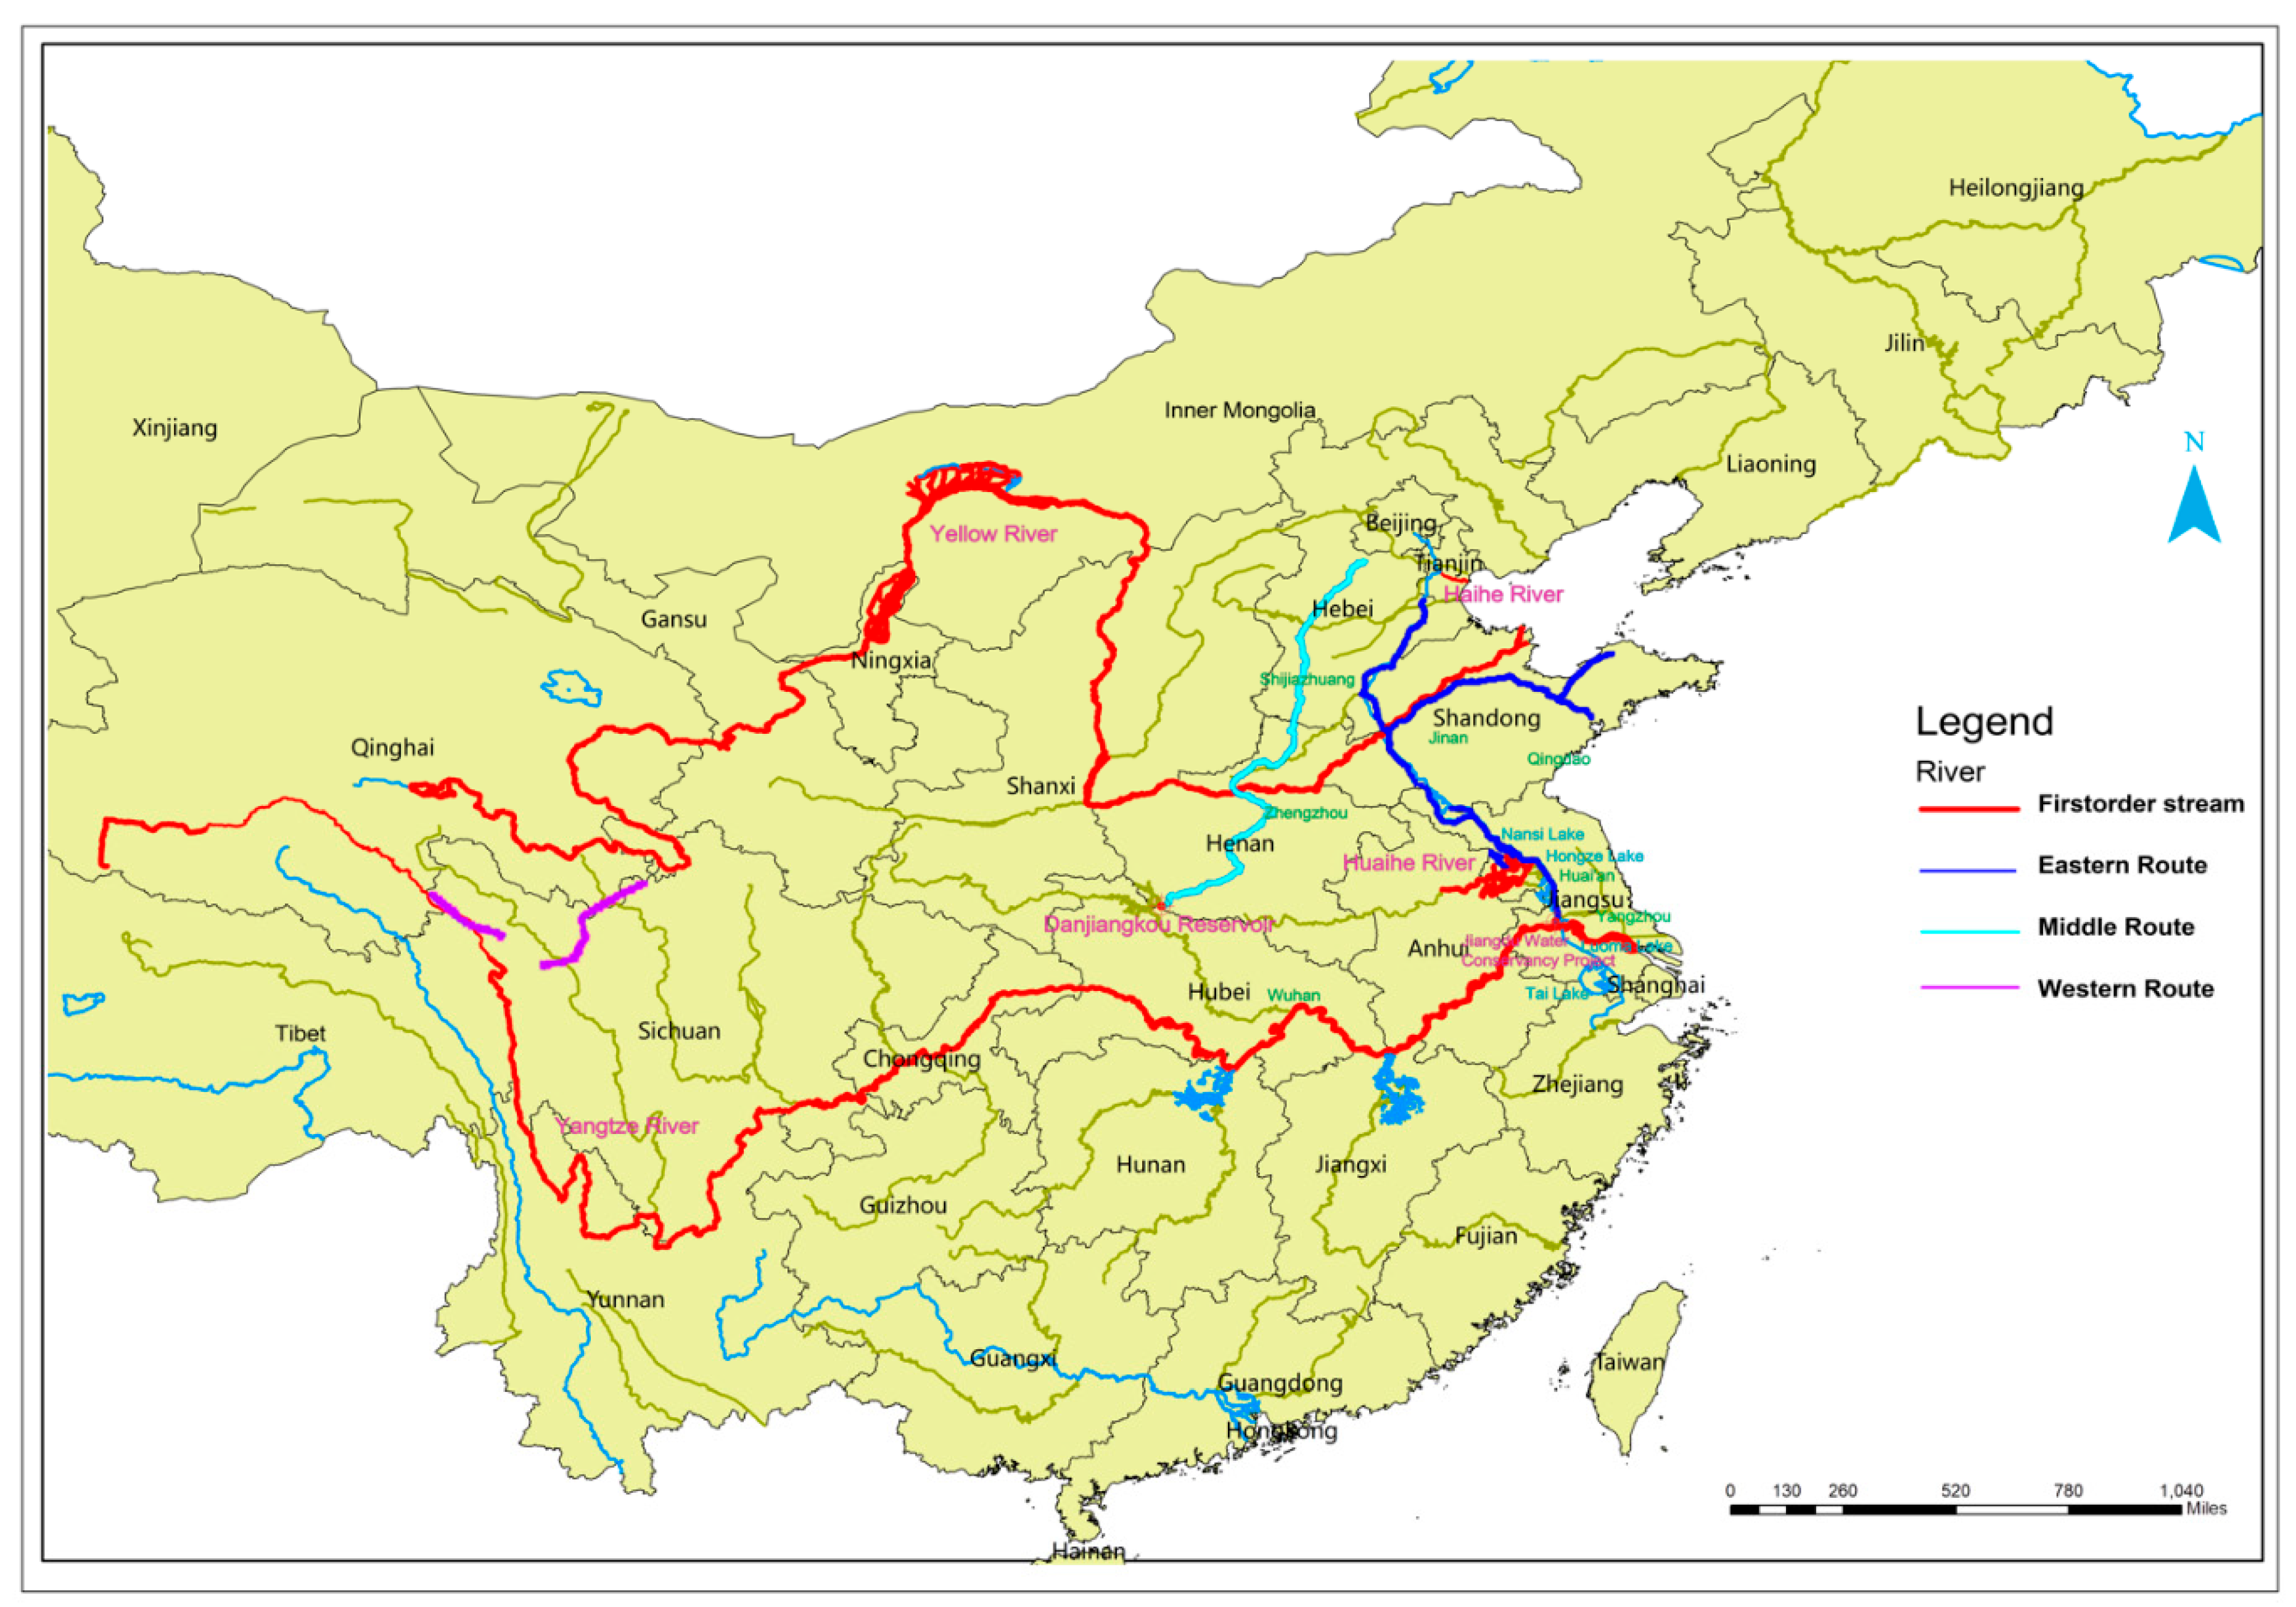
2.1. Study Area
2.2. Theory Background
- (1)
- Game framework. It mainly refers to the structure and rules of the game. It holds that participants do not have all the knowledge of game structure and rules. That means participants’ knowledge and information are limited. Moreover, participants usually acquire strategies through transmission mechanism rather than a rational choice [51].
- (2)
- Fitness function. Fitness is the core concept of evolutionary theory, which is used to describe the reproductive capacity of genes. In the evolutionary game model, the fitness of a strategy can be understood as the growth rate of the number of people who adopt the strategy after each game. Fitness function can be simply regarded as the mapping relationship between game strategy and fitness.
- (3)
- Evolution process. The evolutionary game differs from traditional game theory in that it studies the evolutionary process of group size and strategy frequency. The evolutionary process mainly includes a selection mechanism and the mutation mechanism [53].
- (4)
- Evolutionary stabilization strategy. It is the most basic equilibrium concept in the evolutionary game [54]. The core idea is that there must be a positive intrusion barrier if an existing strategy is evolutionary stabilization equilibrium strategy. When the frequency of mutation strategy is lower than this barrier, the existing strategy can obtain higher benefits than mutation strategy.
3. Model and Analysis
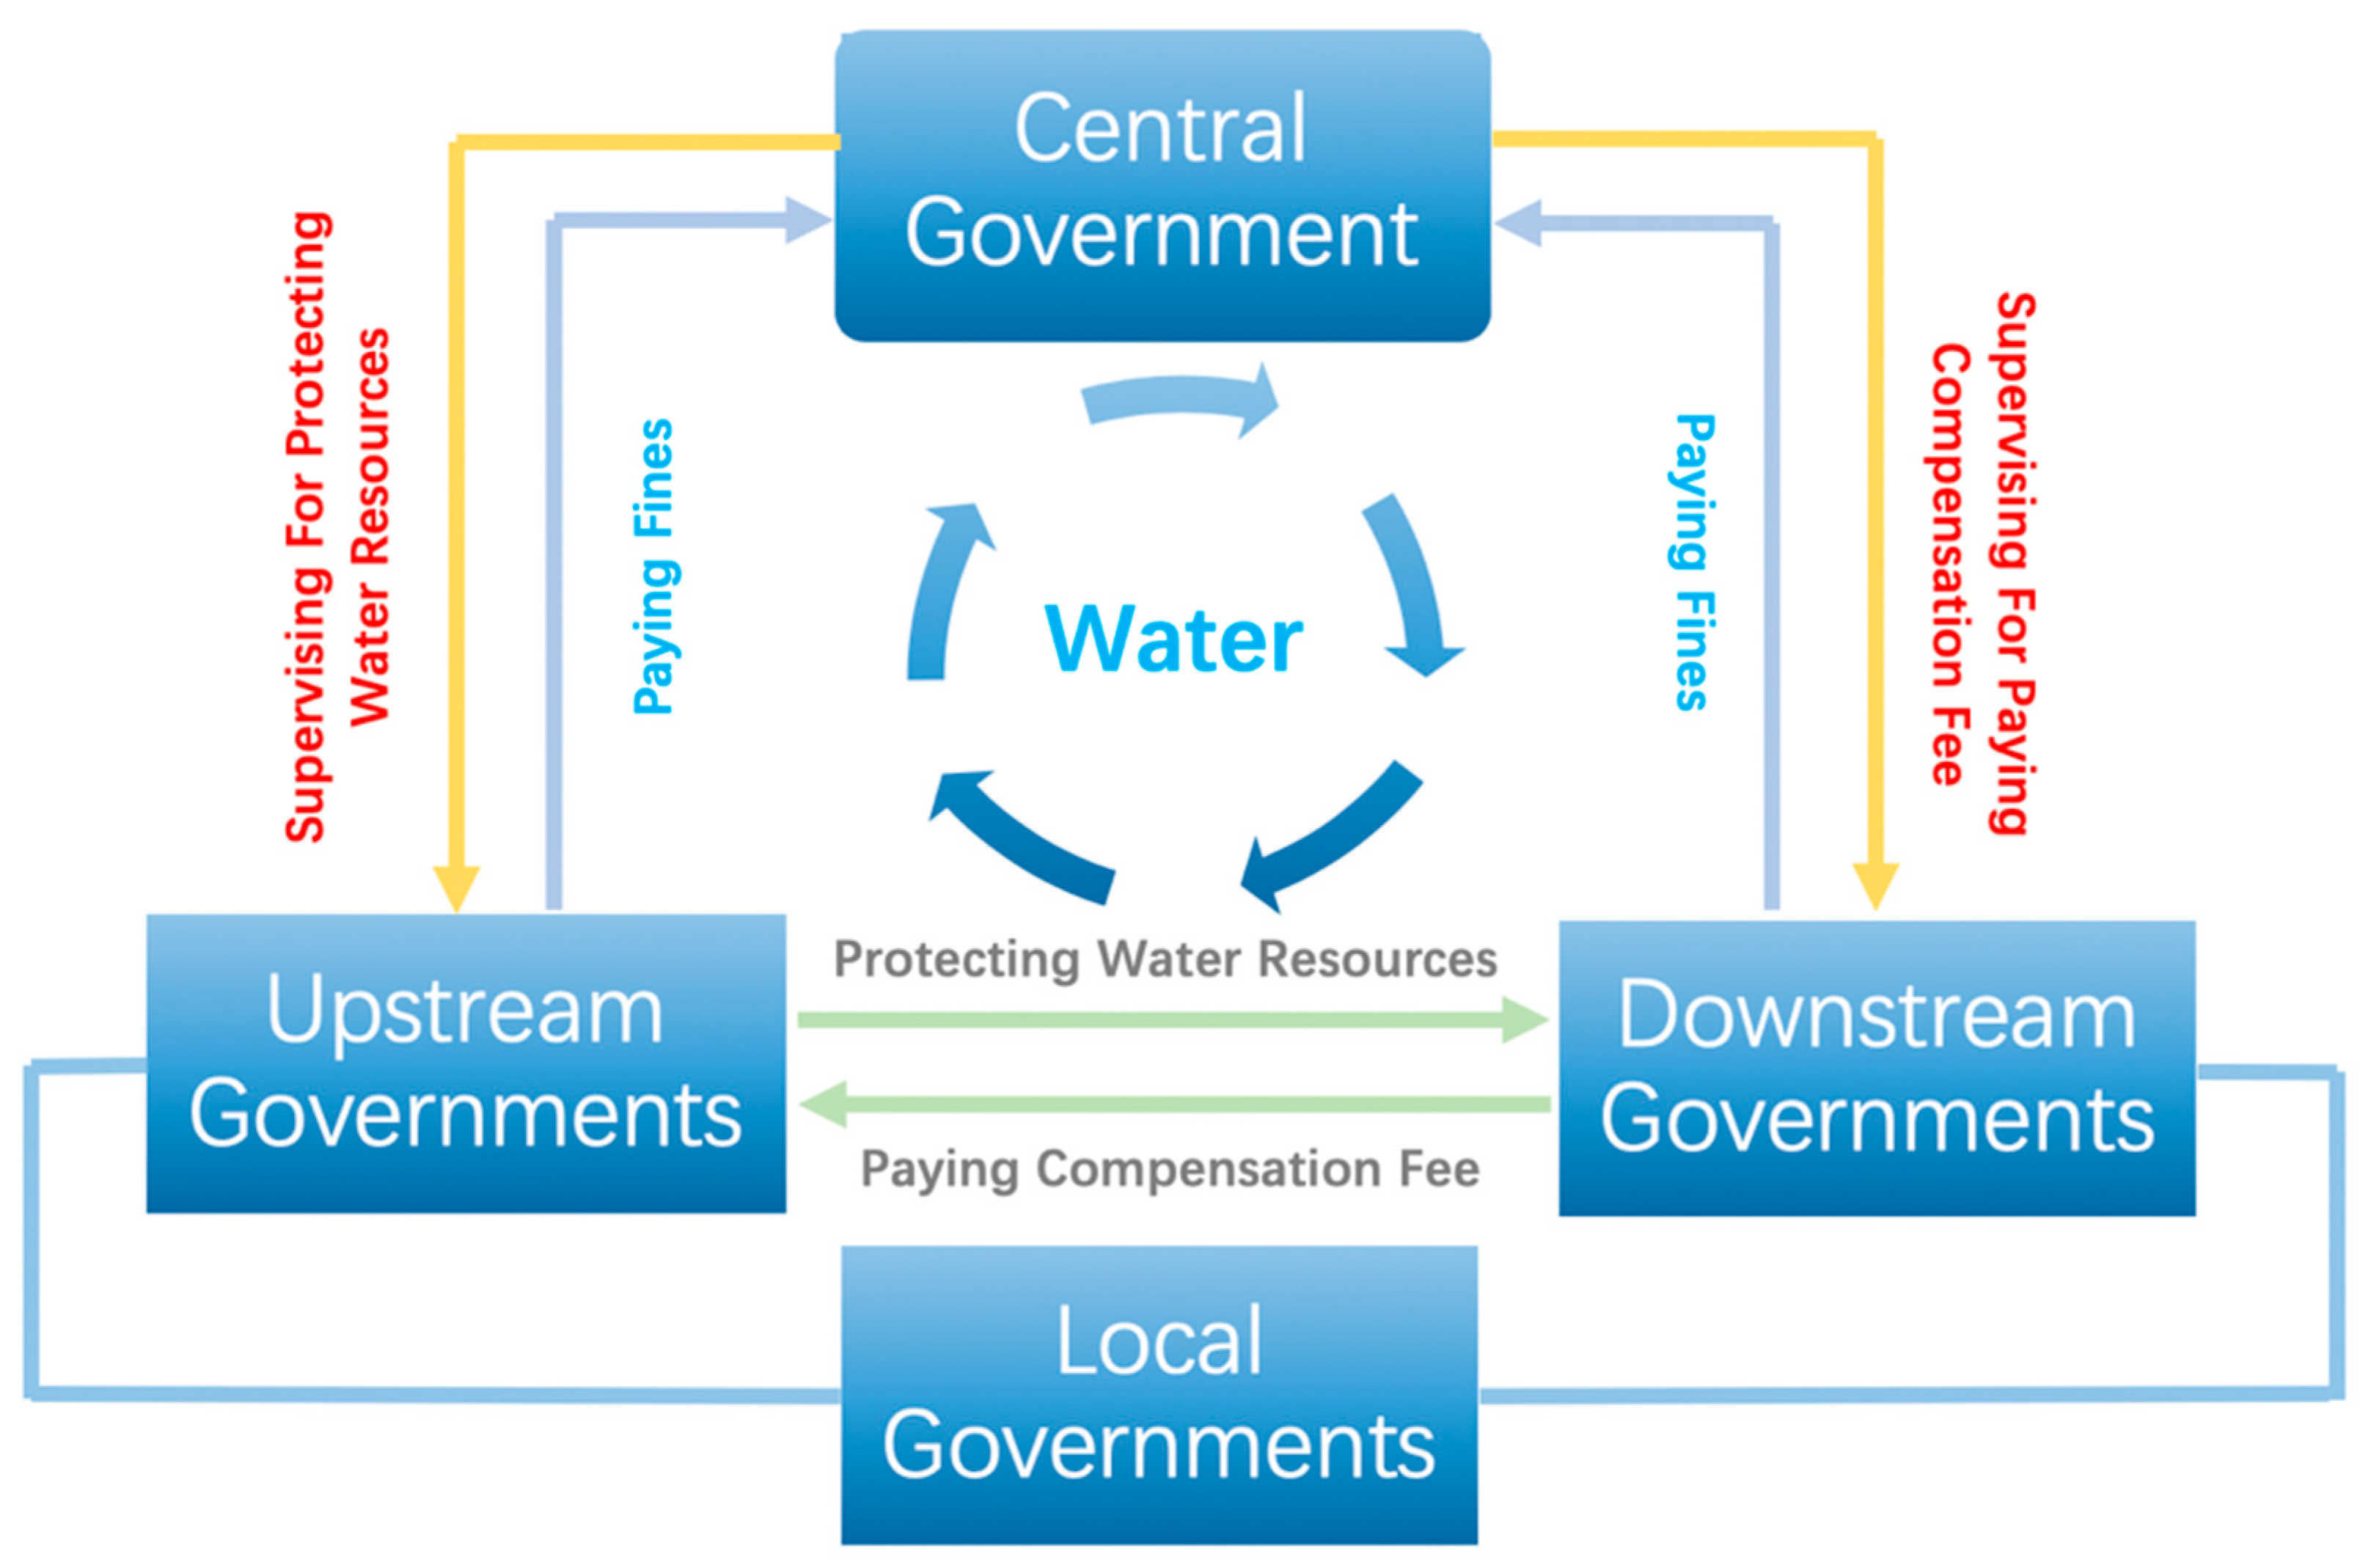
3.1. Stakeholders in the Eastern Route of SNWTP
3.2. Evolutionary Game Model Construction
3.2.1. Hypothesis
- (1)
- The power of upstream and downstream governments is equal, and the central government has the power to supervise and coordinate them.
- (2)
- Upstream governments have two alternative strategies in its set of strategies, protecting water resources or not protecting.
- (3)
- Downstream governments have two alternative strategies, paying a compensation fee to upstream governments or not paying.
- (4)
- The central government also has two alternative strategies, supervising the local governments or not supervising.
- (5)
- Upstream governments, downstream governments and the central government want to maximize their own benefits during the tripartite game [56].
- (6)
- Upstream governments, downstream governments and the central government are not completely rational but bounded rational.
- (7)
- Upstream governments, downstream governments and the central government usually cannot find their own optimal strategy at one time, but adjust their strategies in continuous games and ultimately achieve the optimal strategy.
- (8)
- This paper only considers the unilateral default of upstream and downstream governments, assuming that bilateral default is impossible to occur.
- (9)
- The supervision level of the central government is mainly affected by the supervisory attitude to water resources and supervisory skills. If these factors are taken as input, according to the Cobb–Douglas production function (), the probability that the central government can find out the local government’s unilateral breach of contract is a × b, supposing .
3.2.2. Payoffs of Stakeholders
Program with Supervision
Program without Supervision
3.2.3. Replicated Dynamic Equations
3.2.4. Evolutionary Stable Strategies
Equilibrium Points of the Tripartite Evolutionary Game Model
Stability of Equilibrium Points
4. Numerical Simulation Results
4.1. Evolutionary Stable Strategy under Different Games
4.1.1. Evolutionary Stable Strategy under Game 1
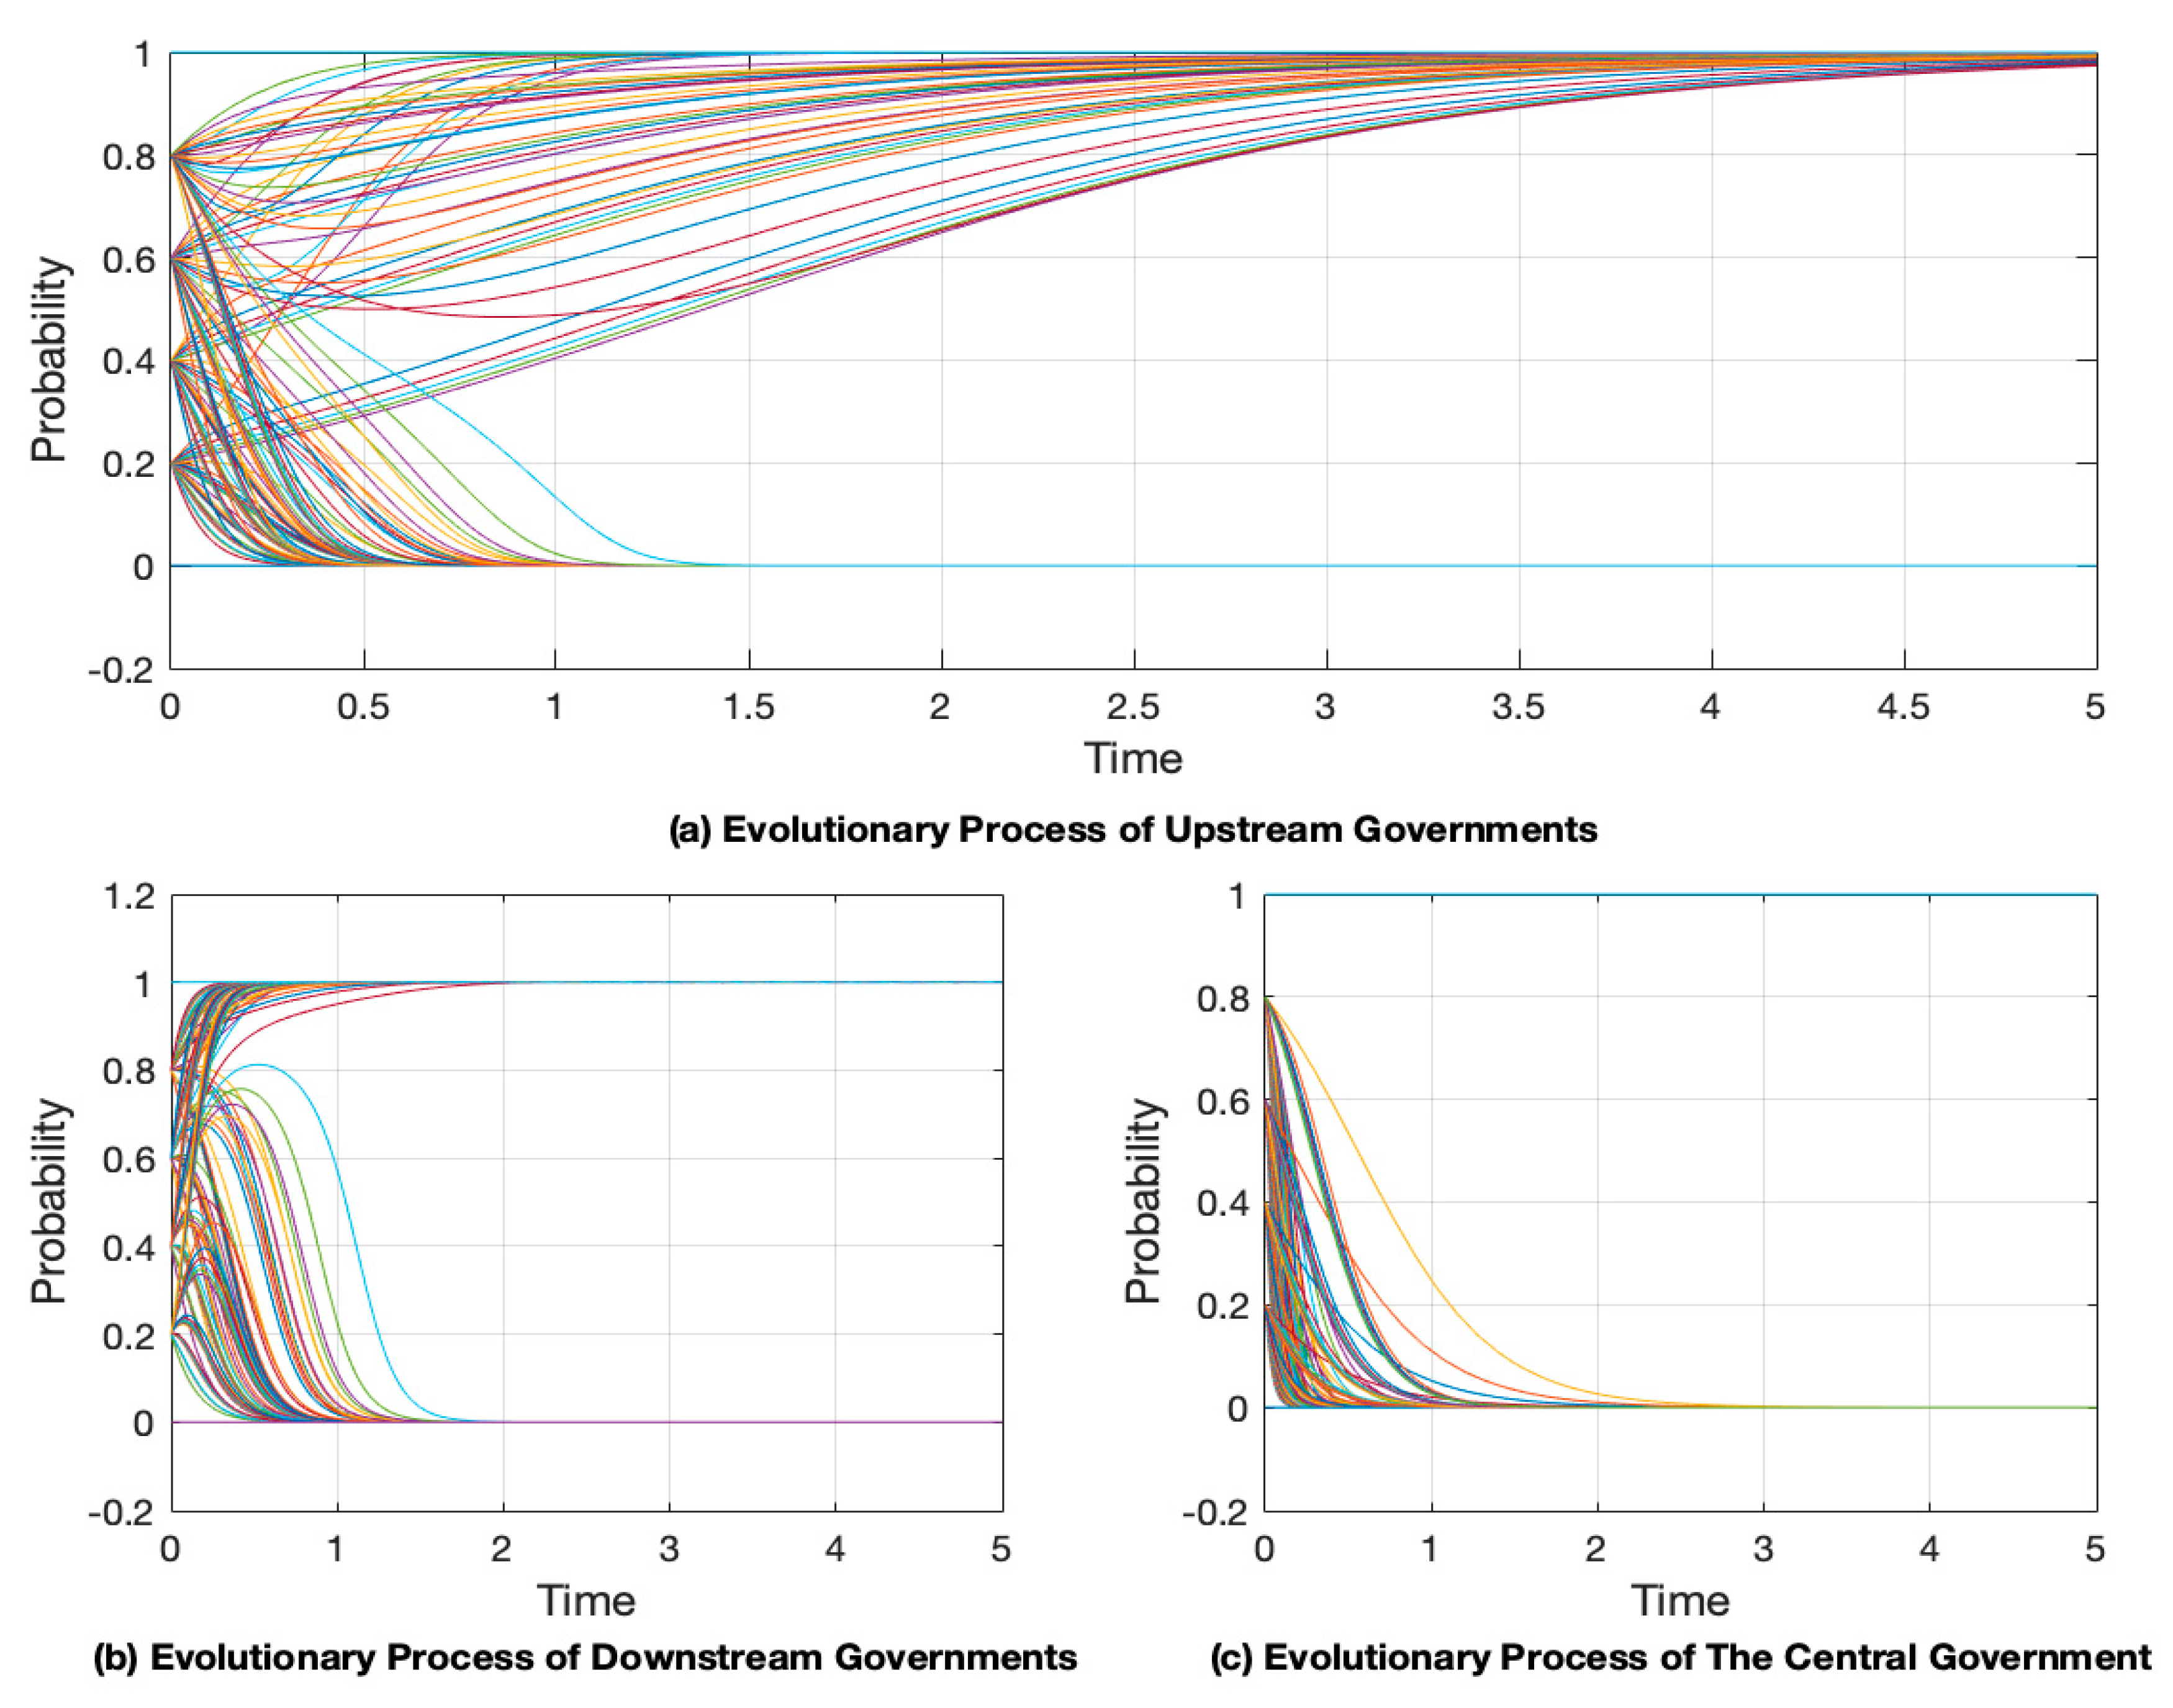
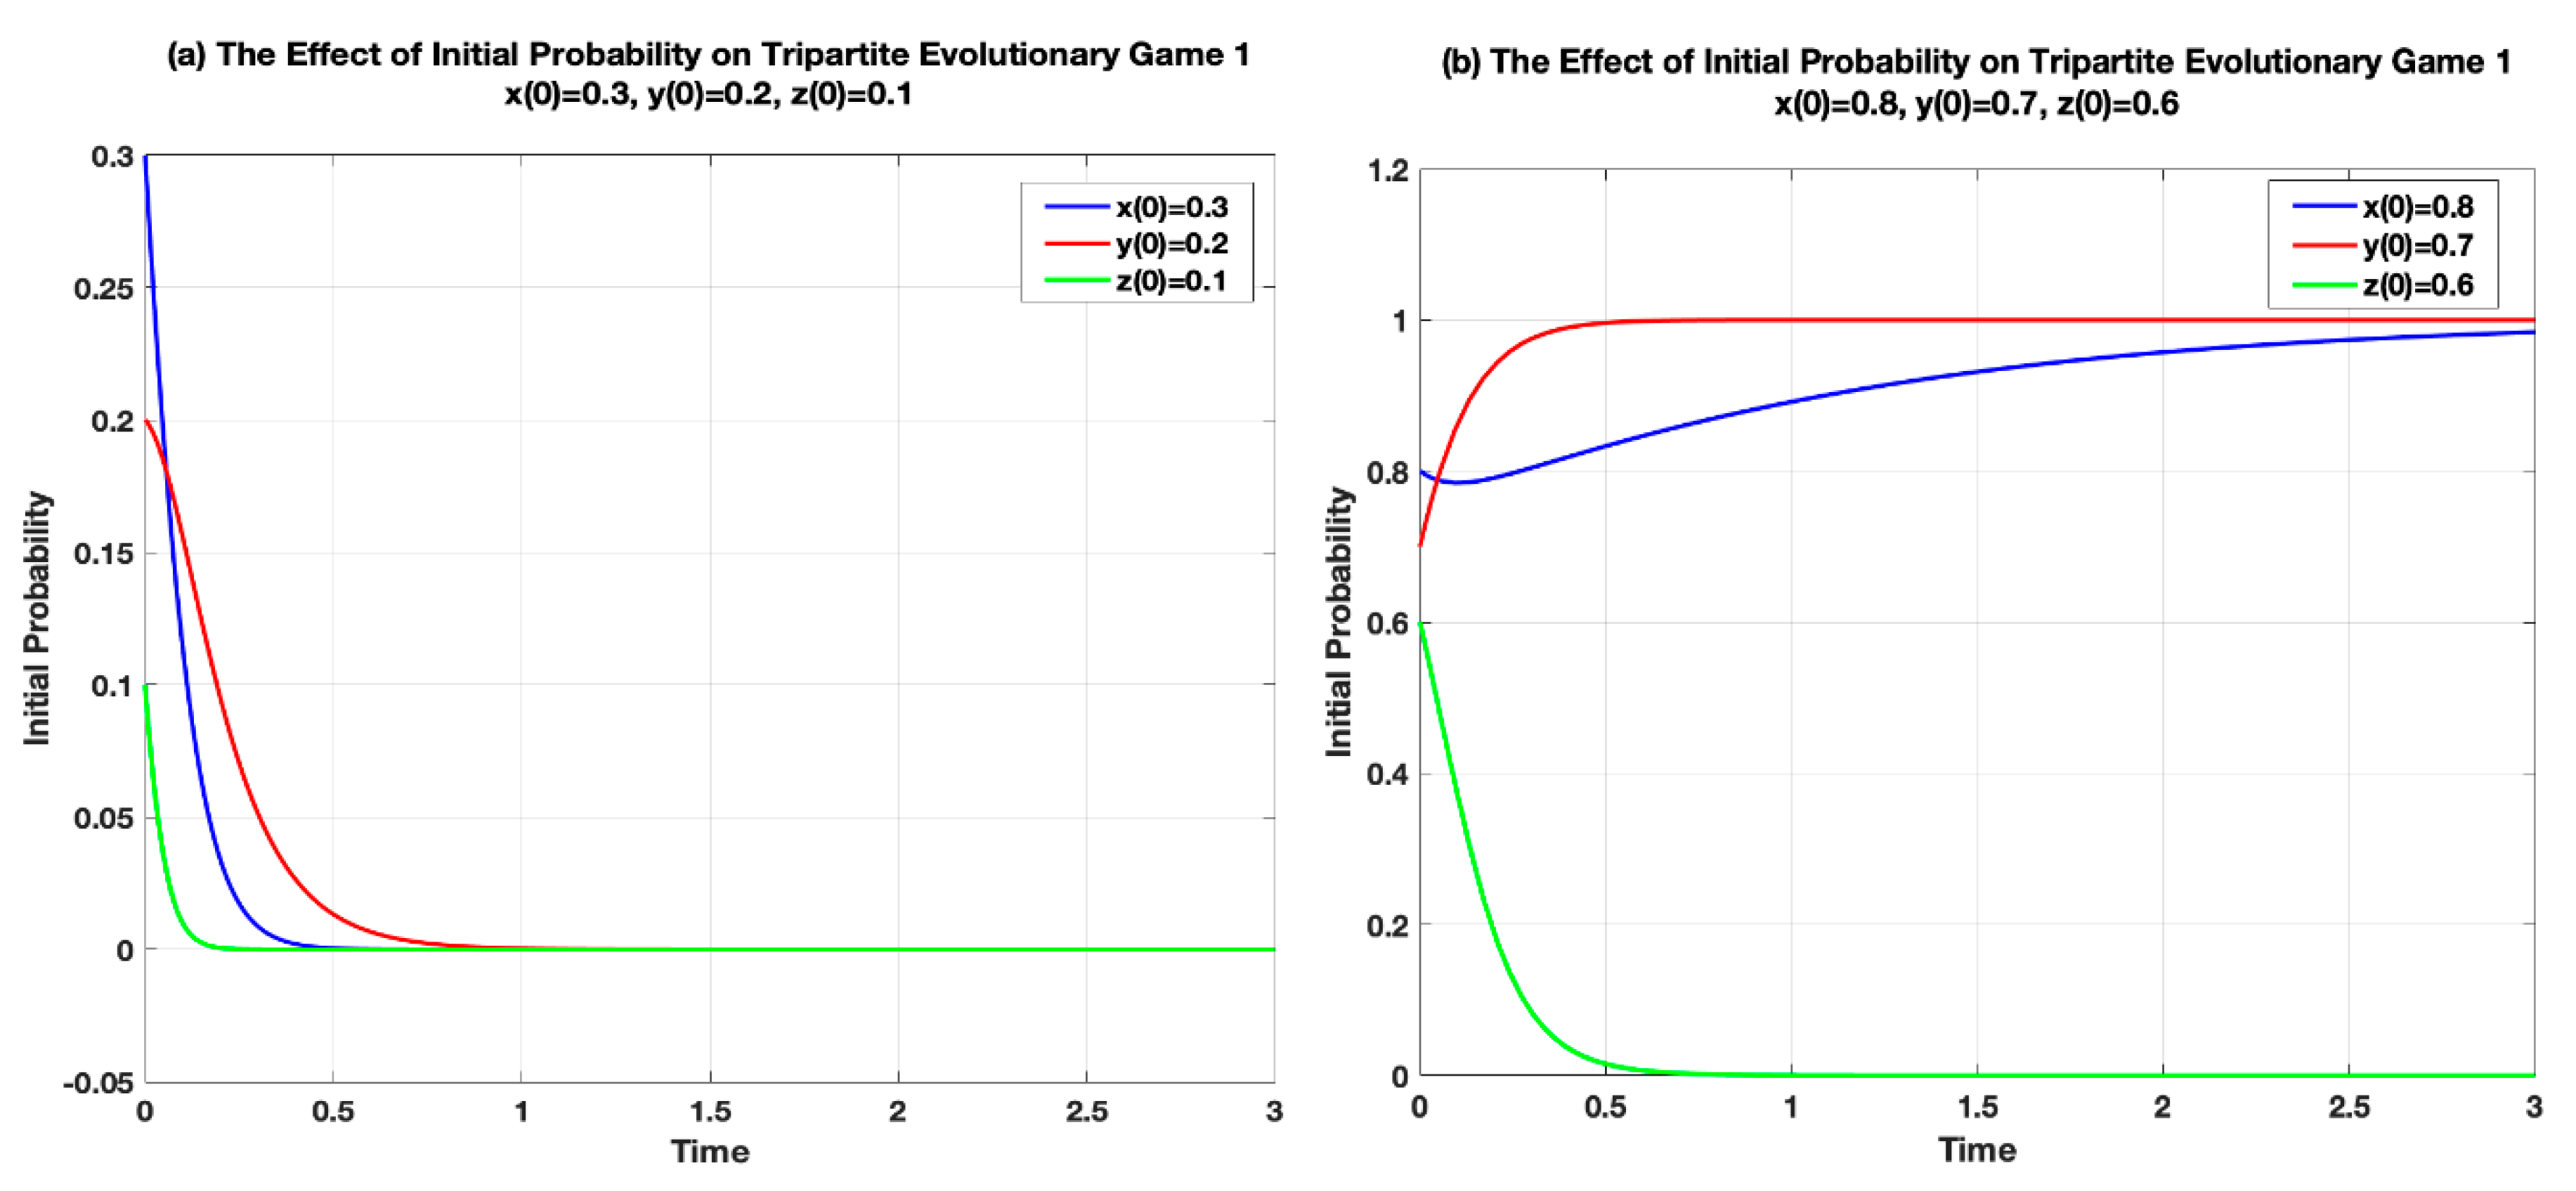
- Suppose x (0) = 0.3, y (0) = 0.2, z (0) = 0.1. The final result of the tripartite evolutionary game is shown in Figure 4a. The system finally stabilizes at the point of (0, 0, 0). We can see clearly that upstream governments, downstream governments and the central government are stable at level 0. Upstream governments choose not to protect water resources, downstream governments choose not to pay and the central government chooses non-supervision. Meanwhile, the speed at which the central government reaches a stable state is the fastest, followed by upstream governments, and downstream governments are the slowest.
- Suppose x (0) = 0.8, y (0) = 0.7, z (0) = 0.6. The final result is shown in Figure 4b. (1, 1, 0) is the sink in this situation. Because the initial probabilities of upstream governments and downstream governments are high, the upstream and downstream governments elect protecting water resources and paying a compensation fee. Although the initial probability of the central government is 0.6, it still chooses non-supervision. According to Figure 4b, downstream governments are the fastest achieving a stable state, while upstream governments are the slowest achieving a stable state.
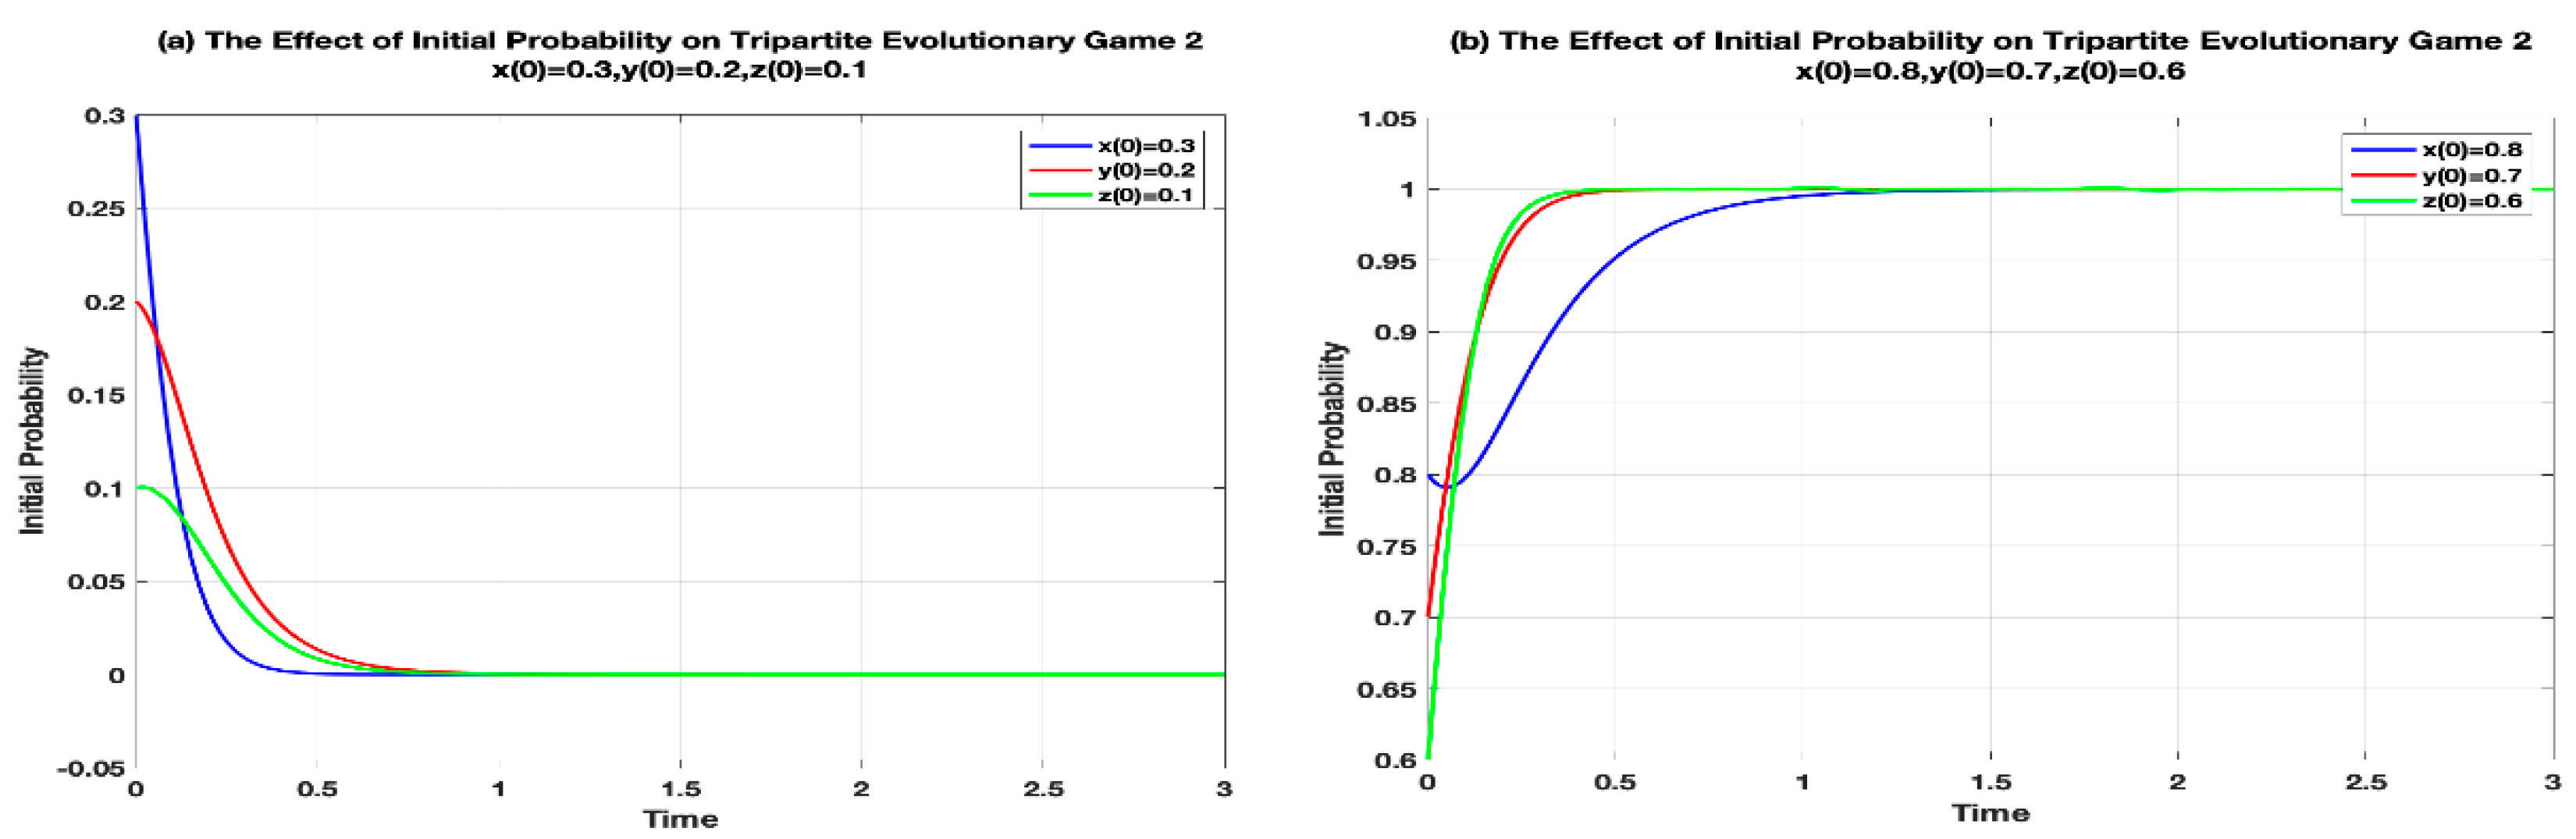
4.1.2. Evolutionary Stable Strategy under Game 2
- Suppose x (0) = 0.3, y (0) = 0.2, z (0) = 0.1. The final result of the evolutionary game is shown in Figure 6a. The system finally stabilizes at (0, 0, 0). It indicates that the system will finally stabilize at the point of E1 when the initial probabilities are low. Then, upstream governments choose not to protect water resources and downstream governments choose not to pay. The central government will choose not to supervise. According to Figure 6a, we can also find that upstream governments stabilize faster, followed by the central government, and downstream governments stabilize the slowest when the initial values are low.
- Suppose x (0) = 0.8, y (0) = 0.7, z (0) = 0.6. The final result of the evolutionary game is shown in Figure 6b. The three stakeholders have gradually increased their willingness to cooperate, making the system stable at (1, 1, 1). At this point, upstream governments prefer to protect water resources and downstream governments prefer to pay for a compensation fee. The central government supervises the local governments. Through Figure 6b, when the initial values are high, the central government stabilizes faster, followed by the downstream government, and upstream governments stabilize the slowest.
4.2. Parameters Analysis
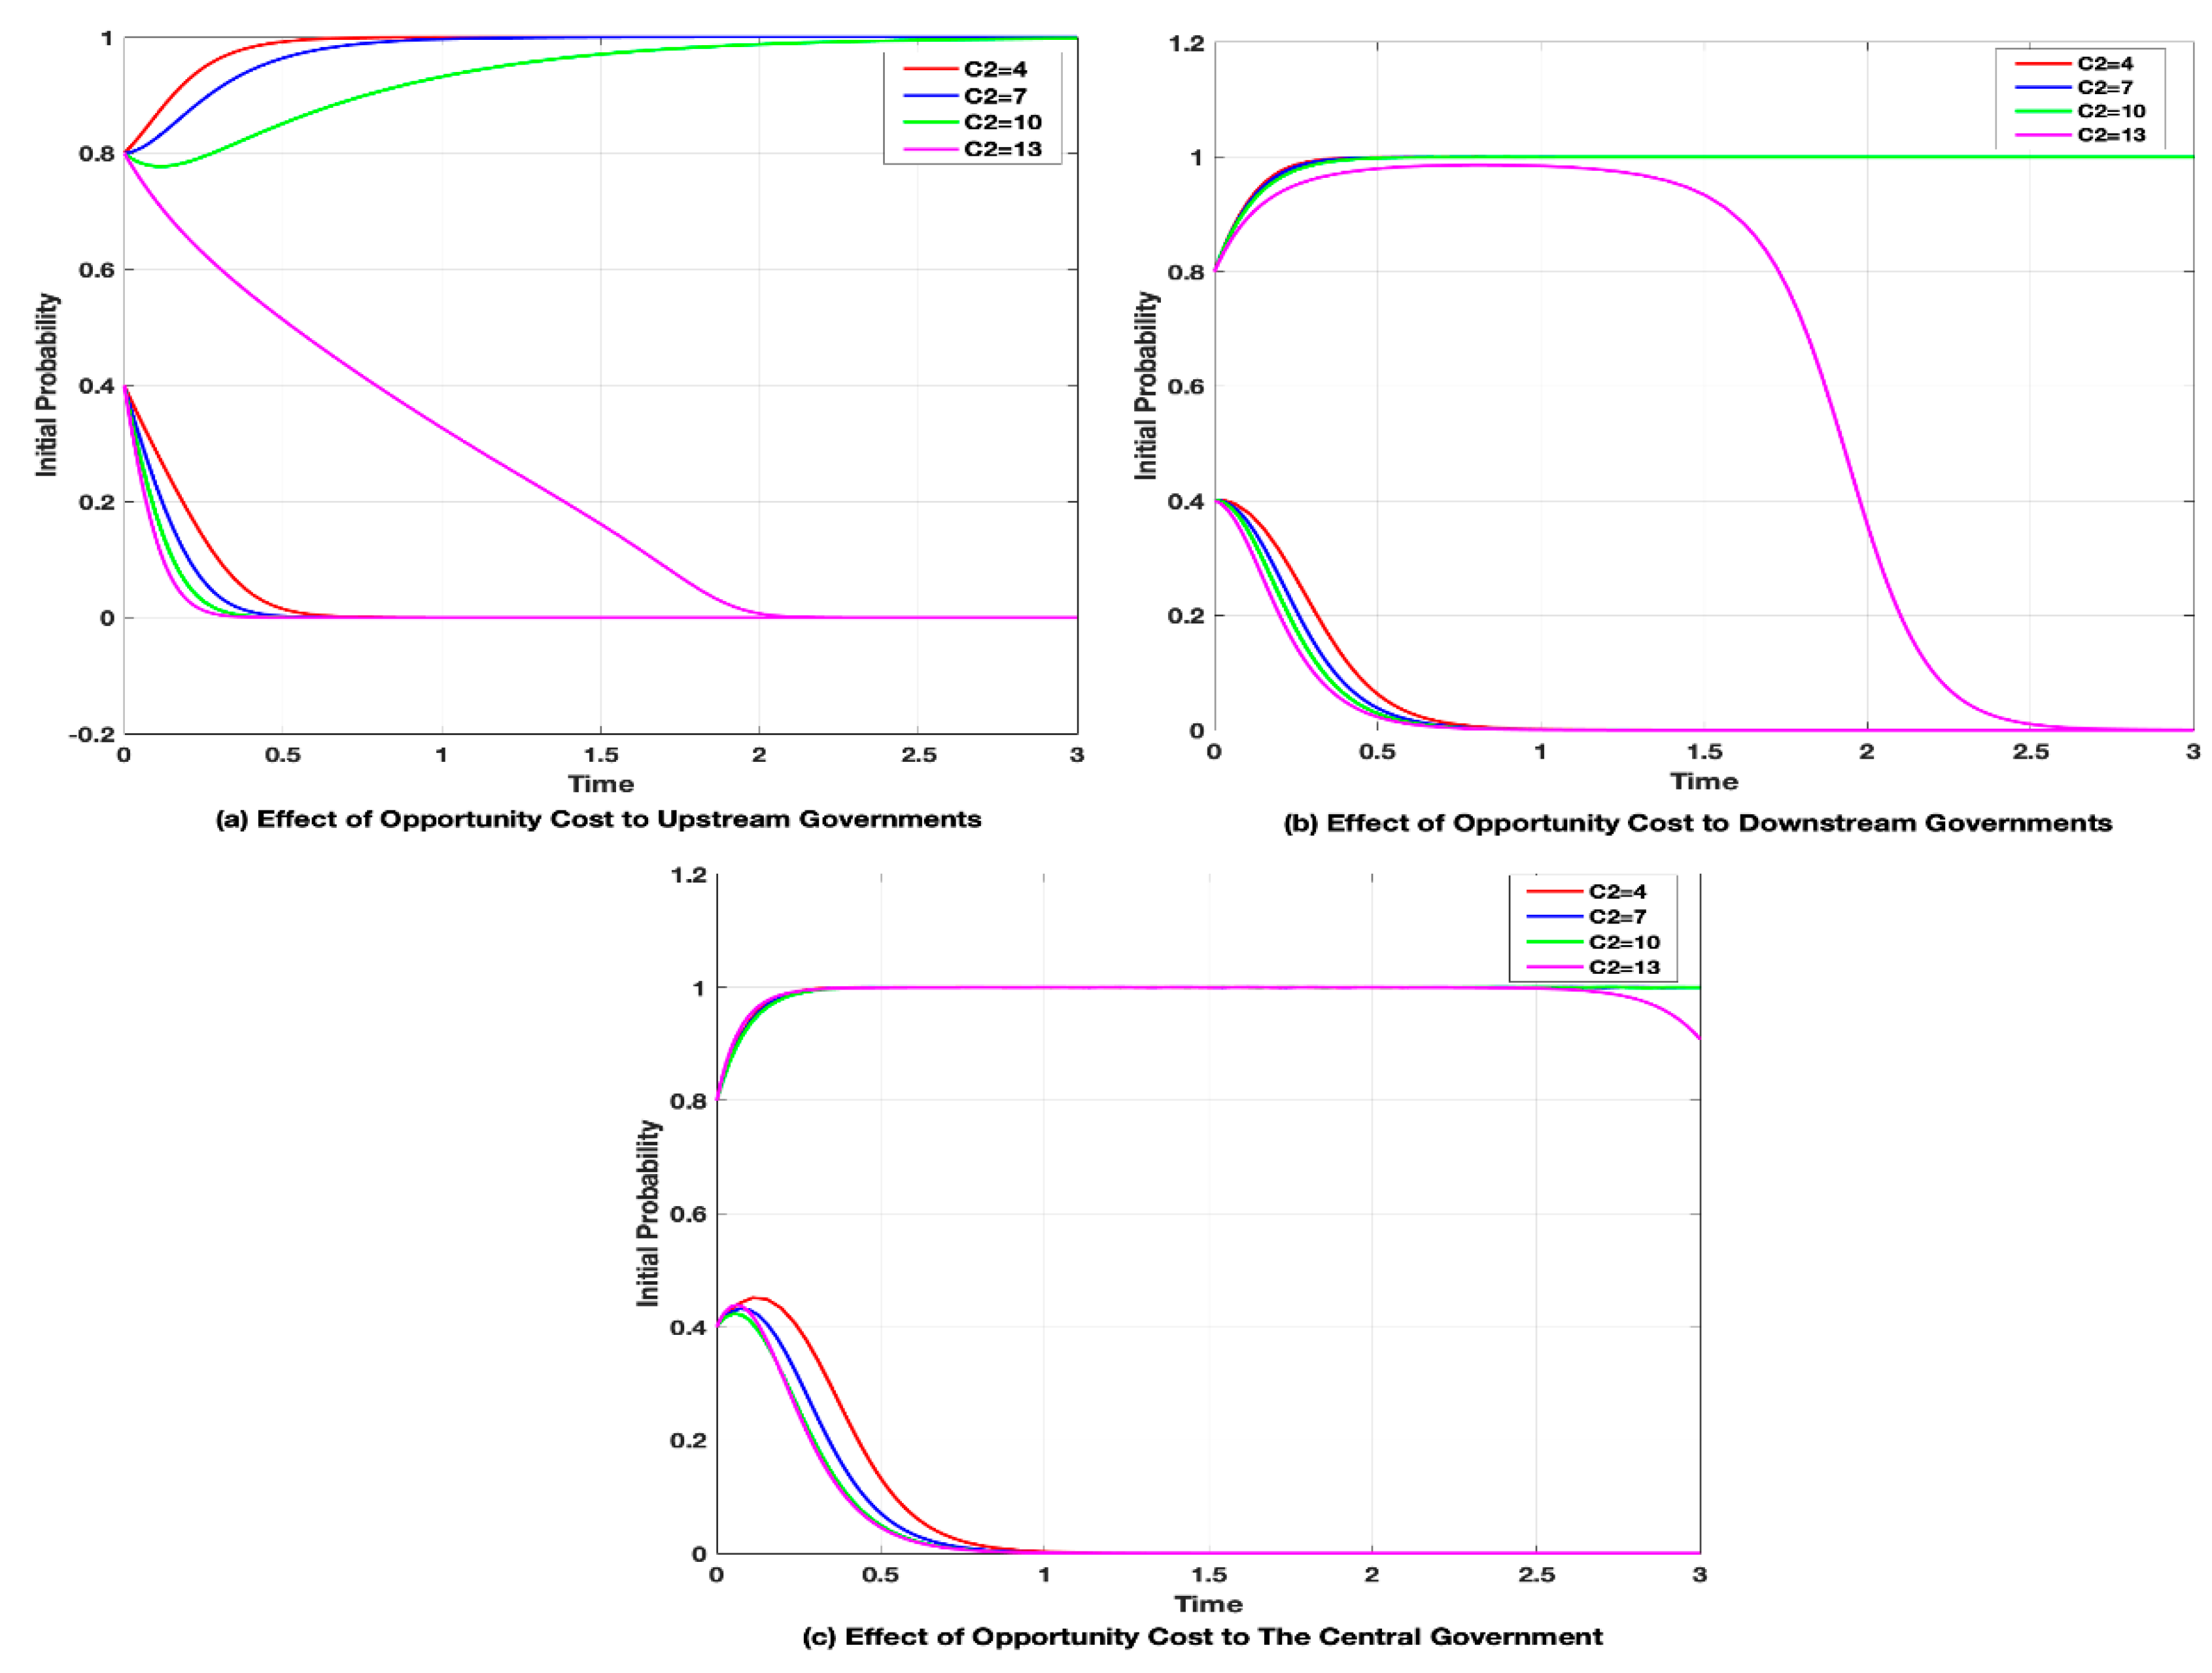
4.2.1. Opportunity Costs
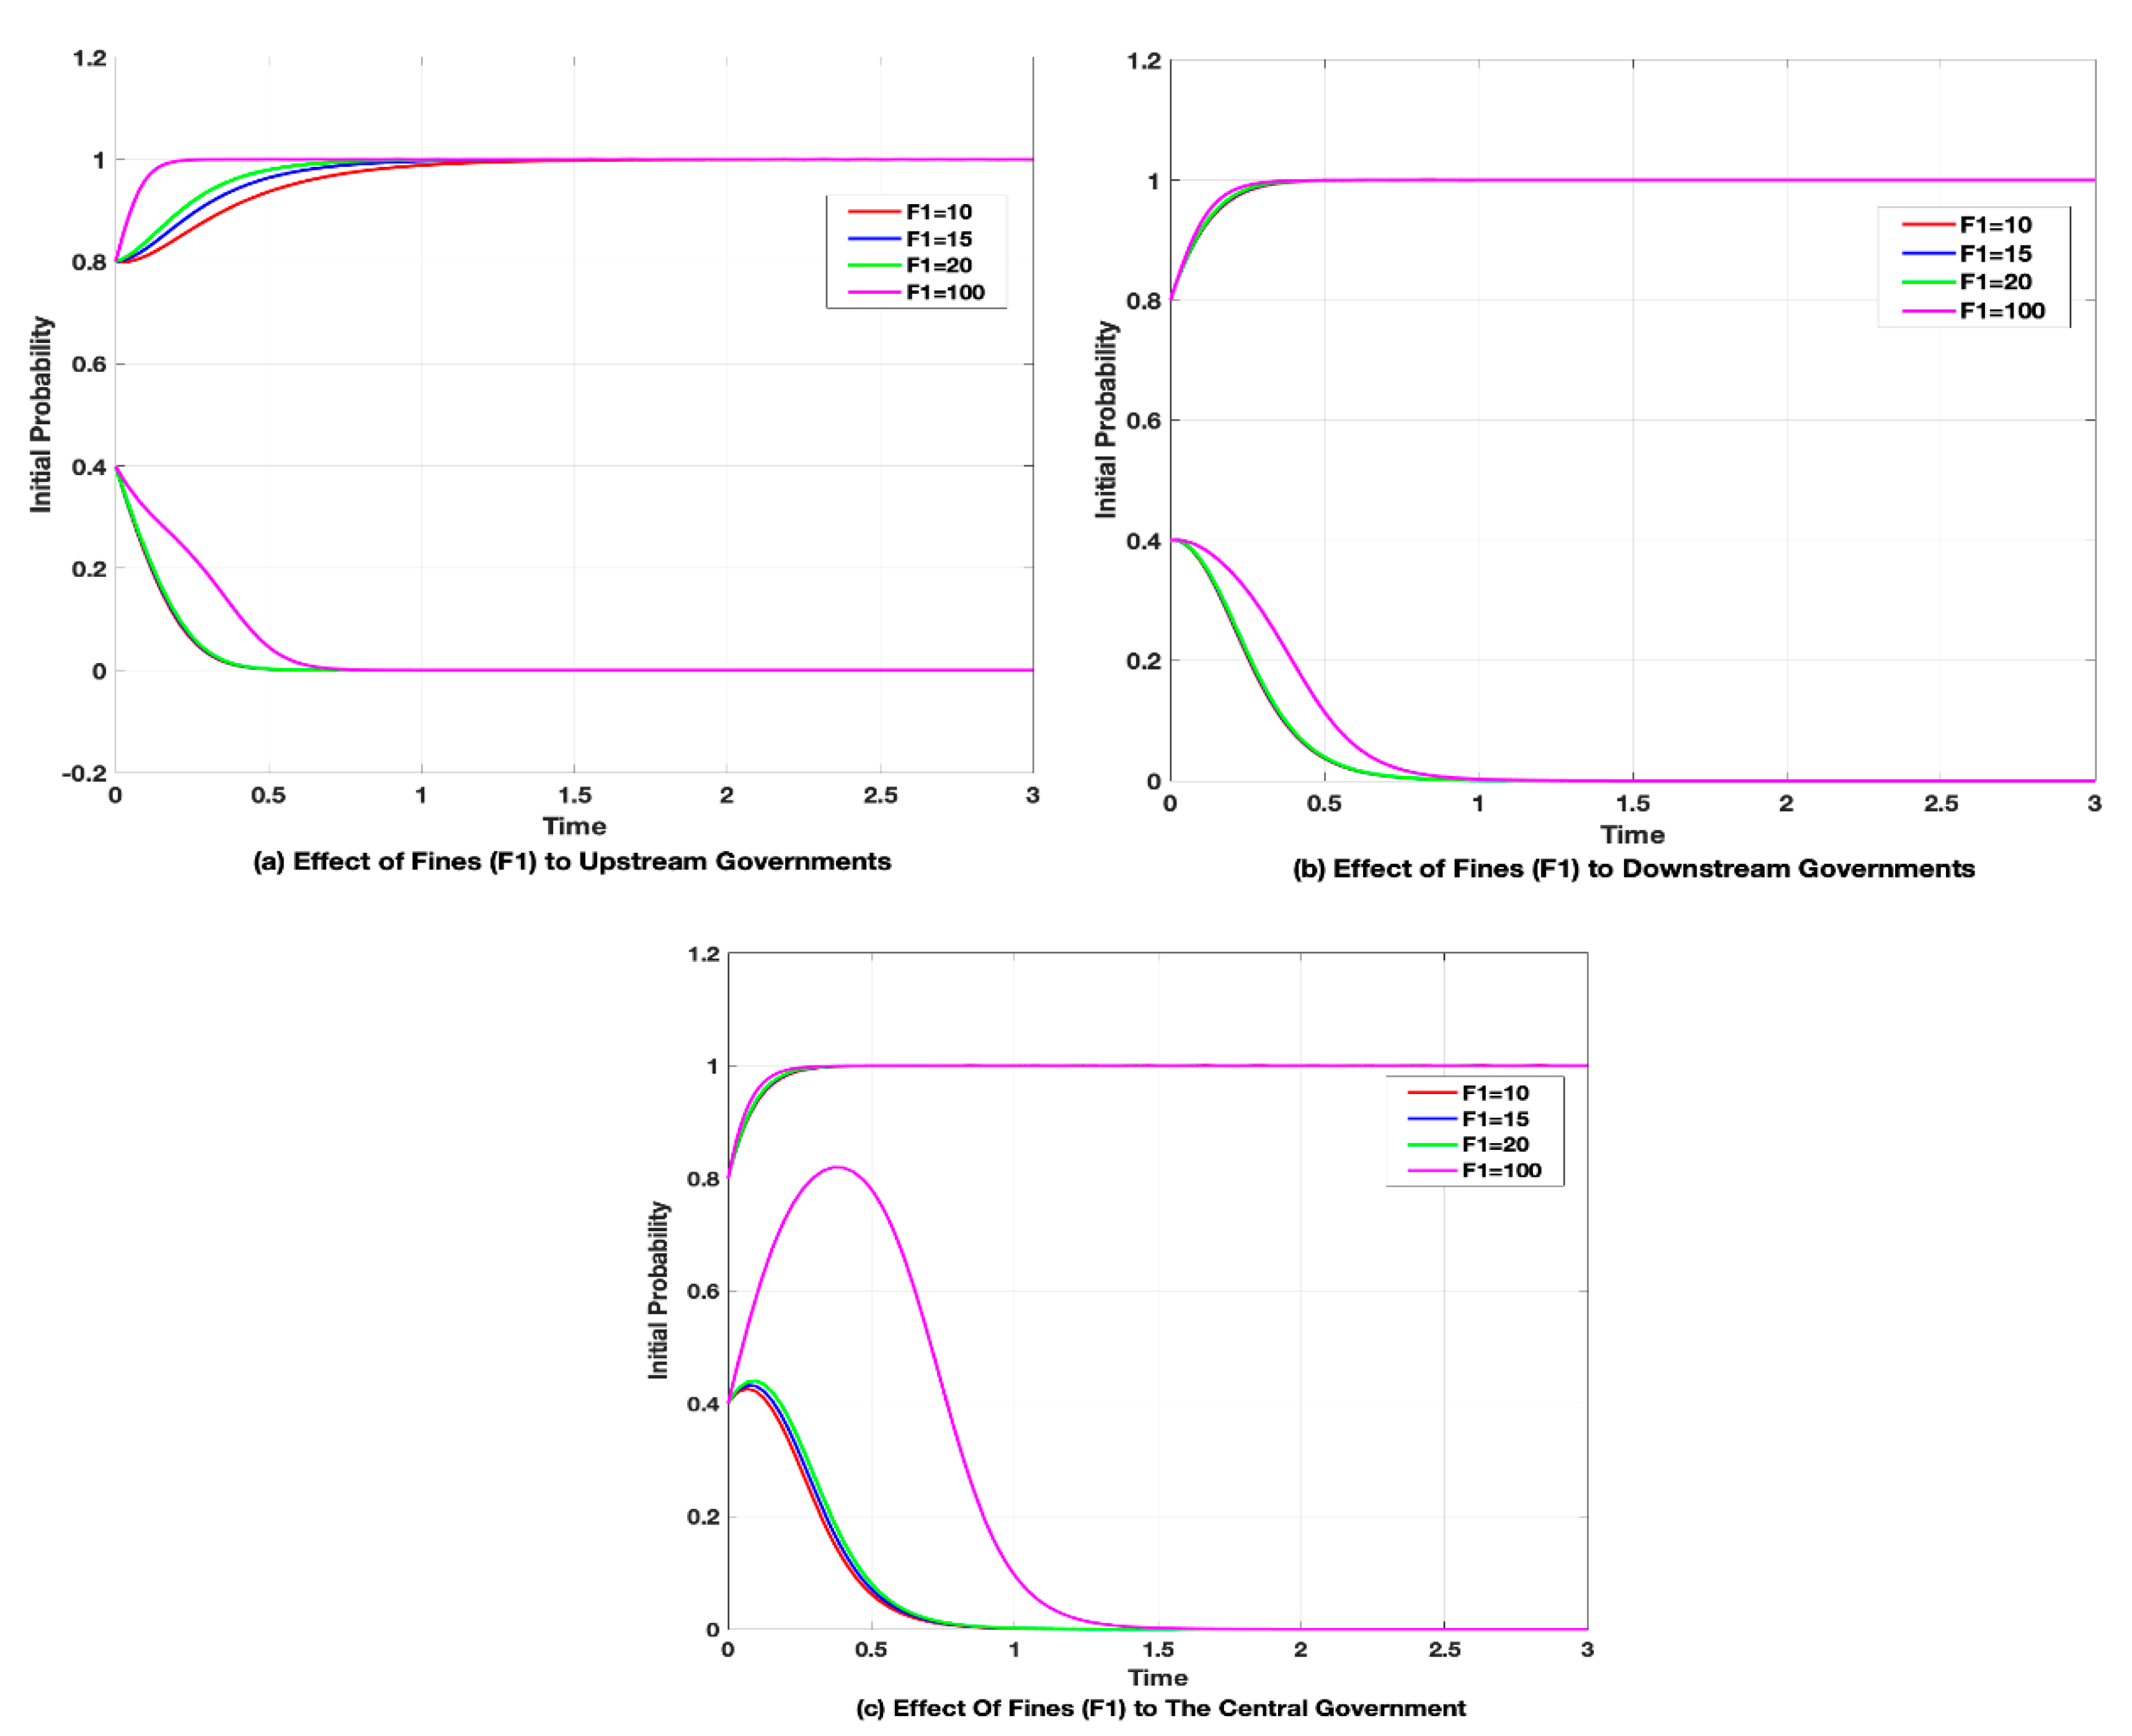
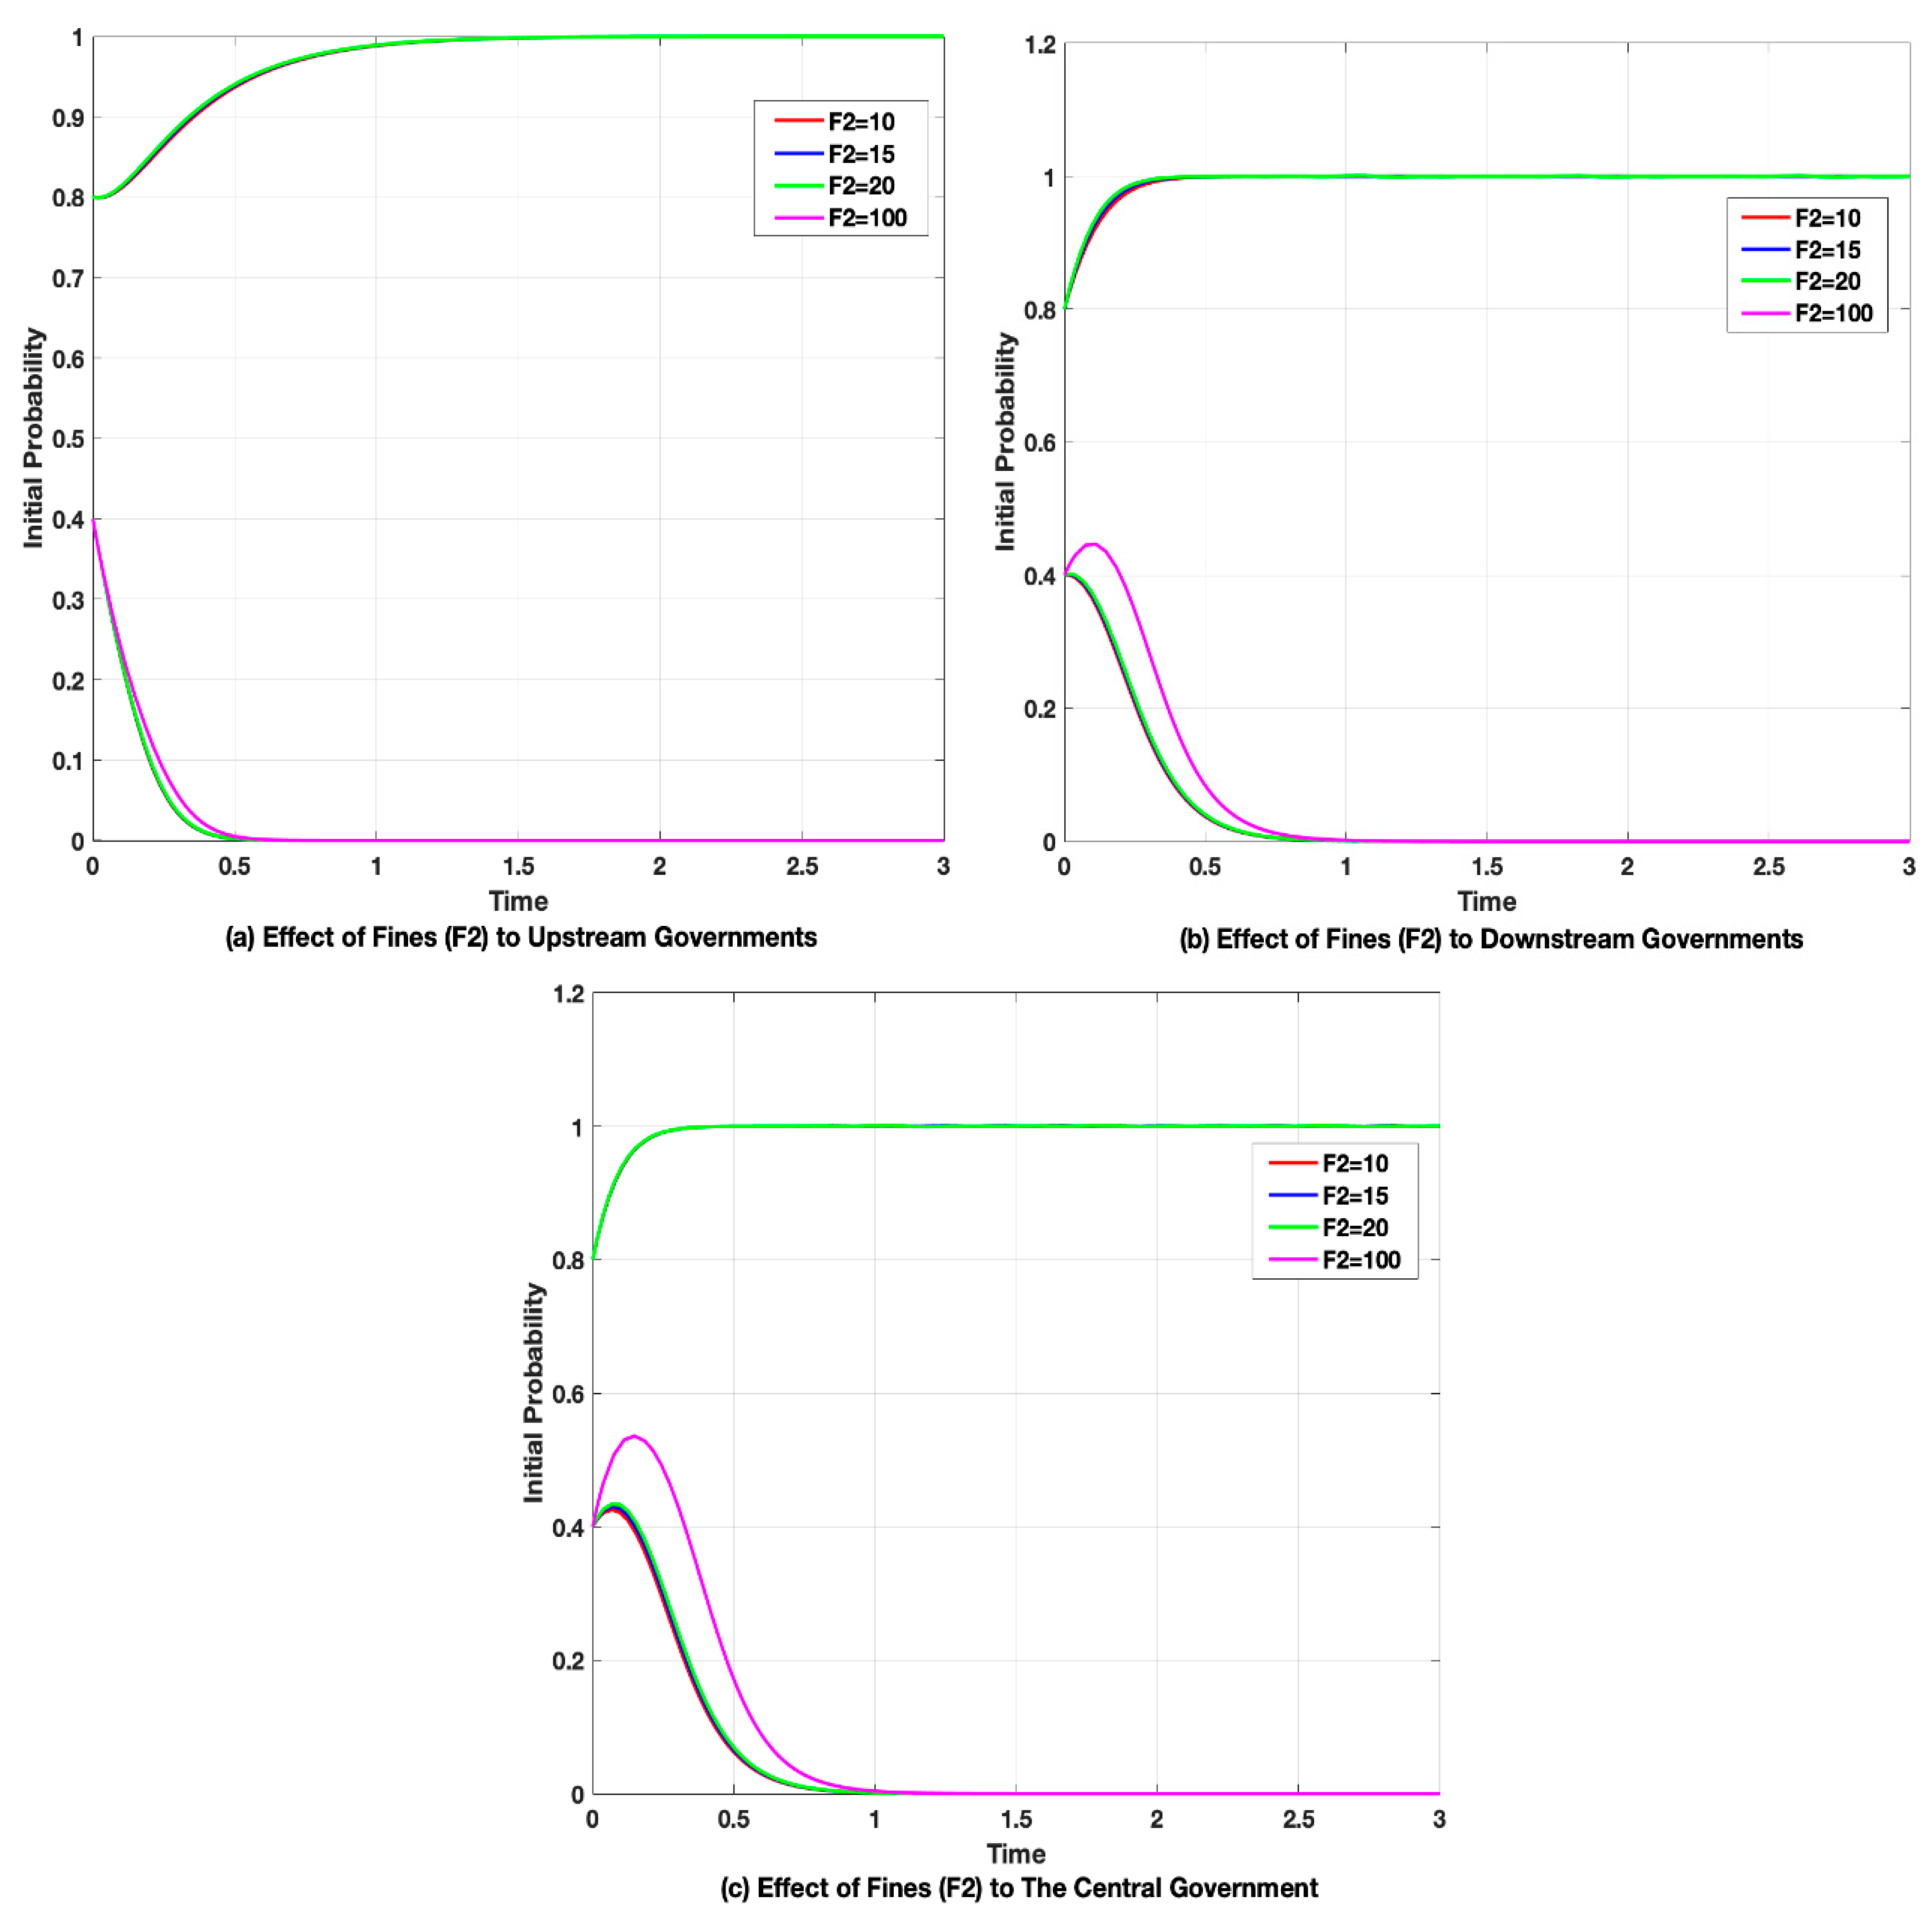
4.2.2. Fines
The Fines to Upstream Governments
The Fines to Downstream Governments
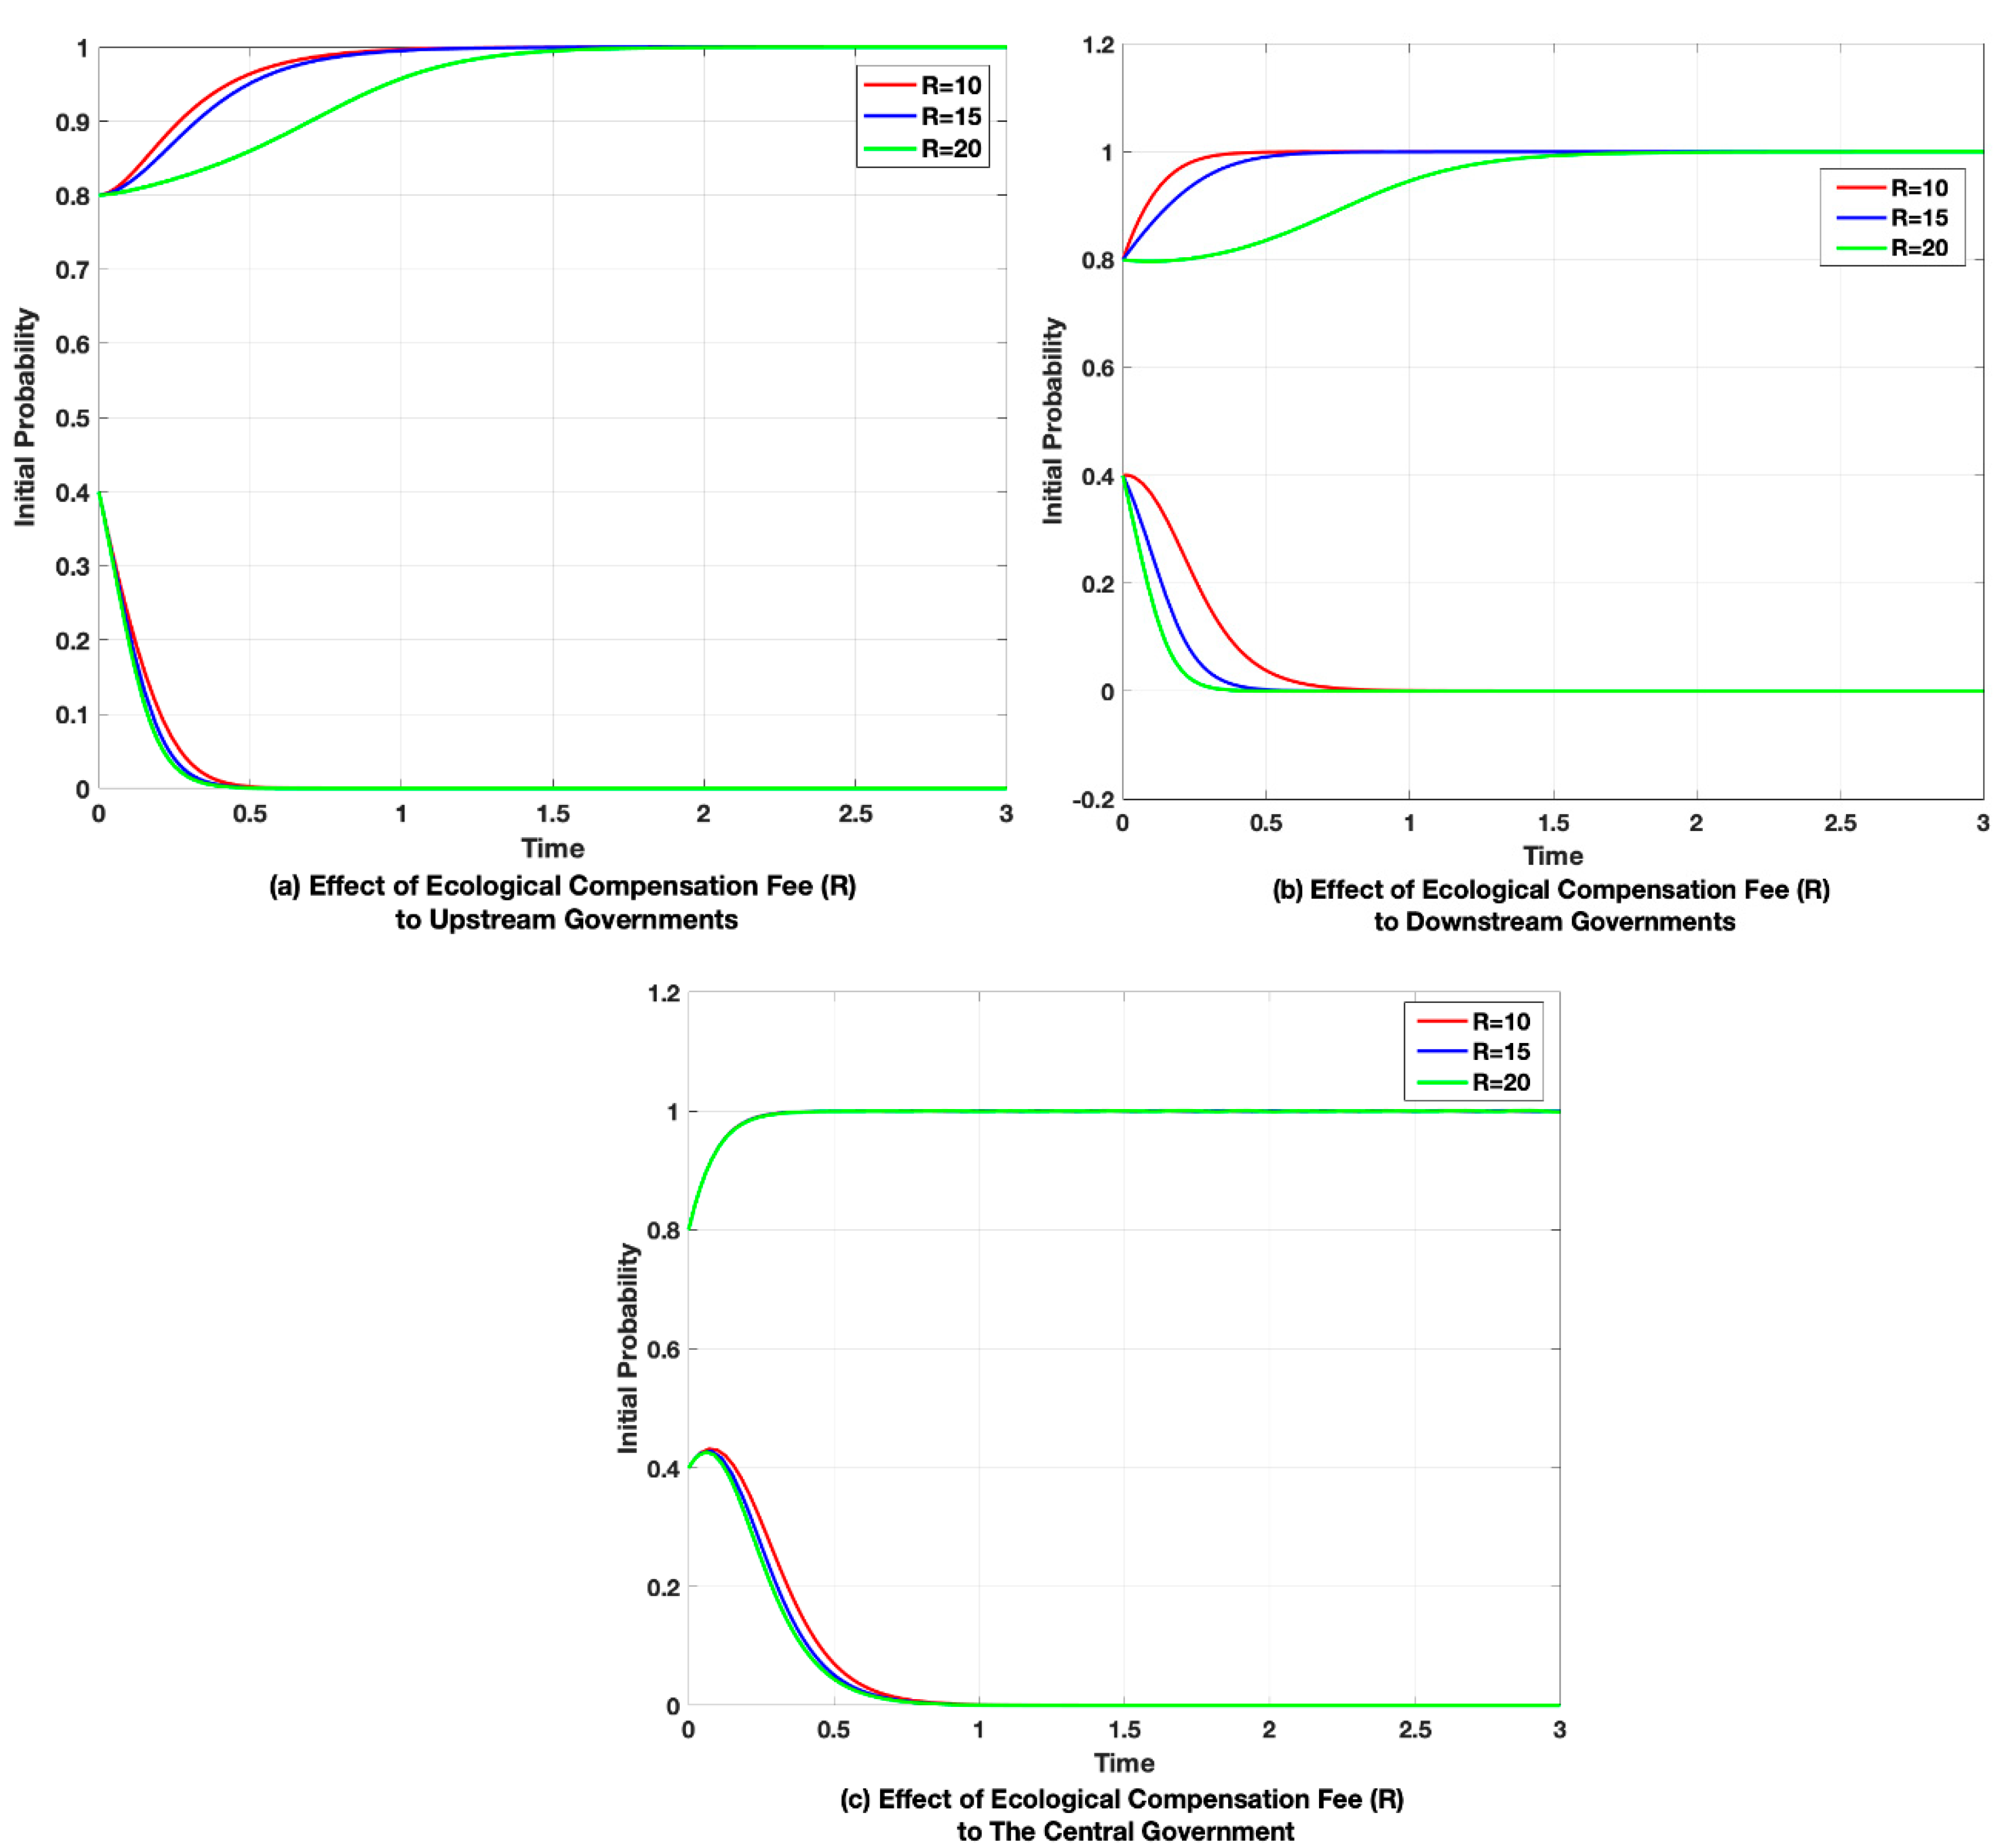
4.2.3. Ecological Compensation Fee
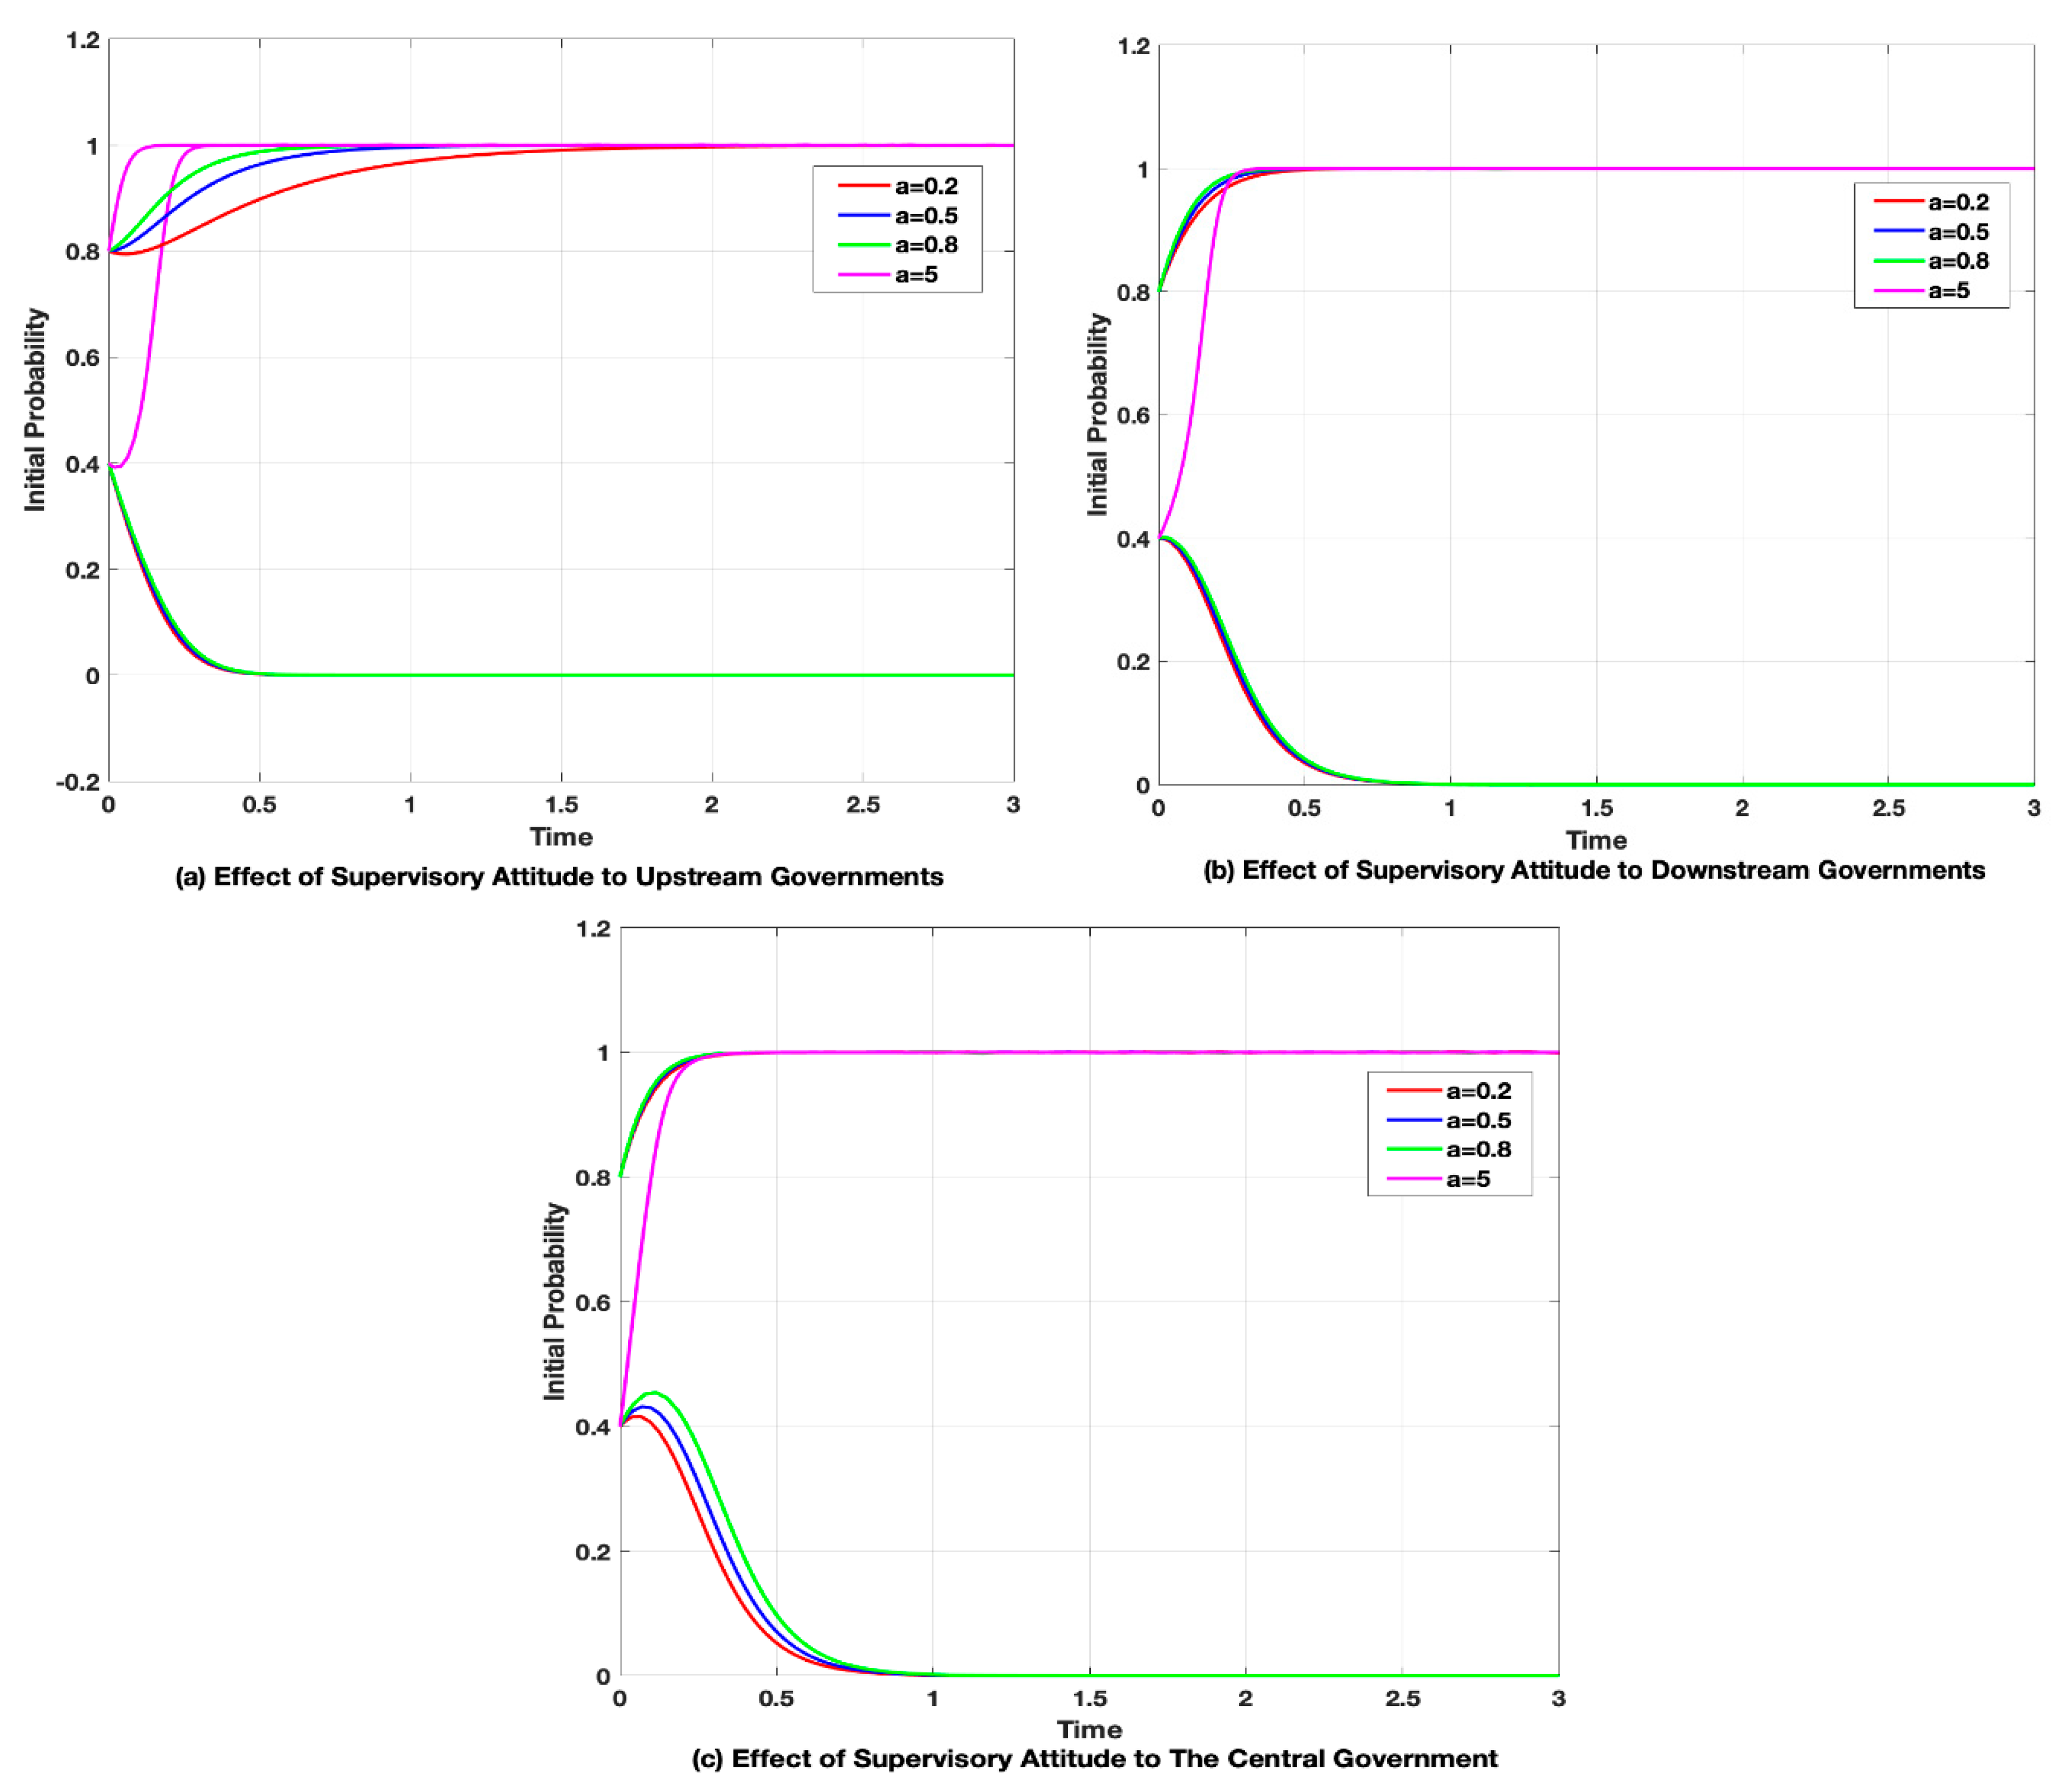
4.2.4. Supervisory Attitude
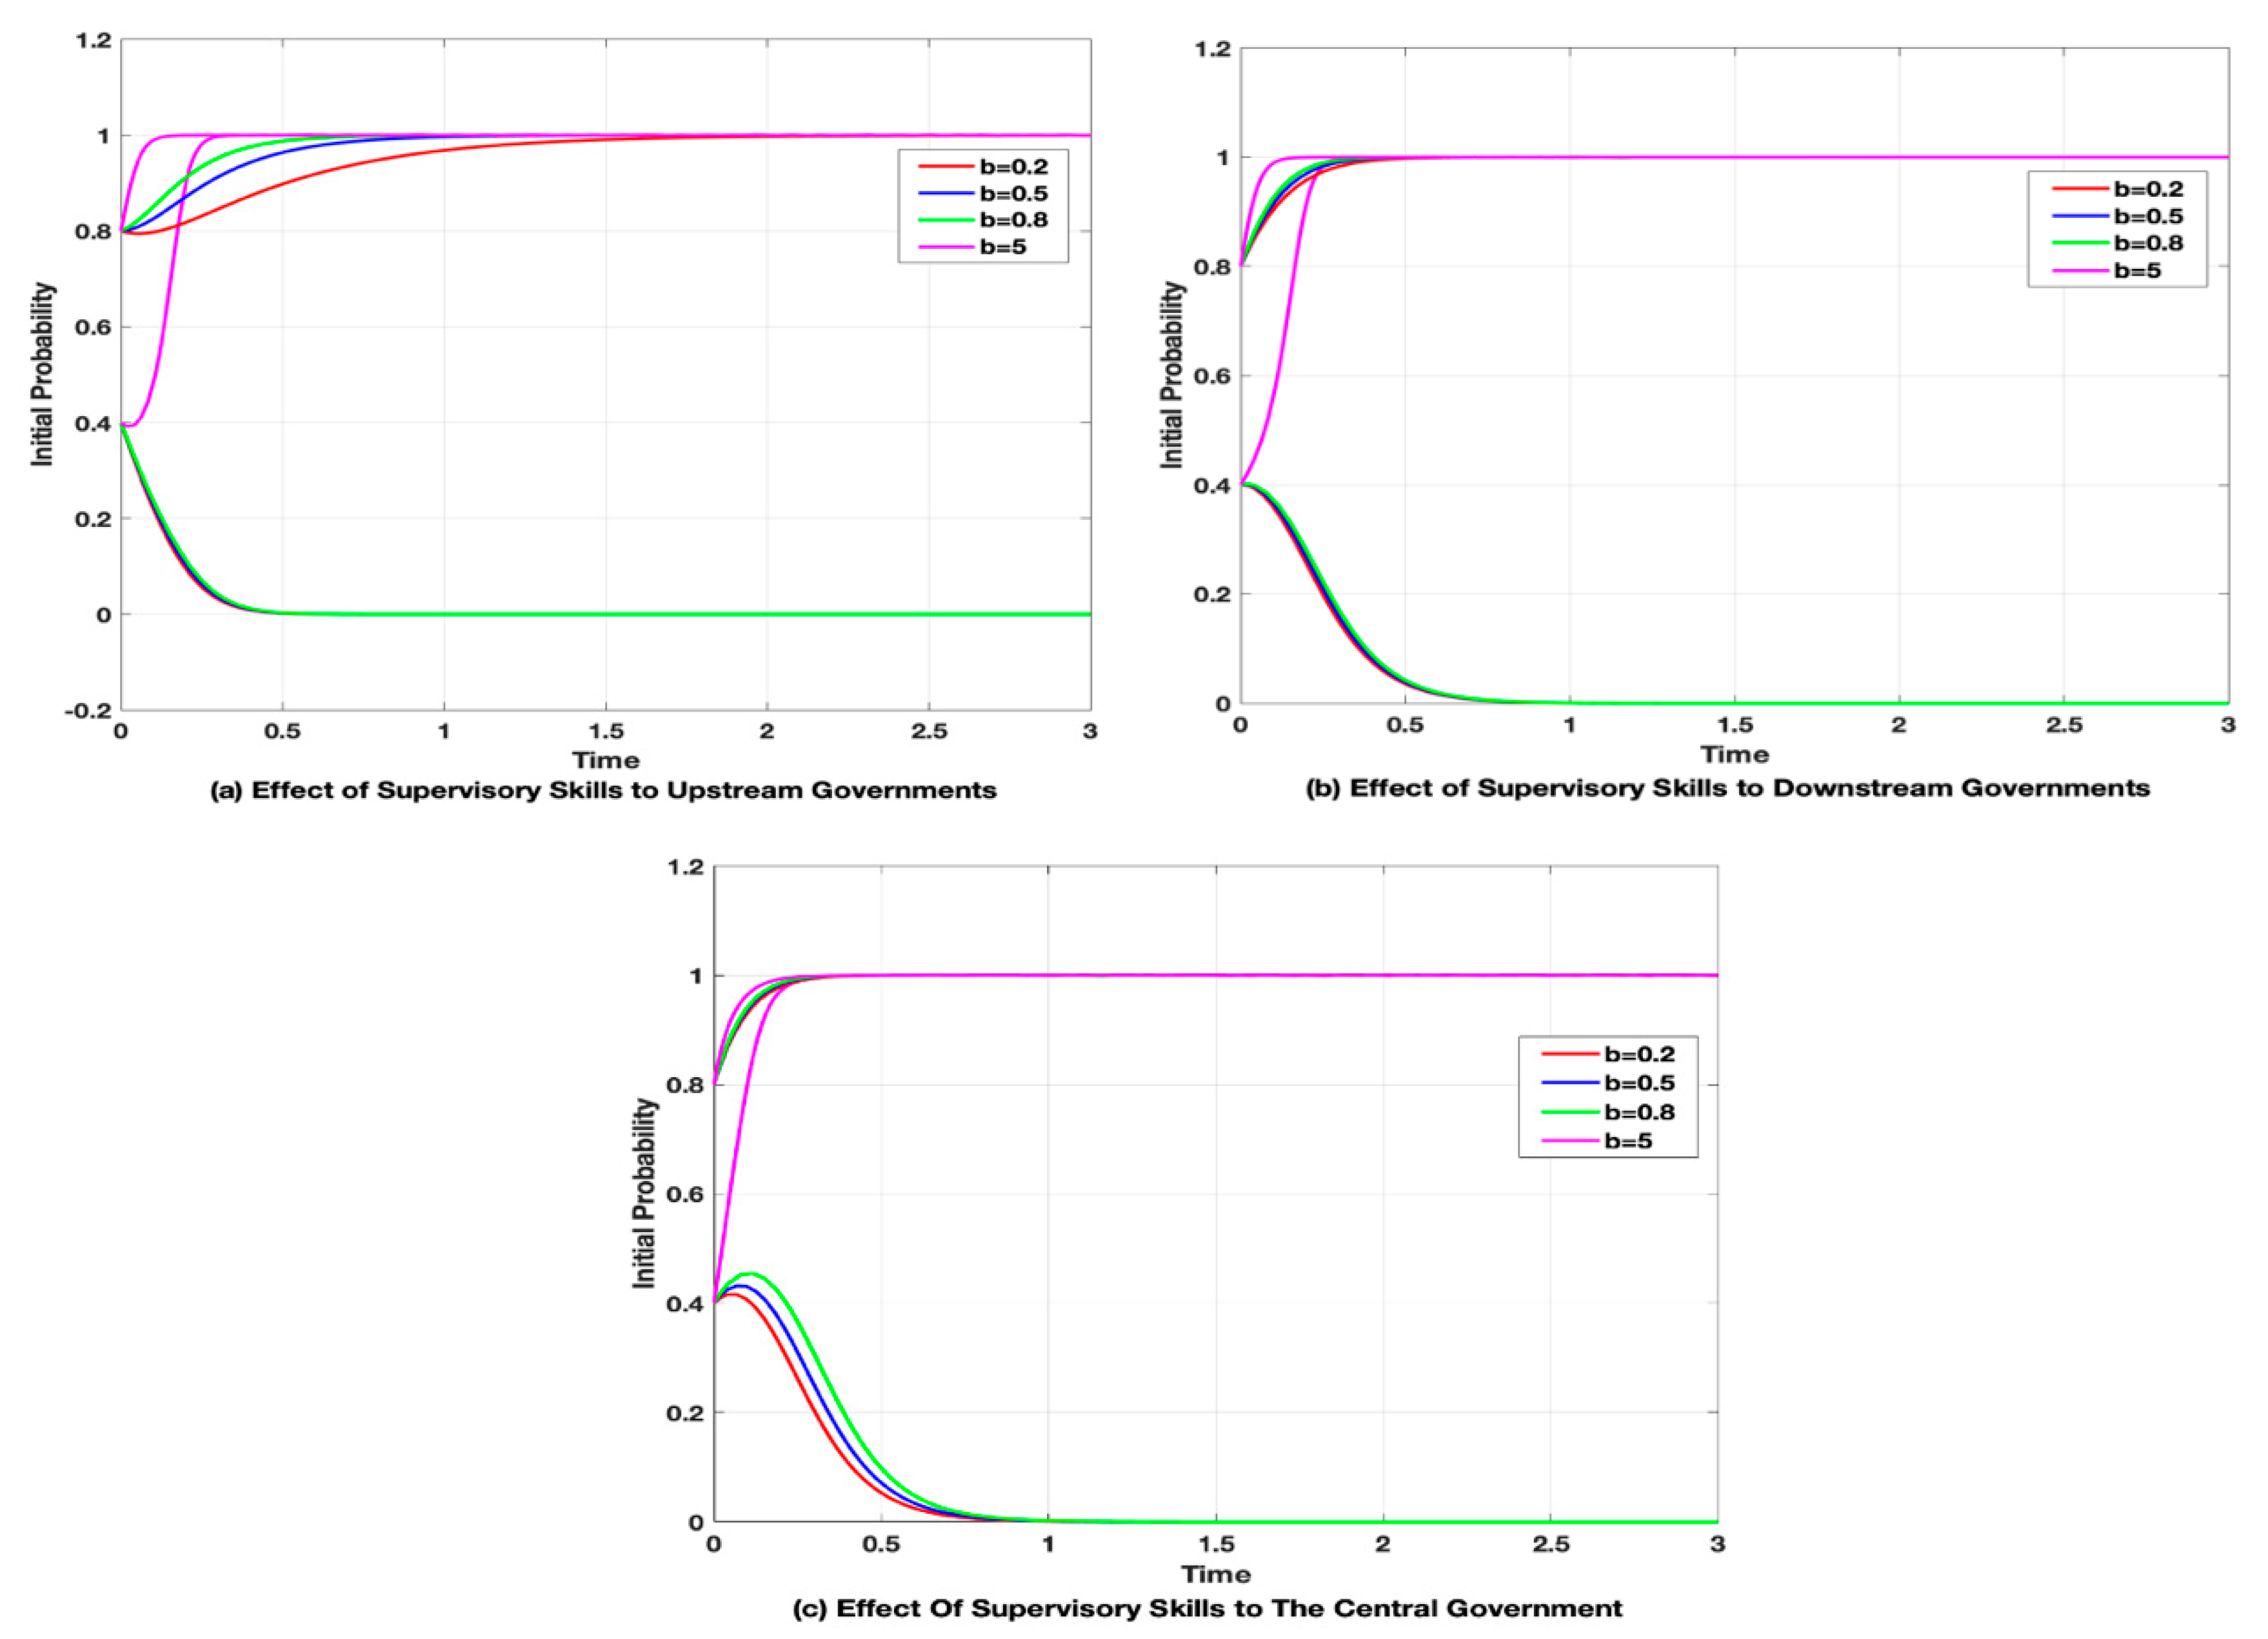
4.2.5. Supervisory Skills
5. Discussion
6. Conclusions
- (1)
- The relationship between the supervision costs and benefits of the central government will affect the evolution direction of the system. When the supervisory costs are greater than the benefits, the central government will not supervise. On the contrary, the central government will supervise the local governments.
- (2)
- The initial willingness to cooperate between upstream and downstream governments plays an important role in the evolution of the system.
- (3)
- The fines imposed by the central government on the local governments have no significant impact on the stability of the system under any circumstances.
- (4)
- The higher the ecological compensation fee, the higher the probability of upstream and downstream governments chose not to cooperate.
- (5)
- The supervisory attitude to water resources and supervisory skills will have an impact on stability. When supervisory attitude and skills of the central government to water resources have been improved significantly, it will promote the local governments to change their strategies from no-cooperation to cooperation.
- (6)
- The initial ecological benefits of downstream governments have no effect on stabilization strategies.
Author Contributions
Funding
Acknowledgments
Conflicts of Interest
Appendix A
References
- Umapathi, S.; Chong, M.N.; Sharma, A.K. Evaluation of plumbed rainwater tanks in households for sustainable water resource management: A real-time monitoring study. J. Clean. Prod. 2013, 42, 204–214. [Google Scholar] [CrossRef]
- Degefu, D.M.; He, W.; Liang, Y.; Jian, H.Z. Water Allocation in Transboundary River Basins under Water Scarcity: A Cooperative Bargaining Approach. Water Resour. Manag. 2016, 30, 4451–4466. [Google Scholar] [CrossRef]
- Degefu, D.M.; He, W.; Liao, Z.; Liang, Y.; Huang, Z.; Min, A. Mapping Monthly Water Scarcity in Global Transboundary Basins at Country-Basin Mesh Based Spatial Resolution. Sci. Rep. 2018, 8, 2144. [Google Scholar] [CrossRef]
- Chang, S.; Qin, W.; Wang, X. Dynamic optimal strategies in transboundary pollution game under learning by doing. Phys. A Stat. Mech. Appl. 2017, 490, 139–147. [Google Scholar] [CrossRef]
- Zhao, L.; Li, C.; Huang, R.; Si, S.; Jian, X.; Wei, H.; Yue, H. Harmonizing model with transfer tax on water pollution across regional boundaries in a China’s lake basin. Eur. J. Oper. Res. 2013, 225, 377–382. [Google Scholar] [CrossRef]
- Zhao, L. Model of collective cooperation and reallocation of benefits related to conflicts over water pollution across regional boundaries in a Chinese river basin. Environ. Model. Softw. 2009, 24, 603–610. [Google Scholar] [CrossRef]
- Silva, E.C.D.; Caplan, A.J. Transboundary Pollution Control in Federal Systems. J. Environ. Econ. Manag. 1997, 34, 173–186. [Google Scholar] [CrossRef]
- Yu, X. Transboundary water pollution management Lessons learned from river basin management in China, Europe and the Netherlands. Soc. Sci. Electron. Publ. 2011, 7, 188–203. [Google Scholar] [CrossRef]
- Sun, J.; Dang, Z.; Zheng, S. Development of payment standards for ecosystem services in the largest Interbasin water transfer projects in the world. Agric. Water Manag. 2016, 182, 158–164. [Google Scholar] [CrossRef]
- Engel, S.; Pagiola, S.; Wunder, S. Designing payments for environmental services in theory and practice: An overview of the issues. Ecol. Econ. 2008, 65, 663–674. [Google Scholar] [CrossRef]
- Wu, Y.; Wei, L.; Viña, A.; Luo, J.; He, G.; Ouyang, Z.; Zhang, H.; Liu, J. Performance and prospects of payments for ecosystem services programs: Evidence from China. J. Environ. Manag. 2013, 127, 86–95. [Google Scholar]
- Lyle, G.; Bryan, B.A.; Ostendorf, B. Identifying the spatial and temporal variability of economic opportunity costs to promote the adoption of alternative land uses in grain growing agricultural areas: An Australian example. J. Environ. Manag. 2015, 155, 123–135. [Google Scholar] [CrossRef] [PubMed]
- Porras, I.; Grieg-Gran, M.; Neves, N. All that glitters: A review of payments for watershed services in developing countries. IIED Nat. Resour. Issues 2008, 45, 420–442. [Google Scholar] [CrossRef]
- Locatelli, B.; Vignola, R. Managing watershed services of tropical forests and plantations: Can meta-analyses help? For. Ecol. Manag. 2009, 258, 1864–1870. [Google Scholar] [CrossRef]
- Xiong, K.; Kong, F.; Zhang, N.; Lei, N.; Sun, C. Analysis of the Factors Influencing Willingness to Pay and Payout Level for Ecological Environment Improvement of the Ganjiang River Basin. Sustainability 2018, 10, 2149. [Google Scholar] [CrossRef]
- Na, L.; Tang, G.; Ping, Z.; Yang, H.; Gou, Y.; Kai, Y. Statistical assessment and hydrological utility of the latest multi-satellite precipitation analysis IMERG in Ganjiang River basin. Atmos. Res. 2017, 183, 212–223. [Google Scholar] [CrossRef]
- Chen, M.; Lu, Y.; Ling, L.; Wan, Y.; Luo, Z.; Huang, H. Drivers of changes in ecosystem service values in Ganjiang upstream watershed. Land Use Policy 2015, 47, 247–252. [Google Scholar] [CrossRef]
- Xie, R.; Hu, F.; Pang, Y.; Zhang, N. Eco-Compensation in Multi-District River Networks in North Jiangsu, China. Environ. Manag. 2013, 51, 874–881. [Google Scholar] [CrossRef] [PubMed]
- Xiang, S.; Shu, X.; Zhu, X.J.; Zhu, X.D.; Li, Y.F.; Li, B.L. A new indices system for evaluating ecological-economic-social performances of wetland restorations and its application to Taihu Lake Basin, China. Ecol. Model. 2015, 295, 216–226. [Google Scholar] [CrossRef]
- State Council of the PRC. The Environmental Protection Law of the People’s Republic of China. Available online: http://www.npc.gov.cn/npc/xinwen/2014-04/25/content_1861279.htm (accessed on 24 April 2014).
- Lynch, B.D. Vulnerabilities, competition and rights in a context of climate change toward equitable water governance in Peru’s Rio Santa Valley. Glob. Environ. Chang. 2012, 22, 364. [Google Scholar] [CrossRef]
- Fu, Y.; Zhang, J.; Zhang, C.; Zang, W.; Guo, W.; Qian, Z.; Liu, L.; Zhao, J.; Feng, J. Payments for Ecosystem Services for watershed water resource allocations. J. Hydrol. 2018, 556, 689–700. [Google Scholar] [CrossRef]
- Feng, D.; Wu, W.; Liang, L.; Li, L.; Zhao, G. Payments for watershed ecosystem services: Mechanism, progress and challenges. Ecosyst. Health Sustain. 2018, 4, 13–28. [Google Scholar] [CrossRef]
- Myerson, R.B. Game Theory: Analysis of Conflict; Harvard University Press: Cambridge, MA, USA, 1991; pp. vii–xi. [Google Scholar]
- Qu, F.; Sun, Y. Research on Watershed Ecological Compensation Mechanism Based on Intergovernmental Game. China Popul. Resour. Environ. 2014, 1, 83–88. [Google Scholar] [CrossRef]
- Jie, M.; Ge, Y.; Xu, G. Cooperation Evolution of Ecological Compensation between Waterhead Region and Downstream Based on Evolutionary Game. Oper. Res. Manag. Sci. 2012, 21, 137–143. [Google Scholar] [CrossRef]
- Qian, C.; Cao, H.; Yan, H. Study on the balance mechanism of interests in marine ecological compensation. In IOP Conference Series: Earth Environmental Science Technology. Available online: https://iopscience.iop.org/article/10.1088/1755-1315/94/1/012183 (accessed on 1 April 2019).
- Venkatachalam, L. The contingent valuation method: A review. Environ. Impact Assess. Rev. 2004, 24, 89–124. [Google Scholar] [CrossRef]
- Bhandari, P.; Kc, M.; Shrestha, S.; Aryal, A.; Shrestha, U.B. Assessments of ecosystem service indicators and stakeholder’s willingness to pay for selected ecosystem services in the Chure region of Nepal. Appl. Geogr. 2016, 69, 25–34. [Google Scholar] [CrossRef]
- Pietrucha-Urbanik, K.; Zelazko, A. Approaches to Assess Water Distribution Failure. Period. Polytech. Civ. Eng. 2017, 61, 632–639. [Google Scholar] [CrossRef]
- Peng, Z.Y.; Zhang, L.L.; Yin, J.X.; Wang, H. Study of impact factors of willingness to pay regarding water reserve of South-to-North Water Diversion Project in Beijing based on Bayesian network model. J. Clean. Prod. 2018, 184, 569–578. [Google Scholar] [CrossRef]
- Sheng, J.; Webber, M. Incentive-compatible payments for watershed services along the Eastern Route of China’s South-North Water Transfer Project. Ecosyst. Serv. 2017, 25, 213–226. [Google Scholar] [CrossRef]
- Xie, H.; Wei, W.; Zhang, X. Evolutionary game and simulation of management strategies of fallow cultivated land: A case study in Hunan province, China. Land Use Policy 2018, 71, 86–97. [Google Scholar] [CrossRef]
- Fan, H.; Jiang, X.; Li, C.; Yuan, Z. Complex Network Modeling and Evolutionary Game Simulation of the Arctic Environmental Emergency Response and Governance. Wirel. Pers. Commun. 2018, 102, 951–961. [Google Scholar] [CrossRef]
- Rui, Z.; Xiao, Z.; Han, J.; Liu, C.J.T.F. For the sustainable performance of the carbon reduction labeling policies under an evolutionary game simulation. Technol. Forecast. Soc. Chang. 2016, 112, 262–274. [Google Scholar] [CrossRef]
- State Council of the PRC. Opinions on the Implementation of the Most Stringent Water Resources Management. Available online: http://www.gov.cn/zwgk/2012-02/16/content_2067664.htm (accessed on 16 February 2012).
- Zhang, C.; Anadon, L.D. A multi-regional input–output analysis of domestic virtual water trade and provincial water footprint in China. Ecol. Econ. 2014, 100, 159–172. [Google Scholar] [CrossRef]
- Bian, Y.; Yan, S.; Xu, H. Efficiency evaluation for regional urban water use and wastewater decontamination systems in China: A DEA approach. Resour. Conserv. Recycl. 2014, 83, 15–23. [Google Scholar] [CrossRef]
- Zhang, Q.; Xu, Z.; Shen, Z.; Li, S.; Wang, S. The Han River watershed management initiative for the South-to-North Water Transfer project (Middle Route) of China. Environ. Monit. Assess. 2009, 148, 369–377. [Google Scholar] [CrossRef]
- State Council of the PRC. Official Reply of the State Council on the Master Planning for the Project of Diverting Water from the South to the North. Available online: http://www.gov.cn/gongbao/content/2003/content_62541.htm (accessed on 23 December 2002).
- Li, J.; Zou, P.X.W. Fuzzy AHP-Based Risk Assessment Methodology for PPP Projects. J. Constr. Eng. Manag. 2011, 137, 1205–1209. [Google Scholar] [CrossRef]
- Poethke, H.J.; Kaiser, H. A simulation approach to evolutionary game theory: The evolution of time-sharing behaviour in a dragonfly mating system. Behav. Ecol. Sociobiol. 1985, 18, 155–163. [Google Scholar] [CrossRef]
- Ritzberger, K.; Weibull, J.W. Evolutionary Selection in Normal-Form Games. Econometrica 1995, 63, 1371–1399. [Google Scholar] [CrossRef]
- Huang, K. Evolutionary Game and Evolutionary Economics. Econ. Res. J. 2009, 44, 132–145. [Google Scholar]
- Lewontin, R.C. Evolution and the theory of games. J. Theor. Biol. 1961, 1, 382–403. [Google Scholar] [CrossRef]
- Robson, A.J.; Young, H. P Individual Strategy and Social Structure: An Evolutionary Theory of Institutions. Can. J. Econ. Rev. Can. D’Econ. 1999, 3, 329–331. [Google Scholar] [CrossRef]
- Taylor, P.D.; Jonker, L.B. Evolutionarily Stable Strategies and Game Dynamics. Math. Biosci. 1978, 40, 145–156. [Google Scholar] [CrossRef]
- Schmidt, C. Are evolutionary games another way of thinking about game theory? J. Evol. Econ. 2004, 14, 249–262. [Google Scholar] [CrossRef]
- Kaniovski, Y.M.; Young, H.P. Learning Dynamics in Games with Stochastic Perturbations. Games Econ. Behav. 1995, 11, 330–363. [Google Scholar] [CrossRef]
- Friedman, D. Evolutionary economics goes mainstream: A review of the theory of learning in games. J. Evol. Econ. 1998, 8, 423–432. [Google Scholar] [CrossRef]
- Friedman, D. On economic applications of evolutionary game theory. J. Evol. Econ. 1998, 8, 15–43. [Google Scholar] [CrossRef]
- Foster, D.; Young, P. Stochastic evolutionary game dynamics. Theor. Popul. Biol. 1990, 38, 219–232. [Google Scholar] [CrossRef]
- Cressman, R.; Apaloo, J. Evolutionary Game Theory; MIT Press: Cambridge, MA, USA, 2016; pp. 847–858. [Google Scholar]
- Smith, J.M. Evolution and the Theory of Games; Cambridge University Press: Cambridge, UK, 1982; pp. 41–45. [Google Scholar]
- State Council of the PRC. Action Plan for Establishing Market-oriented and Diversified Mechanism for Ecological Compensation. Available online: http://www.ndrc.gov.cn/zcfb/zcfbtz/201901/t20190111_925436.html (accessed on 28 December 2018).
- Jin, H.; Qian, Y.; Weingast, B.R. Regional decentralization and fiscal incentives: Federalism, Chinese style. J. Public Econ. 2006, 89, 1719–1742. [Google Scholar] [CrossRef]
- Wainwright, J. A dynamical systems approach to Bianchi cosmologies: Orthogonal models of class A. Class. Quantum Gravity 1989, 6, 1409–1431. [Google Scholar] [CrossRef]
- Bomze, I.M.; Weibull, J.W. Does Neutral Stability Imply Lyapunov Stability? Games Econ. Behav. 1995, 11, 173–192. [Google Scholar] [CrossRef]
- Vadali, S.R.; Kim, E.S. Feedback control of tethered satellites using Lyapunov stability theory. J. Guid. Control Dyn. 2015, 14, 729–735. [Google Scholar] [CrossRef]
- Wu, Q. A Study on Low-Carbon and Environmentally-Friendly Urbanization Path under the Perspective of Ecological Civilization. Adv. Mater. Res. 2014, 962–965, 1722–1725. [Google Scholar] [CrossRef]
- He, B.J.; Zhao, D.X.; Zhu, J.; Darko, A.; Gou, Z.H. Promoting and implementing urban sustainability in China: An integration of sustainable initiatives at different urban scales. Habitat Int. 2018, 82, 83–93. [Google Scholar] [CrossRef]
- Zhang, P.; Qin, G.; Wang, Y. Optimal Maintenance Decision Method for Urban Gas Pipelines Based on as Low as Reasonably Practicable Principle. Sustainability 2019, 11, 153. [Google Scholar] [CrossRef]
- Cai, X. Water stress, water transfer and social equity in Northern China—Implications for policy reforms. J. Environ. Manag. 2008, 87, 14–25. [Google Scholar] [CrossRef] [PubMed]
- Jiang, M.; Shen, X.; Wang, Y.; Wang, L. Evaluation and temporal-spatial differences of the effectiveness of the River Chief system in Jiangsu Province. South-North Water Transf. Water Sci. Technol. 2018, 16, 201–208. [Google Scholar] [CrossRef]
- Li, H.; Zhou, L.A. Political turnover and economic performance: The incentive role of personnel control in China. J. Public Econ. 2003, 89, 1743–1762. [Google Scholar] [CrossRef]
- Van Hecken, G.; Bastiaensen, J.; Vásquez, W.F. The viability of local payments for watershed services: Empirical evidence from Matiguà s, Nicaragua. Ecol. Econ. 2012, 74, 169–176. [Google Scholar] [CrossRef]


| Parameters | Description |
|---|---|
| Direct costs of upstream governments | |
| Opportunity costs of upstream governments | |
| Supervision costs of the central government | |
| Transaction costs of upstream governments | |
| Transaction costs of downstream governments | |
| Fines of unilateral default for upstream governments | |
| Fines of unilateral default for downstream governments | |
| Initial ecological benefits of downstream governments when upstream governments protect the water resources | |
| Initial ecological benefits of downstream governments when upstream governments don’t protect the water resources | |
| M | Additional benefits of upstream governments |
| Additional benefits of downstream governments | |
| R | Ecological compensation fee |
| Benefits of the central government | |
| a | Supervisory attitude towards water resources |
| b | Supervisory skills |
| Governments | Symbol | Value | Strategies |
|---|---|---|---|
| Upstream governments | m | 1 | Protecting water resources |
| 2 | Not protecting water resources | ||
| Downstream governments | n | 1 | Paying for a compensation fee |
| 2 | Not paying for a compensation fee | ||
| The Central government | k | 1 | Supervision |
| 2 | Not supervision |
| When the Central Government Supervise the Local Governments | |||||||
|---|---|---|---|---|---|---|---|
| Downstream Governments | |||||||
| Paying for a Compensation Fee | Not Paying for a Compensation Fee | ||||||
| Upstream Governments | Downstream Governments | Central Government | Upstream Governments | Downstream Governments | Central Government | ||
| Upstream governments | Protecting water resources | ||||||
| Not protecting water resources | 0 | ||||||
| When the Central Government Do Not Supervise the Local Governments | |||||||
|---|---|---|---|---|---|---|---|
| Downstream Governments | |||||||
| Paying for a Compensation Fee | Not Paying for a Compensation Fee | ||||||
| Upstream Governments | Downstream Governments | Central Government | Upstream Governments | Downstream Governments | Central Government | ||
| Upstream governments | Protecting water resources | 0 | 0 | ||||
| Not protecting water resources | R | 0 | 0 | 0 | |||
© 2019 by the authors. Licensee MDPI, Basel, Switzerland. This article is an open access article distributed under the terms and conditions of the Creative Commons Attribution (CC BY) license (http://creativecommons.org/licenses/by/4.0/).
Share and Cite
Gao, X.; Shen, J.; He, W.; Sun, F.; Zhang, Z.; Zhang, X.; Yuan, L.; An, M. Multilevel Governments’ Decision-Making Process and Its Influencing Factors in Watershed Ecological Compensation. Sustainability 2019, 11, 1990. https://doi.org/10.3390/su11071990
Gao X, Shen J, He W, Sun F, Zhang Z, Zhang X, Yuan L, An M. Multilevel Governments’ Decision-Making Process and Its Influencing Factors in Watershed Ecological Compensation. Sustainability. 2019; 11(7):1990. https://doi.org/10.3390/su11071990
Chicago/Turabian StyleGao, Xin, Juqin Shen, Weijun He, Fuhua Sun, Zhaofang Zhang, Xin Zhang, Liang Yuan, and Min An. 2019. "Multilevel Governments’ Decision-Making Process and Its Influencing Factors in Watershed Ecological Compensation" Sustainability 11, no. 7: 1990. https://doi.org/10.3390/su11071990
APA StyleGao, X., Shen, J., He, W., Sun, F., Zhang, Z., Zhang, X., Yuan, L., & An, M. (2019). Multilevel Governments’ Decision-Making Process and Its Influencing Factors in Watershed Ecological Compensation. Sustainability, 11(7), 1990. https://doi.org/10.3390/su11071990