A Framework for Ecological Compensation Assessment: A Case Study in the Upper Hun River Basin, Northeast China

Abstract
1. Introduction
2. Materials and Methods
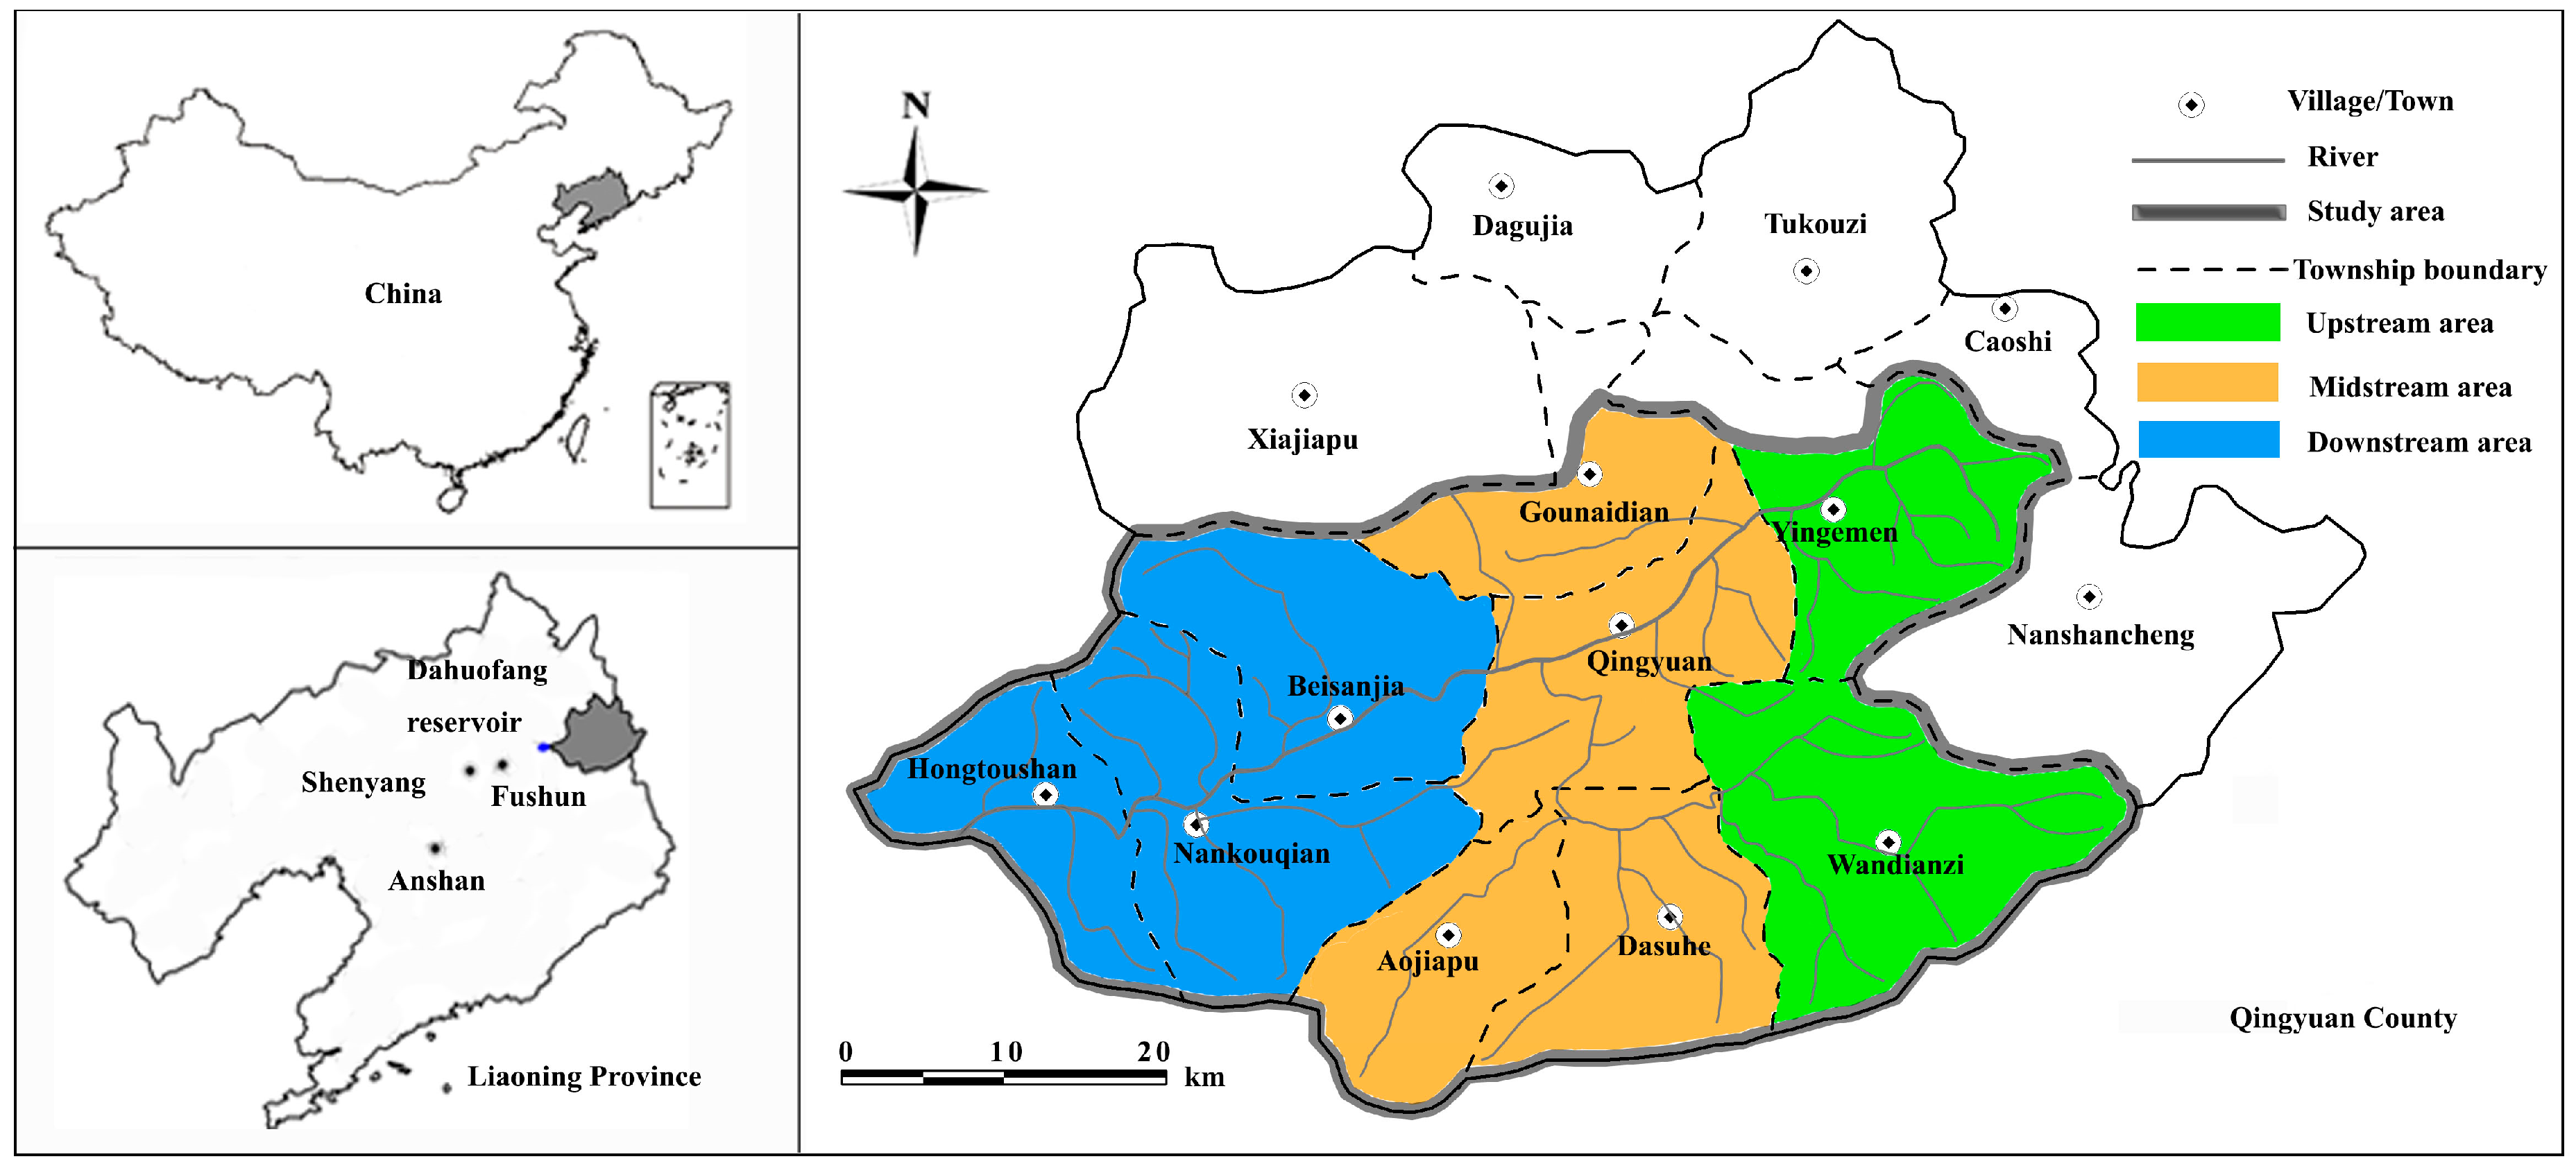
2.1. Study Area
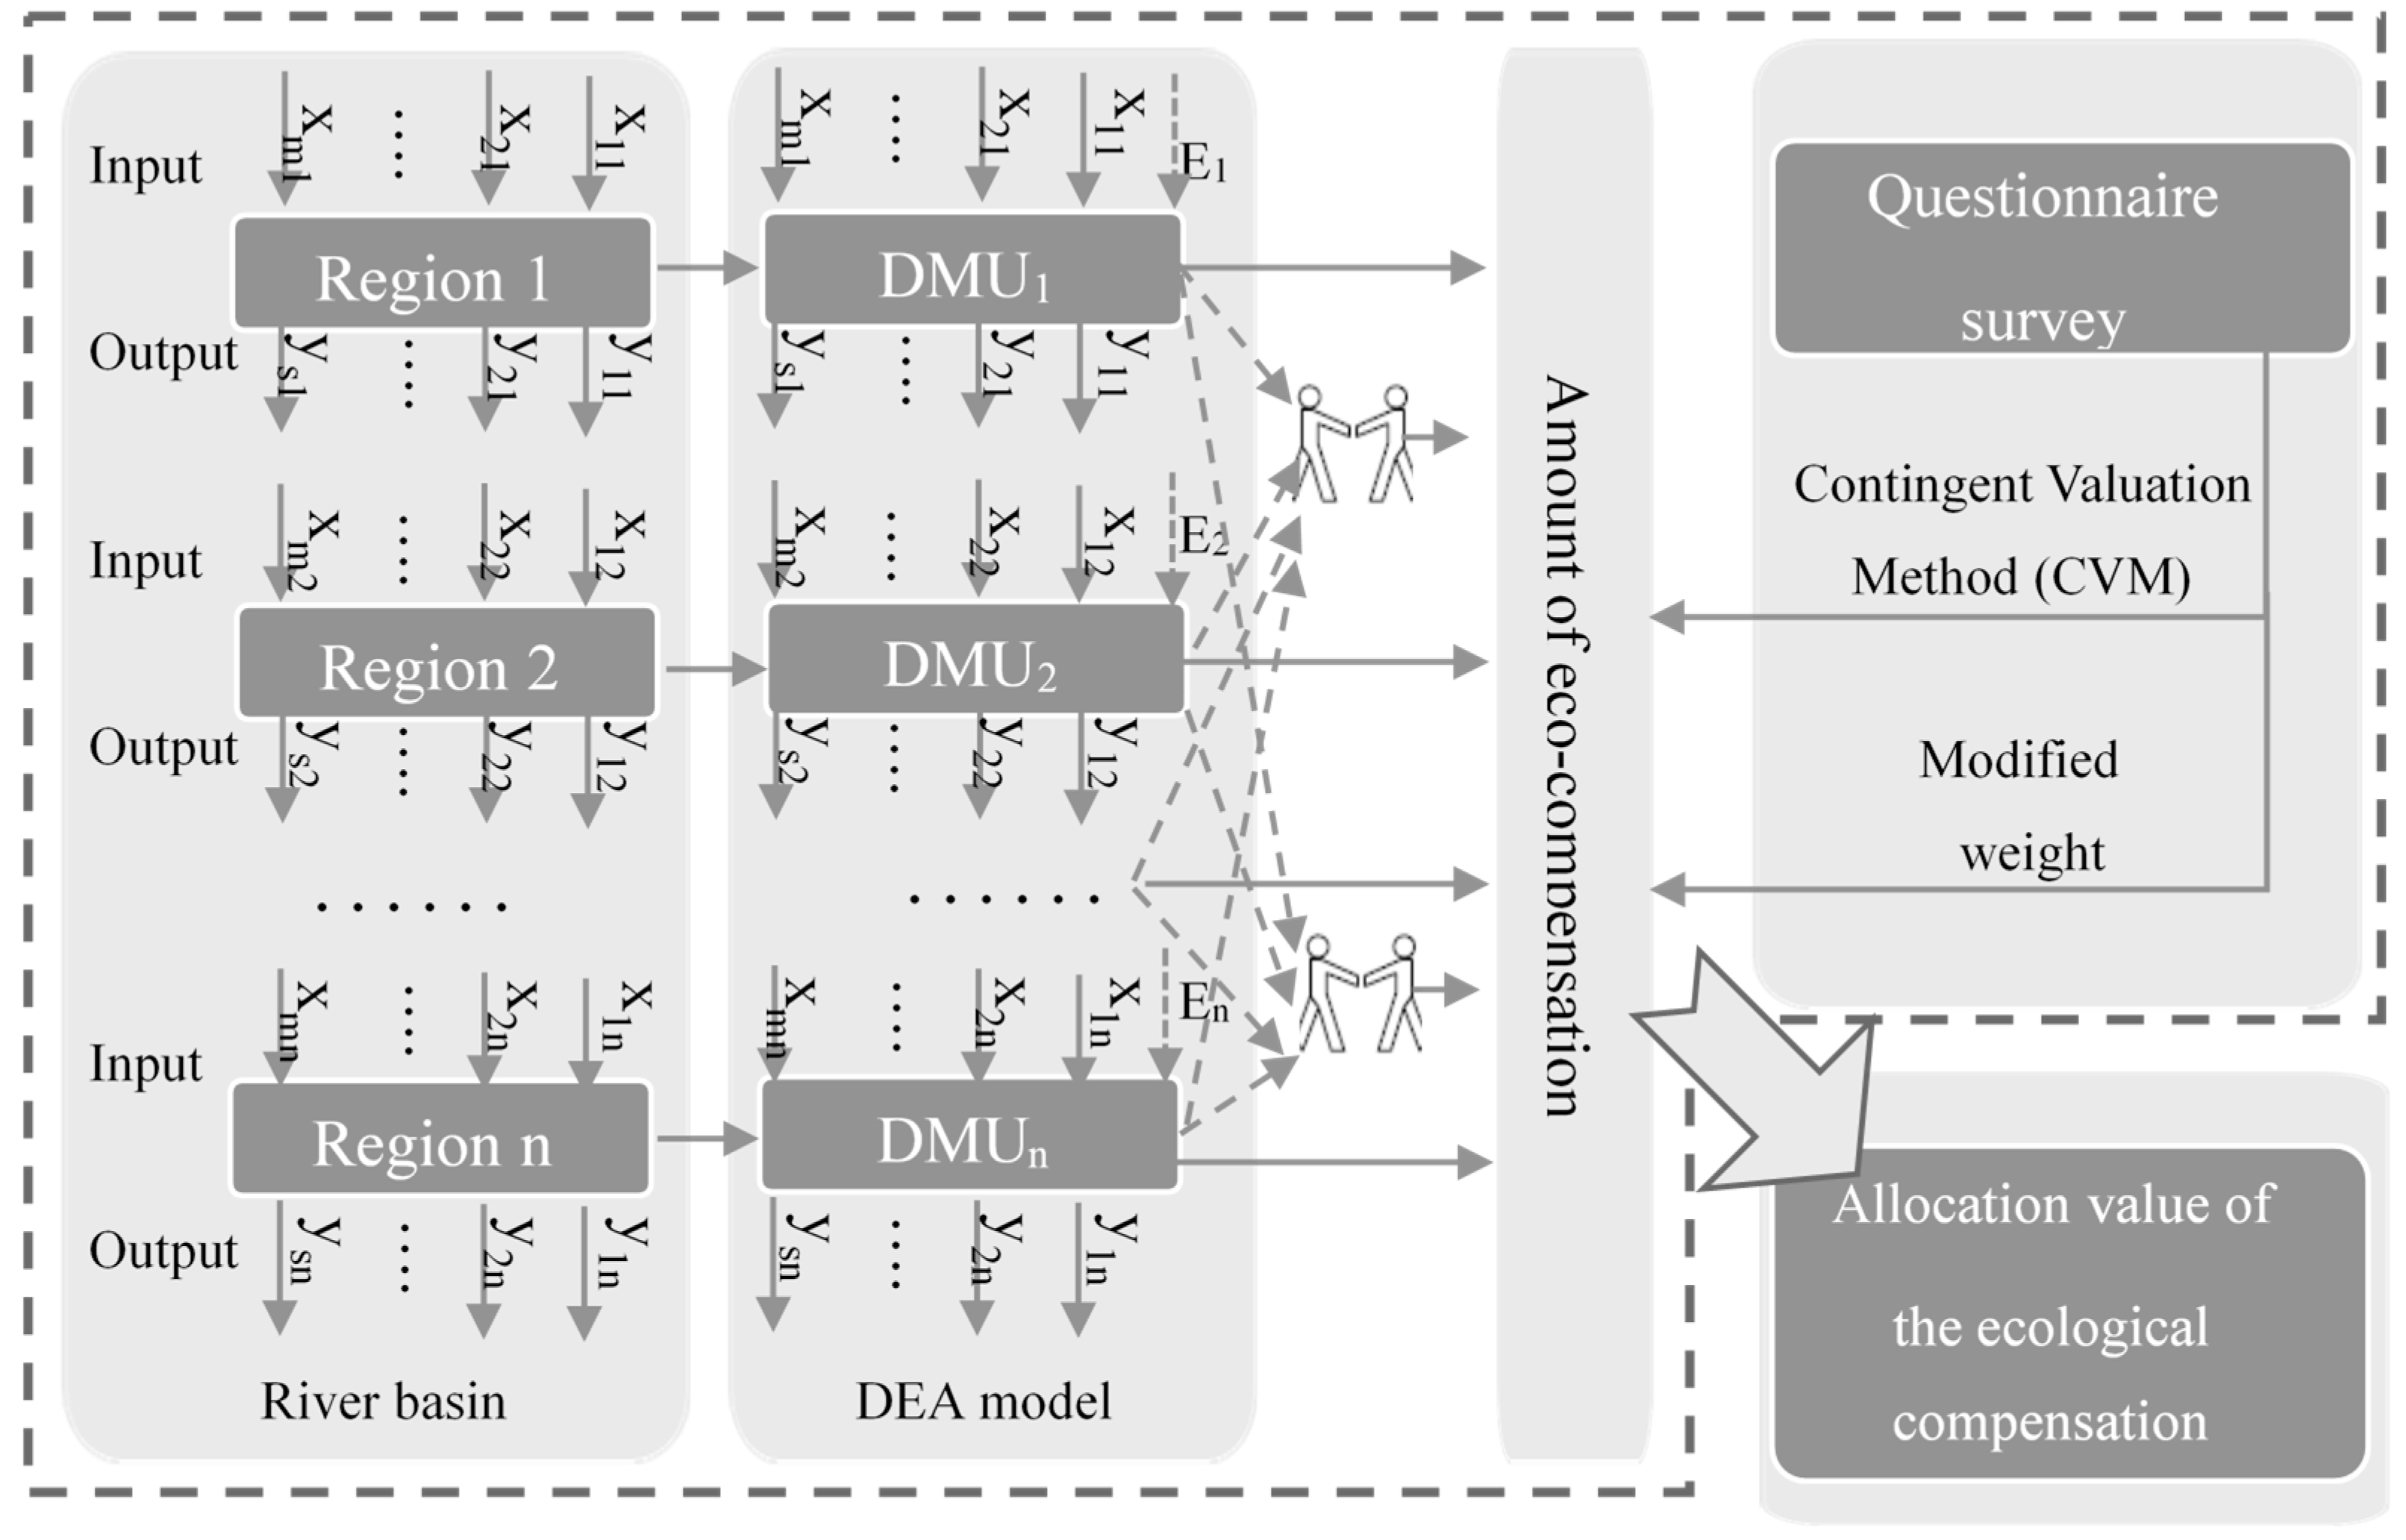
2.2. Method
2.2.1. DEA
2.2.2. Equitable Allocation of Shared Costs
2.2.3. Modified Results of the Allocation Model
3. Data and Analysis
3.1. Inputs and Outputs of DEA
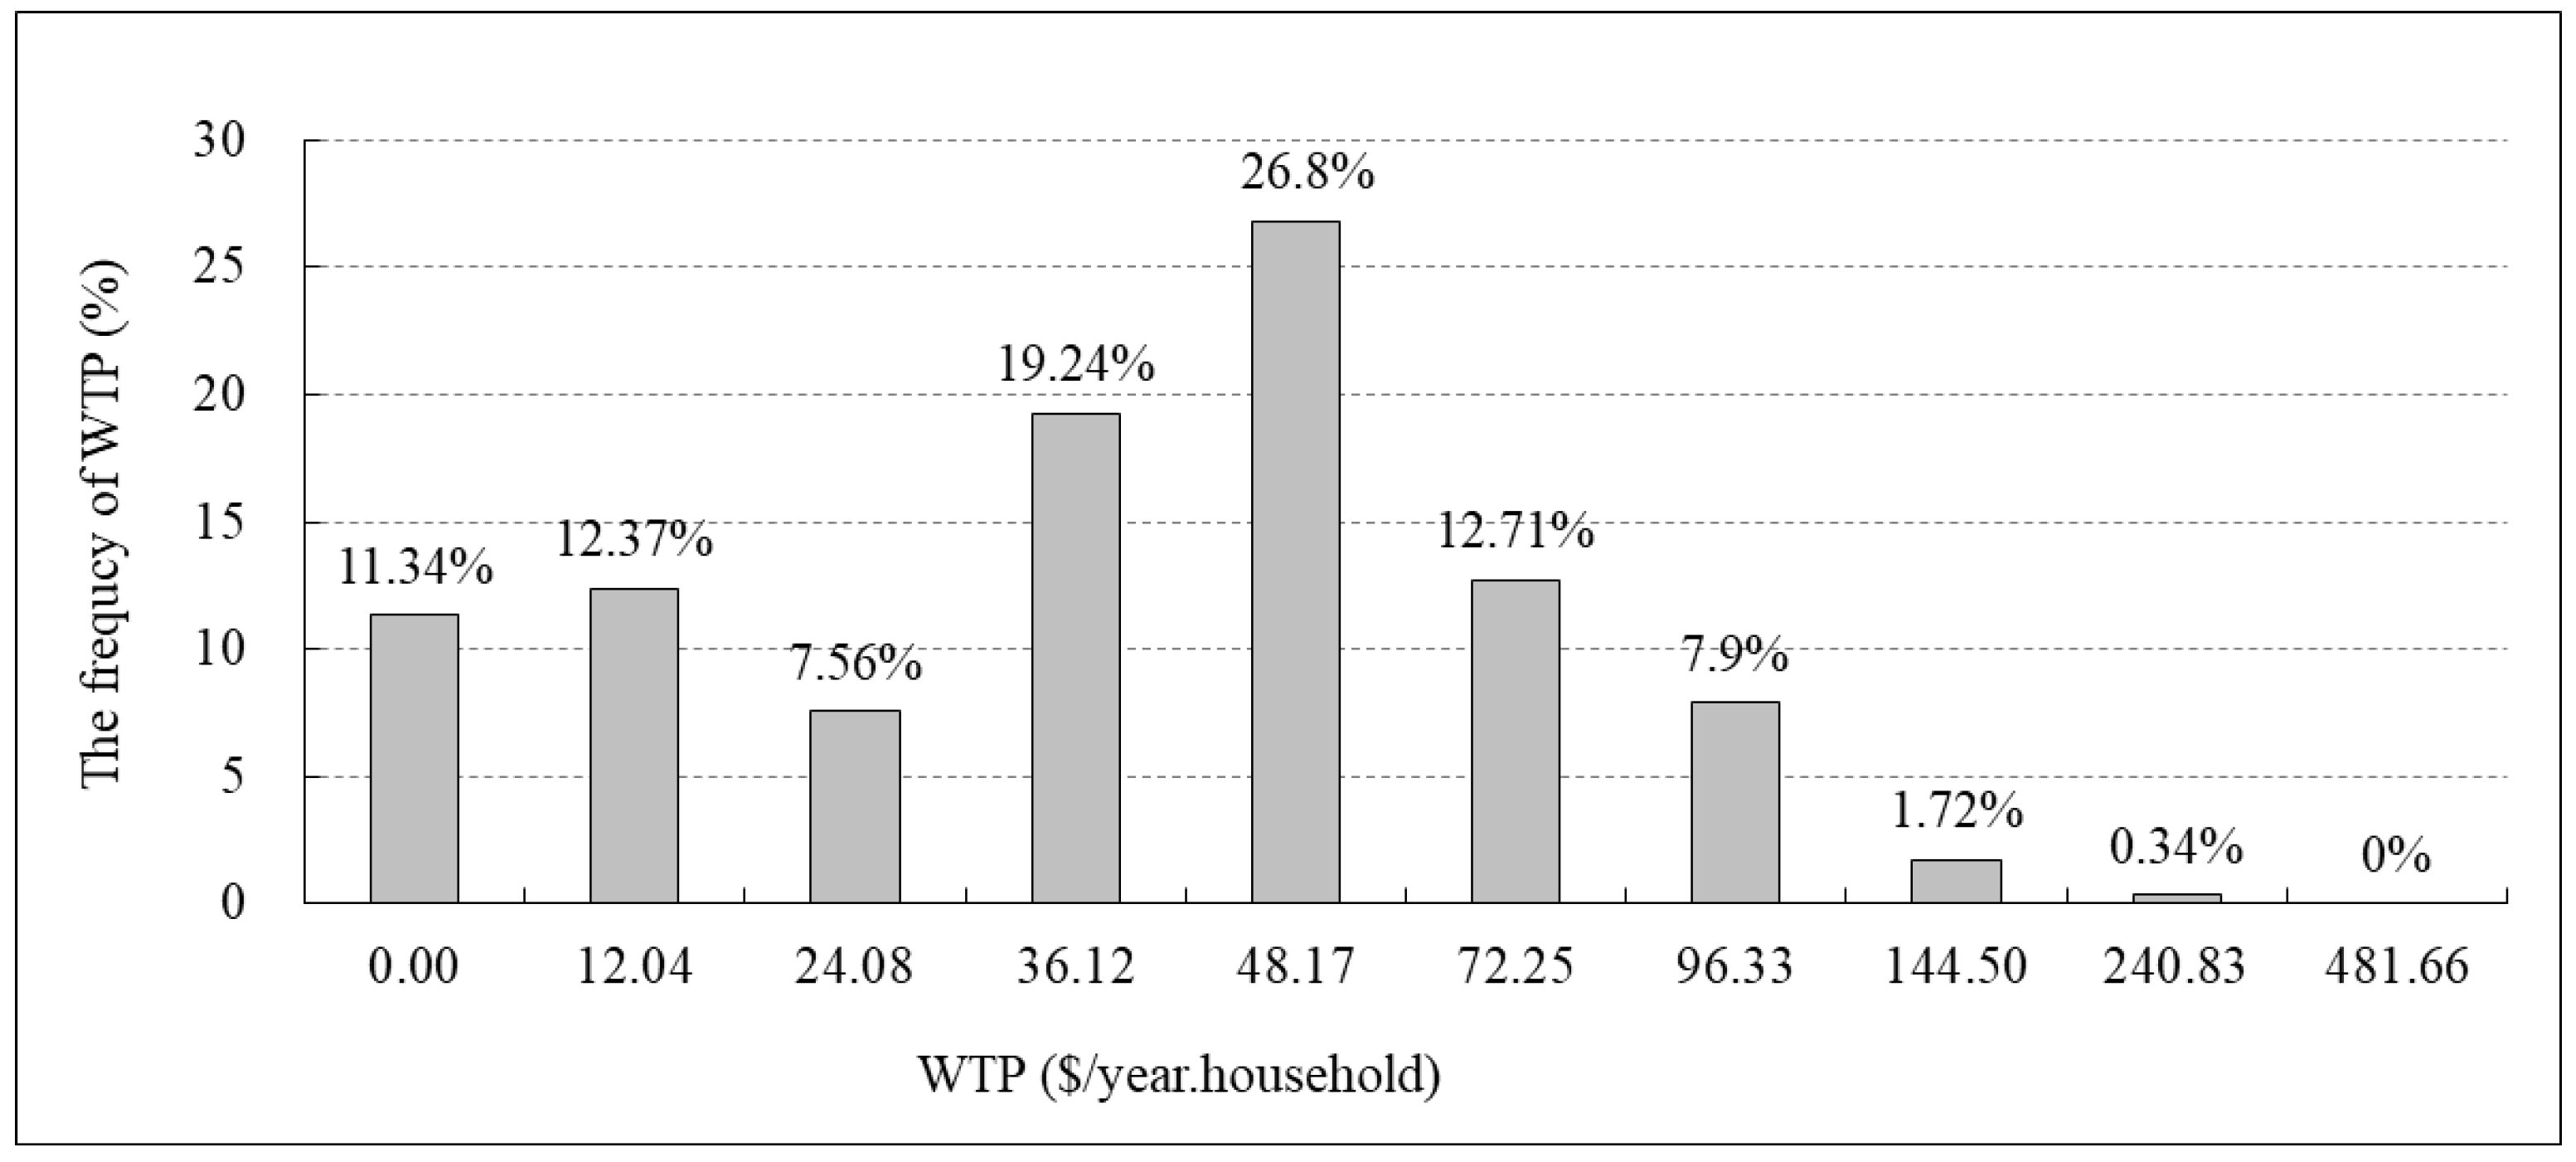
3.2. Amount of Ecological Compensation
3.3. Modified Weight
4. Results and Discussion
4.1. Results
4.2. Discussion
5. Conclusions
Author Contributions
Funding
Acknowledgments
Conflicts of Interest
References
- Del Saz-Salazar, S.; Hernández-Sancho, F.; Sala-Garrido, R. The social benefits of restoring water quality in the context of the Water Framework Directive: A comparison of willingness to pay and willingness to accept. Sci. Total Environ. 2009, 407, 4574–4583. [Google Scholar] [CrossRef] [PubMed]
- Benjankar, R.; Koenig, F.; Tonina, D. Comparison of hydromorphological assessment methods: Application to the Boise River, USA. J. Hydrol. 2013, 492, 128–138. [Google Scholar] [CrossRef]
- Sun, L.; Lu, W.; Yang, Q.; Martín, J.D.; Li, D. Ecological compensation estimation of soil and water conservation based on cost-benefit analysis. Water Resour. Manag. 2013, 27, 2709–2727. [Google Scholar] [CrossRef]
- Xie, R.; Pang, Y.; Li, Z.; Zhang, N.; Hu, F. Eco-compensation in multi-district river networks in North Jiangsu, China. Environ. Manag. 2013, 51, 874–881. [Google Scholar] [CrossRef] [PubMed]
- Dong, G.J. Based on the Literature Statistical Ecological Compensation Academic Research Characteristics and Development Analysis. Adv. Mater. Res. 2013, 663, 795–800. [Google Scholar] [CrossRef]
- Pagiola, S.; Ramirez, E.; Gobbi, J.; de Haan, C.; Ibrahim, M.; Murgueitio, E.; Ruiz, J.P. Paying for the environmental services of silvopastoral practices in Nicaragua. Ecol. Econ. 2007, 64, 374–385. [Google Scholar] [CrossRef]
- Pang, A.P.; Sun, T.; Yang, Z.F. Economic compensation standard for irrigation processes to safeguard environmental flows in the Yellow River Estuary, China. J. Hydrol. 2013, 482, 129–138. [Google Scholar] [CrossRef]
- Owubah, C.E.; Le Master, D.C.; Bowker, J.M.; Lee, J.G. Forest tenure systems and sustainable forest management: The case of Ghana. For. Ecol. Manag. 2001, 149, 253–264. [Google Scholar] [CrossRef]
- Xiong, K.; Kong, F.; Zhang, N.; Lei, N.; Sun, C. Analysis of the factors influencing willingness to pay and payout level for ecological environment improvement of the Ganjiang River basin. Sustainability 2018, 10, 2149. [Google Scholar] [CrossRef]
- Moran, D.; McVittie, A.; Allcroft, D.J.; Elston, D.A. Quantifying public preferences for agri-environmental policy in Scotland: A comparison of methods. Ecol. Econ. 2007, 63, 42–53. [Google Scholar] [CrossRef]
- Wünscher, T.; Engel, S.; Wunder, S. Spatial targeting of payments for environmental services: A tool for boosting conservation benefits. Ecol. Econ. 2008, 65, 822–833. [Google Scholar] [CrossRef]
- Pietrucha-Urbanik, K.; Zelazko, A. Approaches to assess water distribution failure. Period. Polytech. Civ. Eng. 2017, 61, 632–639. [Google Scholar] [CrossRef]
- Xu, L.; Yu, B.; Li, Y. Ecological compensation based on willingness to accept for conservation of drinking water sources. Front. Environ. Sci. Eng. 2015, 9, 58–65. [Google Scholar] [CrossRef]
- Bian, Y.W.; Yang, F. Resource and environment efficiency analysis of provinces in China: A DEA approach based on Shannon’s entropy. Energy Policy 2010, 38, 1909–1917. [Google Scholar] [CrossRef]
- Liu, Y.; Sun, C.; Xu, S. Eco-efficiency assessment of water systems in China. Water Resour. Manag. 2013, 27, 4927–4939. [Google Scholar] [CrossRef]
- Charnes, A.; Cooper, W.W.; Rhodes, E. Measuring the efficiency of decision making units. Eur. J. Oper. Res. 1978, 2, 429–444. [Google Scholar] [CrossRef]
- Farell, M. The measurement of productive efficiency. J. R. Stat. Soc. A Stat. 1957, 253–290. [Google Scholar] [CrossRef]
- Amirteimoori, A.; Shafiei, M. Characterizing an equitable omission of shared resources: A dea-based approach. Appl. Math. Comput. 2006, 177, 18–23. [Google Scholar] [CrossRef]
- Shapley, L.S. A Value for n-Person Games. In The Shapley value: Essays in honor of Lloyd S. Shapley; Roth, A.E., Ed.; Cambridge University Press: New York, NY, USA, 1988; pp. 31–40. [Google Scholar]
- Butnariu, D.; Kroupa, T. Shapley mappings and the cumulative value for n-person games with fuzzy coalitions. Eur. J. Oper. Res. 2008, 186, 288–299. [Google Scholar] [CrossRef]
- Chang, L.; Xu, D.W.; Hou, T.S.; Yang, C.W.; Wu, A.D. A study of supply Chain theory applied in the water resource market allocation. In International Asia Conference on Industrial Engineering and Management Innovation (IEMI2012) Proceedings; Springer: Heidelberg, Germany, 2013; pp. 939–947. [Google Scholar]
- China EPA. Environmental Quality Standards For Surface Water (GB3838-2002); China Environmental Science Press: Beijing, China, 2002. [Google Scholar]
- Venkatachalam, L. The contingent valuation method: A review. Environ. Impact Assess. Rev. 2004, 24, 89–124. [Google Scholar] [CrossRef]
- Ciriacy-Wantrup, S.V. Capital returns from soil conservation practices. Am. J. Agric. Econ. 1947, 29, 1181–1196. [Google Scholar] [CrossRef]
- Davis, R. The Value of Outdoor Recreation: An Economic Study of the Marine Woods. Ph.D. Thesis, Harvard University, Cambridge, MA, USA, 1963. [Google Scholar]
- Pan, J.M.; Zeng, W.Z.; Zhang, W.K. The willingness to pay for the ecological compensation of Min River Basin--Based on the survey of Chengdu 282 households. Environ. Pollut. 2012, 1, 14–20. [Google Scholar] [CrossRef]
- Duke, J.; Aull-Hyde, R. Identifying public preferences for land preservation using the analytic hierarchy process. Ecol. Econ. 2002, 42, 131–145. [Google Scholar] [CrossRef]
- Xu, S.; Liu, Y.; Qiang, P. River functional evaluation and regionalization of the Songhua River in Harbin, China. Environ. Earth Sci. 2014, 71, 3571–3580. [Google Scholar] [CrossRef]
- Serbu, R.; Marza, B.; Borza, S. A spatial Analytic Hierarchy Process for identification of water pollution with GIS software in an eco-economy environment. Sustainability 2016, 8, 1208. [Google Scholar] [CrossRef]


| Category | Index Description/Units | |
|---|---|---|
| Inputs | Water consumption (X1) | Consumption of water resource/104 m3 |
| Water-regulation ability (X2) | Divide the service discharge of reservoirs and dams by the annual mean runoff/% | |
| Population (X3) | Number of people | |
| Outputs | Economic benefit (Y1) | Gross domestic product/104 $ |
| Water quality (Y2) | Class of water quality | |
| No. | Question | Response | |
|---|---|---|---|
| Environmental awareness | 1 | Do you know about river ecological compensation? | A. Yes |
| B. No | |||
| 2 | Do you support river ecological compensation? | A. Yes | |
| B. No | |||
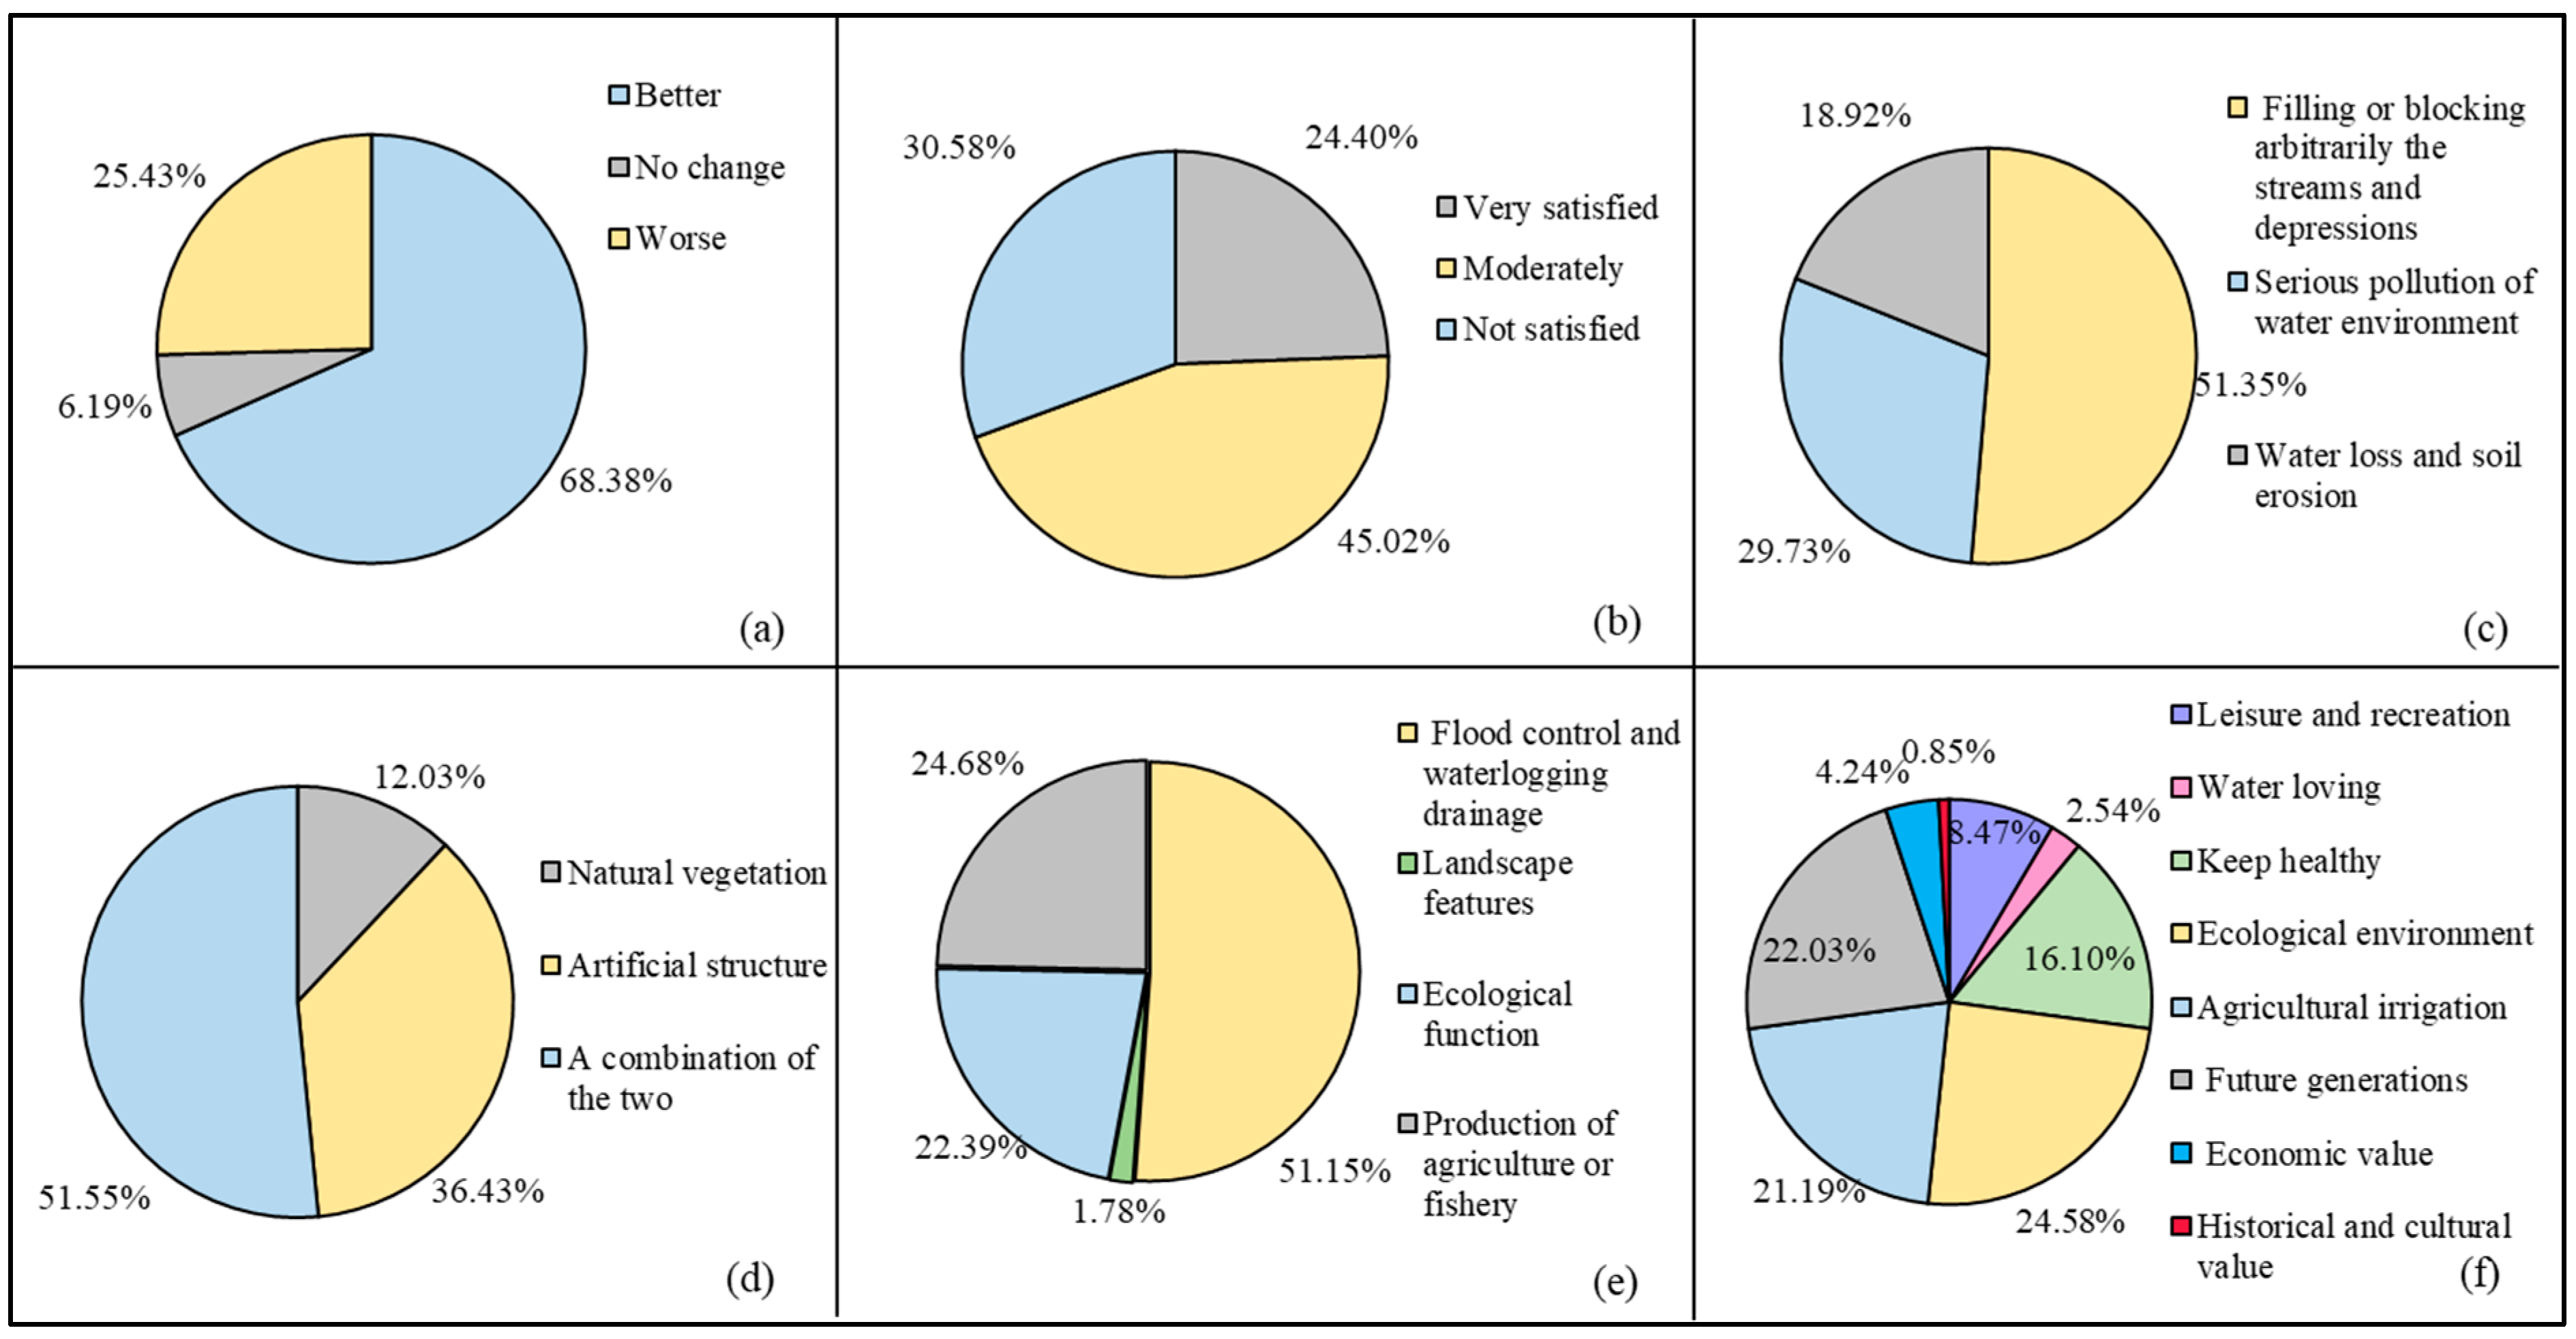
| Ecological state and preference | 3 | What is your opinion about the local environment changes since river ecological protection and construction? | A. Better |
| B. Worse | |||
| C. No change | |||
| 4 | Are you satisfied with the current condition of river ecological protection and construction? | A. Very satisfied | |
| B. Moderately | |||
| C. Not satisfied | |||
| 5 | What impression does the environment around the river give you? (You may choose more than one option) | A. Filling or blocking arbitrarily the streams and depressions | |
| B. Serious pollution of water environment | |||
| C. Water loss and soil erosion | |||
| D. A good ecological environment | |||
| 6 | Which type of embankment slope? | A. Natural vegetation | |
| B Artificial structure | |||
| C. A combination of the two | |||
| 7 | What is the functionality of the river around your location? (You may choose more than one options) | A. Flood control and waterlogging drainage | |
| B. Landscape features | |||
| C. Ecological function | |||
| D. Production of agriculture or fishery | |||
| E. Others | |||
| 8 | What would be most important thing for you about the river? (You may choose more than one options) | A. Leisure and recreation | |
| B. Water loving | |||
| C. Keep healthy | |||
| D. Ecological environment | |||
| E. Agricultural irrigation | |||
| F. Future generations | |||
| G. Economic value (business, catering, real estate, etc.) | |||
| H. Historical and cultural value | |||
| I. Others | |||
| 9 | Personal opinions on and ideas for river ecological protection and construction. | Open-ended | |
| Ecological compensation | 10 | As an important ecological compensation measure, how much would you like to pay as a fee every year ($/household)? | A. 0 |
| B.12.04 | |||
| C. 24.08 | |||
| D. 36.12 | |||
| E. 48.17 | |||
| F. 72.25 | |||
| G. 96.33 | |||
| H. 144.5 | |||
| I. 240.83 | |||
| J. 481.66 | |||
| 11 | What method of payment would you like? | A. Donation | |
| B. Utilities | |||
| C. Participating in voluntary labor | |||
| D. Eco-tax | |||
| E. Environmental lottery | |||
| Personal information | 12 | What is your age range? | A. <16 |
| B. 16–30 | |||
| C. 30–50 | |||
| D. >50 | |||
| 13 | What is your educational level? | A. Primary school | |
| B. Middle school | |||
| C. High school | |||
| D. College degree and above | |||
| 14 | What is your monthly income level ($)? | A. <240.83 | |
| B. 240.83–481.66 | |||
| C. 481.66–722.5 | |||
| D. >722.5 | |||
| 15 | How do you get to the river? | A. Walk | |
| B. Bicycle | |||
| C. Bus or car | |||
| D. Other |
| Basin | The Upper Reach of Hun River Basin | ||||||||
|---|---|---|---|---|---|---|---|---|---|
| Area | Upstream area | Midstream area | Downstream area | ||||||
| 0.279 | 0.422 | 0.299 | |||||||
| Sub-area | Wandianzi | Yingemen | Dasuhe | Gounaidian | Qingyuan | Aojiapu | Beisanjia | Nankouqian | Hongtoushan |
| 0.45 | 0.55 | 0.315 | 0.118 | 0.342 | 0.225 | 0.391 | 0.394 | 0.215 | |
| Weight | 0.126 | 0.153 | 0.133 | 0.050 | 0.144 | 0.095 | 0.117 | 0.118 | 0.064 |
| Town/Village | DEA Game (104$) | Modified Allocation Value (104$) | Location |
|---|---|---|---|
| Wandianzi Town | 0.00 | 4.62 | Upstream area 18.18 |
| Yingemen Town | 0.00 | 13.56 | |
| Dasuhe Village | 11.01 | 17.99 | Midstream area 91.14 |
| Gounaidian Village | 46.61 | 26.98 | |
| Qingyuan Town | 10.30 | 20.94 | |
| Aojiapu Village | 30.41 | 25.23 | |
| Beisanjia Village | 43.65 | 45.50 | Downstream area 210.91 |
| Nankouqian Town | 51.04 | 53.18 | |
| Hongtoushan Town | 127.23 | 112.23 | |
| Total (104$) | 320.24 | 320.24 |
| Variable | Description and Assignment | Coefficients | Sig. |
|---|---|---|---|
| Age range | Less than 16 years-old = 1, 16–30 years-old = 2, 30–50 years-old = 3, More than 50 years-old = 4 | −6.678 | 0.000 ** |
| Educational level | Primary school = 1, Middle school = 2, High school = 3, College degree and above = 4 | 17.644 | 0.000 ** |
| Income level | Monthly income level: less than $240.83 = 1, $240.83–$481.66 = 2, $481.66–$722.5 = 3, more than $722.5 = 4 | 7.501 | 0.000 ** |
| Environmental awareness | Do you support river ecological compensation? Yes = 1, No = 0 | 0.524 | 0.000 ** |
| Payment method | Donation = 1, Utilities = 2, Participating in voluntary labor = 3, Eco-tax = 4, Environmental lottery = 5 | −1.366 | 0.098 |
| Constant | −13.278 | 0.024 ** |
© 2019 by the authors. Licensee MDPI, Basel, Switzerland. This article is an open access article distributed under the terms and conditions of the Creative Commons Attribution (CC BY) license (http://creativecommons.org/licenses/by/4.0/).
Share and Cite
Jiang, X.; Liu, Y.; Zhao, R. A Framework for Ecological Compensation Assessment: A Case Study in the Upper Hun River Basin, Northeast China. Sustainability 2019, 11, 1205. https://doi.org/10.3390/su11041205
Jiang X, Liu Y, Zhao R. A Framework for Ecological Compensation Assessment: A Case Study in the Upper Hun River Basin, Northeast China. Sustainability. 2019; 11(4):1205. https://doi.org/10.3390/su11041205
Chicago/Turabian StyleJiang, Xin, Yuyu Liu, and Ranhang Zhao. 2019. "A Framework for Ecological Compensation Assessment: A Case Study in the Upper Hun River Basin, Northeast China" Sustainability 11, no. 4: 1205. https://doi.org/10.3390/su11041205
APA StyleJiang, X., Liu, Y., & Zhao, R. (2019). A Framework for Ecological Compensation Assessment: A Case Study in the Upper Hun River Basin, Northeast China. Sustainability, 11(4), 1205. https://doi.org/10.3390/su11041205