Article

Seasonal Net Carbon Exchange in Rotation Crops in the Temperate Climate of Central Lithuania

1
Agriculture Academy, Vytautas Magnus University, Studentų 11, Akademija, LT-53361 Kaunas, Lithuania
2
Lithuanian Institute of Agrarian Economics, LT-03105 Vilnius, Lithuania
*
Author to whom correspondence should be addressed.
Sustainability 2019, 11(7), 1966; https://doi.org/10.3390/su11071966
Submission received: 23 February 2019 / Revised: 21 March 2019 / Accepted: 26 March 2019 / Published: 2 April 2019
(This article belongs to the Special Issue Soft Computing for Sustainability)

Abstract

:
Intelligent agricultural solutions require data on the environmental impacts of agriculture. In order for operationalize decision-making for sustainable agriculture, one needs to establish the corresponding datasets and protocols. Increasing anthropogenic CO2 emissions into the atmosphere force the choice of growing crops aimed at mitigating climate change. For this reason, investigations of seasonal carbon exchange were carried out in 2013–2016 at the Training Farm of the Vytautas Magnus University (former Aleksandras Stulginskis University), Lithuania. This paper compares the carbon exchange rate for different crops, viz., maize, ley, winter wheat, spring rapeseed and barley under conventional farming. This study focuses on the carbon exchange rate. We measure the emitted and absorbed CO2 fluxes by applying the closed chamber method. The biomass measurement and leaf area index (LAI) calculations at different plant growth stages are used to evaluate carbon exchange in different agroecosystems. The differences in photosynthetically assimilated CO2 rates were significantly impacted by the leaf area index (p = 0.04) during the plant vegetation period. The significantly (p = 0.02–0.05) strong correlation (r = 0.6–0.7) exists between soil respiration and LAI. Soil respiration composed only 21% of the agroecosystem carbon exchange. Plant respiration ranged between 0.034 and 3.613 µmol m−2 s−1 during the vegetation period composed of a negligible ratio (mean 16%) of carbon exchange. Generally, respiration emissions were obviously recovered by the gross primary production (GPP) of crops. Therefore, the ecosystems were acting as an atmospheric CO2 sink. Barley accumulated the lowest mean GPP 12.77 µmol m−2 s−1. The highest mean GPP was determined for ley (14.28 µmol m−2 s−1) and maize (15.68 µmol m−2 s−1) due to the biggest LAI and particular bio-characteristics. Due to the highest NEP, the ley (12.66 µmol m−2 s−1) and maize (12.76 µmol m−2 s−1) agroecosystems sank the highest C from the atmosphere and, thus, they might be considered the most sustainable items between crops. Consequently, the appropriate choice of crops and their area in crop rotations may reduce CO2 emissions and their impact on the environment and climate change.

1. Introduction

Croplands represent about 12% of the Earth’s surface [1] and one-third of the land surface in Europe [2]; therefore, it plays a significant role in the generation of anthropogenic emissions. Globally, agriculture accounts for 10–12% of the total anthropogenic emissions of greenhouse gas (GHG) [3], 9.78% in the EU, out of which 4.94% are emissions from the soil [4]. Agriculture produces nearly 21.4% of the total emissions in Lithuania [5]. Soil is an important (and the largest) carbon reservoir, which accumulates about 53% of terrestrial carbon [6]. The main source of carbon is plant biomass (and residues) in the soil [7]. The dissolved soil carbon may be lost not only by leaching but by the uptake of plants and by removal from harvesting as well [8,9].
C exchange is released through photosynthesis assimilating atmospheric CO2 and organism respiration (R) emitting CO2 in the system atmosphere-biosphere. CO2 rates assimilated by the ecosystem are considered gross primary production (GPP) [10]. The net ecosystem production (NEP) is the net C rate accumulated in biomass. NEP is defined as the difference between GPP and ecosystem respiration (R) [11,12]. All rates of C exchange are dependent on the anthropogenic and environmental factors. It is estimated that 89% of the GHG emissions in the agricultural sector could be reduced by reducing CO2 emissions. Therefore, the agroecosystems essentially contribute to the sink of large amounts of carbon from the atmosphere [13]. The ecosystem C exchange is related to the seasonal changes in environmental conditions and plant growth [14,15]. Ambient moisture and temperature directly affect the activity of plant enzymes and, thus, conditioned the photosynthesis intensity and rates of assimilated CO2 [16]. It is accepted that photosynthesis is the initial physiological process that responds to changes in temperature [8]. In addition, photosynthesis is performed by the leaf area (LAI) which is development-depended on growth stages and environment conditions [14,17].
The deterioration of the environmental systems and the unsustainable exploitation of natural resources, both globally and locally, have been assumed such significance that, recently, high-level political meetings aimed at building a low-carbon and resource efficient economy have been undertaken [11,18]. The intelligent agricultural solutions require data on the environmental impacts of agriculture. In order for operationalize decision-making for sustainable agriculture, one needs to establish the corresponding datasets and protocols.
Crop rotation, growth period and water content are the factors that determine C sequestration [10,15], CO2 fluxes and exchange in the system atmosphere-plant-soil [19]. A strong correlation between the CO2 emission temperature and precipitation (r = 0.7) was found during the summer season in organic and conventional agroecosystems [15,20]. As conventional farming systems remain directed toward productivity for greater profits rather than for soil fertility and the maintenance of a sustainable environment, conventional farming has a significant negative impact on the long-term soil productivity and sustainable agroecosystem. The control of the grown yield and carbon sequestration becomes possible if the appropriate farming system, growing technology and crops are chosen [21,22,23]. The relationship between the rates of carbon fluxes and bio-parameters of the plants stand important for the evaluation of the possibility for climate change mitigation and the development of a sustainable agriculture. Evidence of the crop NEP would improve the understanding of the factors and mechanisms that influence carbon emissions and sequestration and, thus, optimally regulate these processes, thereby reducing CO2 emissions and predicting their changes.
The main objective of this study was to assess the potential of atmospheric carbon assimilation and accumulation in biomass during the growth period in conventional farming agroecosystems of ley, winter wheat, maize, barley and spring rapeseed, and to determine the seasonal respiration fluxes and the rates of assimilated carbon. In order to explain carbon exchange, the photosynthesis parameters (crop density, leaf area index, productivity) were investigated at different plant growth stages.

2. Materials and Methods

Measurement object and location. Lithuania is located in the cold temperate zone (5–6) with moderately warm summers and medium cold winters. The average temperature in July is approximately 17 °C, and in winter, it is approximately −5 °C; the interval between the temperatures is approximately 20 °C [24]. Investigations into the seasonal C exchange of conventional farming (CF) ley (L), winter wheat (Triticum aestivum L.) (W), maize (Zea mays L.) (M), spring rapeseed (Brassica napus L.) (R) and barley (Hordeum vulgare) + ley undercrop) (B) were carried out during the growth period in 2013–2016 at the Training Farm of Vytautas Magnus University (former Aleksandras Stulginskis University, 54°52’ N, 23°49’ E), Kaunas district (Table 1). The cropland soil types were Hapli-Epihypogleyic Luvisol, LVg-p-w-ha, or Albi-Epihypogleyic Luvisol, LVg-p-w-ab) [25]. Measurement sites were set up every 50–100 m in linear transects oriented in the N-S direction in the fields, at a distance of 20 to 25 m from the edge to avoid the margin effect. The measurement plots in 6 replications were installed at each site. The ley (50% red clover (Trifolium pratense L.) ‘Start’ and 50% timothy-grass (Phleum pratense) ‘Jumis’) was undersown in the oat ‘KWS Contender’ (170 kg ha−1) and pea (Pisum sativum) ‘Kiblukai’ (50 kg ha−1) mixture on 7 May 2013. A 2-cut system was applied in ley (4 June and 11 August 2014; 2 June and 6 August 2015; 8 June and 4 August 2016).
To evaluate the crop photosynthetic surface, the crop density (un. M−2) and leaf surface area (cm2 m−2) were determined and the leaf area index (LAI, m2 m−2) was calculated in plots of 0.25 m−2 (0.5 m × 0.5 m) in six replications. Fresh plant biomass (FM, g m−2) and dry matter content (DM, g m−2) were determined by the weighing method. Dry matter content was determined by drying plant samples (80 °C thermostat (Tritec, Hannover, Germany).
C exchange investigation. Agroecosystems’ seasonal C exchange was investigated by measuring the rate of gross primary production (GPP, µmol m−2s−1) and respiration emissions of soil and autotrophs (Rs+a, µmol m−2 s−1) in situ. CO2 exchange was measured by applying the closed chamber method [16] using LCpro + System analyser (ADC Bioscientific LTD, UK) with a standard 2.5 × 2.5 cm = 6.25 cm2 chamber area for broadleaved species every 7–10 days between 11:00 and 14:00 with regard to the environmental conditions and plant growth stages (BBCH-scale) [26]. For the measurement of soil respirational emissions, the plastic collar fitted to the soil chamber was used. The plastic collar was put into the soil at a depth of 20 mm until it was sealed. Since then the programming console was connected to the soil respiration chamber.
GPP presents the total amount of CO2 that is fixed by the plant in photosynthesis and was assessed biometrically. The light-saturated photosynthetic rate was measured at the saturating irradiance photosynthetic photon flux density PPFD (1500 μmol m−2 s−1) and an ambient temperature, humidity and CO2 concentration. The carbon exchange of each agroecosystem was evaluated by net ecosystem production (NEP, µmol m−2s−1) [20] which was calculated as follows [27]:
N E P i j = G P P i j R i j s + a
where N E P i j is the net ecosystem production, G P P i j is the gross primary production and R i j s + a for crop i during month j . The values of G P P i j and R i j s + a are calculated as the averages over the six replications of measurements as described above.
Meteorological conditions. Meteorological conditions determine the vegetation of crops, seed germination, plant growth, development, maturity and yield. In the summer season of 2014–2016, plant growth was hindered due to drought periods (Table 2). With the exception of 2015, the rest years stand out by moisture surplus unfavourable for plant growth and aerobic respiration of the soil.
Statistical analysis. For C exchange evaluation in 2013–2016, the standard deviation of mean values of bio-parameters (LAI, FM, DM), Ra+s, GPP, NPP were determined with standard error (mean ± SE) for conventional farming ley, winter wheat, maize, spring rapeseed and barley. The correlation among respiration emission, GPP, NEP and environmental conditions, biometric parameters was determined by applying correlation coefficient r.

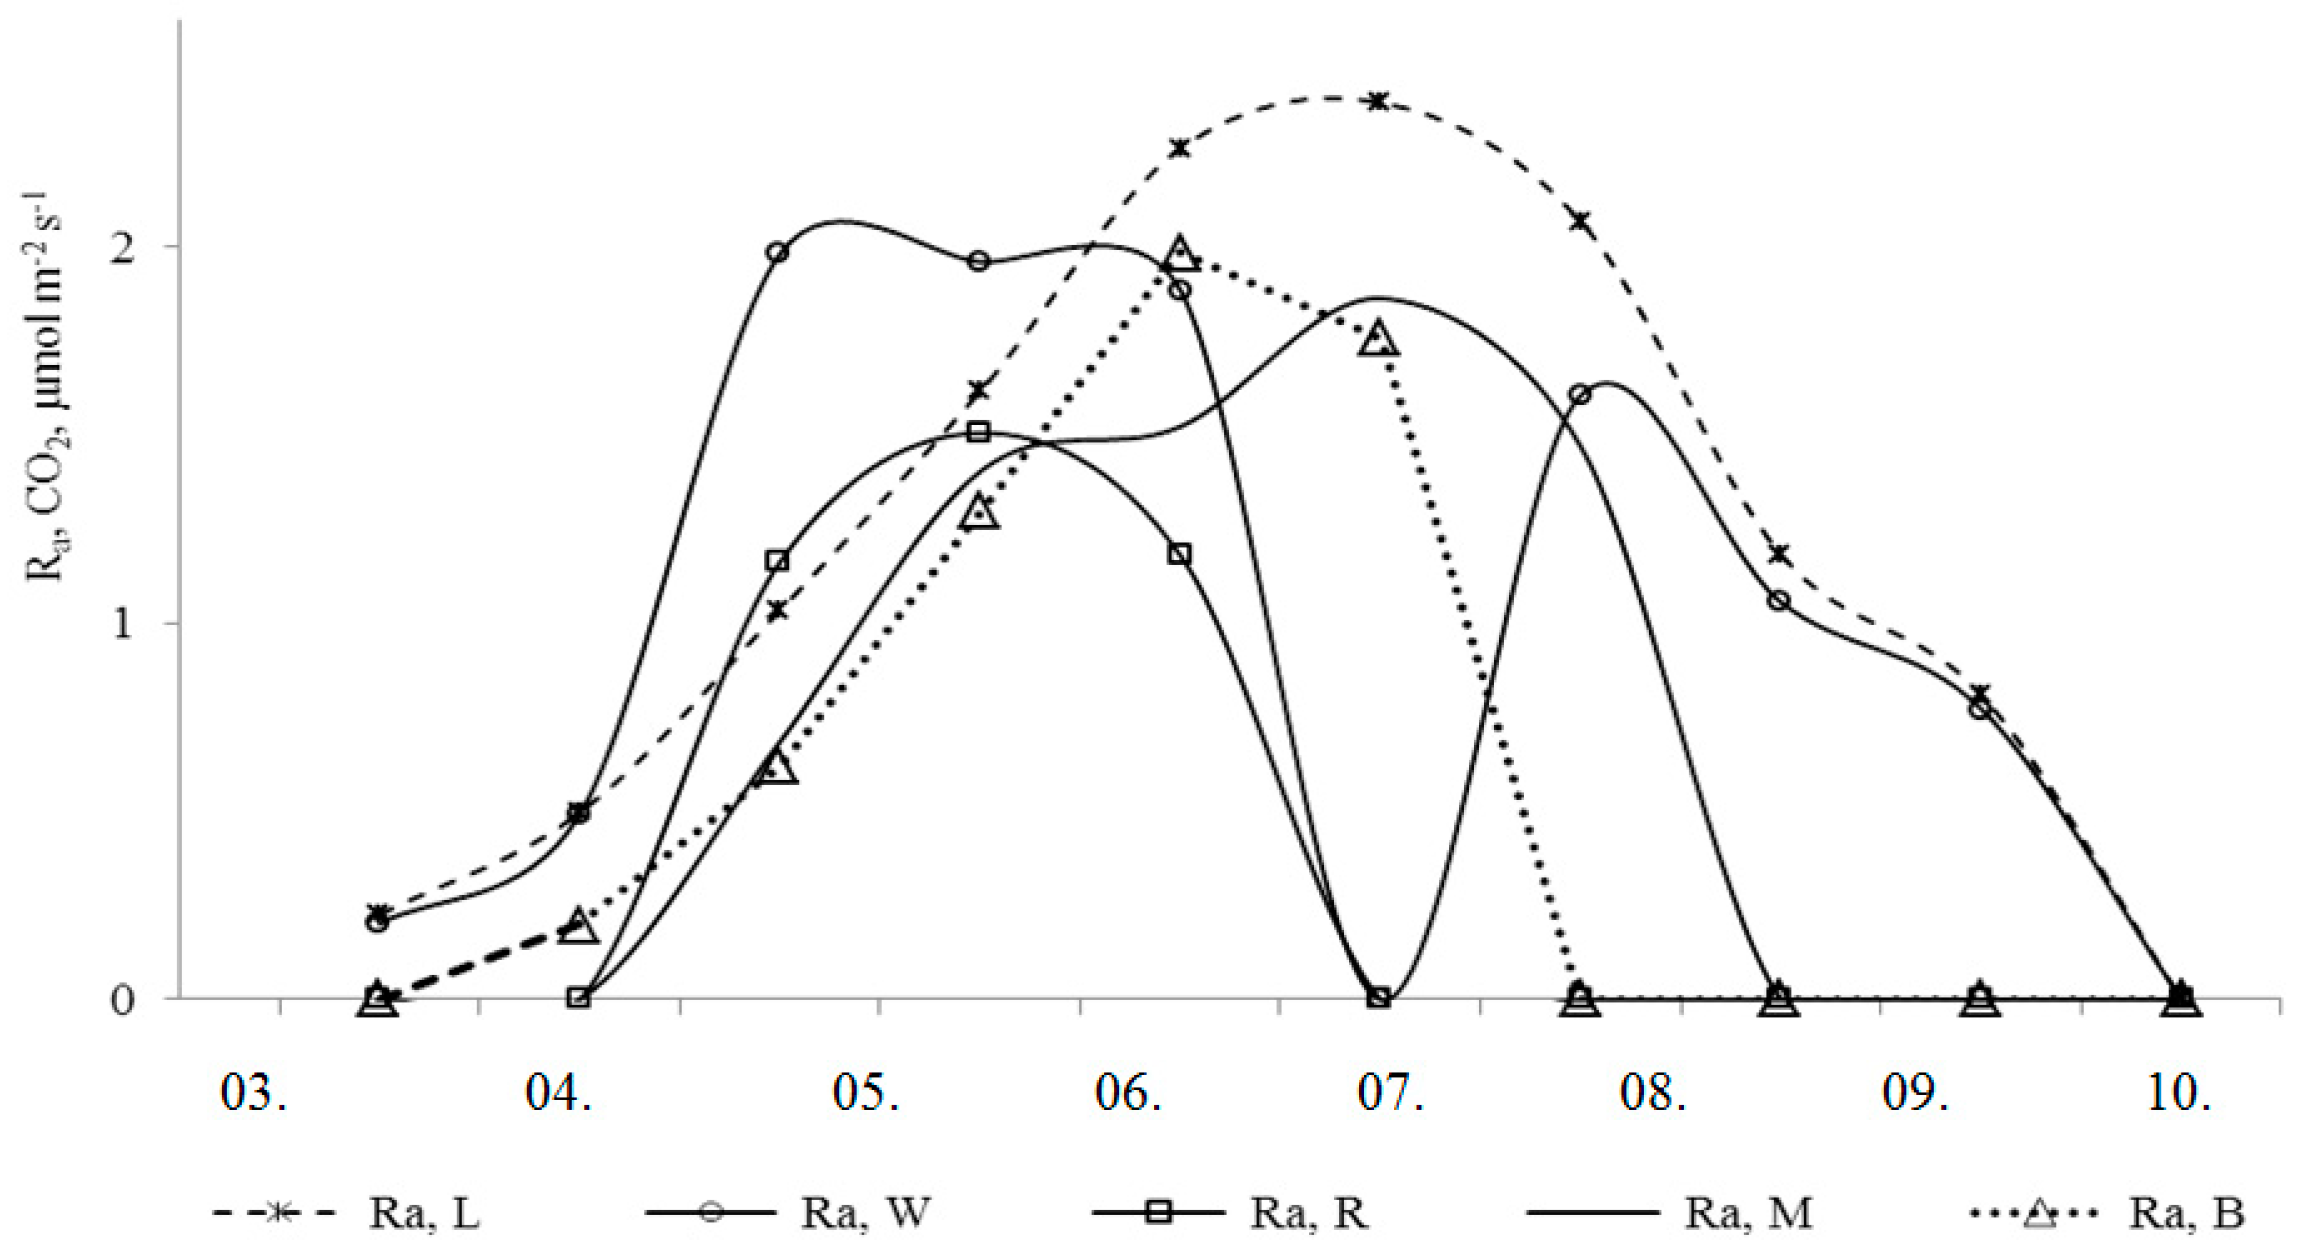
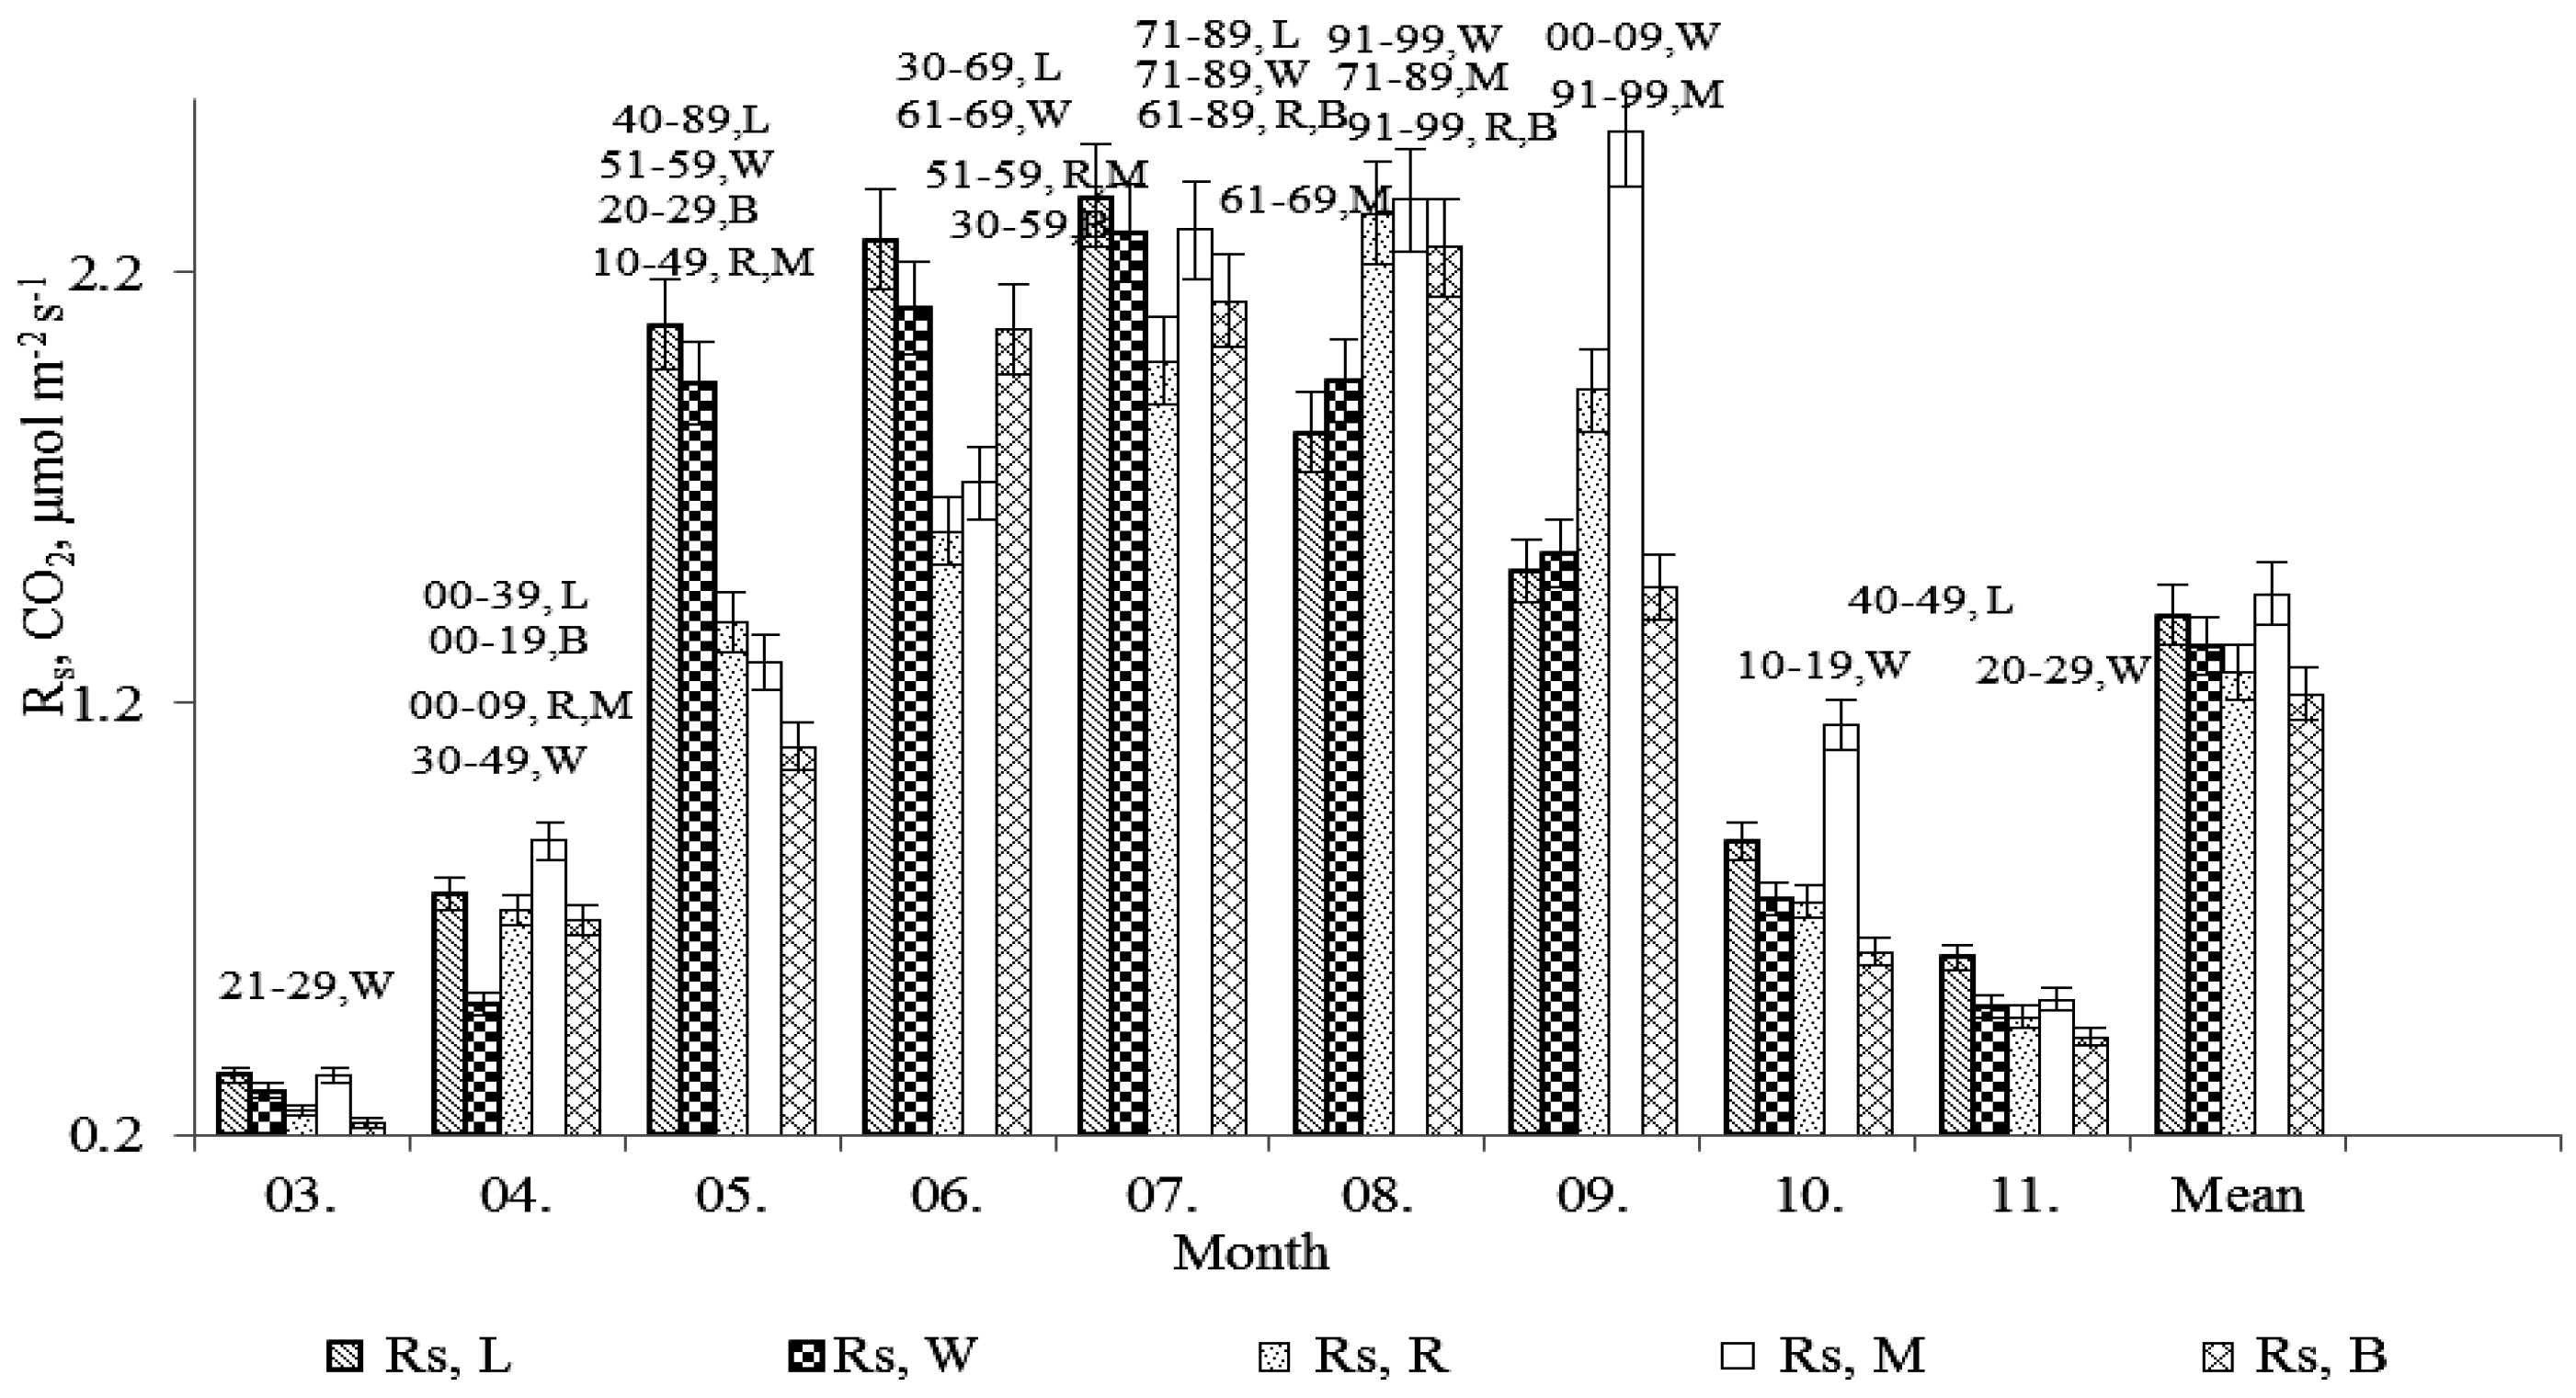
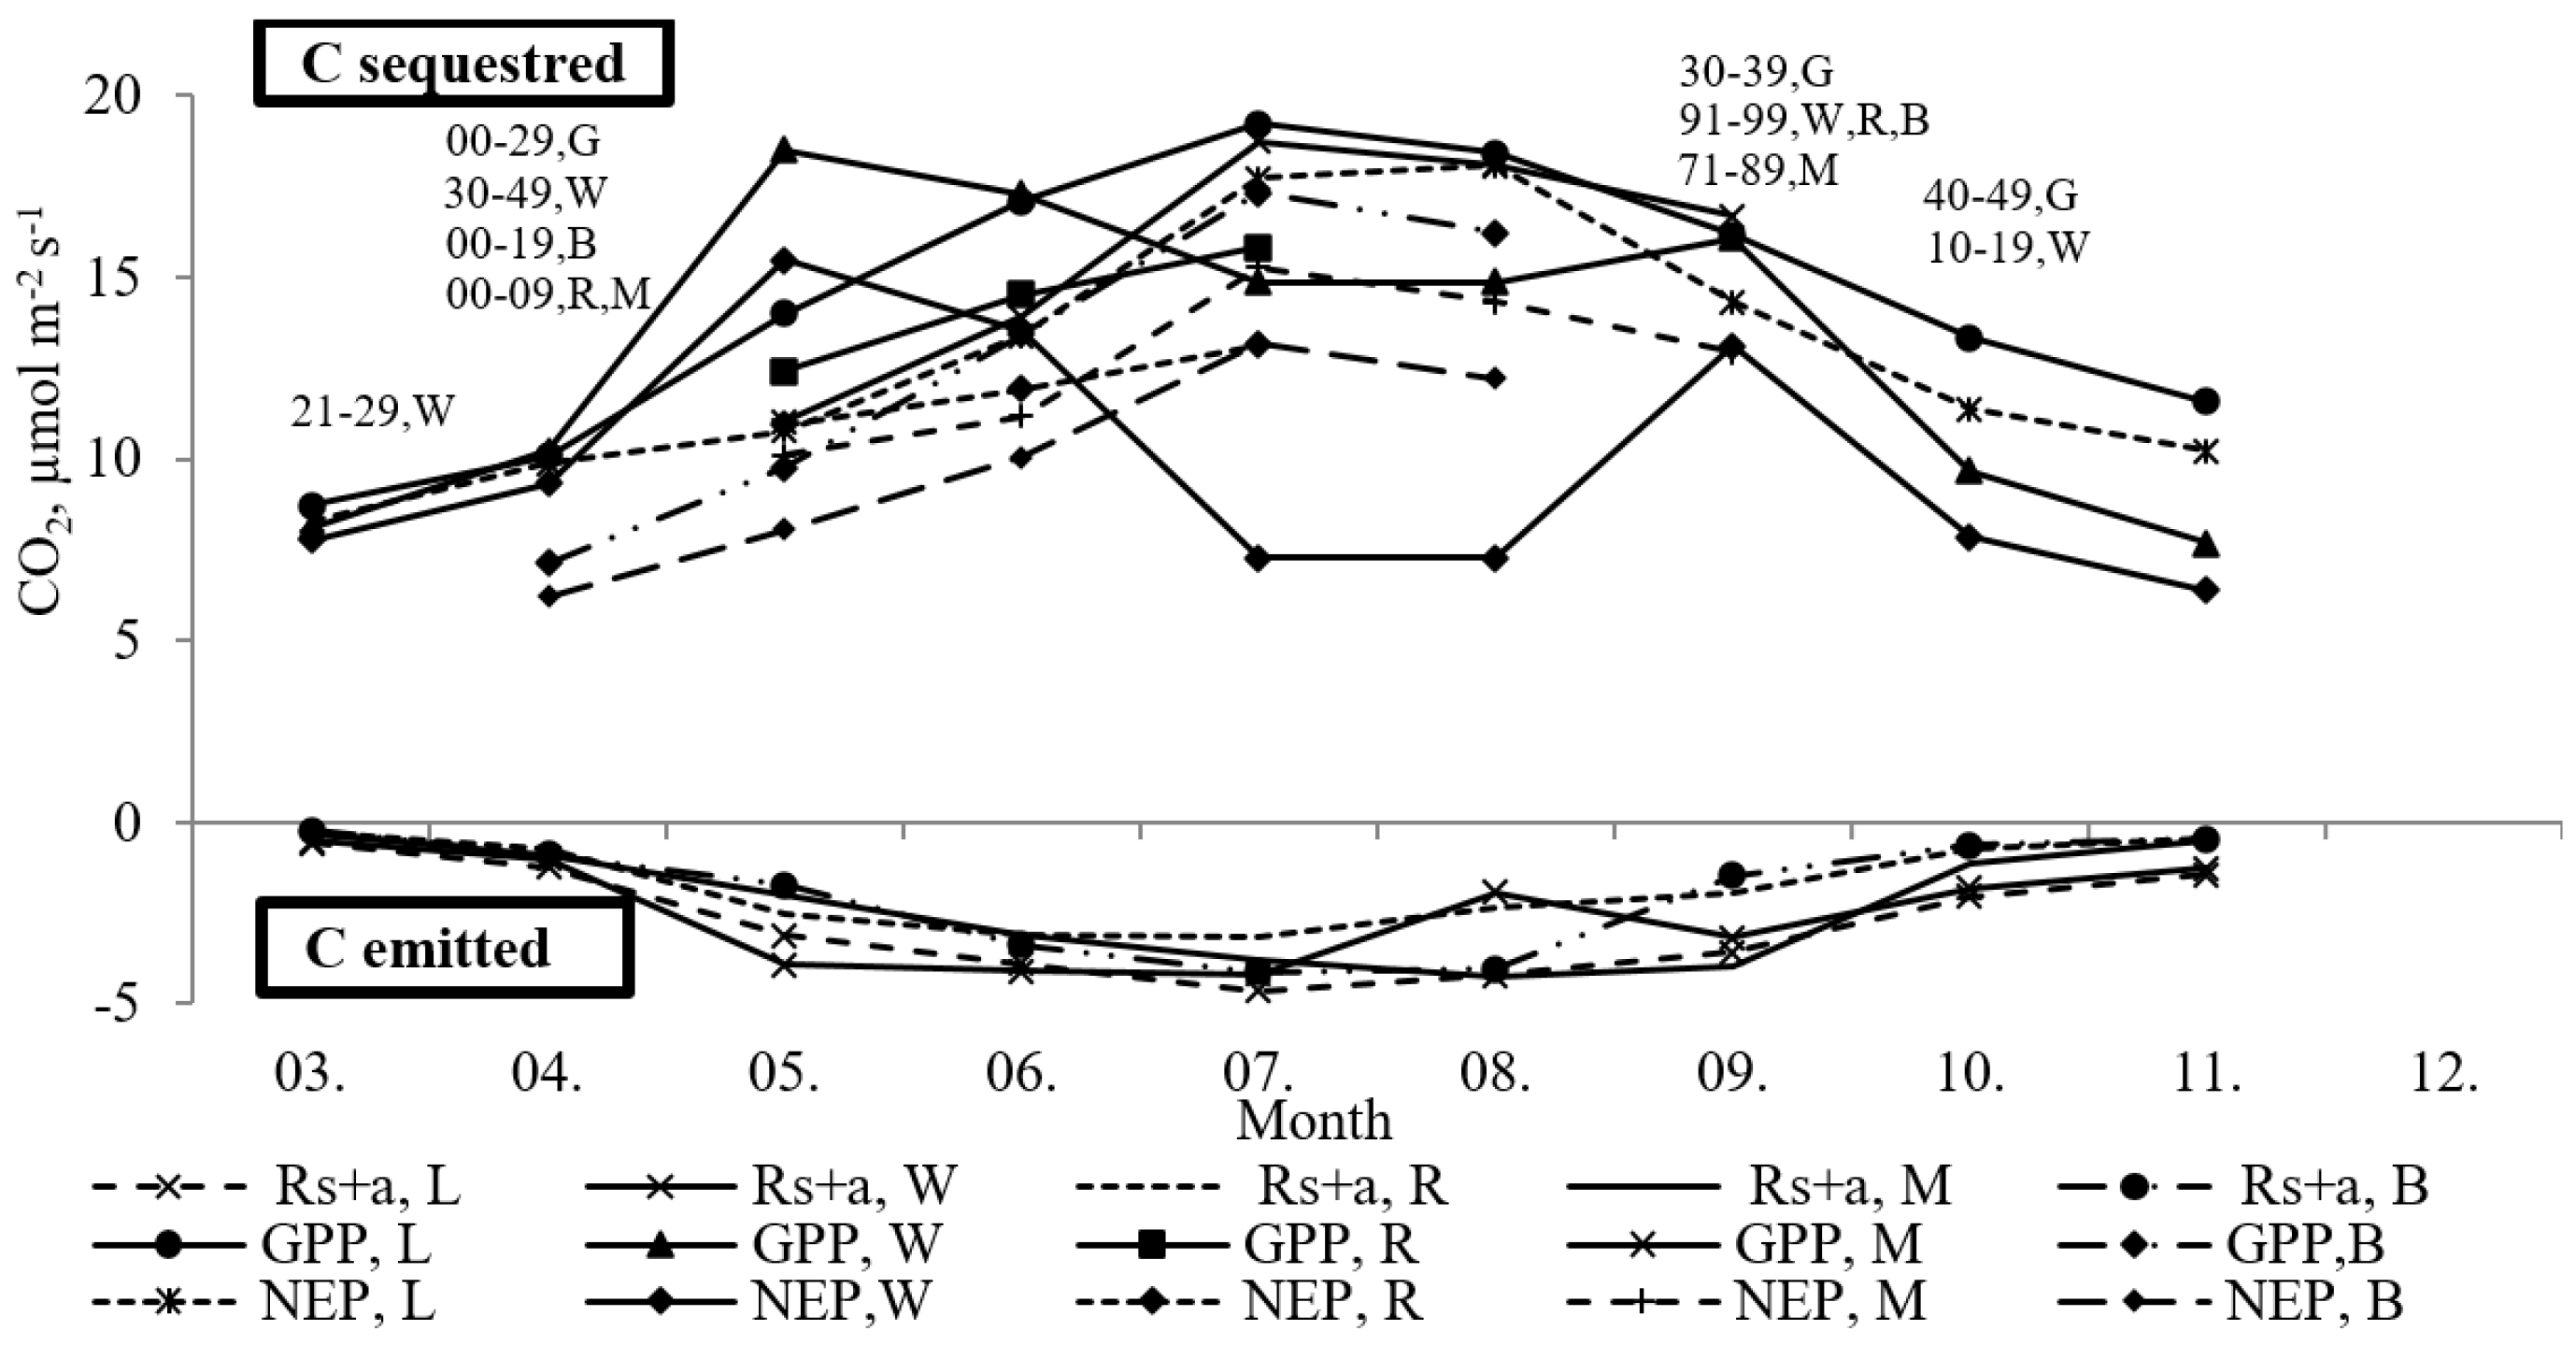
3. Results and Discussion

The variations of C exchange and plant growth are closely related with the meteorological conditions o the f growth period and soil chemical properties. Average air temperatures ranged between 2.7 and 19.8 °C, depending on the season and month (Table 1). A strong positive correlation (r = 0.6 and r = 0.8; p = 0.02, respectively) between respiration (Ra and Rs) and air temperature in agroecosystems was found. The vegetation period plant respiration (Ra) varied from 0.202 in March to 2.384 µmol m−2 s−1 in August (Figure 1). Soil respiration (Rs) ranged between 0.225 and 2.526 µmol m−2s−1 and composed an insignificant part in the total carbon exchange (Figure 2); however, it was 18% higher than the plant respiration Ra. The maximum mean Rs (1.453 and 1.405 µmol m−2s−1) and Ra (1.389 and 1.345 µmol m−2s−1) were determined in maize and ley agroecosystems, respectively.
The maximum respiration emissions were 4.637µmol m−2 s−1 of ley in July and 4.232 µmol m−2s−1 of maize in August at the maturity stage (71–89 BBCH). A negative correlation was determined between precipitation and Ra (r = −0.6) or Rs (r = −0.7, p = 0.003). The related descriptions [20,27,28] revealed respiration and plant physiological responses to abiotic stress, such as drought or heat. Though the climate change leads to soil moisture loss [12,28], soil moisture surplus in autumn and spring determined unfavourable anaerobic conditions for soil biota and thus decreased the soil respiration Rs in our temperate climate. However, the summer precipitation deficiency reduced the soil respiration Rs rates even though the air temperature Ta increased.
The plant growth and their bio-parameters vary seasonally, dependently on the meteorological and agrotechnical conditions. The crop density exposed a significant parameter in light energy transfer, forming the initial carbon fixation and exchange [11,21]. The mean crop density formed the optimal and ranged from 12 un. m−2 in maize and rapeseed to 106 un. m−2 in the ley, wheat and barley agroecosystems. The mean LAI values (which forms carbon assimilation surface) were 0.663, 0.798, 1.115, 0.883, 0.478 m2 m−2 with mean biomass (FM) values of 75.06, 71.17, 303.2, 217.6, 62.4 g m−2 for the ley, wheat, maize, rapeseed and barley agroecosystems, respectively. According to previous outcomes [29], the ecosystem LAI depends on the environmental conditions that determine the seasonal intensity of the physiological processes at different growth stages. The highest rates of the maize LAI exhibited the most intensive growth and C assimilation, thus exceeded 41% in ley, 28% in wheat, 21% in rapeseed and 57% in barley LAI. Similar LAI tendencies based on long-term research was observed by former researchers as well [5,15]. The recorded alterations of the crops’ bio-parameters might be caused by the different biological characteristics, morphological structures and physiologies of the plants. Maize belongs to the C4 photosynthesis type plant [30], which has a different leaf anatomic structure, chloroplast size and photosynthesis intensity that are higher than C3 type crops, i.e., ley, wheat, rapeseed and barley [27].
Differences in crop density, LAI and biomass determined the photosynthetic surface and volume of the assimilated CO2 (GPP and NEP) in agroecosystems. Hence, ley and maize assimilated and accumulated the highest CO2 rate, i.e., 19.22 µmol m−2s−1 and 18.09 µmol m−2s−1 in July and August respectively, when the formation of LAI and biomass exceeded the maximum (Figure 3).
The strong correlation between Ta and GPP (r = 0.7, p = 0.001) confirmed that the seasonal temperature fluctuations resulted in the average seasonal GPP alteration in the maize, ley, wheat, rapeseed and barley agroecosystems. Therefore, the highest rates of photosynthetically assimilated CO2, i.e., 19.22 µmol m−2s−1 in ley, 18.7 µmol m−2s−1 in maize and 17.31 µmol m−2s−1 in the barley agroecosystems were determined in July when the mean temperature Ta (16.1–18.7 °C) was recorded to be the highest. Seasonal changes in the rates of assimilated CO2 (GPP) can be attributed to the seasonal variation of FM, DM and LAI at different growth stages. This was confirmed by the strong correlation between GPP and LAI (r = 0.8) in the assessed agroecosystems. Greater mean GPP rates were recorded in maize (15.68 µmol m−2s−1) and ley (14.28 µmol m−2s−1) than those in the wheat (12.80 µmol m−2s−1), rapeseed (14.25 µmol m−2s−1) and barley (12.77 µmol m−2s−1) agroecosystems due to the different bio-parameters and growth periods. Noteworthy is that the growth period of wheat, rapeseed and barley was significantly shorter earlier in the maturity stage than that of maize and ley with long-lasting growth.
Even though the rates of the assimilated carbon (GPP) varied during the vegetation period and depended on biotic and abiotic parameters, the total amount of carbon sink by plants (NEP) exceeded the total respiration rate several times, thus, the agroecosystems significantly reduced the atmospheric CO2 concentration (Figure 3). For the evaluation of the crops contribution to climate change, it is important to determine the net CO2 exchange estimated by the NEP value in the research. NEP varied correspondingly to the environmental conditions and bio-parameters, particularly to LAI (r = 0.8) during the growth period. Such responses were reported by other researchers [8,31,32]. The seasonal temperate climate [33,34] principally conditioned the seasonal character of CO2 fluxes in the investigated agroecosystems. The mean NEP values responded to the seasonal climate, thus increasing from 6.22 µmol m−2s−1 to 10.09 µmol m−2s−1 in spring, and from 11.91 µmol m−2s−1 to 18.06 µmol m−2s−1 in the summer season. Nonetheless, NEP decreased from 14.24 to 6.38 µmol m−2s−1 due to the declining meteorological conditions in the autumn season. Among the investigated agroecosystems, M (12.76 µmol m−2s−1) and L (12.66 µmol m−2s−1) sank and assimilated the highest amount of atmospheric CO2, which was accumulated in the biomass (Figure 3). Furthermore, a great part of the assimilated C accumulated in the biomass and was removed with harvesting, whereas the rest of the C accumulated in the soil together with the remaining plant residues consequently increased the organic matter content. Among the agroecosystems analysed, maize and ley exhibited the highest CO2 assimilation capacity. Therefore, they may significantly contribute to the increase in the sustainability of agriculture due to the decrease in the CO2 concentration in the atmosphere and consequent climate change mitigation.
The CO2 exchange data of the investigated agroecosystems permit to affirm that the environmental sustainability objectives may be achieved by properly adjusting the cultivated plant species and areas. The data of this and further studies are significant for the optimisation of the shift and areas of agroecosystems in crop rotations in order to develop appropriate mitigation strategies for climate change.

4. Conclusions

The agroecosystem soil respiration was higher by 18% than plant respiration. The total respiratory CO2 emissions were higher in the maize and ley agroecosystems that in the winter wheat, rapeseed and barley agroecosystems. The alteration of the respiration CO2 emissions strongly depended on the meteorological conditions, i.e., air temperature (rs = 0.6 and ra = 0.8) and precipitation (rs = −0.6 and ra = −0.7).
Differences of the CO2 exchange throughout photosynthesis and respiration among the investigated agroecosystems strongly correlated with the leaf area index (r = 0.8). The investigated agroecosystems sank and assimilated greater rates of atmospheric CO2 than they emitted during respiration. Crop bio-parameters, especially density and LAI, determined the photosynthetic surface and rates of assimilated CO2 (GPP and NEP) in the agroecosystems. Among the agroecosystems analysed, maize and ley exhibited the highest CO2 assimilation capacity. Therefore, they may significantly contribute to the increase in the sustainability of agriculture due to the decrease in CO2 concentration in the atmosphere and the consequent climate change mitigation. The results also revealed that the appropriate choice of plant species, as well as their area in crop rotations, may reduce CO2 emissions, their impact on the environment and climate change.

Author Contributions

Investigation, O.M.; Writing—original draft, L.B. and O.M.; Writing—review & editing, T.B. and D.S.

Funding

This research is funded by the European Social Fund according to the activity ‘Improvement of researchers’ qualification by implementing world-class R&D projects’ of Measure No. 09.3.3-LMT-K-712.

Conflicts of Interest

The authors declare no conflict of interest.

References

  1. Smith, P.; Martino, D.; Ciais, Z.; Gwary, D.; Janzen, H.; Kumar, P. Policy and technological constraints to implementation of greenhouse gas mitigation options in agriculture. Agric. Ecosyst. Environ. 2007, 118, 6–28. [Google Scholar] [CrossRef]
  2. FAO. FAO Statistical Databases; Food and Agriculture Organization of the United Nations: Rome, Italy, 2003; Available online: http://faostat.fao.org (accessed on 15 December 2018).
  3. Schlesinger, W.H.; Bernhardt, E.S. Biogeochemistry: An Analysis of Global Change, 3rd ed.; Academic Press Elsevier: New York, NY, USA, 2013. [Google Scholar]
  4. European Environment Agency (EEA). The European Environment—State and Outlook 2010: Synthesis; European Environment Agency: Copenhagen, Denmark, 2010; p. 228. [Google Scholar]
  5. LR Ministry of Environment, National Policy of Climate Change Management. LR Ministry of Environment, Vilnius, 2012, p. 80. Available online: http://www.am.lt (accessed on 10 December 2018).
  6. Chapin, F.S.; Matson, P.A.; Mooney, H.A. Terrestrial Nutrient Cycling, in Principles of Terrestrial Ecosystem Ecology; Chapin, F.S., Ed.; Springer: New York, NY, USA, 2002; p. 398. [Google Scholar]
  7. Abiven, S.; Menassero, S.; Chenu, C. The effect of organic inputs over time on soil aggregate stability: A literature analysis. Soil Biol. Biochem. 2009, 41, 1–12. [Google Scholar] [CrossRef]
  8. Randerson, J.T.; Chapin, F.S.; Harden, J.; Neff, J.C.; Harmon, M.E. Net ecosystem production: A comprehensive measure of net carbon accumulation by ecosystems. Ecol. Appl. 2002, 12, 937–947. [Google Scholar] [CrossRef]
  9. Zhao, Q.R.; Chen, Q.H.; Xiao, Y.T.; Tian, G.Q.; Chu, X.L.; Liu, Q.M. Saving forests through development? Fuelwood consumption and the energy-ladder hypothesis in rural Southern China. Transform. Bus. Econ. 2017, 16, 199–219. [Google Scholar]
  10. Heinemeyer, A.; McNamara, N. Comparing the closed static versus the closed dynamic chamber flux methodology: Implications for soil respiration studies. Plant Soil 2011, 346, 145–151. [Google Scholar] [CrossRef]
  11. Toma, P.; Massari, S.; Miglietta, P.P. Natural resource use efficiency and economic productivity. In Life Cycle Approaches to Sustainable Regional Development; Massari, S., Ed.; Routledge, Taylor and Francis Group: Abingdon, UK, 2016; pp. 143–148. [Google Scholar]
  12. Woodwell, G.M.; Whittaker, R.H. Primary production in terrestrial communities. Am. Zool. 1968, 8, 19–30. [Google Scholar] [CrossRef]
  13. Jastrow, J.D.; Boulton, T.W.; Miller, R.M. Carbon dynamics of aggregate-associated organic matter estimated by carbon-13 natural abundance. Soil Sci. Soc. 2007, 60, 801–807. [Google Scholar] [CrossRef]
  14. Gitelson, A.A.; Vina, A.; Verma, S.B.; Rundquist, D.C.; Arkebauer, T.J.; Keydan, G.; Leavitt, B.; Ciganda, V.; Burba, G.G.; Suyker, A.E.; et al. Relationship between gross primary production and chlorophyll content in crops: Implications for the synoptic monitoring of vegetation productivity. J. Geophys. Res. 2006, 111. [Google Scholar] [CrossRef]
  15. Baležentienė, L.; Kusta, A. Reducing greenhouse gas emissions in grassland ecosystems of the Central Lithuania: Multi-criteria evaluation on a basis of the ARAS Method. Sci. World J. 2012, 3, 1–11. [Google Scholar] [CrossRef]
  16. Davidson, E.A.; Savage, K.; Verchot, L.V.; Navarro, R. Minimizing artifacts and biases in chamber-based measurements of soil respiration. Agric. For. Meteorol. 2002, 113, 21–37. [Google Scholar] [CrossRef]
  17. Liatukas, Ž.; Ronis, A.; Ruzgas, V. Leaf area index suitability for screening of winter wheat (Triticum aestivum L.) selection of breeding lines. Zemdirb.-Agric. 2009, 96, 3–15. [Google Scholar]
  18. Song, M.L.; Peng, J.; Wang, J.L.; Dong, L. Better resource management: An improved resource and environmental efficiency evaluation approach that considers undesirable outputs. Resour. Conserv. Recycl. 2018, 128, 197–205. [Google Scholar] [CrossRef]
  19. Aertsens, J.; de Nocker, L.; Gobin, A. Valuing the carbon sequestration potential for European agriculture. Land Use Policy 2013, 31, 584–594. [Google Scholar] [CrossRef]
  20. Ali, M.K.; Ahmad, W.; Malhi, S.S.; Atta, B.M.; Zia, M.H.; Ghafoor, A. Potential of carbon dioxide biosequestration of saline-sodic soils during amelioration under rice-wheat land use. Commun. Soil Sci. Plant Anal. 2013, 44, 2625–2635. [Google Scholar] [CrossRef]
  21. Janssens, I.A.; Freibauer, A.; Ciais, P.; Smith, P.; Nabuurs, G.J.; Folberth, G.; Schlamadinger, B.; Hutjes, R.W.A.; Ceulemans, R.; Schulze, E.-D.; et al. Europe’s terrestrial biosphere absorbs 7 to 12% of European anthropogenic CO2 emissions. Science 2003, 300, 1538–1542. [Google Scholar] [CrossRef]
  22. Li, J.; Zhao, B.; Li, X.; Jiang, R.B.; So, H.B. Effects of long-term combined application of organic and mineral fertilizers on microbial biomass, soil enzyme activities and soil fertility. Agric. Sci. China 2008, 7, 336–343. [Google Scholar] [CrossRef]
  23. Wood, S.; Sebastian, K.; Scherr, S.J. Pilot Analysis of Global Ecosystems; International Food Policy Research Institute and World Resources Institute: Washington, DC, USA, 2000; p. 125. [Google Scholar]
  24. Peel, M.C.; Finlayson, B.L.; McMahon, T.A. Updated world map of the Koppen-Geiger climate classification. Hydrol. Earth Syst. Sci. 2007, 11, 1633–1644. [Google Scholar] [CrossRef]
  25. FAO. World Reference Base for Soil Resources 2014; Update 2015; Food and Agriculture Organization of the United Nations: Rome, Italy, 2015. [Google Scholar]
  26. Meier, U. Growth Stages of Mono- and Dicotyledonous Plants: BBCH Monograph; Federal Biological Research Centre for Agriculture and Forestry: Berlin/Braunschweig, Germany, 2001; p. 158. [Google Scholar]
  27. Amthor, J.S.; Baldocchi, D.D. Terrestrial higher plant respiration and net primary production. In Terrestrial Global Productivity; Roy, J., Saugier, B., Mooney, H.A., Eds.; Academic Press: San Diego, CA, USA, 2001; p. 573. [Google Scholar]
  28. Ruiz-Vera, U.M.; Siebers, M.; Gray, S.B.; Drag, D.W.; Rosenthal, D.M.; Kimball, B.A.; Ort, D.R.; Bernacchi, C.J. Global warming can negate the expected CO2 stimulation in photosynthesis and productivity for soybean grown in the Midwestern United States. Plant Physiol. 2013, 162, 410–423. [Google Scholar] [CrossRef]
  29. Haboudane, D.; Miller, J.R.; Pattey, E.; Zarco-Tejada, P.J.; Strachan, I. Hyperspectral vegetation indices and novel algorithms for predicting green LAI of crop canopies. Modeling and validation in the context of precision agriculture. Remote. Sens. Environ. 2004, 90, 337–352. [Google Scholar] [CrossRef]
  30. Berry, J.A.; Bjorkman, O. Photosynthetic response and adaptation to temperature in higher plants. Annu. Rev. Plant Physiol. 1980, 31, 491–543. [Google Scholar] [CrossRef]
  31. Rochette, P.; Desjardins, R.L.; Pattey, E.; Lessard, R. Crop net carbon dioxide exchange rate and radiation use efficiency in soybean. Agron. J. 1995, 87, 22–28. [Google Scholar] [CrossRef]
  32. Ciais, P.; Gervois, S.; Vuichard, N.; Piao, S.L.; Viovy, N. Effects of land use change and management on the European cropland carbon balance. Glob. Chang. Biol. 2011, 17, 320–338. [Google Scholar] [CrossRef]
  33. Leith, H.; Whittaker, R.H. Primary Productivity of the Biosphere; Springer: New York, NY, USA, 2008; p. 215. [Google Scholar]
  34. Lehuger, S.; Gabrielle, B.; Cellier, P.; Loubet, B.; Roche, R.; Béziat, P.; Ceschia, E.; Wattenbach, M. Predicting the net carbon exchanges of crop rotations in Europe with an agroecosystem model. Agric. Ecosyst. Environ. 2011, 139, 363–383. [Google Scholar] [CrossRef]
Figure 1. The variation of the plant respiration (Ra) in ley (L), winter wheat (W), spring rapeseed (R), maize (M) and barley (B) agroecosystems during the growing period. (Mean ± SE, p < 0.05).
Sustainability 11 01966 g001
Figure 2. The variation of the soil respiration (Rs) in ley (L), winter wheat (W), spring rapeseed (R), maize (M) and barley (B) agroecosystems during the growing period. Mean ± SE, p < 0.05). The numbers above indicate the plant growth stages (BBCH-scale).
Sustainability 11 01966 g002
Figure 3. Carbon exchange in agroecosystems of conventional farming at different growth stages (p < 0.05). C budget was expressed by mean C sequestered—carbon net ecosystem production (NEP, µmol m−2s−1), and C emitted—total respiration (R, µmol m−2s−1) during months of vegetation period. Agroecosystems: L—ley, W-winter wheat, R—spring rapeseed, M—maize and B—barley. The numbers above indicate plant growth stages (BBCH-scale).
Sustainability 11 01966 g003
Table 1. The agroecosystem parameters.
AgroecosystemArea, haCrop Fertilising
Ley (L)22.86Ammonium nitrate, 150 kg ha−1 (N 51 kg ha−1);
in 2nd yr. autumn—manure 50 t ha−1
Wheat (W)13.7NPK 8-20-30, 200 kg ha−1
Ammonium nitrate, 140 kg ha−1 (N 48 kg ha−1)
Rapeseed (R)47.59Ammonium sulphate, 300 kg ha−1 (N 63 kg ha−1)
Ammonium nitrate 100 kg ha−1 (N 34 kg ha−1)
Maize (M)46.68NPK 8-20-30. 280 kg ha−1
Ammonium sulphate, 300 kg ha−1 (N 63 kg ha−1)
Ammonium nitrate, 170 kg ha−1 (N 58 kg ha−1)
Barley (B)14.51NPK 8-20-30, 200 kg ha−1
Ammonium nitrate, 160 kg ha−1 (N 54 kg ha−1)
Ammonium nitrate, 120 kg ha−1 (N 41 kg ha−1)
Crop rotationLey 1-yr. + Ley 2-yr. + winter wheat + maize + spring rapeseed + barley with ley undercrop
Table 2. The hydrothermal coefficients (HTK) of 2013–2016.
Year/Month030405060708091011Mean
2013 2.811.624.152.86
20141.830.782.031.130.822.021.981.614.151.81
20153.212.151.300.351.340.111.321.963.461.68
20162.941.850.771.622.932.180.62.69 1.94

