Article

Effects of Grazing Exclusion on Biomass Growth and Species Diversity among Various Grassland Types of the Tibetan Plateau

1
Key Laboratory of Land Surface Pattern and Simulation, Institute of Geographical Sciences and Natural Resources Research, Chinese Academy of Sciences, Beijing 100101, China
2
College of Resources and Environment, University of Chinese Academy of Sciences, Beijing 100049, China
*
Author to whom correspondence should be addressed.
Sustainability 2019, 11(6), 1705; https://doi.org/10.3390/su11061705
Submission received: 1 February 2019 / Revised: 25 February 2019 / Accepted: 17 March 2019 / Published: 21 March 2019
(This article belongs to the Section Sustainable Agriculture)

Abstract

:
Livestock grazing is an important determinant of species diversity and plant growth. Overgrazing is identified as one of the most important disturbances resulting in grassland degradation. Although many restoration practices have been implemented, grazing exclusion is one of the most effective methods to restore degraded grasslands. We explored the impact of five years of grazing exclusion on plant growth and species diversity in four types of grasslands: temperate steppe (TS), swamp meadow (SM), alpine steppe (AS), and alpine meadow (AM). Our results showed that grazing exclusion increased plant height, coverage, biomass, and species diversity in all four grasslands. The aboveground biomass in AM (180.8%), TS (117.3%), and SW (105.9%) increased significantly more than AS (10.1%). Grazing exclusion in AM had the greatest effect on proportion of palatable species, and the increase in palatable species in AM was higher than that of the other grassland types significantly. Species diversity increased significantly within the enclosure in SM (23.9%) and AM (20.8%). Our results indicate that grazing exclusion is an effective management strategy to restore degraded grasslands and it works best in alpine meadow. This study contributes to the growing theoretical basis for grassland management strategies and has a significant effect on sustainable development for grassland resources and pastoral areas.

1. Introduction

Grazing, as one of the main land uses of natural grasslands, affects the species composition of communities, vegetation characteristics, and plant biomass [1,2]. Previous studies have demonstrated the effects of grazing intensities and management systems on nutritive value of herbage, forage quality, and biodiversity [3,4]. Both plant productivity and species diversity will increase under appropriate grazing intensity [5]. However, overgrazing is considered to be the main cause of natural grassland degradation [6]. Parts of grassland ecosystems have degenerated and largely disappeared [7], and the most effective method to improve the ecological conditions in grasslands is to restore the natural vegetation [8]. Therefore, studying the effects of restoration practices is important for sustainably developing plant recovery and management strategies.
Grazing exclusion (GE) is considered as one of the most effective approaches for restoration of degraded grasslands [9]. Grazing reduces the aboveground biomass and vegetation cover, but both quickly recover after implementation of GE. The response of belowground biomass is more complex, and soil generally shows a slower response than plants [10,11]. A comparison of the impact of four typical restoration practices—GE, small watershed conservation, oversowing, and basic ranch—found that grazing exclusion was the most effective way to balance the maintenance of species diversity and plant growth [12]. Many previous studies have focused on species diversity and richness of abandoned croplands after short-term grazing exclusion in China, while only few have focused on natural grasslands [13,14]. Grassland restoration mainly focuses on a few key components, including, vegetation structure and composition, species diversity, biomass, and soil [15].
The Tibetan Plateau is a vital ecoregion of planet Earth, and grasslands cover a majority of it [16]. Except for the areas used for animal husbandry production, the Tibetan Plateau grasslands have important ecosystem service functions, such as maintaining biodiversity, carbon storage, and soil and water conservation [17]. The Tibetan Plateau, as one of the primary pastoral production bases in China, has been primarily managed for livestock husbandry. However, overgrazing and the rapidly changing climate have led to extensive grassland degradation [18,19]. In recent years, up to 50% of the Tibetan Plateau grasslands have become degraded [20]. Policy-makers are understandably worried about overgrazing and its consequences, thus the “Grazing for Green” Program has been initiated; including the “Return Grazing Land to Grassland” program, which uses enclosure to prevent grazing and has been implemented in many parts of the Tibetan Plateau. In support of these programs, studies of the ecological effects of GE are important to update knowledge for maintaining sustainable grassland management on the Tibetan Plateau.
A meta-analysis demonstrated that short-term GE showed the most significant increase in species richness while this practice could cease after ~6–10 years [21]. Enforcing a short-term grazing exclusion is important and essential for restoring degraded grassland [22,23], accordingly, we ask what type of grassland is the most affected by grazing exclusion restoration practices? In this study, we have examined the impact of grazing exclusion for five years on plant growth and species diversity in different grasslands of the Tibetan Plateau. The major objectives of this study were (i) to evaluate if grazing exclusion effectively restored plant growth and consistently promoted species diversity and (ii) to compare the effect of GE in different grassland types. We hypothesized that grazing exclusion will have different effects in different grassland types.

2. Materials and Methods

2.1. Study Sites and Experiment Design

The Three-River Headwater (TRH) region, as an important part of Tibetan Plateau, is well-known as the headwaters of the Yangtze River, Yellow River, and the Lantsang River. This study was conducted in a temperate steppe (TS) (35°39′ N, 100°21′ E), a swamp meadow (SM) (33°12′ N, 96°37′ E), an alpine steppe (AS) (35°06′ N, 97°58′ E), and an alpine meadow (AM) (32°50′ N, 96°57′ E) site in the TRH region of the Tibetan Plateau, China (Table A1). At each sampling site, we selected six biomass survey plots and 20 random sampling frames from each of the four grassland sites, and treated them with grazing exclusion and grazing in parallel (Figure A1). Sampling frames (1 m × 1 m) were used to measure species composition and frequency. Biomass survey plots (0.5 m × 0.5 m) were set to measure the community structure and biomass of each species. For the grazing exclusion treatment we fenced paddocks in order to prevent livestock grazing, while this practice was applied for five years. Therefore, we examined the effects of grazing exclusion in our experiment, TS, SM, AS, and AM sites with grazing were set as the control and at these sites within the fenced plots were set as the grazing exclusion treatment. The control sites belong to winter pasture, in which livestock graze the all aboveground part in the winter. The intensity of grazing is consistent.

2.2. Data Sampling and Measurements

The field survey was undertaken in 2018 during August, which is the period of maximum annual biomass. The landscape, soil texture, and landform of the community were recorded, while GPS was used to place the coordinates and elevation of the survey sites.
Frequency counts were made using a 1-m2 frame. Within each frame, presence/absence data were recorded for each species, which were then used to calculate frequencies per plot (1–100%). At each quadrat, the cover of each species was estimated using the projection method, and the height of each species was measured with a ruler. The species were assigned to plant functional groups according to their belonging to specific life forms (shrub, annual herb, or perennial herb) [24], carbon metabolic pathway (C3 and C4) [25], classification groups (forbs, Asteraceae, Fabaceae, Cyperaceae, or Poaceae) [26], and nutritive value groups (poisonous herb, weed, or forage grass) [27]. The aboveground biomass (AGB) was measured after harvesting, while all tissues of each species were clipped to ground level and stored in a separate envelope. The belowground biomass (BGB) was determined by selecting 3 soil cores (7 cm in diameter, 10 cm in depth) randomly in each quadrat after harvesting the aboveground biomass. The soil cores were separated into three layers, the top layer (0–10 cm), middle layer (10–20 cm), and the lower layer (20–30 cm). Each sample was washed over a 0.3-mm mesh sieve to remove the soil. The biomass of the aboveground and belowground samples was recorded after drying at 80 °C for 48 h to constant weight.
To understand the plant community structure and composition responses to GE. We calculated the Shannon–Wiener index and Pielou index to identify plant community changes caused by GE. In order to quantify the importance of different species in their plant communities, the parameter of Importance of Species Value (IV) was used [28]. The IV was also used to calculate the diversity (Shannon–Wiener index H = i = 1 S P i ln P i ) and evenness (Pielou index J = H ln S ) [29,30], where S is the total number of species in a quadrat and P i is the relative importance value of species i .

2.3. Data Analysis

The difference in vegetation characteristics, biomass, species diversity, and change in biomass were analyzed by variance equality (Levene) test. The effects of grazing exclusion on vegetation characteristics, biomass, and change of biomass in the different grassland types were tested using one-way analysis of variance (ANOVA). A paired t-test was applied to compare species diversity, functional group biomass, and change in biomass between the grazing exclusion and control. All statistical analyses were performed using SPSS 17.0 (SPSS Inc., Chicago, IL, USA), and all significant differences were taken at p < 0.05.

3. Results

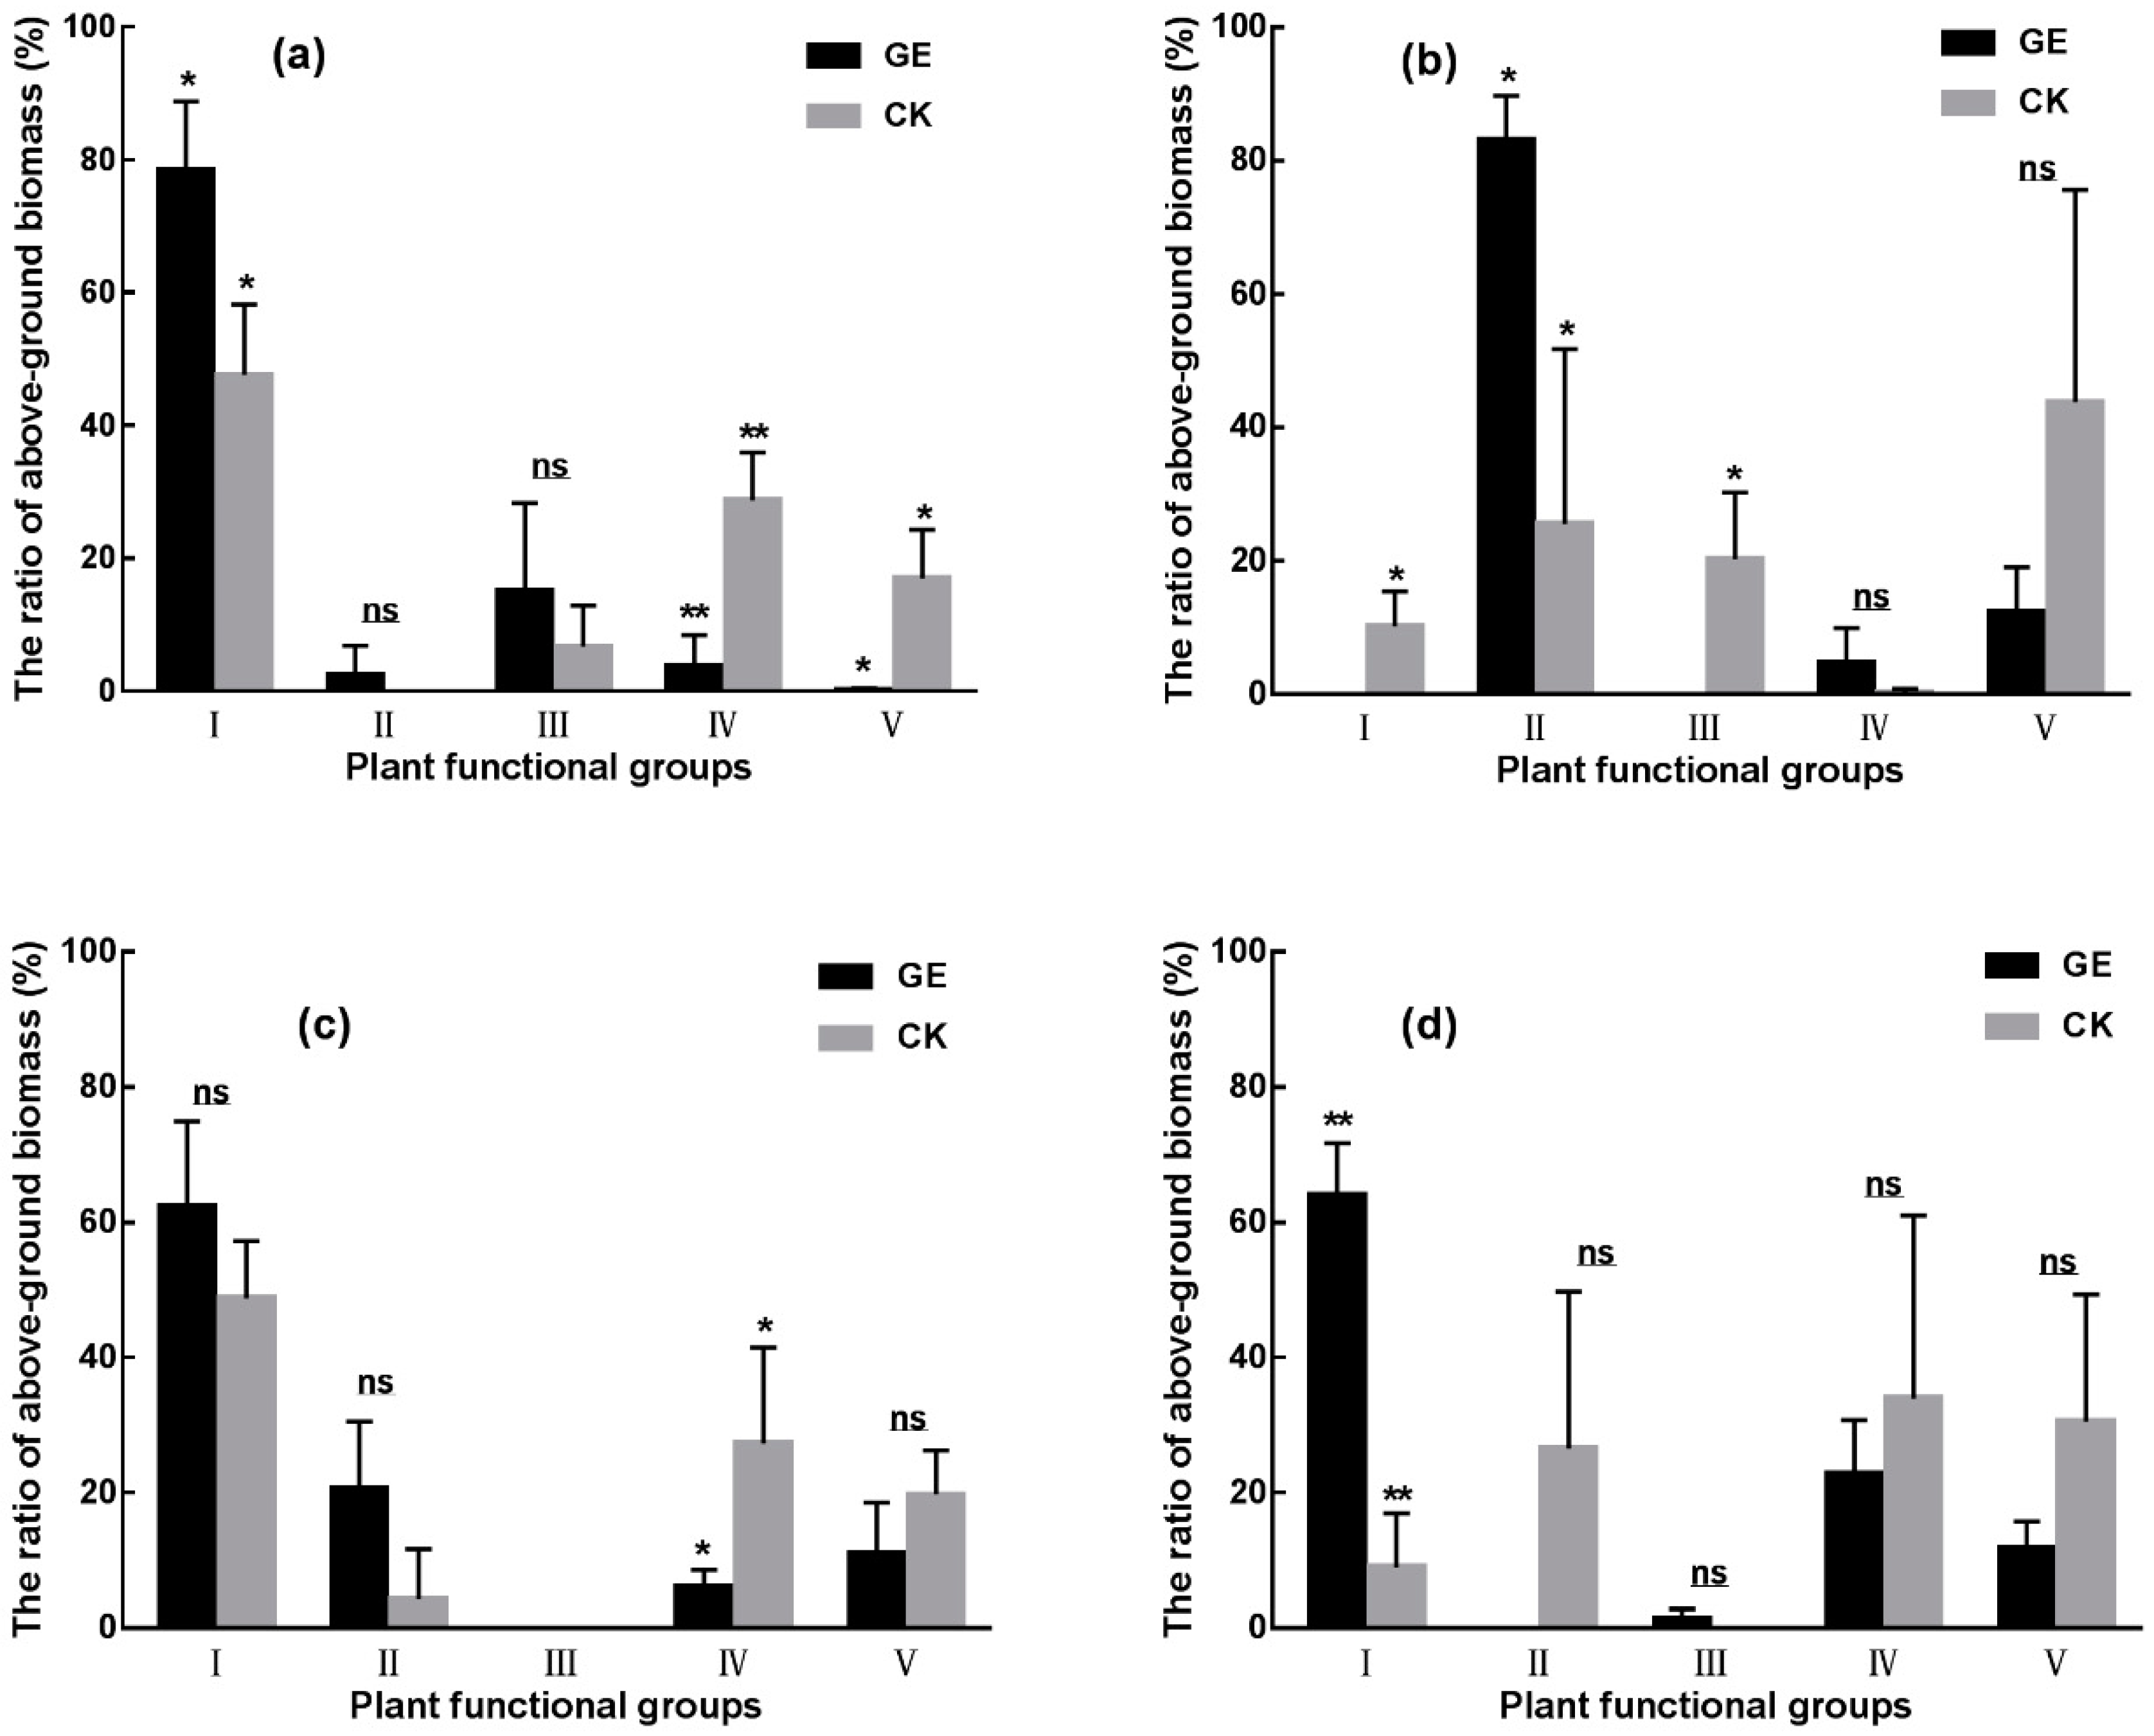
3.1. Effects of Grazing Exclusion on Vegetation Ecological Characteristics

The vegetation characteristics of the four grassland types varied dramatically, mainly in terms of species composition, biomass, plant height, and cover. Compared with the control sites, the vegetation cover, and height increased in the GE sites of all the four grasslands (Table 1). The plant heights of the TS and SM were significantly higher in GE than CK sites, and especially in the SM site, where the vegetation height increased by an average of 4.66 times. In the AS and AM sites, the dominant species were not found to be different between the GE and CK treatments. The dominant species in the TS grassland type changed from Leymus secalinus to Elymus nutans after grazing exclusion. In the SM type, the dominant species changed from Kobresia parva to Kobresia tibetica Maxim after grazing exclusion.
GE affected the species evenness and diversity. The effect of grazing exclusion on species evenness was not significant but did decrease slightly within the enclosure (Figure 1a). The GE sites had greater species diversity (Shannon–Wiener index) compared to the CK sites. The Shannon–Wiener index increased significantly with the enclosure in SM (23.9%) and AM (20.8%) (Figure 1b).

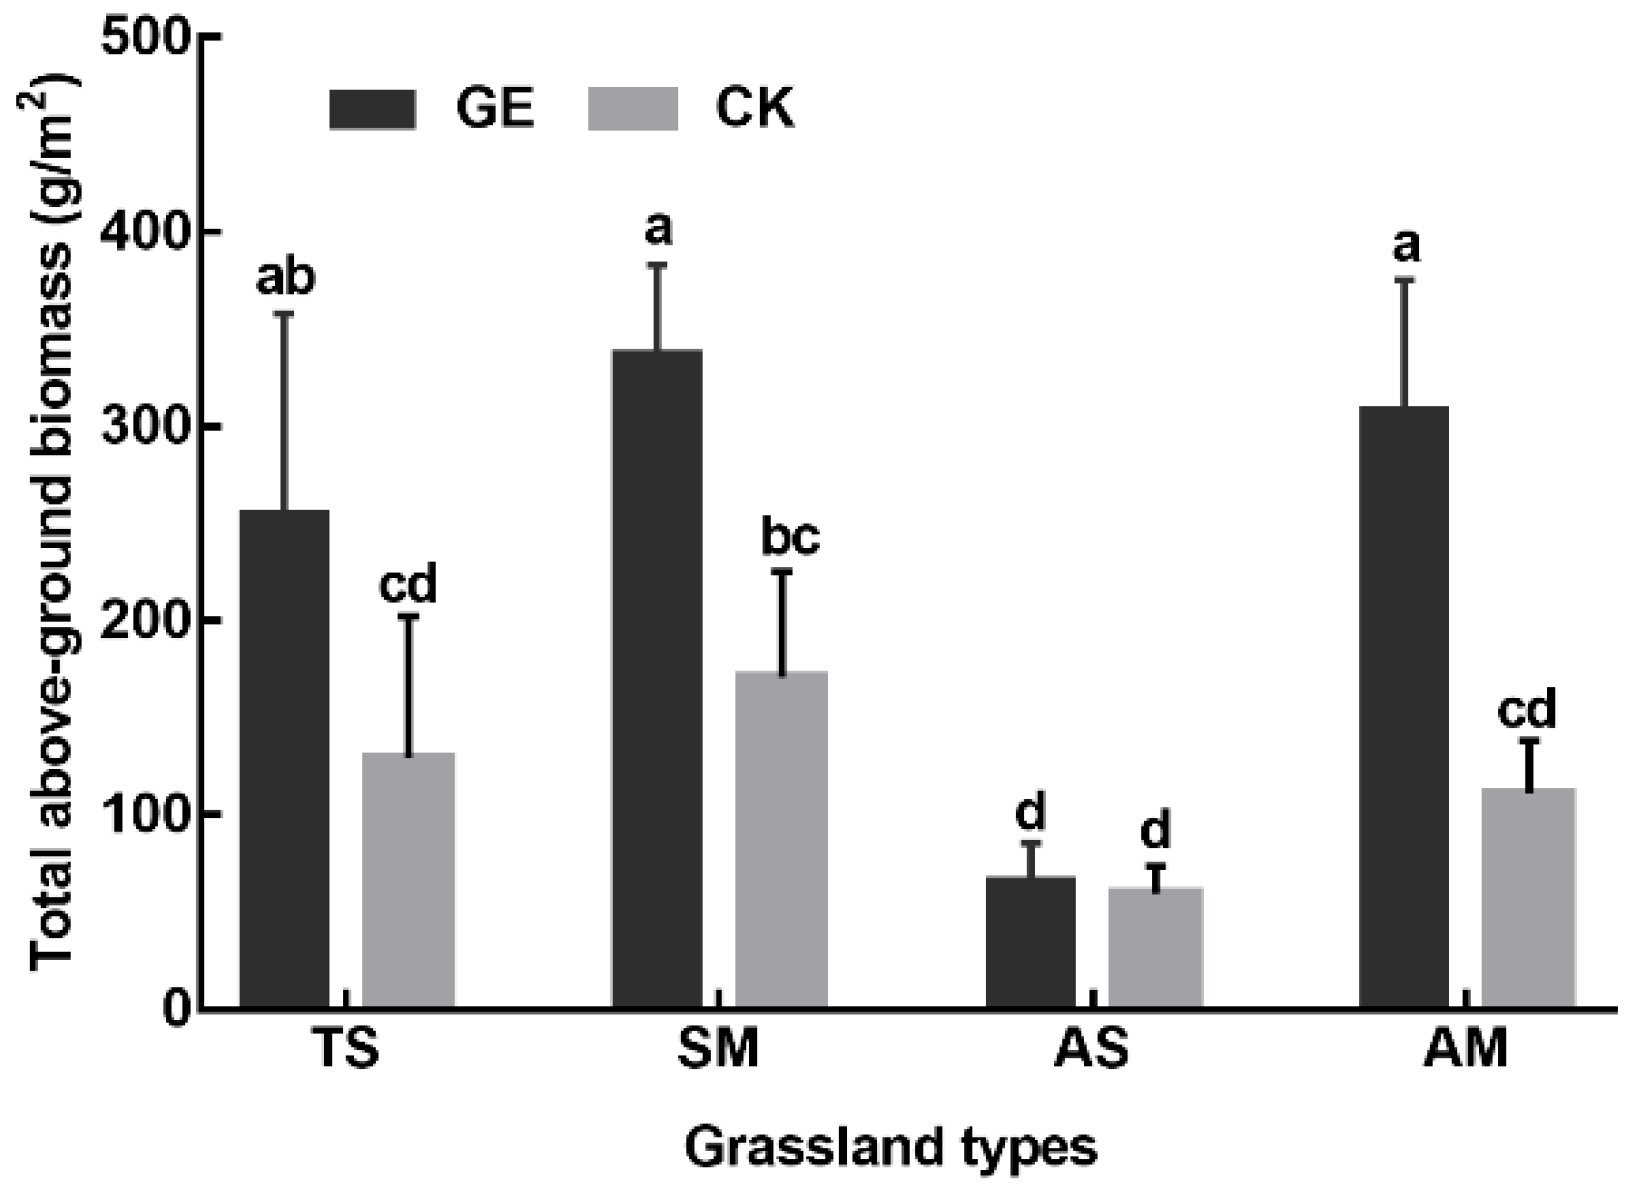
3.2. Effects of Grazing Exclusion on Vegetation Biomass

The AGB and BGB were found to be higher at the GE sites compare to the CK sites in all four grassland types (Figure 2). The increase in aboveground biomass was significant for TS (97.5%), SM (97.2%), and AM (178.1%) sites. However, grazing exclusion significantly increased belowground biomass in SW (76.2%), but had no significant effects in the other three grassland types.
With regard to plant functional groups, the AGB of Poaceae increased significantly in TS (64.9%) and AM (612.0%). In the SM site, grazing exclusion increased the AGB of Cyperaceae (225.1%) and decreased significantly AGB of Fabaceae (100%). AGB of Asteraceae decreased significantly in the TS (86.6%) and AS (86.6%) sites. The proportion of forbs decreased significantly (by 98.8%) under grazing exclusion in the TS site, but there were no obvious differences found in all other grassland types (Figure 3).
Grazing exclusion promoted the proportion of perennial herbs in the TS and AS sites while decreasing the proportion of perennial herbs in the SM and AM sites. The proportion of unpalatable plant species, including weeds and poisonous herbs, decreased in all four grassland types under grazing exclusion conditions. In contrast, the ratio of palatable plant species increased within the enclosure. Between the four grassland types, the C4 plants were only found in the temperate steppe. Compared with the control communities, grazing exclusion increased the proportion of C3 plants. Apart from the SM site, grazing exclusion in the other three grassland types tended to decrease the proportion of dicotyledons (Figure 4).
Plant biomass in grasslands is mainly concentrated underground. Accordingly, BGB found in this study was considerably higher than AGB. With that, grazing exclusion increased BGB in all four grassland types, this difference was significant in the SM site (76.2%) (Figure 5a). In all four grassland types, GE promoted the BGB in the deeper soil layer (10–30 cm) (Figure 5b).

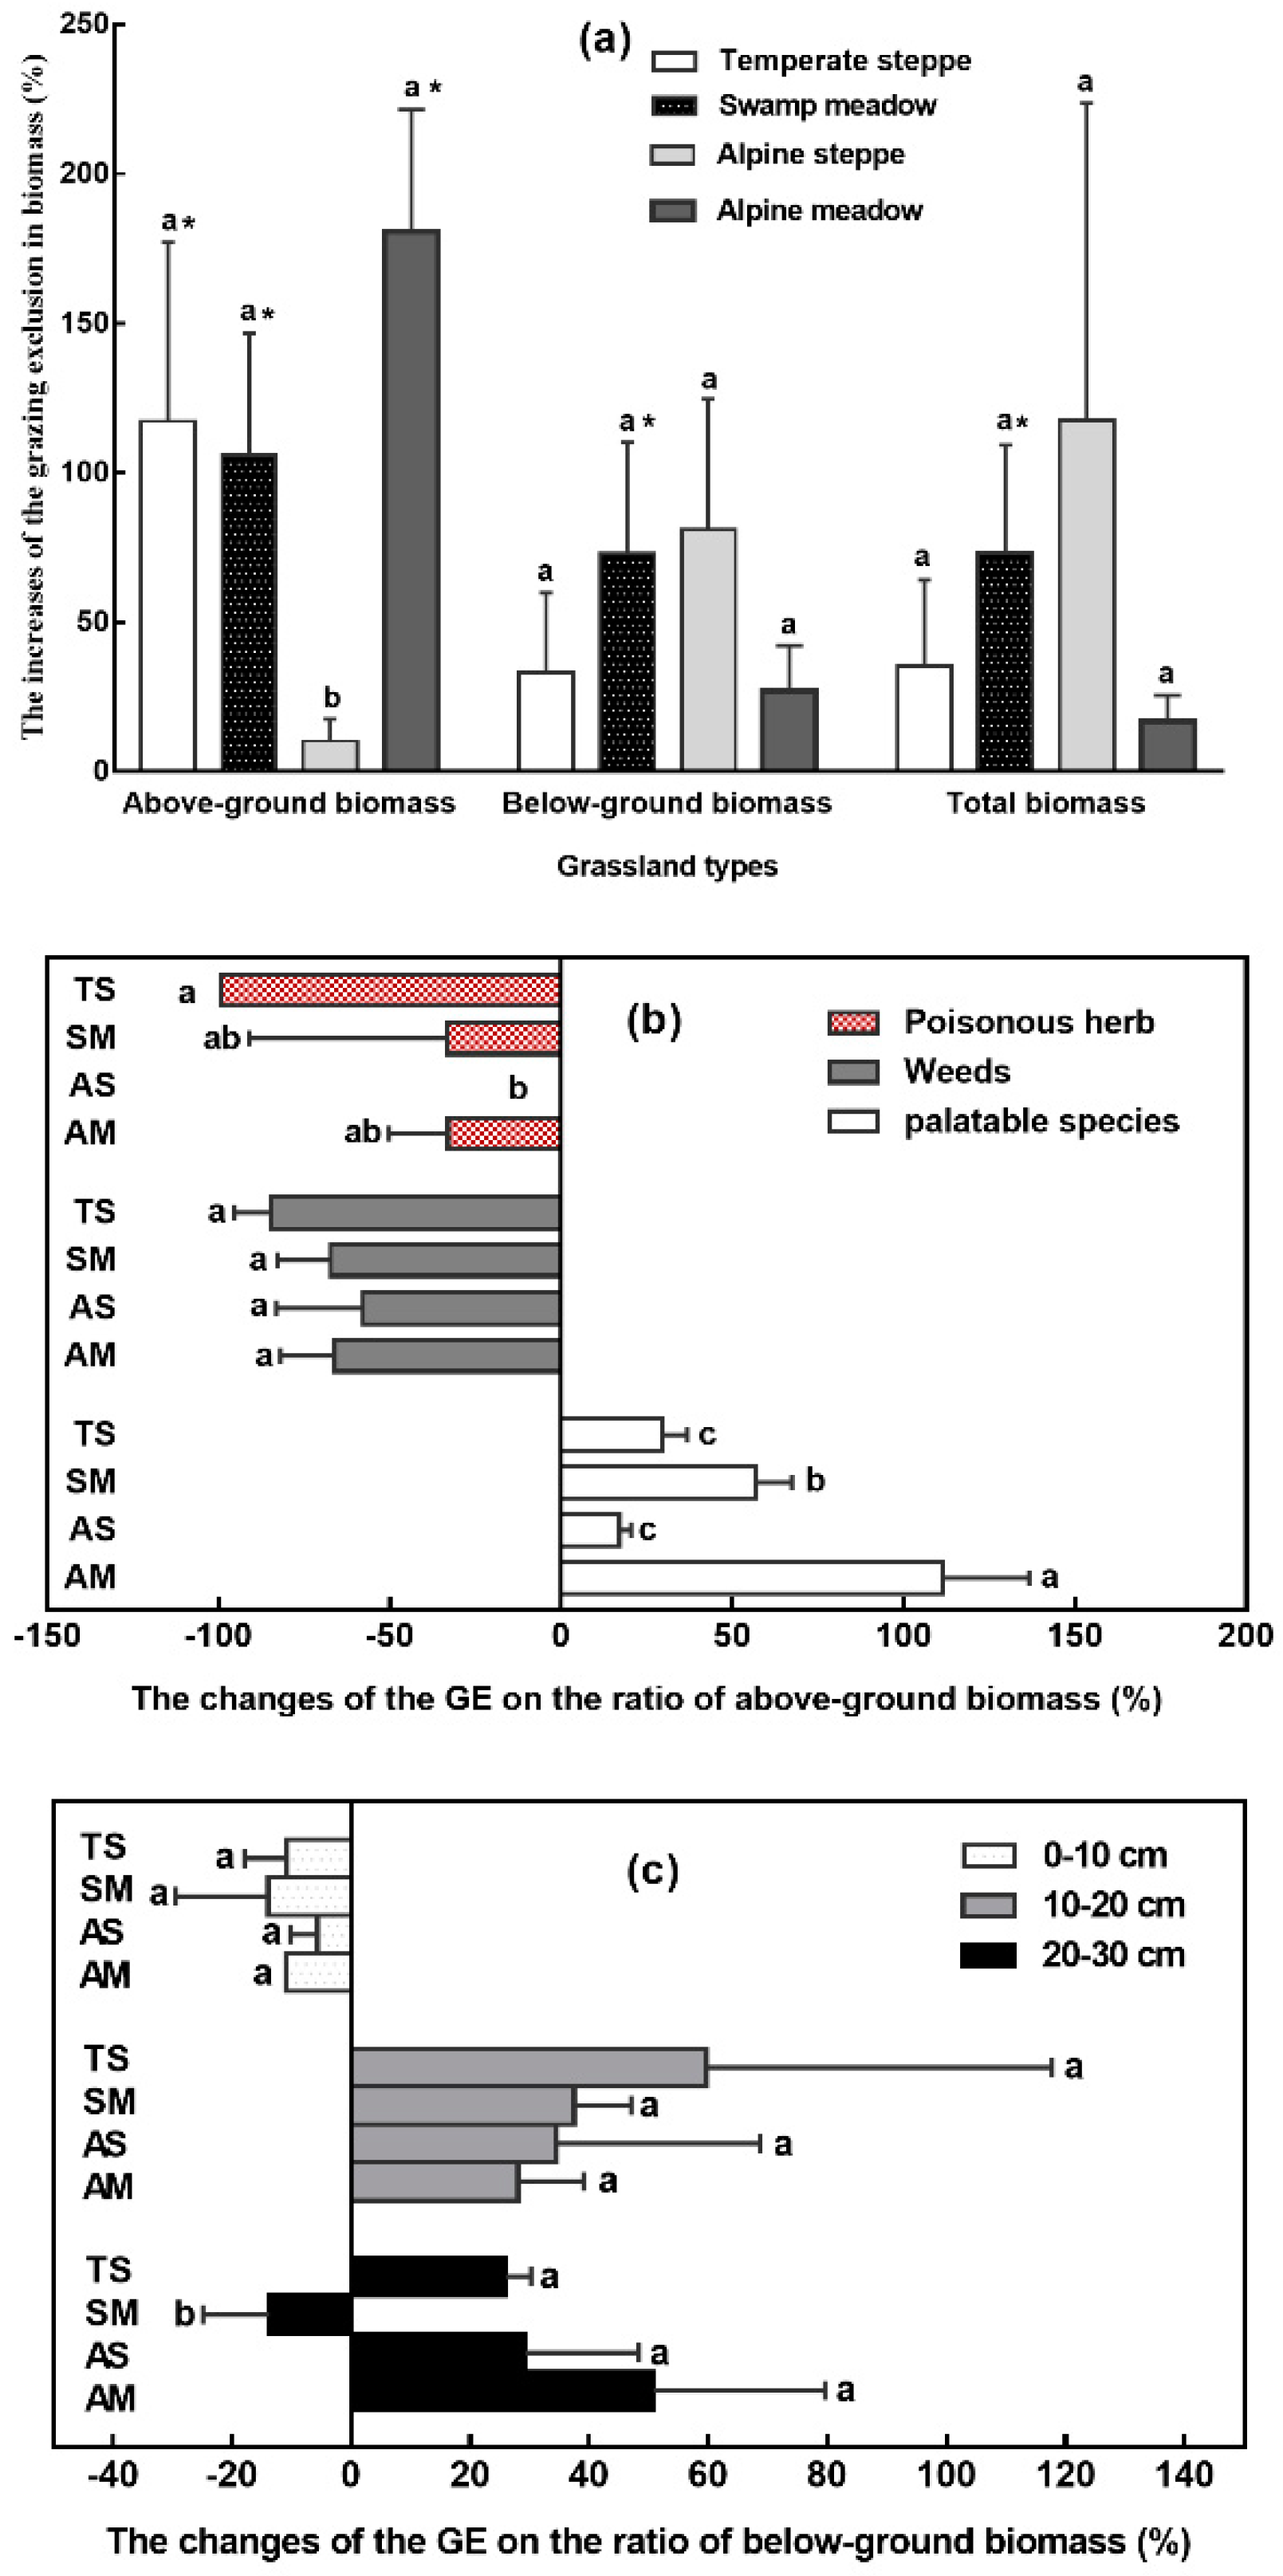
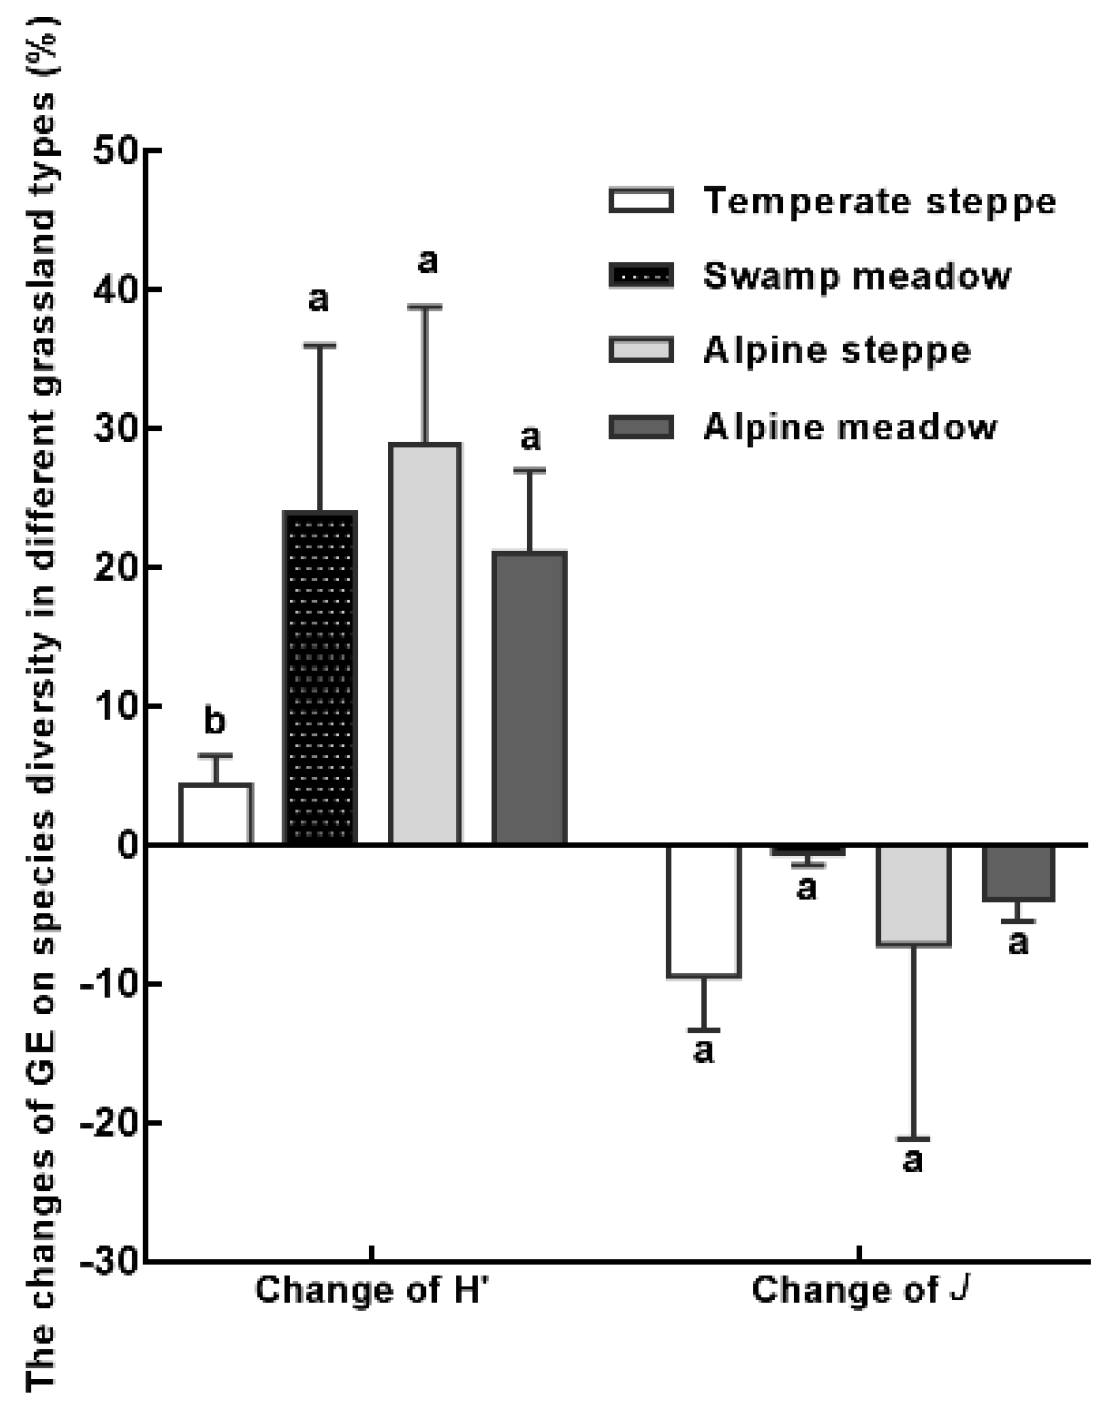
3.3. Comparison of Grazing Exclusion Effects in the Different Grassland Types

GE contributed to the restoration of the community biomass in all four grassland types. At the AM site, the largest AGB increase was found followed by TS, SM, and AS. The increase in AGB in AM, TS, and SW was significantly larger than in AS. The largest BGB and total biomass increase was found at the AS site, followed by SM, TS, and AM, but with no significant differences (Figure 6a).
GE also increased the proportion of palatable species and decreased the proportion of poisonous herbs and weeds. Grazing exclusion in the AM site had the greatest effect on the proportion of palatable species, as their increase in AM was significantly higher than the other grassland types (Figure 6b). After grazing exclusion, BGB of the four grassland types decreased in the topsoil layer (0–10 cm) and increased in the subsurface soil layer (10–20 cm). Apart from the SW site, the belowground biomass in the subsoil layer (20–30 cm) decreased. However, the changes of BGB in the different soil layers were not significant between the different grassland types (Figure 6c).
Grazing exclusion in different grassland types had similar effects on species evenness, and diversity (Figure 7). The change of H’ in TS was significantly lower than that of the other three grassland types. Grazing exclusion in the TS site had the largest effect on J with an average decrease of 11.0%, followed by the AS (8.3%), SM (3.6%), and AM (1.7%) sites.

4. Discussion

4.1. The Responses of Vegetation Characteristics and Species Diversity to Grazing Exclusion

In this study, we found that grazing exclusion had an impact on the development of vegetation by increasing in plant height, coverage, and species diversity in all four grasslands (Table 1; Figure 1, Figure 2 and Figure 5). This finding is similar to the results found in other studies [31,32]. In TS and SM, plant height increased significantly after GE due to decreased livestock feeding, which allowed the accumulation of biomass. Grazing exclusion may transform community composition, and thus, affect nutrient and energy allocation patterns in plants [33]. Potential explanations for species diversity responses to GE, including increase in litter accumulation, changes in plant competitive balance, and enhanced plant growth [33,34]. Grazing exclusion had an effect on plant species composition, and led to a change in the dominant species in the TS and SM (Table 1). This may account for changes in the competitive balance between species after grazing exclusion [35]. Species diversity was higher in GE sites than that in control sites, and grazing exclusion in meadows increased the Shannon–Wiener index significantly in both the swamp meadow, 23.9%, and the alpine meadow, 27.6% (Figure 1). Grazing exclusion decreased species evenness in the four grasslands types. This phenomenon may be explained by the “competitive exclusion hypothesis” [36]. Overgrazing and trampling by livestock restrain plant reproduction and regeneration, and lead to the loss of some accompanying species. The practice of grazing exclusion would promote the growth of suppressed species and enhance species richness [37]. As grazing cessation time continued to increase, the competitors with an advantage, such as Poaceae increased further, and surpassed the groups with weaker competition; thus, leading to a decrease in species evenness [38]. The “intermediate disturbance hypothesis” demonstrated that the species diversity will increase under the appropriate grazing intensity, moderate disturbance can improve the ecological niche allocation of the population to maximize the use of environmental resources [5].

4.2. The Responses of Biomass Growth to Grazing Exclusion

Our findings showed that grazing exclusion increased aboveground and belowground biomass (Figure 2, Figure 5). The increases in aboveground biomass were significant for AM, TS, and SM, while belowground biomass increased significantly in SW within the enclosure. After grazing exclusion, AM showed the largest AGB increase, this was followed at TS, SM, and AS (Figure 6a). The increase of palatable species in AM was also significantly higher than that found in the other grassland types (Figure 6b). The aboveground biomass of Poaceae plants increased significantly under grazing exclusion conditions in TS and AM. In addition, grazing exclusion increased the aboveground biomass of Cyperaceae significantly in SM and decreased the aboveground biomass of Asteraceae in TS, SM, and AS. Enclosure significantly reduced the aboveground biomass of Forbs in AS (Figure 4). Enclosure increases the competitiveness of Poaceae and Cyperaceae plants, while Fabaceae, Asteraceae, and Forbs are inhibited in their competition for water, light, and other resources. Some forbs are even eliminated from the ecosystem due to their inadaptability to the competitive environment [39]. Grazing exclusion increased the belowground biomass in the four grassland types, and this increase was significant in the SM site (Figure 5). The belowground biomass decreased in the topsoil layer (0–10 cm) and increased in the subsoil layer (10–30 cm) (Figure 6c). The trampling on soil by livestock was eliminated in grazing exclusion grassland, resulting in decreased soil bulk density and increased belowground biomass accumulation [40].

4.3. Implications for Sustainable Grassland Management Strategies

The management of grassland degradation caused by grazing disturbance is one of the most challenging problems [41]. In order to mitigate the effects of grassland degradation on the Tibetan Plateau, China has invested ~7 billion USD. One example program is “Returning Grazing Land to Grassland”, which facilitates grazing exclusion by building fences, has been implemented since 2003 [42]. Understanding the effects of restoration practices on the ecosystem are important for sustainable development [43,44]. Considering grassland uses and economic costs, grazing exclusion restoration practices should not take a long time to implement. A short-term grazing exclusion is better for degraded grassland restoration. A long-standing question has been how to effectively manage and prevent grassland degradation. In our study, it is shown that grazing exclusion has increased the proportion of palatable species and decreased the proportion of poisonous herbs and weeds. The increase in palatable species in AM was significantly higher than found in the other grassland types (Figure 6). In addition, grazing exclusion was also found to have the potential for increasing N and C storage by increasing plant biomass and soil quality in degraded grasslands [45]. Our findings indicate that grazing exclusion is an effective method to restore degraded grasslands and its affect is highest in alpine meadow.
These findings indicate that, on the Tibetan Plateau, alpine meadow may be more responsive to grazing exclusion compare to alpine steppe, temperate steppe, and swamp meadow. In the TRH region, the continued degradation of the ecosystem has been a major problem for the community. As so, the State Council has invested RMB 7.5 billion yuan in undertaking the first stages of ecological conservation and restoration of this region. The grassland degradation has stabilized, and trends of ecosystem degradation have been contained in the preliminary [46]. Although grassland yields in this region has increased slightly, the supply of pasture is still unbalanced [47], but as shown, different regions and ecosystems have different recovery effects. Accordingly, in order to solve this problem more efficiently, in the first place priority should be given to restoring those areas with better recovery results initially. In addition, more attention must be given those areas with severe ecological damage, priority should be given to the restoration of regions with severe degradation. The selection of priority restoration areas needs to consider the primary goal of this project and the status quo of the areas.

5. Conclusions

After a short-term exclusion of grazing, GE was found to have positive effects on plant height, vegetation coverage, aboveground biomass, belowground biomass, and diversity, but had limited effects on species evenness in all the four grasslands. GE increased the proportion of palatable species and decreased the proportion of poisonous herbs and weeds. GE increased the species diversity in SM and AM significantly. GE in AM showed the largest increase in aboveground biomass. The increase of palatable species in AM was significantly higher than that of the other grassland types. Our results demonstrate that GE is an effective method for the restoration of degraded grasslands and the effects of GE are the highest in the alpine meadow. The results of this study may serve as a reference for other similar natural world grasslands.

Author Contributions

Conceptualization, Y.L., J.F., and L.H.; Validation, S.W.; Formal Analysis, S.W.; Investigation, Y.L.; Writing—Original Draft Preparation, S.W.; Writing—Review and Editing, Y.L., J.F., and S.W.; Supervision, Y.L.; Funding Acquisition, Y.L., J.F., and L.H.

Funding

This study was funded by the Strategic Priority Research Program of the Chinese Academy of Sciences, grant number XDA20020401, the National Natural Science Foundation of China, grand number 41601615, Science and Technology Service Network Initiative, grant number KFJ_STS-ZDTP-013-02, and National Key R & D Program of China, grant number 2017YFA0604804 and 2017YFC0506505.

Acknowledgments

Financial support is acknowledged from the Strategic Priority Research Program of the Chinese Academy of Sciences (XDA20020401), the National Natural Science Foundation of China (41601615), Science and Technology Service Network Initiative (KFJ_STS-ZDTP-013-02), and the National Key R & D Program of China (2017YFA0604804 and 2017YFC0506505). The authors thank Shihao Wang and Yuhan Zhen for their help in field sampling. We thank anonymous reviewers and the editor of the journal for their constructive comments and suggestions to the manuscript.

Conflicts of Interest

The authors declare no conflict of interest.

Appendix A

Figure A1. A schematic of experimental design. GE: grazing exclusion treatment; CK: control; TS: temperate steppe; SM: swamp meadow; AM: alpine meadow; AS: alpine steppe.
Sustainability 11 01705 g0a1
Table A1. Environmental characteristics of each sampling point.
Temperate Steppe SiteSwamp Meadow SiteAlpine Steppe SiteAlpine Meadow Site
Location35°39′ N, 100°21′ E33°12′ N, 96°37′ E35°06′ N, 97°58′ E32°50′ N, 96°57′ E
Annual precipitation/mm380.92556.41544.01535.50
Annual mean temperature/°C2.27−0.161.91−0.28
Climate typePlateau continental climatePlateau continental climatePlateau continental climatePlateau continental climate
Annual evaporation/mm1378.5111012151110
Soil typeCastanozemsFrigid calcic soilsBog soilsFelty soils
Annual sunshine hour/h2664.92578.426002578.4

References

  1. Klein, J.A.; Harte, J.; Zhao, X.Q. Experimental warming, not grazing, decreases rangeland quality on the Tibetan plateau. Ecol. Appl. 2007, 17, 541–557. [Google Scholar] [CrossRef] [PubMed]
  2. Post, E.; Pedersen, C. Opposing plant community responses to warming with and without herbivores. Proc. Natl. Acad. Sci. USA 2008, 105, 12353–12358. [Google Scholar] [CrossRef] [PubMed] [Green Version]
  3. Pavlu, V.; Hejcman, M.; Pavlu, L.; Gaisler, J. Restoration of grazing management and its effects on vegetation in an upland grassland. Appl. Veg. Sci. 2007, 10, 375–382. [Google Scholar] [CrossRef]
  4. Isselstein, J.; Griffith, B.A.; Pradel, P.; Venerus, S. Effects of livestock breed and grazing intensity on biodiversity and production in grazing systems, 1: Nutritive value of herbage and livestock performance. Grass Forage Sci. 2007, 62, 145–158. [Google Scholar] [CrossRef]
  5. Proulx, M.; Mazumder, A. Reversal of grazing impact on plant species richness in nutrient-poor vs. nutrient-rich ecosystems. Ecology 1998, 79, 2581–2592. [Google Scholar] [CrossRef]
  6. Ma, Q.Q.; Chai, L.R.; Hou, F.J.; Chang, S.H.; Ma, Y.S.; Tsunekawa, A.; Cheng, Y.X. Quantifying grazing intensity using remote sensing in Alpine meadows on Qinghai-Tibetan Plateau. Sustainability 2019, 11, 417. [Google Scholar] [CrossRef]
  7. Simmons, M.T.; Venhaus, H.C.; Windhager, S. Exploiting the attributes of regional ecosystems for landscape design: The role of ecological restoration in ecological engineering. Ecol. Eng. 2007, 30, 201–205. [Google Scholar] [CrossRef]
  8. Zhang, J.T.; Ru, W.M.; Li, B. Relationships between vegetation and climate on the Loess Plateau in China. Folia Geobot. 2006, 41, 151–163. [Google Scholar] [CrossRef]
  9. Hu, Z.M.; Li, S.G.; Guo, Q.; Niu, S.L.; Li, N.H.; He, N.P. A synthesis of the effect of grazing exclusion on carbon dynamics in grasslands in China. Glob. Chang. Biol. 2016, 22, 385–1393. [Google Scholar] [CrossRef] [PubMed]
  10. Sasaki, T.; Okayasu, T.; Jamsran, U.; Takeuchi, K. Threshold changes in vegetation along a grazing gradient in Mongolian rangelands. J. Ecol. 2008, 96, 145–154. [Google Scholar] [CrossRef]
  11. Frank, D.A.; Kuns, M.M.; Guido, D.R. Consumer control of grassland plant production. Ecology 2002, 83, 602–606. [Google Scholar] [CrossRef]
  12. Li, Y.Z.; Fan, J.W.; Yu, H.L. The effects of different restoration practices on temperate grassland ecosystems in the Beijing-Tianjin Sand Source Control Project. Acta Prataculturae Sin. 2018, 27, 1–4. (In Chinese) [Google Scholar]
  13. Zhang, J.T.; Dong, Y.R. Factors affecting species diversity of plant communities and the restoration process in the loess area of China. Ecol. Eng. 2010, 36, 345–350. [Google Scholar] [CrossRef]
  14. He, N.P.; Han, X.G.; Yu, G.R.; Chen, Q.S. Divergent changes in plant community composition under 3-decade grazing exclusion in continental steppe. PLoS ONE 2011, 6, e26506. [Google Scholar] [CrossRef] [PubMed]
  15. Wei, J.; Cheng, J.; Li, W.; Liu, W. Comparing the effect of naturally restored forest and grassland on carbon sequestration and its vertical distribution in the Chinese Loess Plateau. PLoS ONE 2012, 7, e40123. [Google Scholar] [CrossRef] [PubMed]
  16. Fan, J.W.; Zhong, H.P.; Harris, W.; Yu, G.R.; Wang, S.Q.; Hu, Z.M.; Yue, Y.Z. Carbon storage in the grasslands of China based on field measurements of above—And below-ground biomass. Clim. Chang. 2008, 86, 375–396. [Google Scholar] [CrossRef]
  17. Raiesi, F.; Riahi, M. The influence of grazing exclosure on soil c stocks and dynamics, and ecological indicators in upland arid and semi-arid rangelands. Ecol. Indic. 2014, 41, 145–154. [Google Scholar] [CrossRef]
  18. Harris, R.B. Rangeland degradation on the Qinghai-Tibetan plateau: A review of the evidence of its magnitude and cause. J. Arid Environ. 2010, 74, 1–12. [Google Scholar] [CrossRef]
  19. Zhao, X.Q. Alpine Meadow Ecosystem and Global Change; Science Press: Beijing, China, 2009. [Google Scholar]
  20. Zhao, X.Q.; Zhao, L.; Li, Q.; Chen, H.; Zhou, H.K.; Xu, S.X.; Dong, Q.M.; Wu, G.L.; He, Y.X. Using balance of seasonal herbage supply and demand to inform sustainable grassland management on the Qinghai-Tibetan Plateau. Front. Agric. Sci. Eng. 2018, 5, 1–8. [Google Scholar] [CrossRef]
  21. Xiong, D.P.; Shi, P.L.; Zhang, X.Z.; Zou, C.B. Effects of grazing exclusion on carbon sequestration and plant diversity in grasslands of China—A meta-analysis. Ecol. Eng. 2016, 94, 647–655. [Google Scholar] [CrossRef] [Green Version]
  22. Su, Y.Z.; Li, Y.L.; Cui, H.Y.; Zhao, W.Z. Influences of continuous grazing and livestock exclusion on soil properties in a degraded sandy grassland, Inner Mongolia, norther China. Catena 2005, 59, 267–278. [Google Scholar]
  23. Liu, M.; Liu, G.H.; Wu, X.; Wang, H.; Chen, L. Vegetation traits and soil properties in response to utilization patterns of grassland in Hulun Buir City, Inner Mongolia, China. Chin. Geogr. Sci. 2014, 24, 471–478. [Google Scholar] [CrossRef] [Green Version]
  24. Engemann, K.; Sandel, B.; Boyle, B.; Enquist, B.J.; Jorgensen, P.M.; Kattge, J.; Mcgill, B.J.; Morueta-Holme, N.; Peet, R.K.; Spencer, N.J.; et al. A plant growth form dataset for the New World. Ecology 2016, 97, 3243. [Google Scholar] [CrossRef] [PubMed]
  25. Gui, W.Y.; Ren, H.Y.; Liu, N.; Zhang, Y.J.; Cobb, A.B.; Wilson, G.W.T.; Sun, X.; Hu, J.; Zhang, F.; Yang, G.W. Plant functional group influences arbuscular mycorrhizal fungal abundance and hyphal contribution to soil CO2 efflux in temperate grasslands. Plant Soil 2018, 432, 157–170. [Google Scholar] [CrossRef]
  26. Humbert, J.; Dwyer, J.M.; Andrey, A.; Arlettaz, R. Impacts of nitrogen addition on plant biodiversity in mountain grasslands depend on dose, application duration and climate: A systematic review. Glob. Chang. Biol. 2016, 22, 110–120. [Google Scholar] [CrossRef] [PubMed]
  27. Buschmann, H.; Keller, M.; Porret, N.; Dietz, H.; Edwards, P.J. The effect of slug grazing on vegetation development and plant species diversity in an experimental grassland. Funct. Ecol. 2005, 19, 291–298. [Google Scholar] [CrossRef] [Green Version]
  28. Jing, Z.B.; Cheng, J.M.; Chen, A. Assessment of vegetative ecological characteristics and the succession process during three decades of grazing exclusion in a continental steppe grassland. Ecol. Eng. 2013, 7, 162–169. [Google Scholar] [CrossRef]
  29. Shannon, E.C. A mathematical theory of communication. Bell Syst. Tech. J. 1948, 27, 379–423. [Google Scholar] [CrossRef]
  30. Pielou, E.C. The measurement of diversity in different types of biological collections. J. Theor. Biol. 1996, 13, 131–144. [Google Scholar] [CrossRef]
  31. Zhang, Y.; Gao, Q.Z.; Dong, S.K.; Liu, S.L.; Wang, X.X.; Su, X.K.; Li, Y.Y.; Tang, L.; Wu, X.Y.; Zhao, H.D. Effects of grazing and climate warming on plant diversity, productivity and living state in the alpine rangelands and cultivated grasslands of the Qinghai-Tibetan Plateau. Rangel. J. 2014, 37, 57–65. [Google Scholar] [CrossRef]
  32. Li, W.; Cao, W.X.; Wang, J.L.; Li, X.L.; Xu, C.L.; Shi, S.L. Effects of grazing regime on vegetation structure, productivity, soil quality, carbon and nitrogen storage of alpine meadow on the Qinghai-Tibetan Plateau. Ecol. Eng. 2017, 98, 123–133. [Google Scholar] [CrossRef]
  33. Semmartin, M.; Garibaldi, L.A.; Chaneton, E.J. Grazing history effects on above- and below-ground litter decomposition and nutrient cycling in two co-occurring grasses. Plant Soil 2008, 303, 177–189. [Google Scholar] [CrossRef]
  34. Melillo, J.; Steudler, P.A.; Abler, J.D.; Newkirk, K.; Lux, H.; Bowles, F.P.; Catricala, C.; Magill, A.; Ahrens, T.; Morrisseau, S. Soil warming and carbon-cycle feedbacks to the climate system. Science 2002, 298, 2173–2175. [Google Scholar] [CrossRef]
  35. Mulder, C.P.H. Vertebrate herbivores and plants in the Arctic and Subarctic: Effects on individuals, populations, communities and ecosystems. Perspect. Plant Ecol. 1999, 2, 29–55. [Google Scholar] [CrossRef]
  36. Grime, J.P. Plant Strategies and Vegetation Processes; Wiley: Chichester, UK, 1979. [Google Scholar]
  37. Shang, Z.H.; Ma, Y.S.; Long, R.J.; Ding, L.M. Effect of fencing, artificial seeding and abandonment on vegetation composition and dynamics of “black soil land” in the headwaters of the Yangtze and the Yellow Rivers of the Qinghai-Tibetan Plateau. Land Degrad. Dev. 2008, 19, 554–563. [Google Scholar] [CrossRef]
  38. Mayer, R.; Kaufmann, R.; Vorhauser, K.; Erschbamer, B. Effects of grazing exclusion on species composition in high-altitude grasslands of the Central Alps. Basic Appl. Ecol. 2009, 10, 447–455. [Google Scholar] [CrossRef]
  39. Hautier, Y.; Niklaus, P.A.; Hector, A. Competition for light causes plant biodiversity loss after eutrophication. Science 2009, 324, 636–638. [Google Scholar] [CrossRef]
  40. Gao, Y.H.; Zeng, X.Y.; Schumann, M.; Chen, H. Effectiveness of exclosures on restoration of degraded alpine meadow in the eastern Tibetan Plateau. Arid Land Res. Manag. 2011, 25, 164–175. [Google Scholar] [CrossRef]
  41. Martinez-Ruiz, C.; Fernandez-Santors, B.; Putwain, P.D.; Fernandez-Gomez, M.J. Natural and man-induced revegetation on mining wastes: Changes in the floristic composition during early succession. Ecol. Eng. 2007, 30, 286–294. [Google Scholar] [CrossRef]
  42. Zhou, L.H.; Wang, Y.; Yang, G.J. Study on the timely adjustment of the grazing prohibition policy: Ban or lift? Empirical research from local government managers. Sustainability 2019, 10, 4852. [Google Scholar] [CrossRef]
  43. Klein, J.A.; Harte, J.; Zhao, X.Q. Experimental warming causes large and rapid species loss, dampened by simulated grazing, on the Tibetan Plateau. Ecol. Lett. 2004, 7, 1170–1179. [Google Scholar] [CrossRef]
  44. Wang, X.H.; Yu, J.B.; Zhou, D.; Dong, H.F.; Li, Y.Z.; Lin, Q.X.; Guan, B.; Wang, Y.L. Vegetative ecological characteristics of restored reed (Phragmites australis) wetlands in the Yellow River Delta, China. Environ. Manag. 2012, 49, 325–333. [Google Scholar] [CrossRef] [PubMed]
  45. Qiu, L.P.; Wei, X.R.; Zhang, X.C.; Cheng, J.M. Ecosystem carbon and nitrogen accumulation after grazing exclusion in semiarid grassland. PLoS ONE 2013, 8, e55433. [Google Scholar] [CrossRef]
  46. Shao, Q.Q.; Cao, W.; Fan, J.W.; Huang, L.; Xu, X.L. Effects of an ecological conservation and restoration project in the Three-River Source Region, China. J. Geogr. Sci. 2017, 27, 183–204. [Google Scholar] [CrossRef]
  47. Fan, J.W.; Shao, Q.Q.; Liu, J.Y.; Wang, J.B.; Harris, W.; Chen, Z.Q.; Zhong, H.P.; Xu, X.L.; Liu, R.G. Assessment of effects of climate change and grazing activity on grassland yield in the Three Rivers Headwaters Region of Qinghai-Tibet Plateau, China. Environ. Monit. Assess. 2010, 170, 571–584. [Google Scholar] [CrossRef] [PubMed]
Figure 1. Species evenness (a) and diversity (b) after grazing exclusion in different grassland types. TS: temperate steppe, SM: swamp meadow, AS: alpine steppe, AM: alpine meadow. GE: grazing exclusion treatment, CK: control. * P < 0.05, ns: not significant. Data present the means ± SD.
Sustainability 11 01705 g001
Figure 2. The response of aboveground biomass in different grassland types under grazing exclusion conditions. GE: grazing exclusion treatment, CK: control. TS: temperate steppe, SM: swamp meadow, AS: alpine steppe, AM: alpine meadow. Different lowercase letters indicate significant differences at the 0.05 level. Data present the means ± SD.
Sustainability 11 01705 g002
Figure 3. The response of plant functional group structure in four grasslands under grazing exclusion condition. (a) Temperate steppe, (b) swamp meadow, (c) alpine steppe, and (d) alpine meadow. I: Poaceae, II: Cyperaceae, III: Fabaceae, IV: Asteraceae, V: Forbs. GE: grazing exclusion treatment, CK: control. * P < 0.05, ** P < 0.01, ns: not significant. Data present the means ± SD.
Sustainability 11 01705 g003
Figure 4. Plant life forms and functional groups of aboveground biomass of the four grasslands. GE: grazing exclusion treatment, CK: control. TS: temperate steppe, SM: swamp meadow, AS: alpine steppe, AM: alpine meadow.
Sustainability 11 01705 g004
Figure 5. The belowground biomass in grazing exclusion (GE) and control (CK) treatments in the different grassland types (a), and the composition of belowground biomass at the three depth layers (b). TS: temperate steppe, SM: swamp meadow, AS: alpine steppe, AM: alpine meadow. Different lowercase letters indicate significant differences at the 0.05 level. Data present the means ± SD.
Sustainability 11 01705 g005
Figure 6. The effect of grazing exclusion on the biomass (a), plant functional group biomass (b), and belowground biomass composition (c) in four grassland types. GE: grazing exclusion treatment, CK: control. TS: temperate steppe, SM: swamp meadow, AS: alpine steppe, AM: alpine meadow. Different lowercase letters indicate significant differences at the 0.05 level. * P < 0.05. Data is presented as mean ± SD.
Sustainability 11 01705 g006
Figure 7. The effect of grazing exclusion on species diversity indices in four grassland types. GE: grazing exclusion treatment, CK: control. H’: Shannon–Wiener index, J: Pielou index. Different lowercase letters indicate significant differences at the 0.05 level. Data is presented as the mean ± SD.
Sustainability 11 01705 g007
Table 1. Vegetation characteristics and species composition after grazing exclusion of different grassland types.
Grassland TypeTreatmentCover (%)Height (cm)Species Composition
Temperate steppeGE91.7 ± 6.2ab35.0 ± 0.8aElymus nutans *, Poa annua L., Trisetum clarkei, Artemisia scoparia
CK86.7 ± 19.3ab10.7 ± 0.9bcLeymus secalinus *, Pedicularis kansuensis, Artemisia sieversiana, Poa annua L.
Swamp meadowGE100.0 ± 0.0ac21.7 ± 2.4abKobresia tibetica Maxim. *, Kobresia humilis, Potentilla anserina L., Pedicularis longiflora var. tubiformis
CK86.7 ± 11.8ac3.8 ± 0.9cKobresia parva*, Stipa regeliana, Astragalus membranaceus, Carex parva
Alpine steppeGE66.7 ± 4.7bc20.3 ± 0.5bStipa purpurea *, Kobresia tibetica Maxim., Carex atrata, Leontopodium nanum, Potentilla bifurca
CK61.7 ± 6.2b13.0 ± 2.2bcStipa purpurea *, Leontopodium nanum, Artemisia frigida, Saussurea arenaria
Alpine meadowGE99.3 ± 0.9a46.0 ± 9.9abcStipa regeliana *, Poa annua L., Elymus nutans
CK68.3 ± 6.2ab5.0 ± 0.8cStipa regeliana *, Ligularia virgaurea, Kobresia parva, Potentilla saundersiana
Notes: * the dominant species in sites. The top three species of IV in each community are presented, species found repeatedly in different plots were merged. GE: grazing exclusion treatment, CK: control. The data of coverage and average height are presented as the means ± SD. Different lowercase letters indicate significant differences at the 0.05 level.

