Article

Characteristics of Atmospheric Deposition during the Period of Algal Bloom Formation in Urban Water Bodies

1
College of Environmental Science and Engineering, Tongji University, Shanghai 200092, China
2
Tongji Architectural Design (Group) Co., Ltd., Shanghai 200092, China
3
Shanghai Institute of Pollution Control and Ecological Security, Shanghai 200092, China
4
Key Laboratory of Yangtze River Water Environment, Ministry of Education, Shanghai 200092, China
5
Shanghai Municipal Engineering Design Institute (Group) Co., Ltd., Shanghai 200092, China
*
Author to whom correspondence should be addressed.
Sustainability 2019, 11(6), 1703; https://doi.org/10.3390/su11061703
Submission received: 28 December 2018 / Revised: 12 March 2019 / Accepted: 18 March 2019 / Published: 21 March 2019
(This article belongs to the Section Sustainable Engineering and Science)

Abstract

:
Urban water bodies are limited by poor mobility, small surface areas, and little water supply; thus, they are sensitive to atmospheric nutrient inputs, especially during the optimal period of algae growth. This study investigated the impact of atmospheric deposition on the Quyang urban water body in Shanghai. Observations that coupled atmospheric organic matter, nitrogen and phosphorous and the actual urban water body (nutrient availability and Chlorophyll-a concentrations (Chl-a)) were conducted during spring and summer. Atmospheric total organic carbon (TOC), total nitrogen (TN), ammonia (N-NH4+) and total phosphorus (TP) deposition ranged from 35–81, 3–40, 0.79–20.40 and 0.78–0.25 mg m−2 d−1, respectively. The soluble N/P molar ratios of the bulk deposition (ranging from 56–636) were well above the Redfield ratio (N/P = 16). Nutrient inputs from atmospheric deposition have been suggested to be a strong factor for increasing the likelihood of P limitation in the water bodies. The actual loads to small, shallow urban water bodies were assessed and found to be ~50, 130, 130 (the N-fixation contributes to the atmospheric deposition inputs especially during the spring), and 80% of TOC, TN, N-NH4+, and TP, respectively, representing nutrients transferred into the water phase. The maximum primary production (evaluated as Chl-a) stock resulting in a 2-m-deep water column from the above inputs ranged from 2.54–7.98 mg Chl-a m−3. As a continuous source of nutrients, atmospheric deposition should not be underestimated as a driving force for urban water body eutrophication, and it potentially influences primary production, especially during the optimal algae growth period.

1. Introduction

Urban water bodies are constructed water systems surrounded by structurally and functionally continuous ecological units [1], such as in green spaces of parks and residential areas. As integral parts of the urban ecology, urban water bodies have added value by improving urban landscape aesthetics, ecology and human comfort [2,3]. However, most urban water bodies (especially landscape water bodies) are closed or semi-closed catchments [4] and usually have poor mobility and limited surface areas. Thus, they are susceptible to severe eutrophication and ecological deterioration with smaller water bodies experiencing more severe algae blooms. A previous study reported that nearly 62% of monitored urban water bodies around Shanghai were eutrophic and had experienced harmful algae blooms, while the rest were at high risk for blooms [5].
Nitrogen (N) and phosphorus (P) are widely believed to be the major nutrient, as well as the limiting factors of aquatic ecosystems [6]. Moreover, compared to other sources of N and P, atmospheric deposition was considered insignificant. However, recent studies suggest that atmospheric deposition can be significant sources of N and P. For example, in West Lake (Hangzhou, China), the average atmospheric nitrogen deposition between 2000 and 2004 was 4.45 mg m−2 d−1 [7]. From 2002 to 2003, over 48% of total nitrogen (TN) and 46% of total phosphorus (TP) supplied by rivers and waterways were of atmospheric origin [8]. Research on coastal waters in North America and Western Europe indicates that 20–40% or more of exogenous bioavailable nitrogen originated from the atmosphere [9]. In Shanghai (2005–2017), the average dry depositional particle flux ranged between 134.8–289.3 mg m−2 d−1 [10], which is much higher than most atmospheric deposition around the world [11,12]. Therefore, it is necessary to research the fluxes of atmospheric N and P deposition for urban water bodies, and urban water body restoration should not underestimate the atmospheric input of pollutants, especially nitrogen and phosphorus.
Usually, atmospheric deposition includes dry and wet deposition. Dry atmospheric deposition arises from gaseous and particulate transport from the air, and wet deposition occurs through rain and snowfall [13]. Numerous studies have shown that the atmospheric N deposition is mainly composed of nitrate/nitrite (NOx) and ammonia (NH3) [4]. Furthermore, it is TP rather than phosphate (PO4-P) being predominantly used in studies of the atmospheric P deposition, because the aquatic organisms (algae, bacteria and zooplankton) are able to rapidly acquire P in numerous ways, such as from their organic molecules and mineral sources [6,14].
An algal bloom is a long-term process of nutrient enrichment, algae growth, and buoyant and biomass surge, all under appropriate conditions. According to prior field observations, Cyanobacteria blooms have occurred most frequently from May to September in East Asia when the temperature ranges from 20 to 35 °C [13]. A 18-year study of Emerald Lake (Sierra Nevada, CA, USA) [15] observed a two- to three-fold increase in algal biomass under sustained atmospheric deposition as well as a shift from P limitation toward more frequent N limitation for phytoplankton abundance. Recent studies mainly focus on the depositional flux and chemical forms of TN and TP, size distribution, effects of wildfire, and ecological implications [16] in natural water systems, and less on the impact of this important nutrient source on local small, shallow urban water bodies. However, the effects of atmospheric nutrient deposition load on shallow lakes should be more significant than on deeper ones [13]. Eutrophication and ecological deterioration attributed to atmospheric deposition already occur in many urban water bodies with increasing frequency, declining its social and landscape aesthetic value.
In this study, the measurement of bulk deposition flux of organic matter, nitrogen and phosphorus are reported for a site close to the Quyang water body (urban area in Shanghai) during spring and summer, the optimal period for algal bloom formation. A simulated urban water body was used to estimate the forms and components of deposited organics and nutrients when transferred from the atmosphere to water bodies. Temporal variations in water quality and phytoplankton biomass (Chlorophyll-a concentration (Chl-a)) were also tested in both the simulated and Quyang water bodies simultaneously. The objectives of the present study can therefore be summarized as follows: (1) to determine the atmospheric contribution of organic matter and nutrients to the urban water bodies; (2) to investigate the reason for the forms and components differences among deposited organic matter and nutrients; (3) to estimate pollutants input impact on water quality deterioration of atmospheric deposition origin; and (4) quantify the maximum potential/possibility impact of atmospheric deposition on algal growth, especially during algal bloom.

2. Materials and Methods
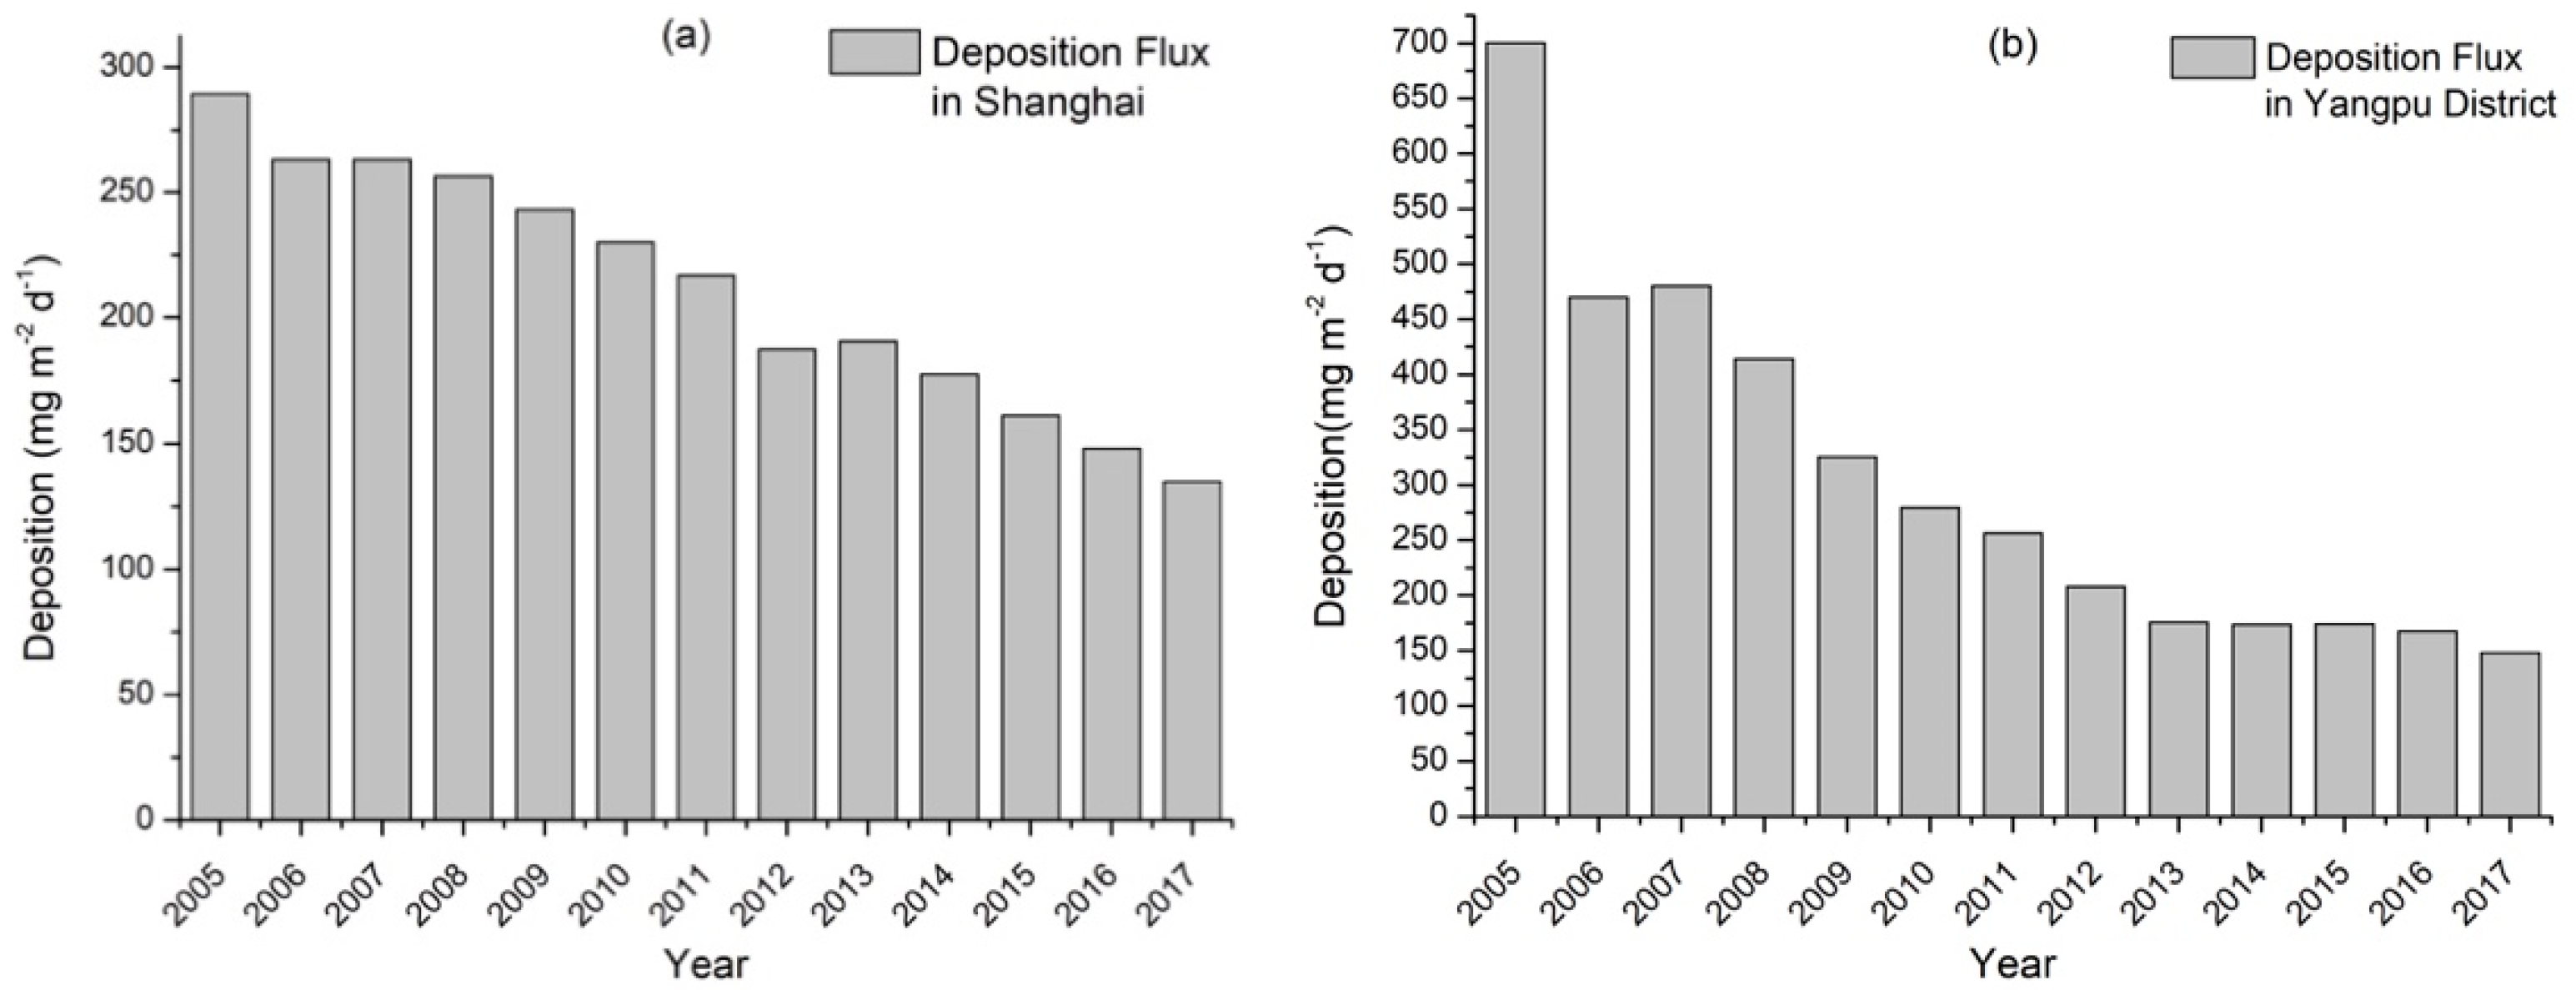
2.1. Sampling Site

The Quyang water body (31.28° N, 121.48° E) is a typical shallow, middle-sized reservoir located in an urban area of the Yangpu District, Shanghai. The circumference of the water body is about 370 m and the area is about 8260 m2 with a mean depth ranging from 1.8 to 2.0 m. The water body is enclosed, not connected to the river channels outside of the Quyang park, with the rainwater serving as the main water source. In addition, interception pipes are built along the banks of the water body to intercept natural rainfall and surface runoff to reduce water pollution.
Furthermore, we used the shoreline development factor (SDF) to estimate the shape of the water body. SDF calculates an index of irregular shape by comparing each lake to a perfect circle based on its area and perimeter length:
S D F =   s h a p e   l e n g t h   2 π × × s h a p e   a r e a     ,
Usually, the SDF approaches 1 as the shape becomes closer to a perfect circle, and increases as the tortuosity of the shoreline increases. The SDF of Quyang water body is 1.15, which means the water body has a simple shape (Figure 1).
Although annual average atmospheric deposition flux in the Yangpu District has experienced a decline since 2001, it is still above the average of Shanghai (Figure 2). The water quality of the Quyang has already deteriorated and it is sensitive to harmful Cyanobacteria blooms. Shanghai has a temperate monsoon climate. The average precipitation is 1150 mm, about 70% of which is distributed during May to September. Mei-yu, a special meteorological phenomenon in Shanghai (located in Yangtze River Delta), has higher precipitation from June to early July, leading to greater aerosol removal by wet deposition [13]. The averaged nutrient concentrations in wet deposition for N-NH4+, N-NO3, TN, P-PO43−, and TP are 1.33 mg L−1, 0.53 mg L−1, 2.43 mg L−1, 0.016 mg L−1, and 0.030 mg L−1, respectively [17].

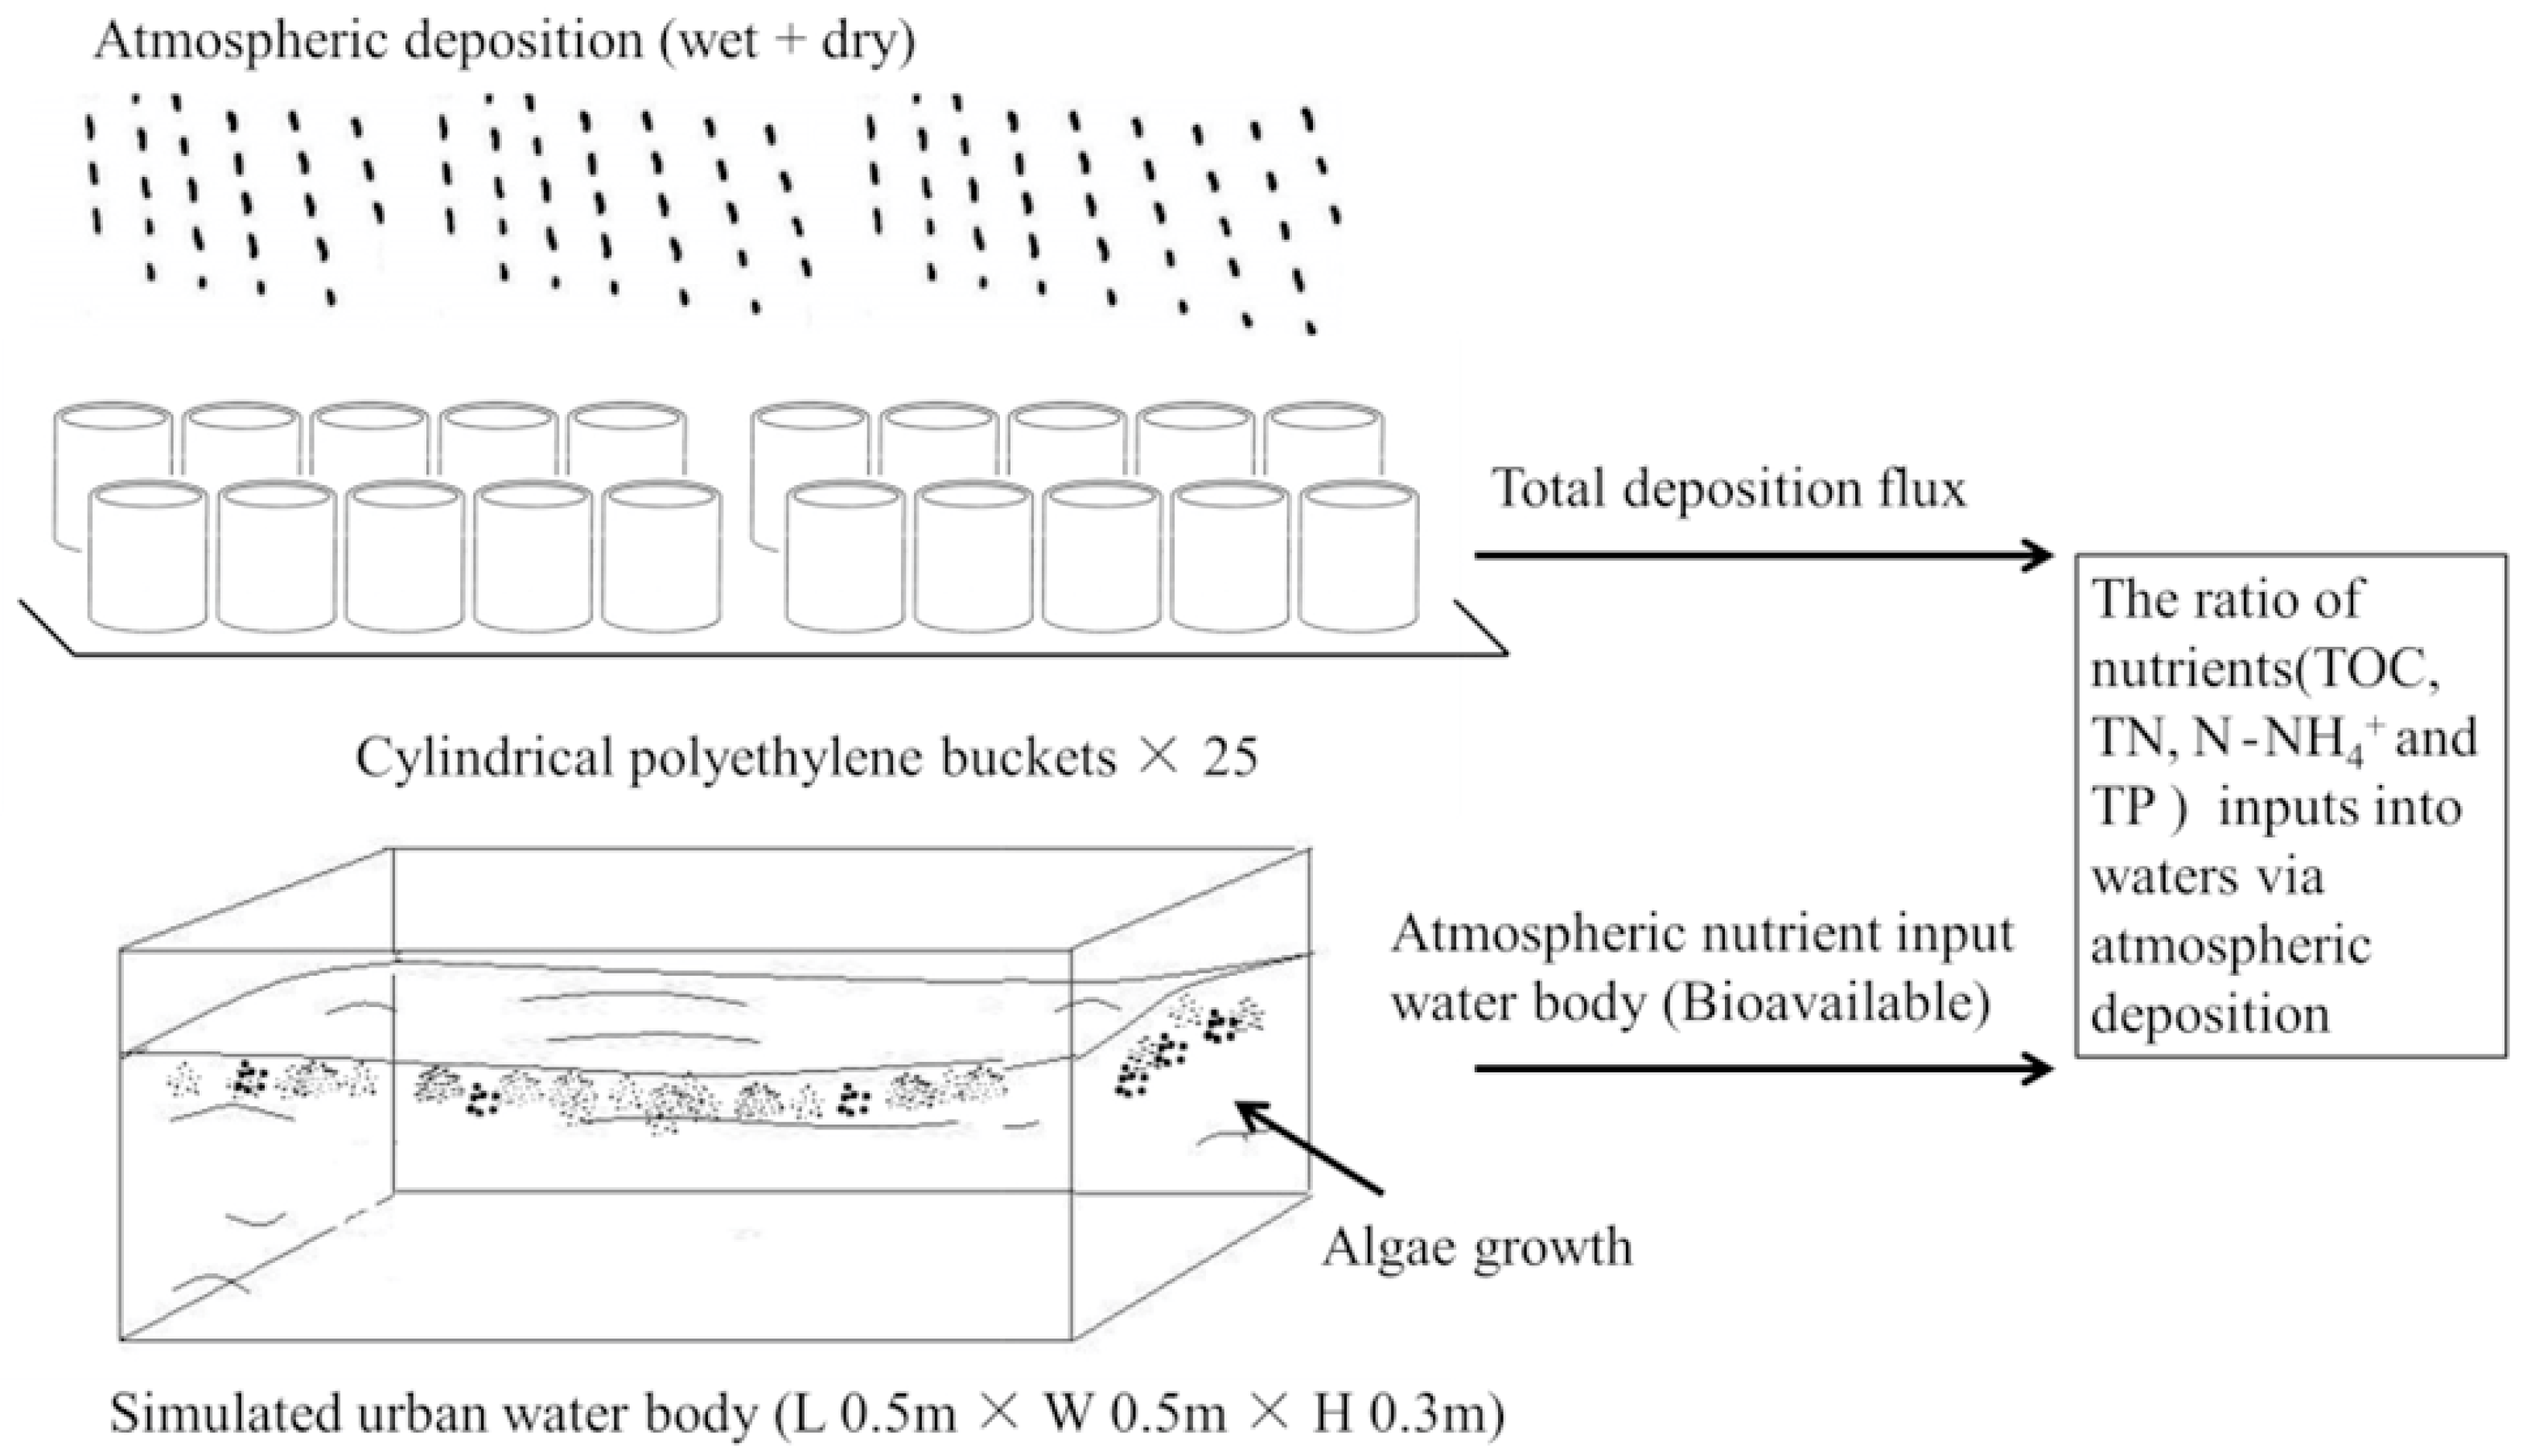
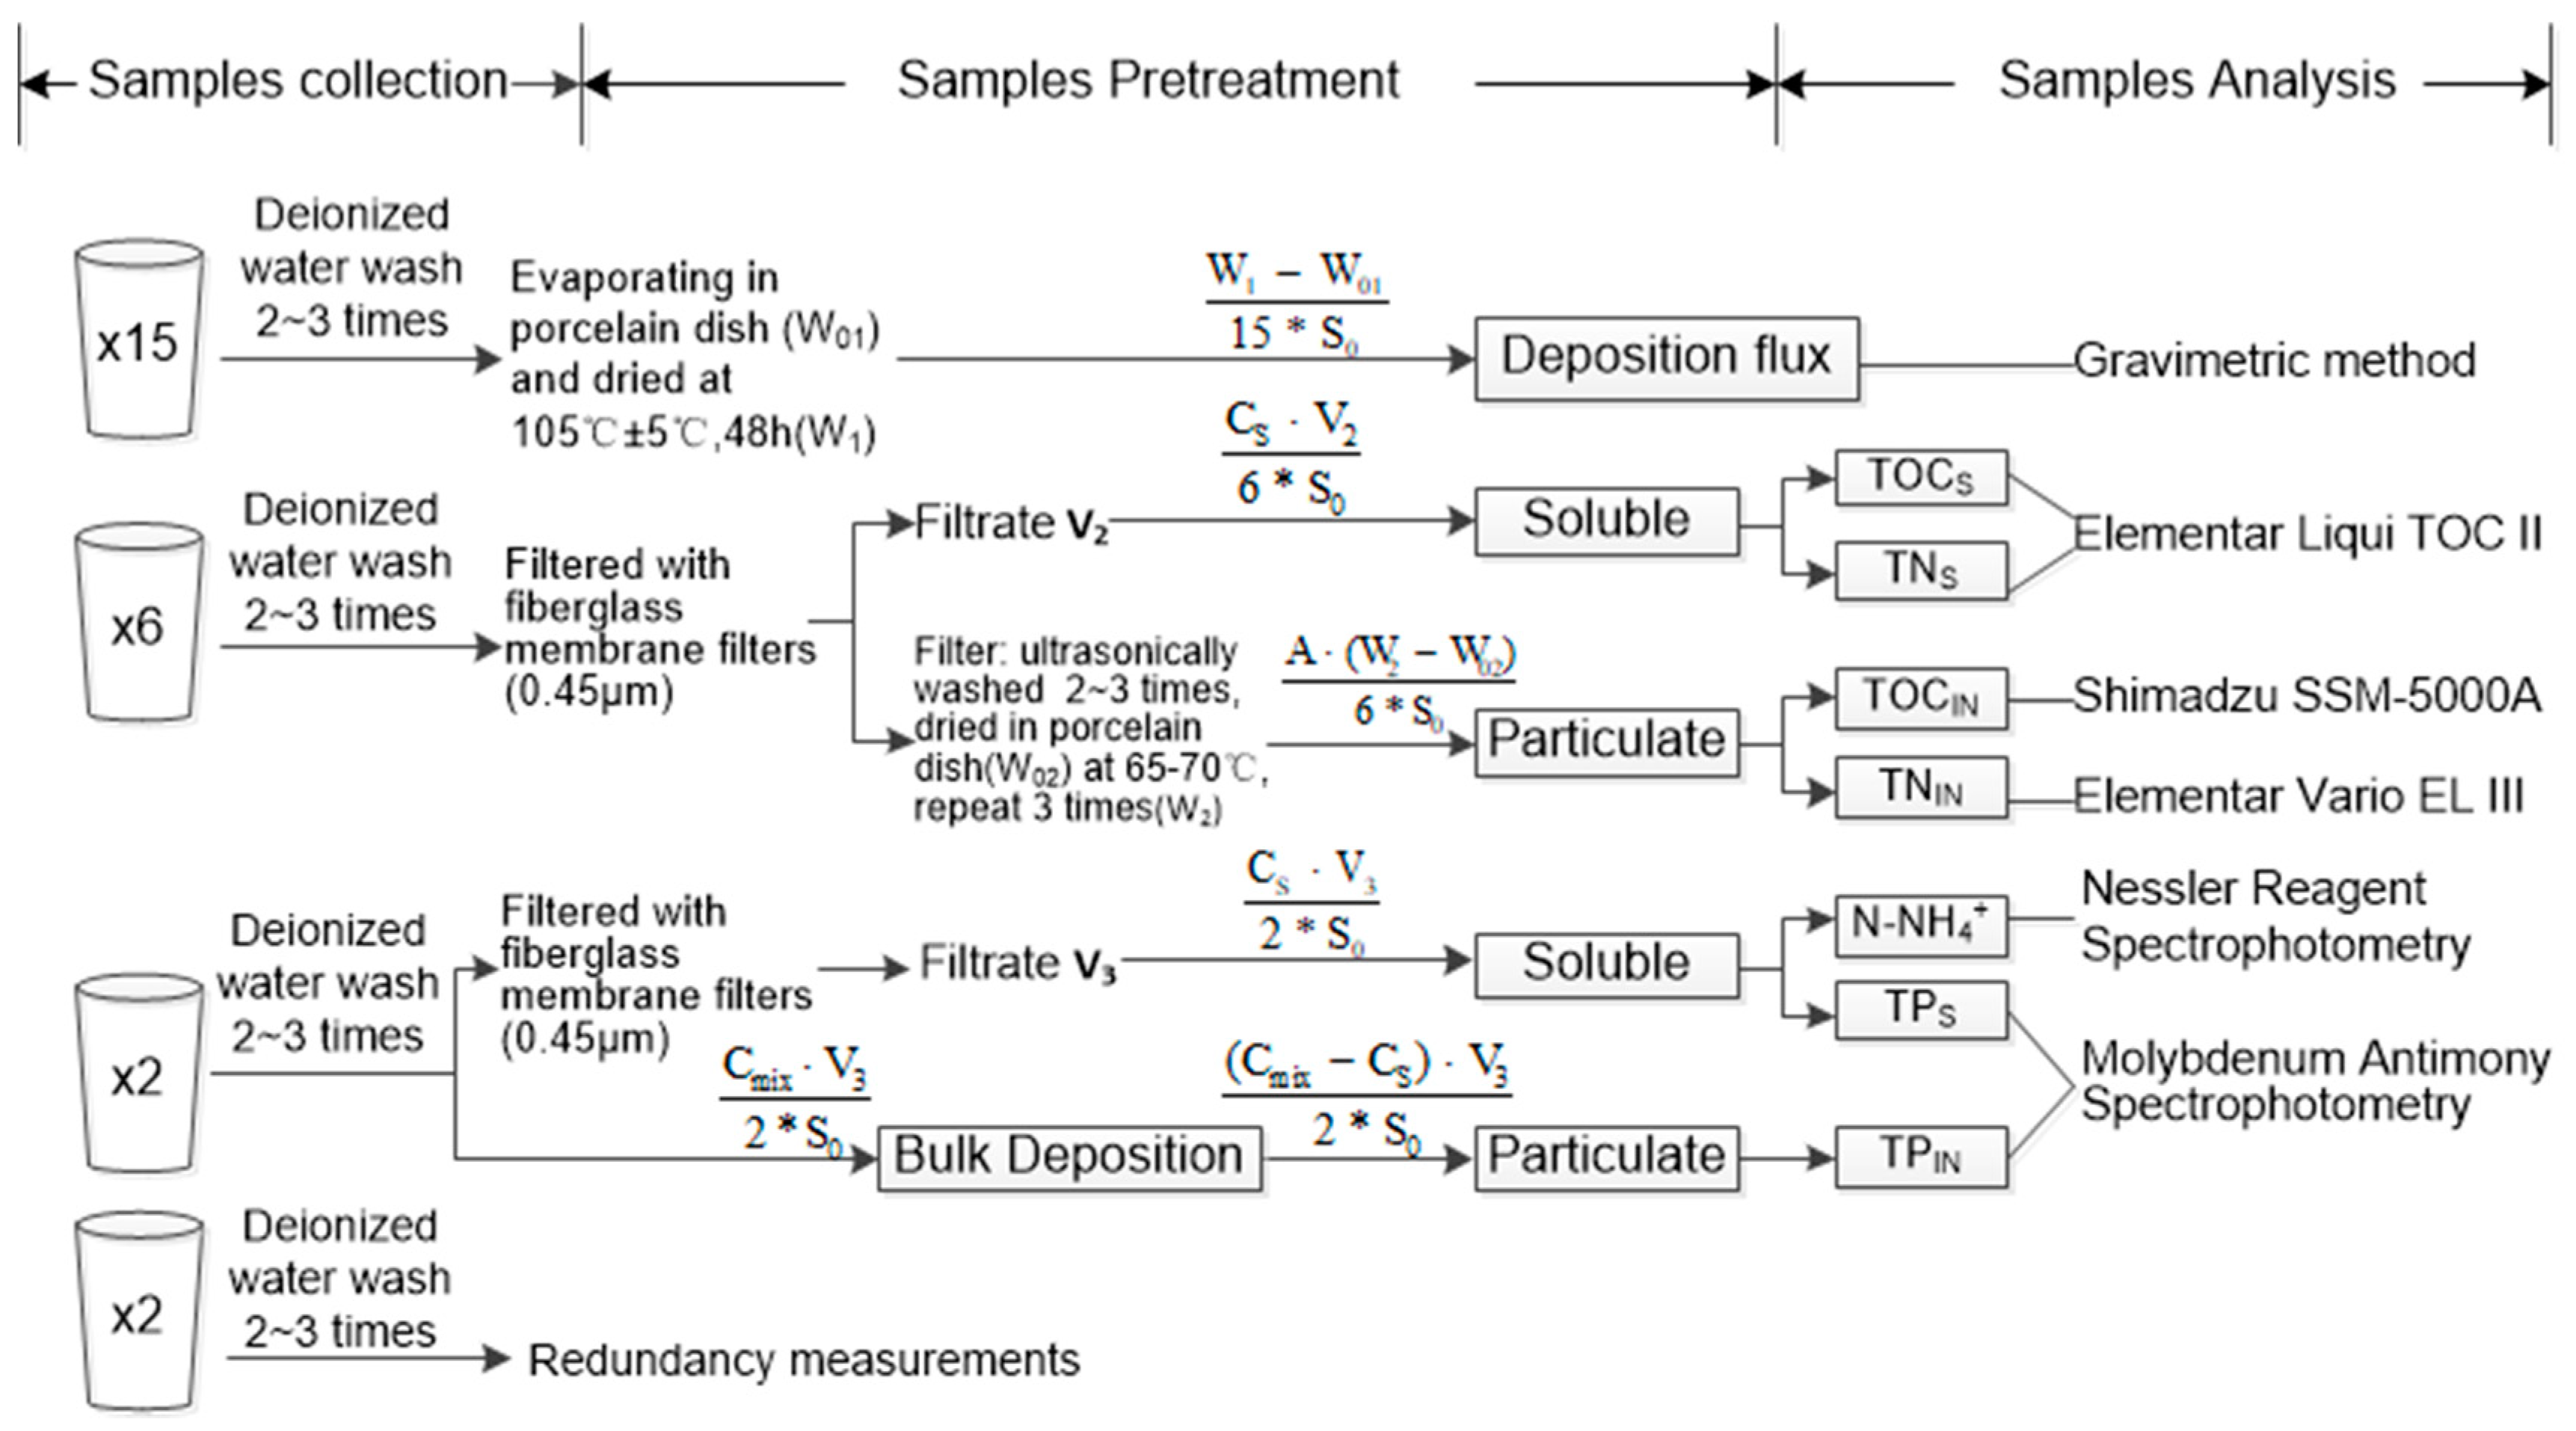
2.2. Sample Collection and Preparation

Atmospheric particulate matter samples were collected close to the Quyang water body during spring and summer (from March to July). The study area is a typical integrated transportation, residential and recreational area (Figure 1). As Figure 3 shows, 25 cylindrical polyethylene buckets were used to collect bulk atmospheric deposition samples. The polyethylene buckets measured ϕ190 (diameter) × 260 (height) mm and were placed in steel sampling racks about 2 m above the water surface [13].
At the same time, a simulated urban water body (L 0.5 m × W 0.5 m × H 0.3 m) was used to estimate the fate of TOC and nutrients during the atmospheric deposition sampling period and was placed in steel sampling racks as well. Deionized water (12.5 L) was added to the simulated water body and was then collected together with the deposition samples. The final sample volume was precisely measured. All samples were immediately brought to the laboratory for TOC, TN, TP, and N-NH4+ analysis.

2.3. Sample Testing Method

Bulk atmospheric deposition was collected and monitored as Akkoyunlu [19] and Santos [20] reported (Figure 4). Fifteen buckets were used for deposition flux testing, six for total organic carbon (TOC) and total nitrogen, two for ammonia nitrogen (N-NH4+) and total phosphorus, and two for redundancy measurements. Samples were collected around every 10 days. Buckets were washed three times with deionized water to ensure that the contents were completely transferred into a graduated flask. Then, the sample volume was precisely measured.
Samples were filtered through a fiber glass membrane filter (0.45 μm pore-size). The filtrate was analyzed for soluble organic carbon, nitrogen, ammonia, and phosphorus content. The fiber glass filters were ultrasonically washed 2–3 times with deionized water then dried in porcelain evaporating dishes at 65–70 °C. This process was repeated three times until the weight of evaporating dishes remained constant for insoluble organic and nitrogen analysis. Total mixture and soluble phosphorus were determined by persulfate oxidation and spectrophotometry [13] (Figure 4).
Temporal variations in water quality and phytoplankton biomass (evaluated by Chl-a) were also tested in the Quyang water body. There are three sampling sites located in typical areas (Figure 1). Water samples were all collected at 0.5 m under the water surface around every 10 days simultaneously with the deposition samples. All samples were immediately brought to the laboratory for TOC, TN, TP and N-NH4+ analysis. TOC was analyzed by the combustion oxidation non-dispersive infrared absorption method (Elementar Liqui TOC II). TN was analyzed using the Elementar Liqui TOC II. TP and N-NH4+ were analyzed by the molybdenum antimony spectrophotometry and the Nessler reagent spectrophotometry, respectively. Chl-a was analyzed on site by Modulated Chlorophyll Fluorescence (Walz, Germany).

2.4. Calculation and Analysis

Assuming no physical, chemical, and biological reactions occur in the bucket, the bulk atmospheric deposition flux calculation can be calculated as follows:
F = W 1 W 01 N f l u x · S 0 ,
where F is the bulk atmospheric deposition flux for every sampling period (mg m−2 10 d−1), W 1 is the total weight (mg) of the porcelain evaporating dish and samples after drying at 105 °C ± 5 °C, W 01 is the pre-analysis weight (mg) of the porcelain evaporating dish after drying at 105 °C ± 5 °C, S 0 is the surface area of the bucket (m2), and N f l u x is the number of buckets collector for bulk atmospheric deposition flux testing.
Soluble and insoluble matter have different fates and transformation pathways from the atmosphere into water [12]. Thus, both aspects were tested in this study. The atmospheric deposition flux of soluble and insoluble TOC, TN, TP and N-NH4+ can be calculated as follows:
F j = ( F s ) j + ( F i ) j = ( C s ) j · V + ( A i ) j · M N j · S 0 ,
( F i ) T P = F T P ( F s ) T P = [ ( C b u l k ) T P ( C s ) T P ] · V N T P · S 0 ,
where F j is the bulk atmospheric deposition flux of TOC, TN, TP or N-NH4+ for every sampling period (mg m−2 10 d−1); ( F s ) j is the flux of soluble TOC, TN, TP or N-NH4+ (mg m−2 10 d−1); ( F i ) j is the flux of insoluble TOC, TN or TP (mg m−2 10 d−1); ( C s ) j is the concentration of soluble TOC, TN, TP or N-NH4+ (mg L−1); ( A i ) j is the percentage of insoluble TOC, TN or TP in total weight (%); ( C b u l k ) T P is the concentration of TP in the bulk deposition samples (mg L−1); V is the filtrate volume (m3); M is the weight of total insoluble matter (mg); S 0 is the surface area per cylindrical polyethylene bucket (m2); and N j is the number of buckets used for sample collection.
The accumulated TOC, TN, TP and N-NH4+ amounts via atmospheric deposition into the simulated urban water body can be calculated as follows:
F 0 = C · V C 0 · V 0 S ,
where F 0 is the accumulated TOC, TN, TP or N-NH4+ amount via atmospheric deposition into the simulated urban water body (mg m−2 10 d−1); C and C 0 are the concentrations of each component (mg L−1) in the beginning and end of the simulated water experiment; V and V 0 are the volumes of the simulated water (m3) in the beginning and end; and S is the bottom area (m2) of the simulated water body.

3. Results and Discussions

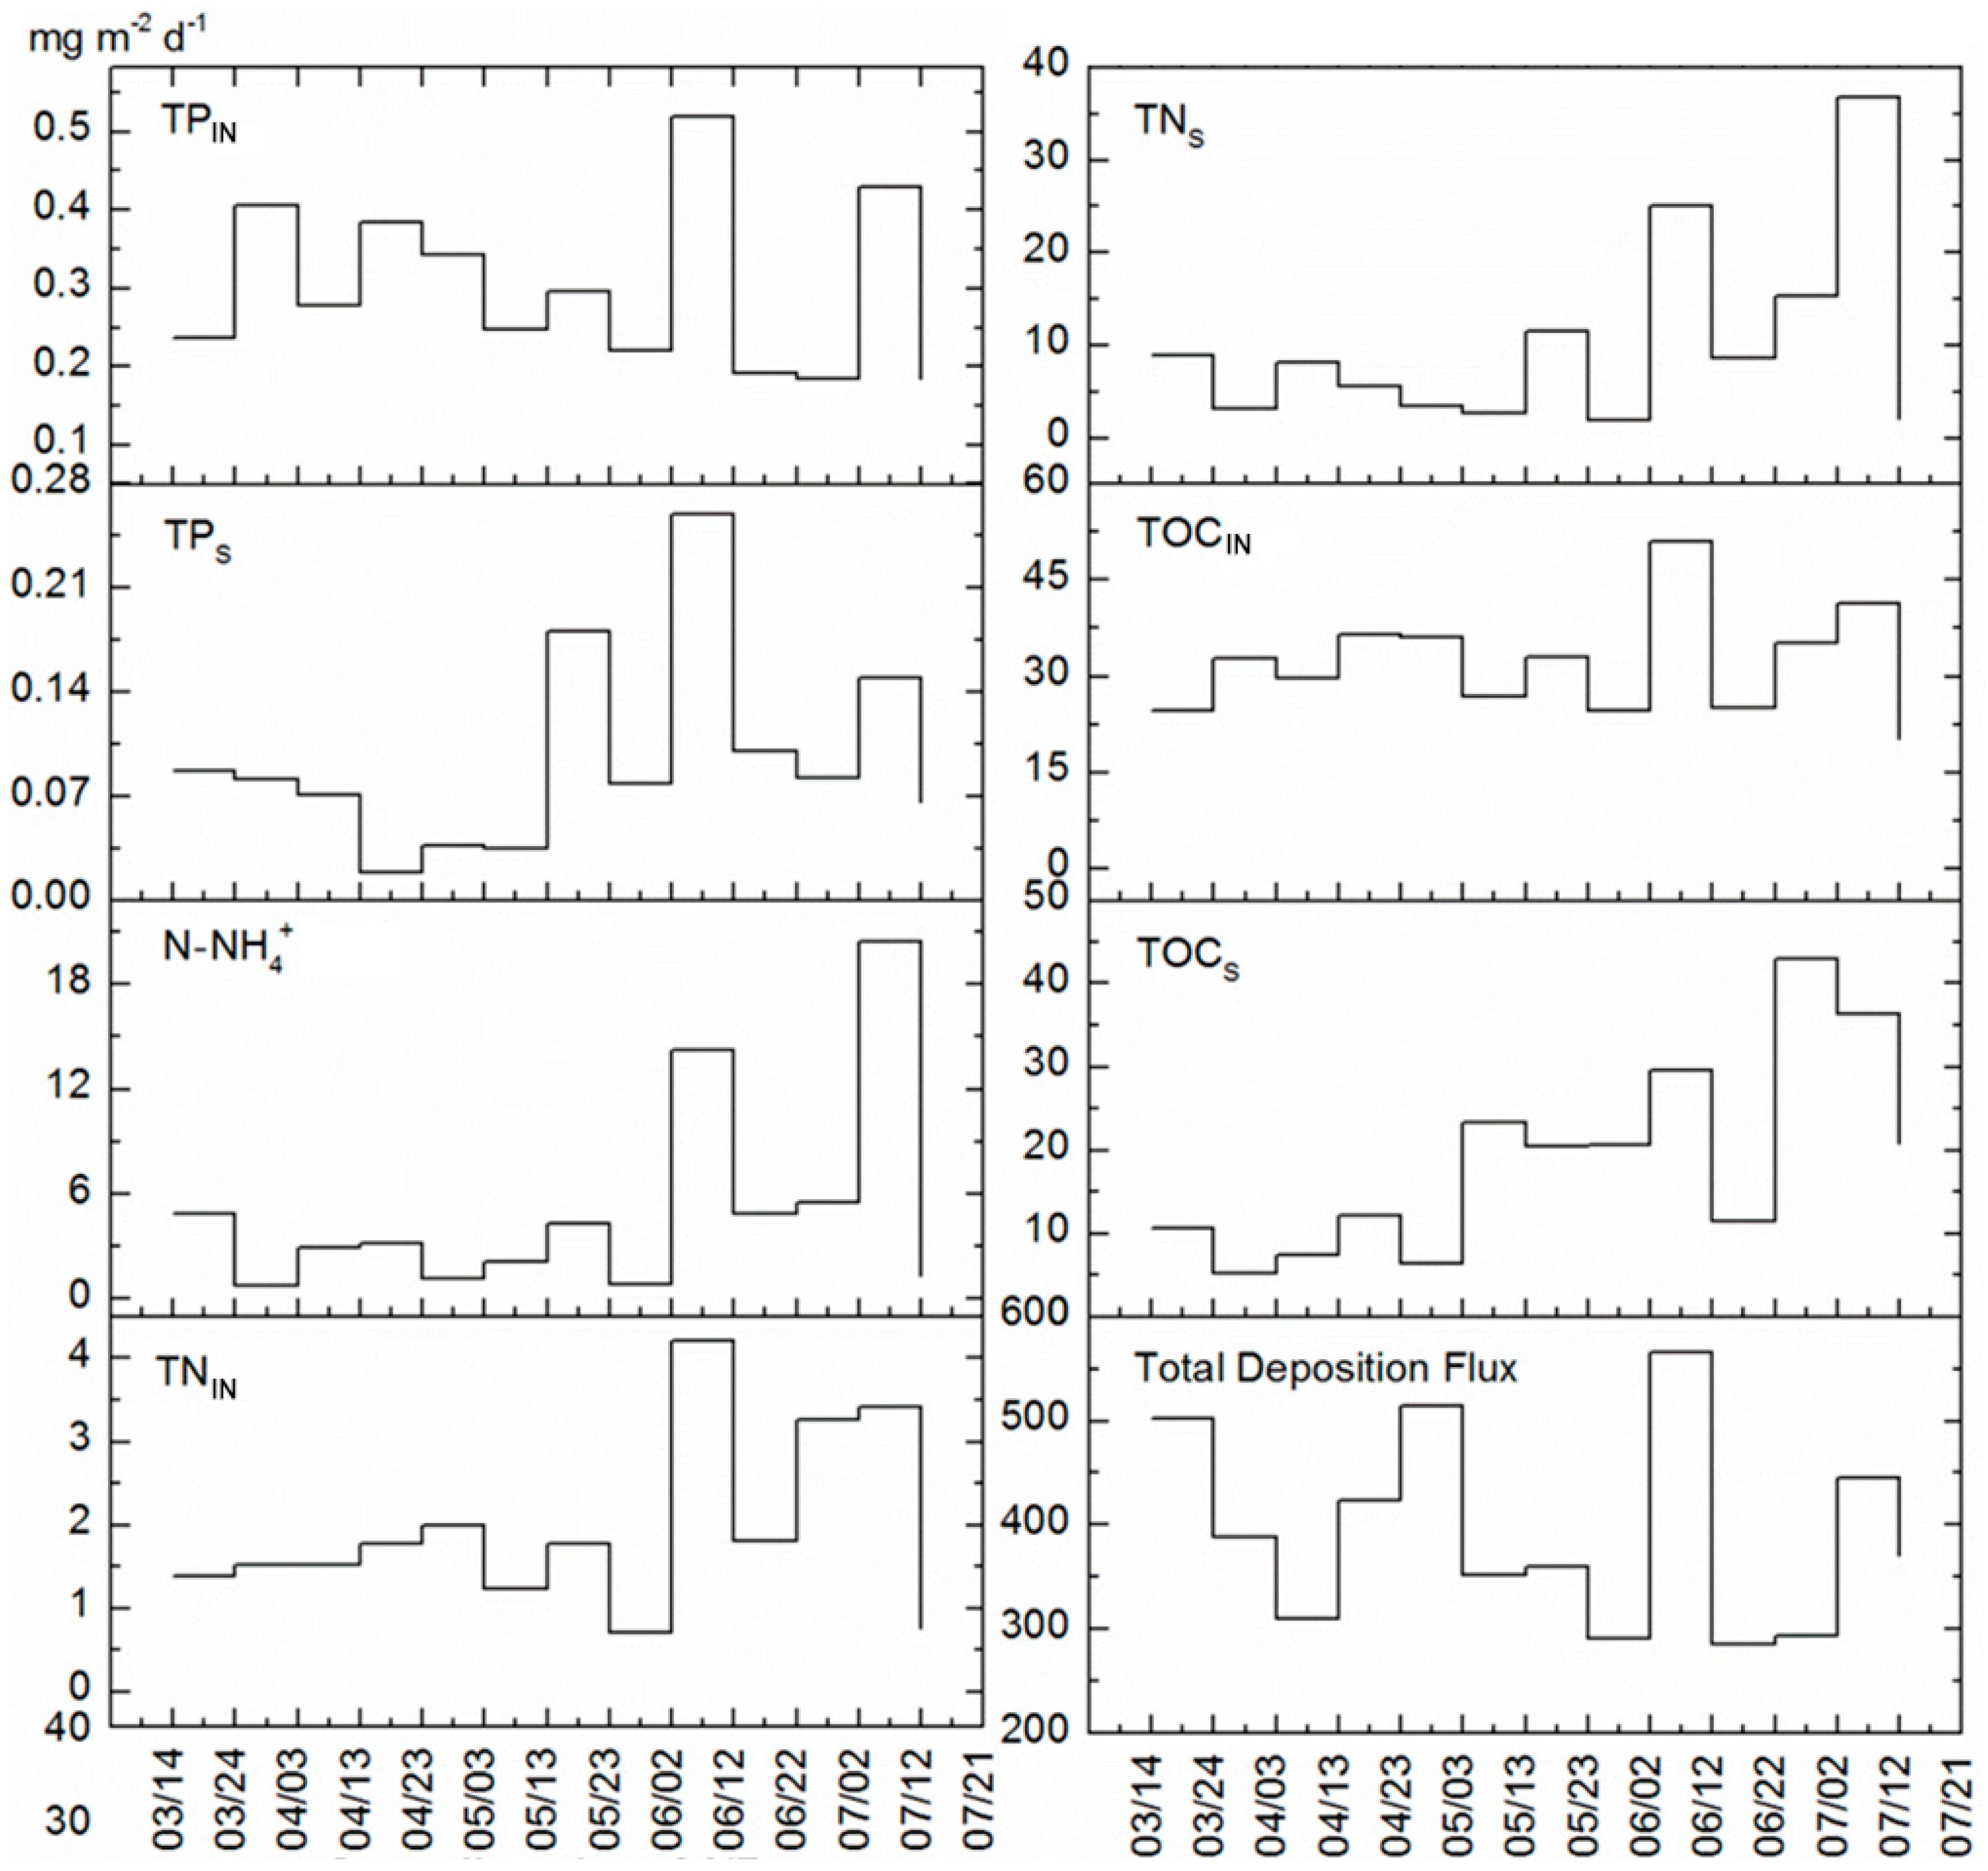
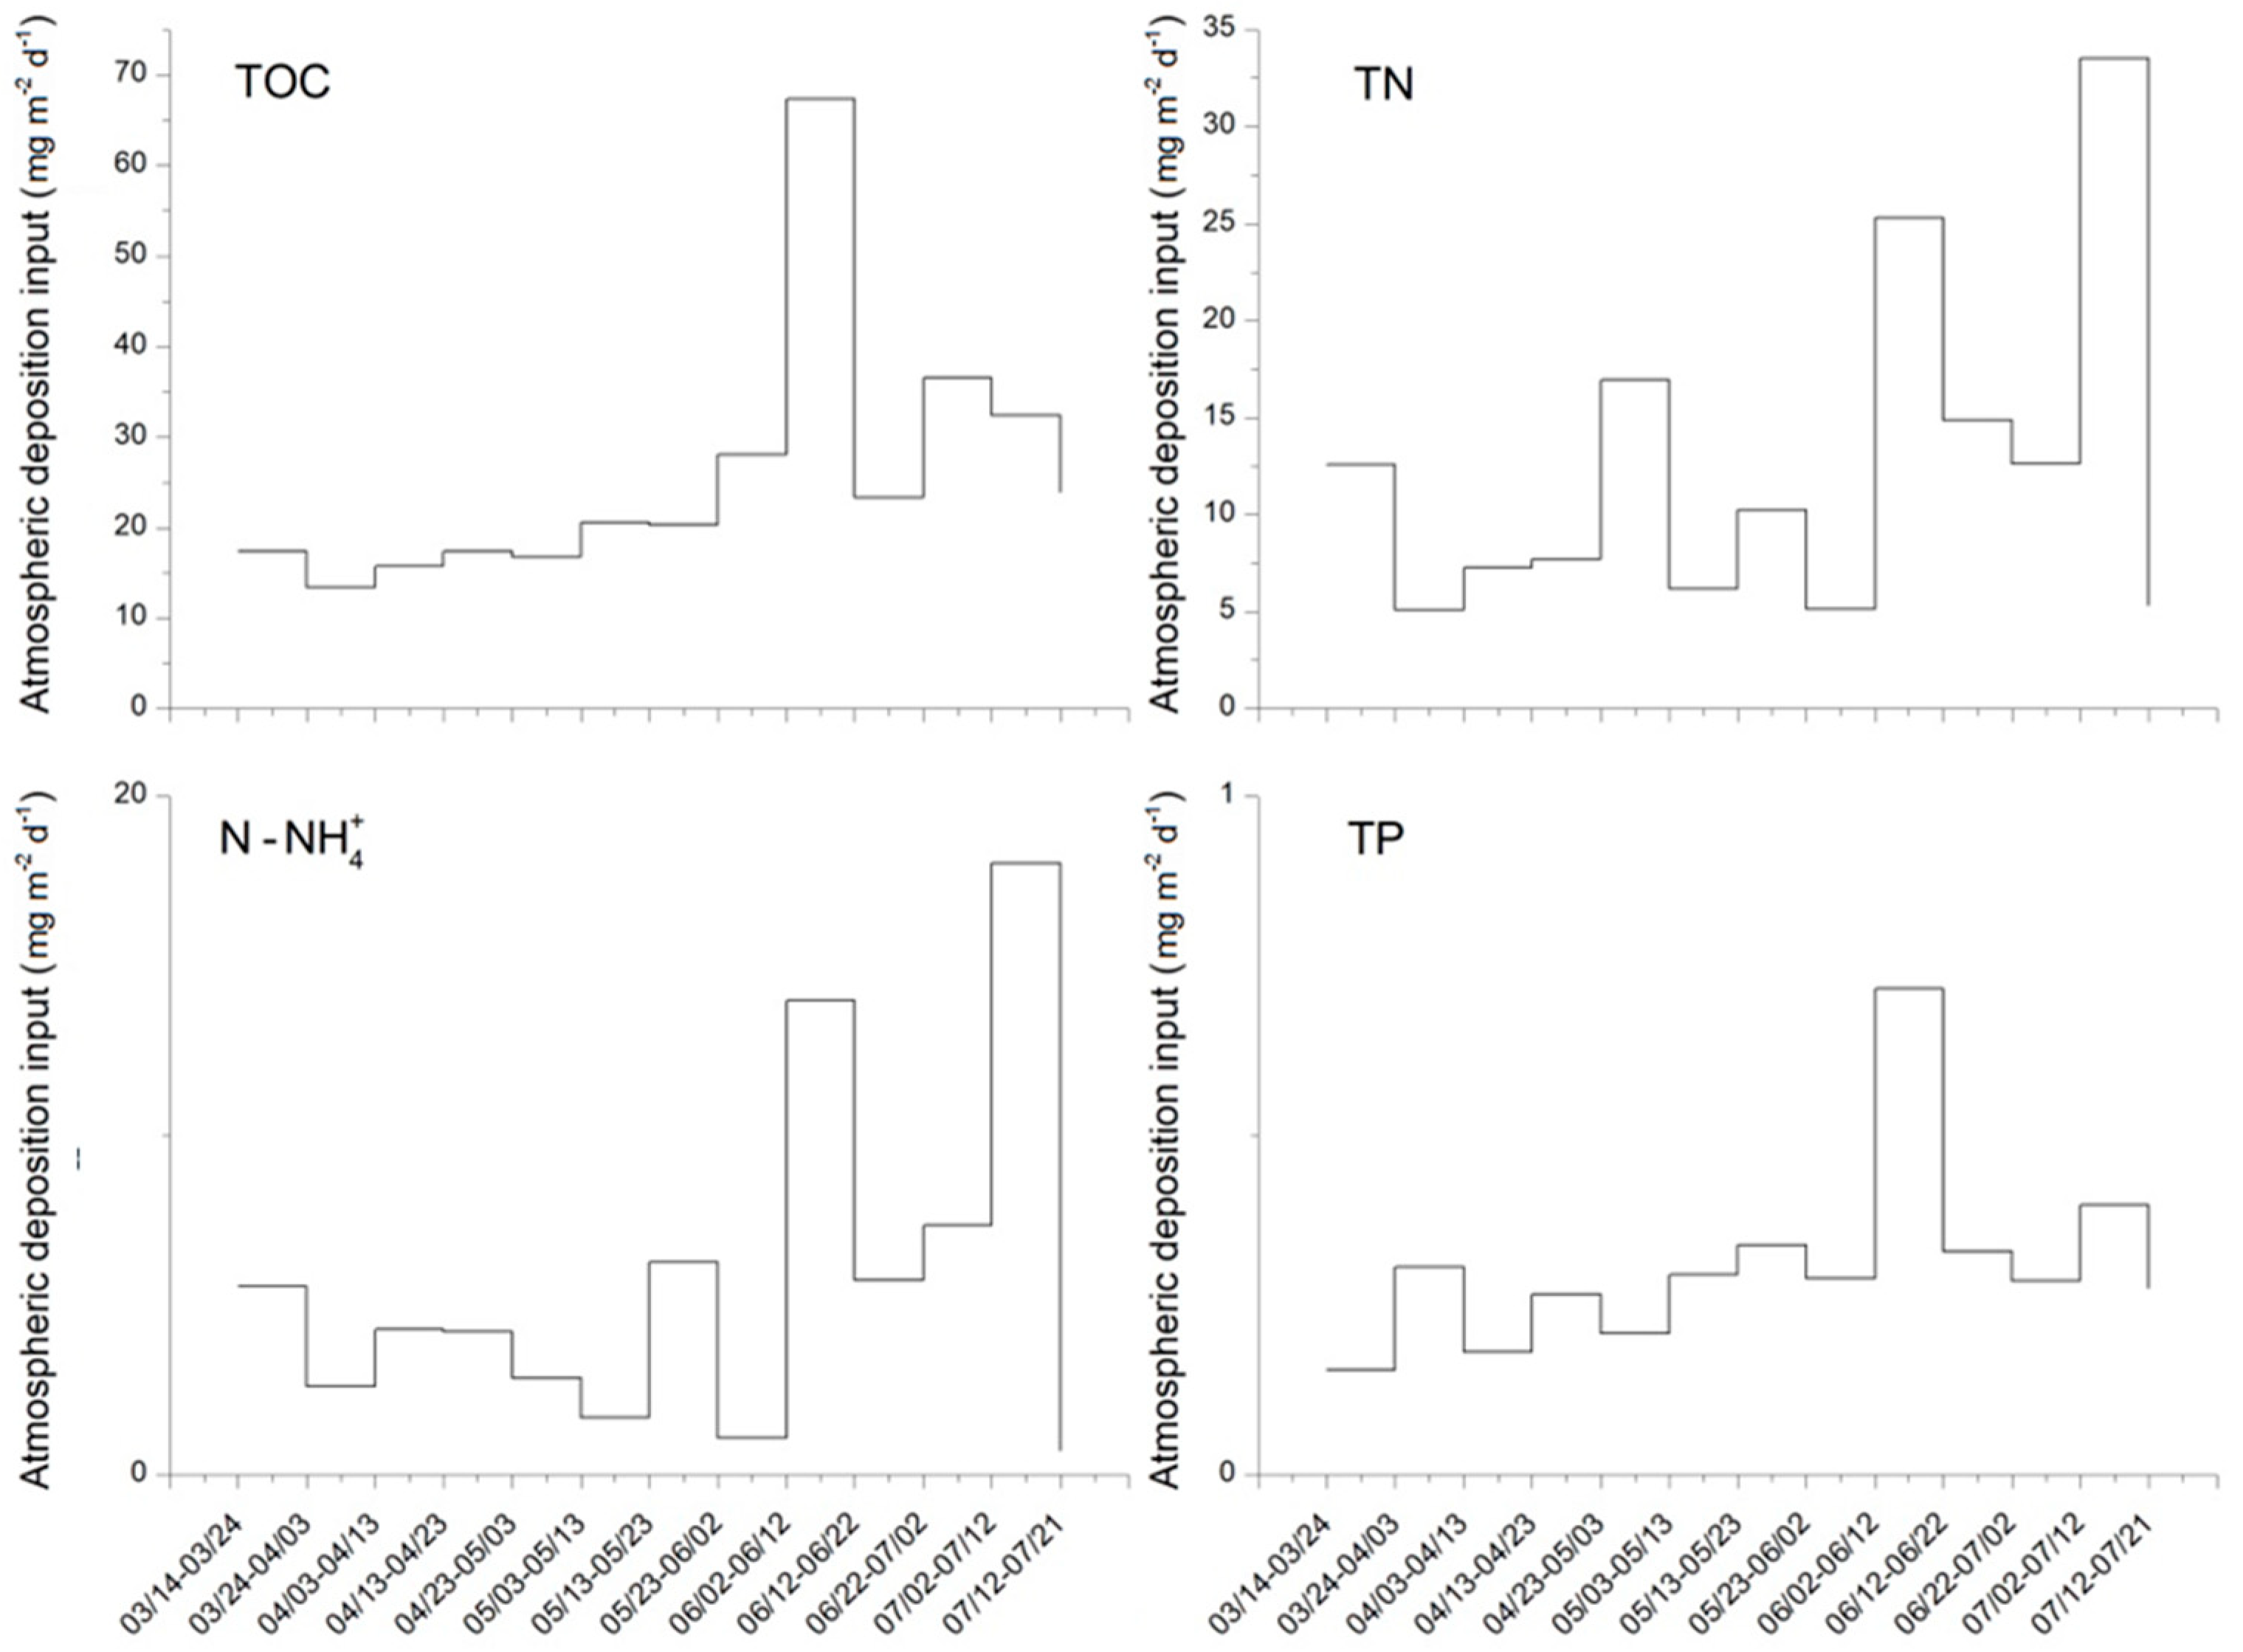
3.1. Deposition Rates of Atmospheric TOC, Nitrogen and Phosphorus

“Time series” of total and nutrient-specific atmospheric deposition rates are shown in Figure 5. Atmospheric deposition flux during the study ranged from 285–566 mg m−2 d−1 with a mean value of 392 ± 92 mg m−2 d−1. The average flux in summer (June–July) was higher than in spring (from March to May) and was a combined result of precipitation influences and air mass origins [21]. Fuel combustion emissions from urban transportation are the main sources of pollutants that are affected by traffic flow, exhaust particulate matter and road dust emission [22]. Shanghai has a temperate monsoon climate. Mei-yu, a special meteorological phenomenon in the middle and lowland areas of the Yangtze River in China, has higher precipitation from June to early July, leading to greater aerosol removal by wet deposition [13].
Atmospheric TOC deposition ranged between 35 and 81 mg m−2 d−1 and was mostly composed of insoluble TOC (TOCIN) (32 ± 8 mg m−2 d−1). TN atmospheric deposition (12 ± 11 mg m−2 d−1) had an enrichment period in June–July. Atmospheric ammonia deposition ranged between 1 and 25 mg m−2 d−1 with an average of 49 ± 15% of ammonia accounting for soluble TN (TNS). Atmospheric TP deposition averaged 0.40 ± 0.15 mg m−2 d−1, which is nearly an order of magnitude higher than values observed in northern Lake Taihu [21] and in the Sierra Nevada National Park [23]. However, these areas are less urbanized and relatively sheltered from local sources of aerosol particles compared with Shanghai. Therefore, potential nutrient sources from atmospheric deposition and its subsequent eutrophication deserve more attention [11,12]. During the optimal algal growth period (June–July), the average TN deposition rate was 20 ± 14 mg m−2 d−1 and average TP was 0.43 ± 0.24 mg m−2 d−1. Such values are nearly three-fold higher than those observed in northern Lake Taihu [13], but similar to those in Lake Sihwa (South Korea) [24].
There were some differences between atmospheric TN and TP deposition. Soluble TN (TNS) and soluble TP (TPS) in aquatic ecosystems were assumed to be more biologically available for algae growth with regard to eutrophication studies. However, the percentage of TNS and TPS within the overall TN and TP differ. TP apparently varies with ranges from 64–91% and 5–38%, while the percentage of TNS changed little and averaged 83%. Similar to Lake Taihu [13], atmospheric TN deposition samples above the Quyang urban water body were mostly composed of TNS with a small amount of insoluble TN (TNIN). Further isotope analysis showed that δ15N values derived from deposited NH3 ranged from −1.8 to 1.0% and nitrate varied between −0.2 and 2.4% in July. This is closely linked to increasing emissions from the volatilization of human and animal excreta and vehicle fuel combustions during the summer in urban areas, where it is then removed from the atmosphere by wet deposition during frequent precipitation [25,26]. Compared with TN, the percentage of TPS averaged 24%, indicating that more insoluble TP (TPIN) is present in atmospheric deposition samples during this period [16]. Strong human activity could increase the release of TPIN, which is then removed by frequent rainfall in summer [8]. The average percentage increased from 19% in spring to 30% during the optimal period for algal bloom formation.

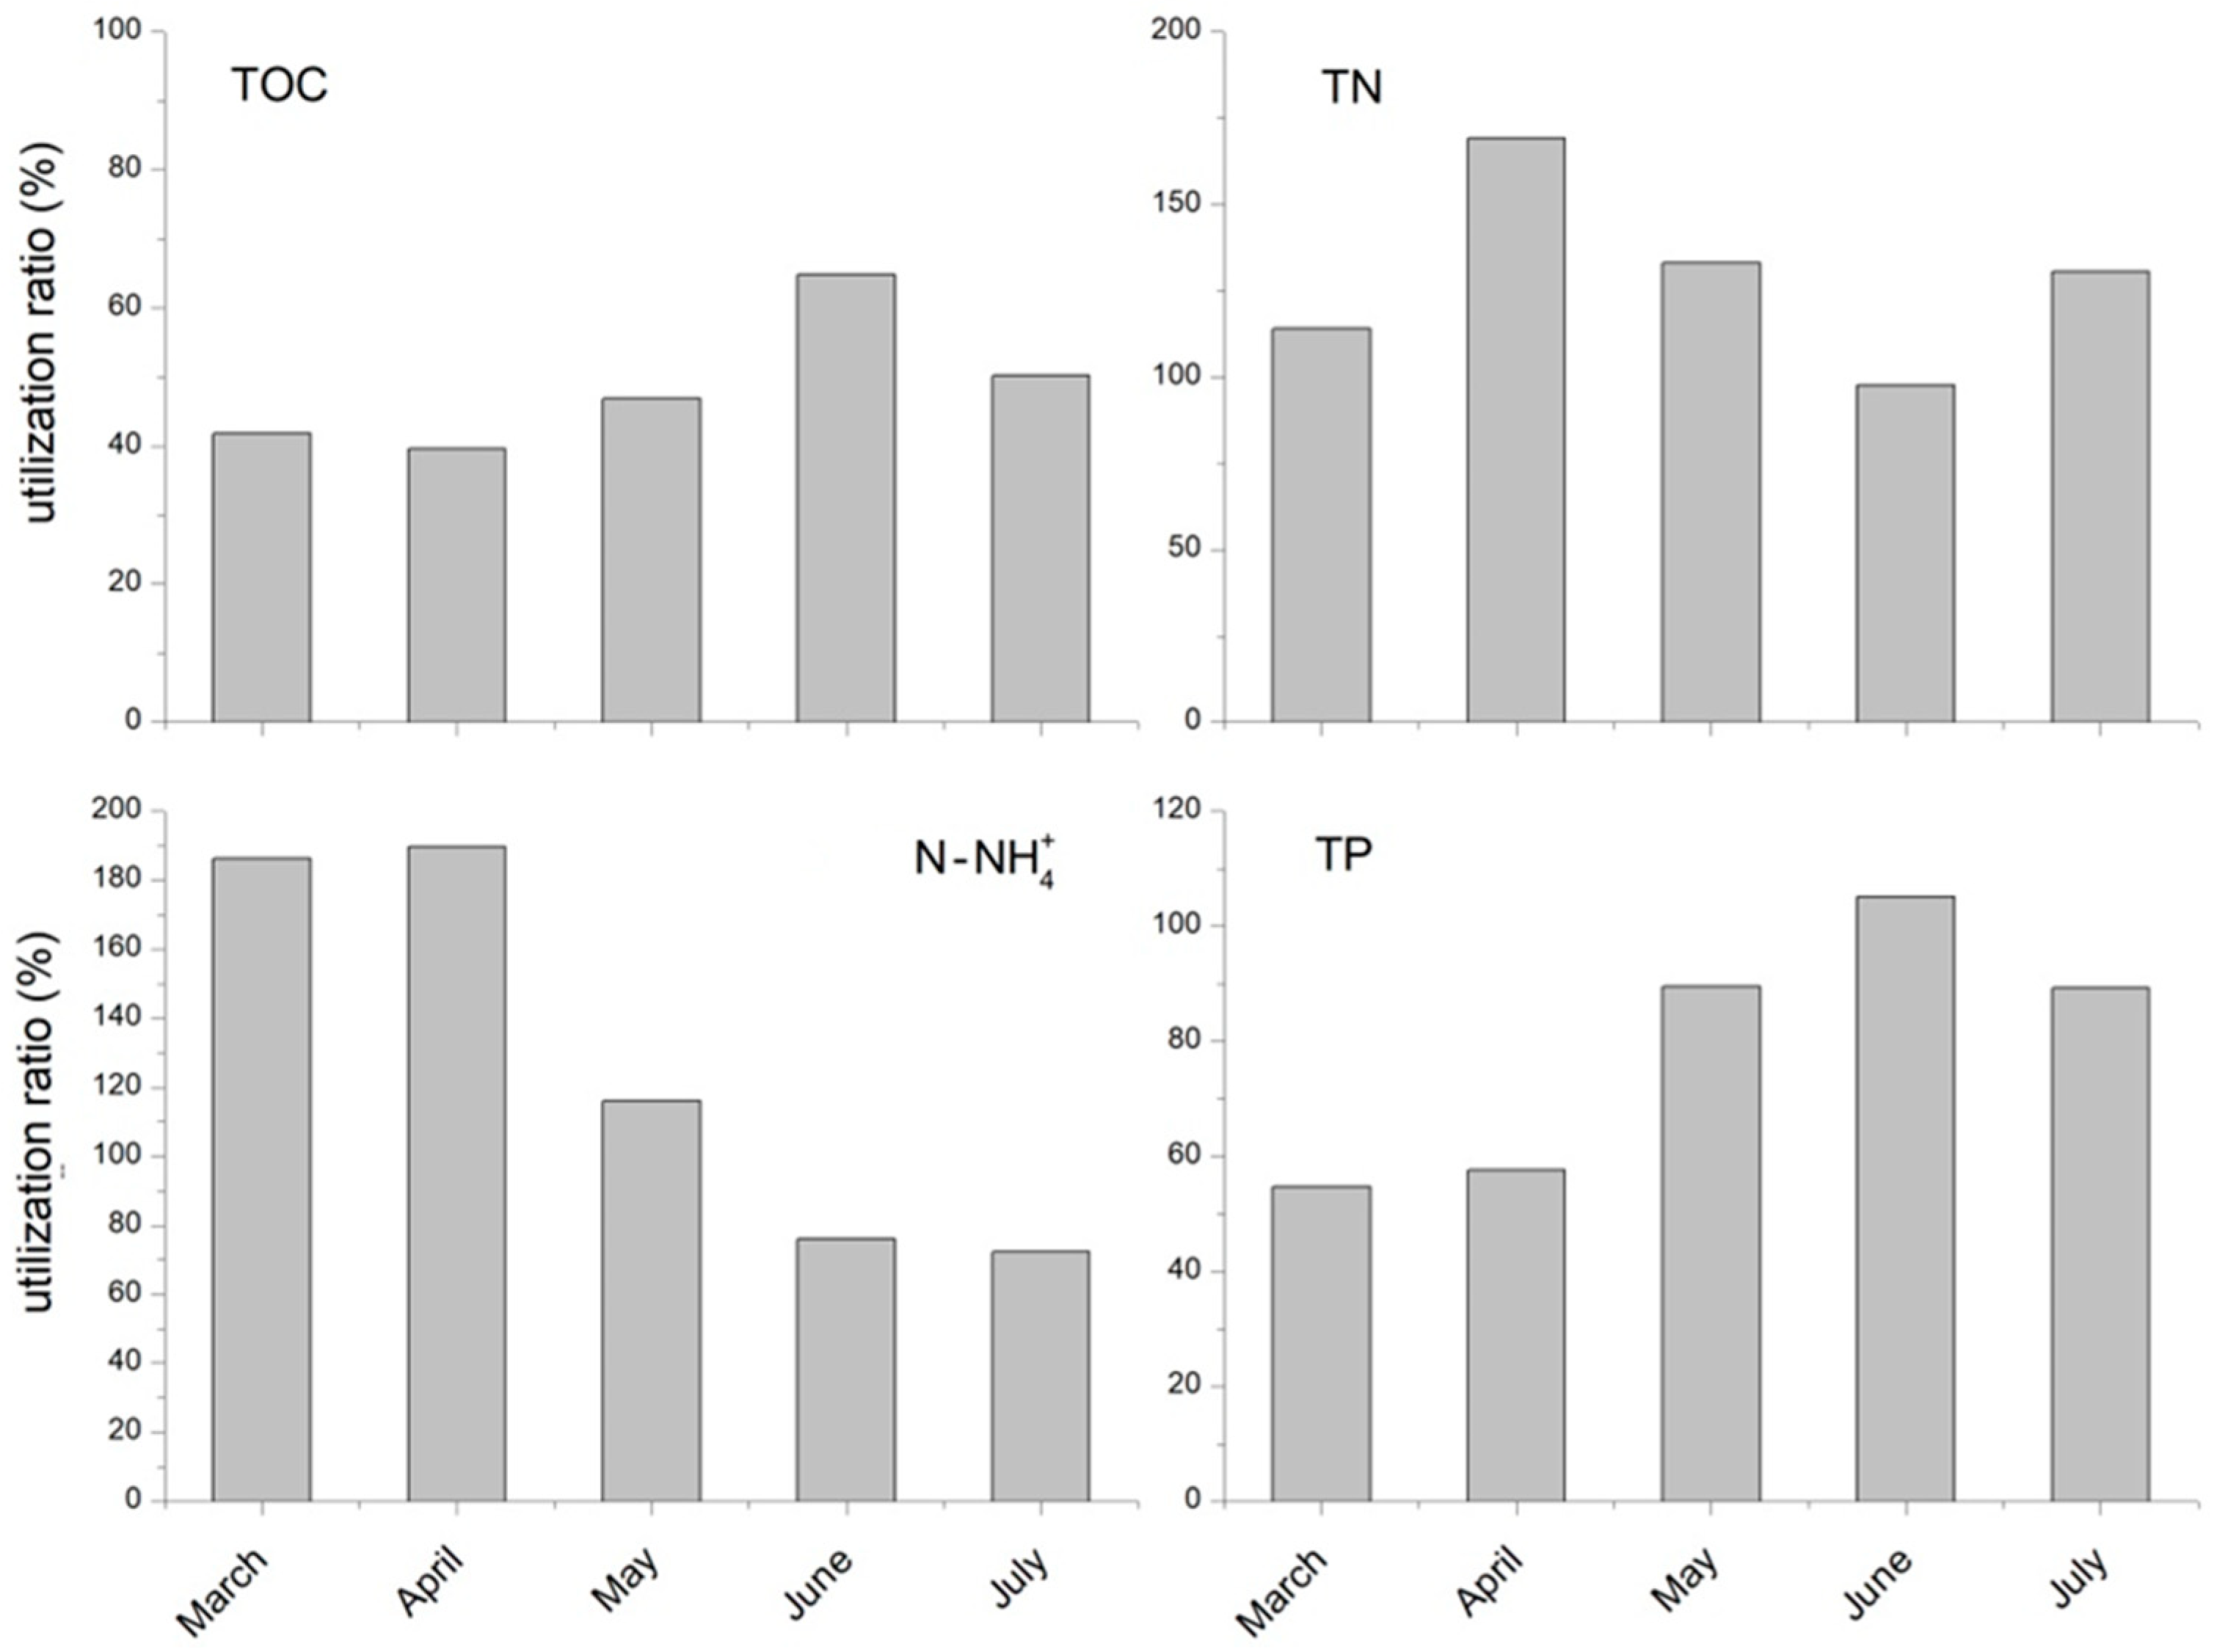
3.2. Estimation of Atmospheric Nutrient Input Loading to Shallow Urban Water Body

“Time series” of atmospheric deposition inputs of TOC, TN, N-NH4+ and TP are shown in Figure 6. Total amounts of atmospheric TOC, TN and TP deposition above the Quyang urban water body from March to July were 66, 16 and 0.52 kg, respectively. Nutrient input via atmospheric deposition can reach 8–12% in Lake Taihu [21] and 22% in Waquoit Bay [27], and enhance phytoplankton biomass by 16–26% [12,24]. Its effect on water quality deterioration and eutrophication deserves more attention, especially in small, shallow urban water bodies [13].
The simulated water body was used to estimate the fate of TOC and nutrients by considering only one factor, the atmospheric deposition input. Total amounts of TOC, TN, N-NH4+ and TP in the simulated water body are shown in Figure 7. The average utilization ratio of TOC, TN, N-NH4+ and TP inputs into waters via atmospheric deposition were 49 ± 14%, 132 ± 68%, 139 ± 73% and 80 ± 24% of that in the atmospheric samples, respectively. The values could be influenced by the differences of the distribution coefficient, physical solubility and diffusive velocity among those contaminants, as nitrogen is higher than organic matter and phosphorus [28]. It is worth noting that the utilization ratio of TN and N-NH4+ exceed 100% in spring (March and April), while TP exceed 100% in summer (June). The reason may be the nitrogen fixation of cyanobacteria in surface water [29,30] and the release of sediments, which require further study. Literature shows that the total nitrogen fixation rate of surface water in Shanghai was between 0.95 and 2.6 mg m−2 d−1, and the total density of algae in the surface water of rivers showed such a relationship between quantity and time (season): spring > summer > autumn > winter [29].
In addition, much organic matter is released through fuel combustion in urban areas as complex polar organics with a low solubility in water, such as polycyclic aromatic hydrocarbons. Therefore, only 50% of TOC deposition is transferred into the water. Inorganic phosphorus, phosphate and phosphite concentrations in POM are other significant sources of bioavailable phosphorus in addition to organic matter decomposition [12]. The simulated water body study showed that nearly 80% of the total atmospheric phosphorus deposition can be captured by water bodies and then utilized.
Gravity, aerodynamic resistance and molecular diffusion resistance might influence insoluble matter transfer from the atmosphere into water bodies [28]. Insoluble organic matter (IOM) contains nutrients, which during the breakdown and production of dissolved organic matter (DOM), are transferred to the dissolved phase and remineralized [12]. The production of nutrients associated with DOM is based on a first order breakdown mechanism for IOM and dependent on the IOM levels:
d N H 4 + d t = DOM _ N · R e m i n _ N ,
d P O 4 3 + d t = D O M _ P · R e m i n _ P ,
where DOM _ N and DOM _ P are the amounts of N and P in the DOM, respectively, and R e m i n _ N and R e m i n _ P are the remineralization rates of N (0.45) and P (1.0) in DOM, respectively, assuming P is remineralized at twice the rate of N (Remin_P > Remin_N) [31].
Atmospheric deposition features of organic matter, TN, N-NH4+ and P should be considered when assessing the loads to small, shallow urban water bodies. In urban areas similar to Shanghai that have wet and dry seasons and are vulnerable to eutrophication and harmful algal blooms (HAB) in surface water, the amounts of TOC, TN, N-NH4+ and TP transferred into the water phase via atmospheric deposition account for 50, 130, 130 and 80% of those in collected air samples, respectively. Despite potential additional nutrient sources, atmospheric deposition is still expected to contribute significantly to nutrient loadings in shallow urban water bodies. For instance, accounting for N-fixation based on the estimated rates reported in Reference [29], springtime utilization ratios of atmospheric TN are still larger than 60% and near 100% for some months.

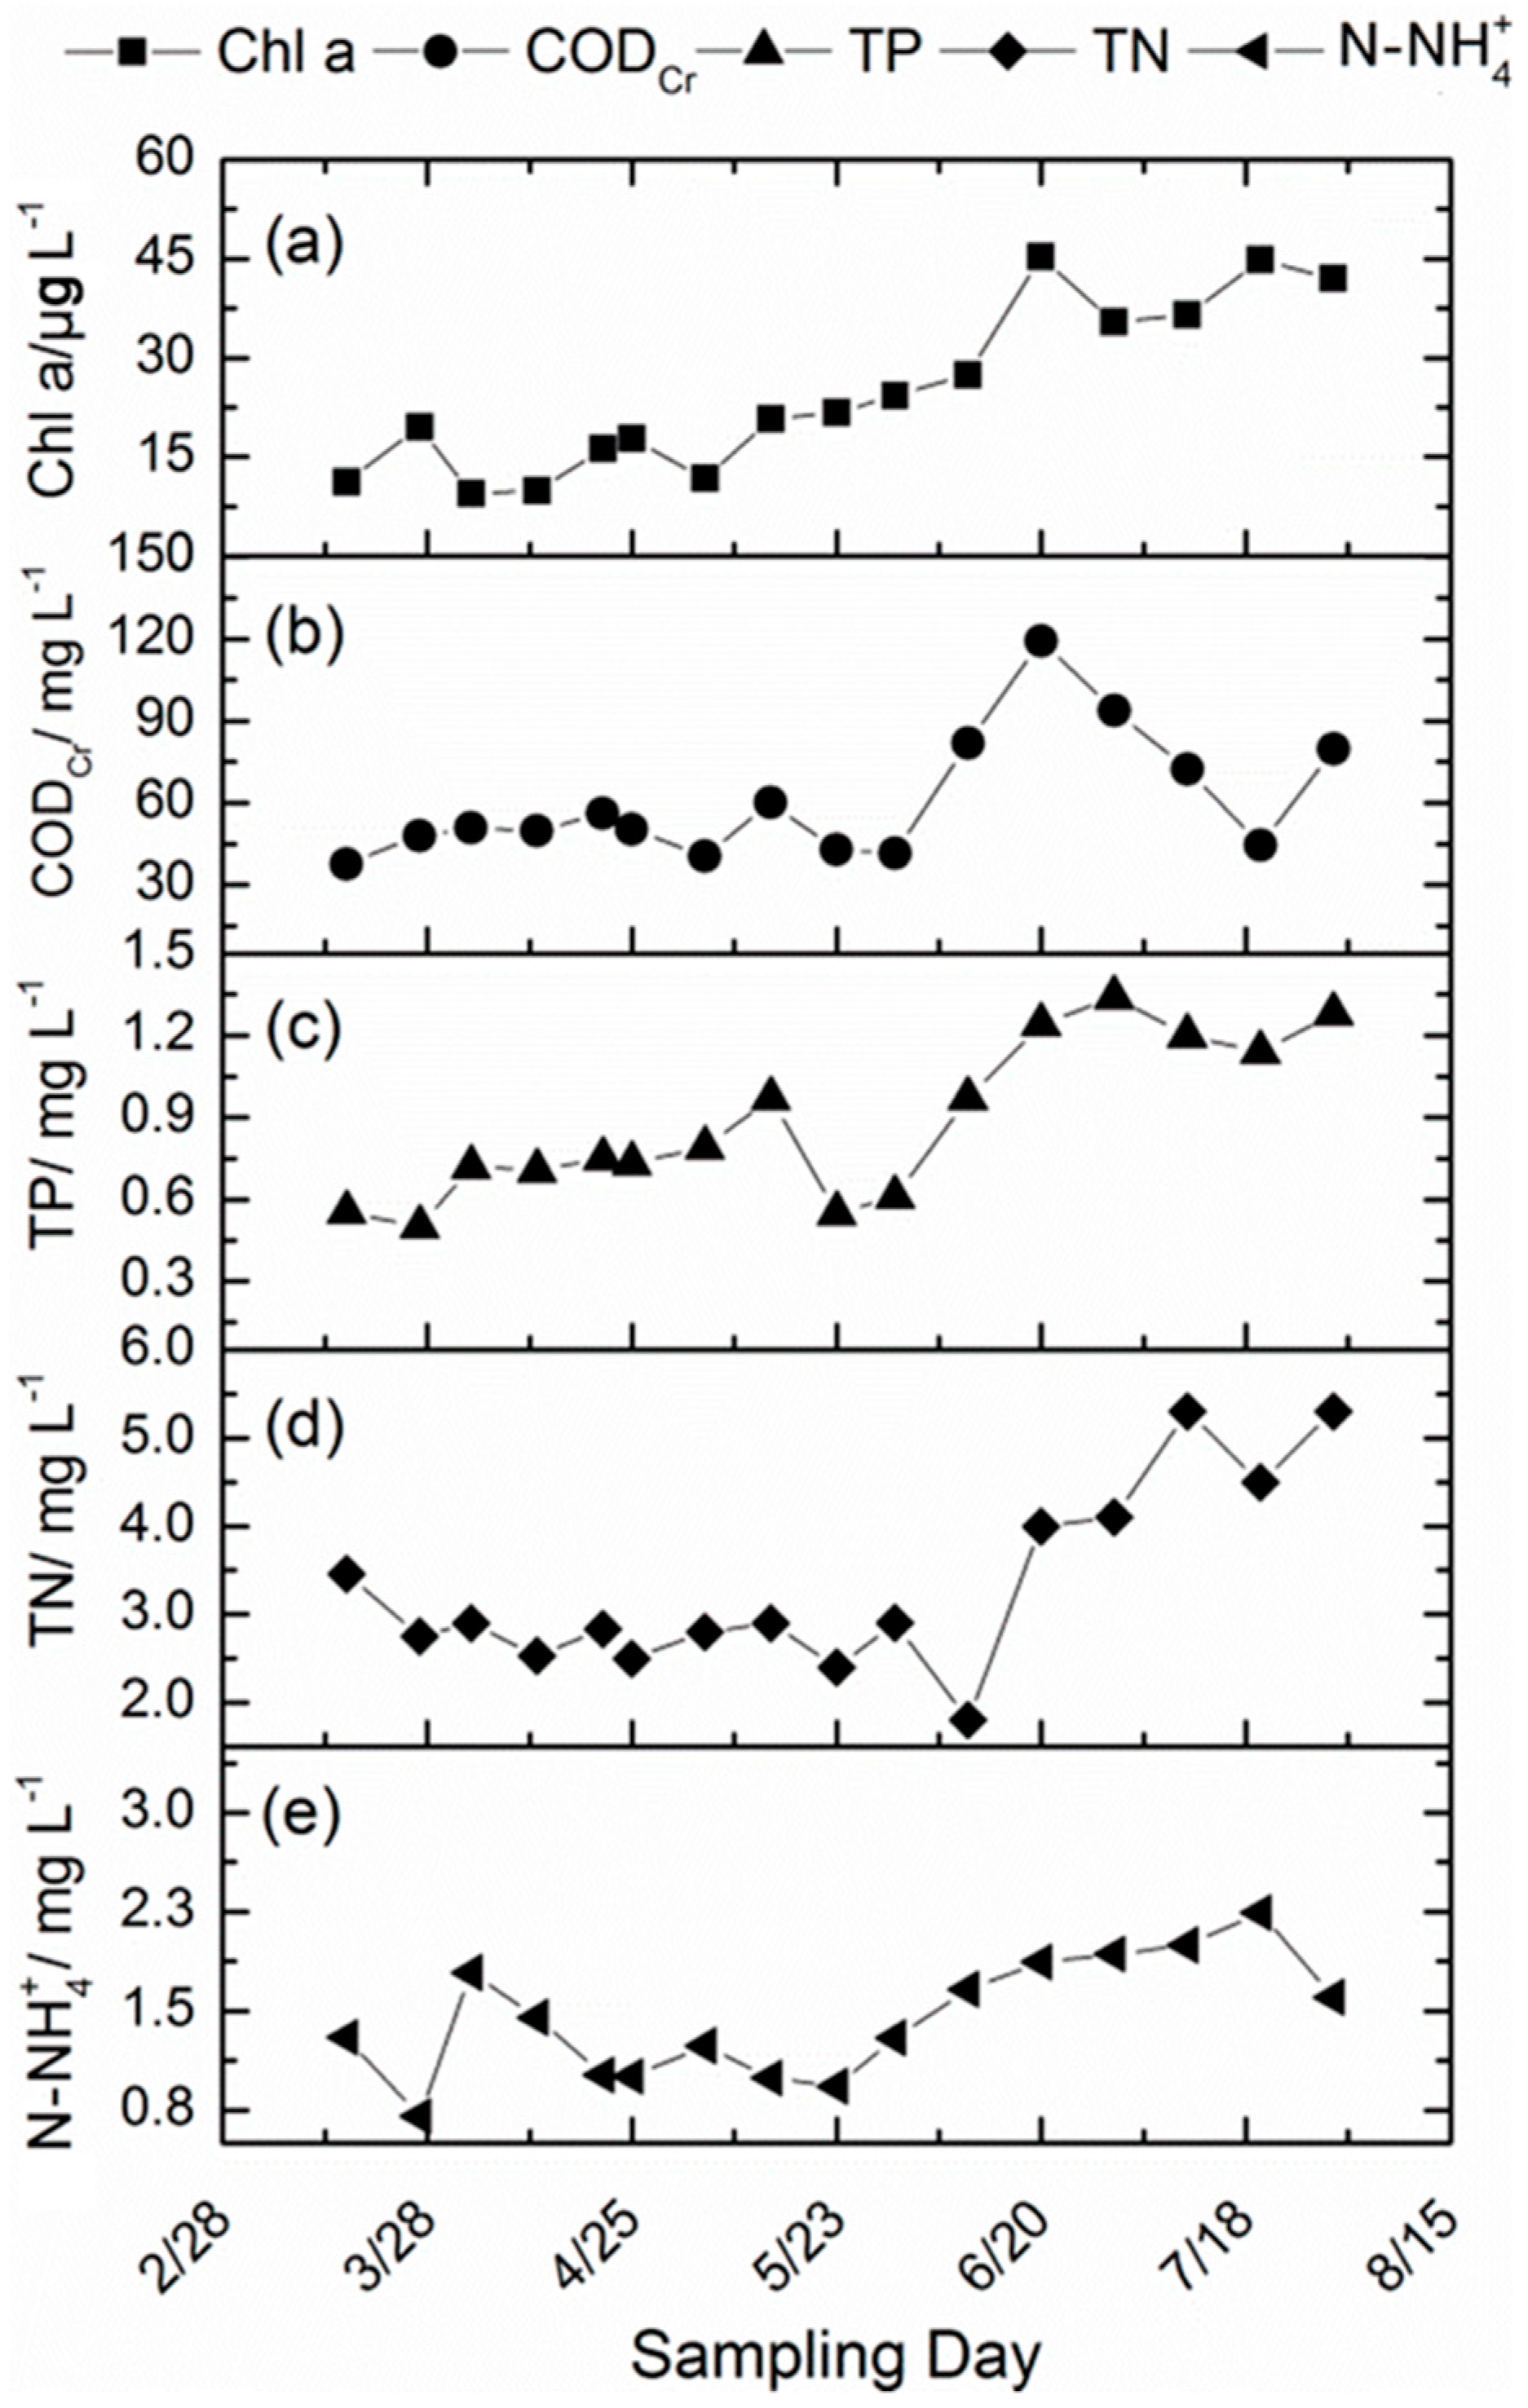
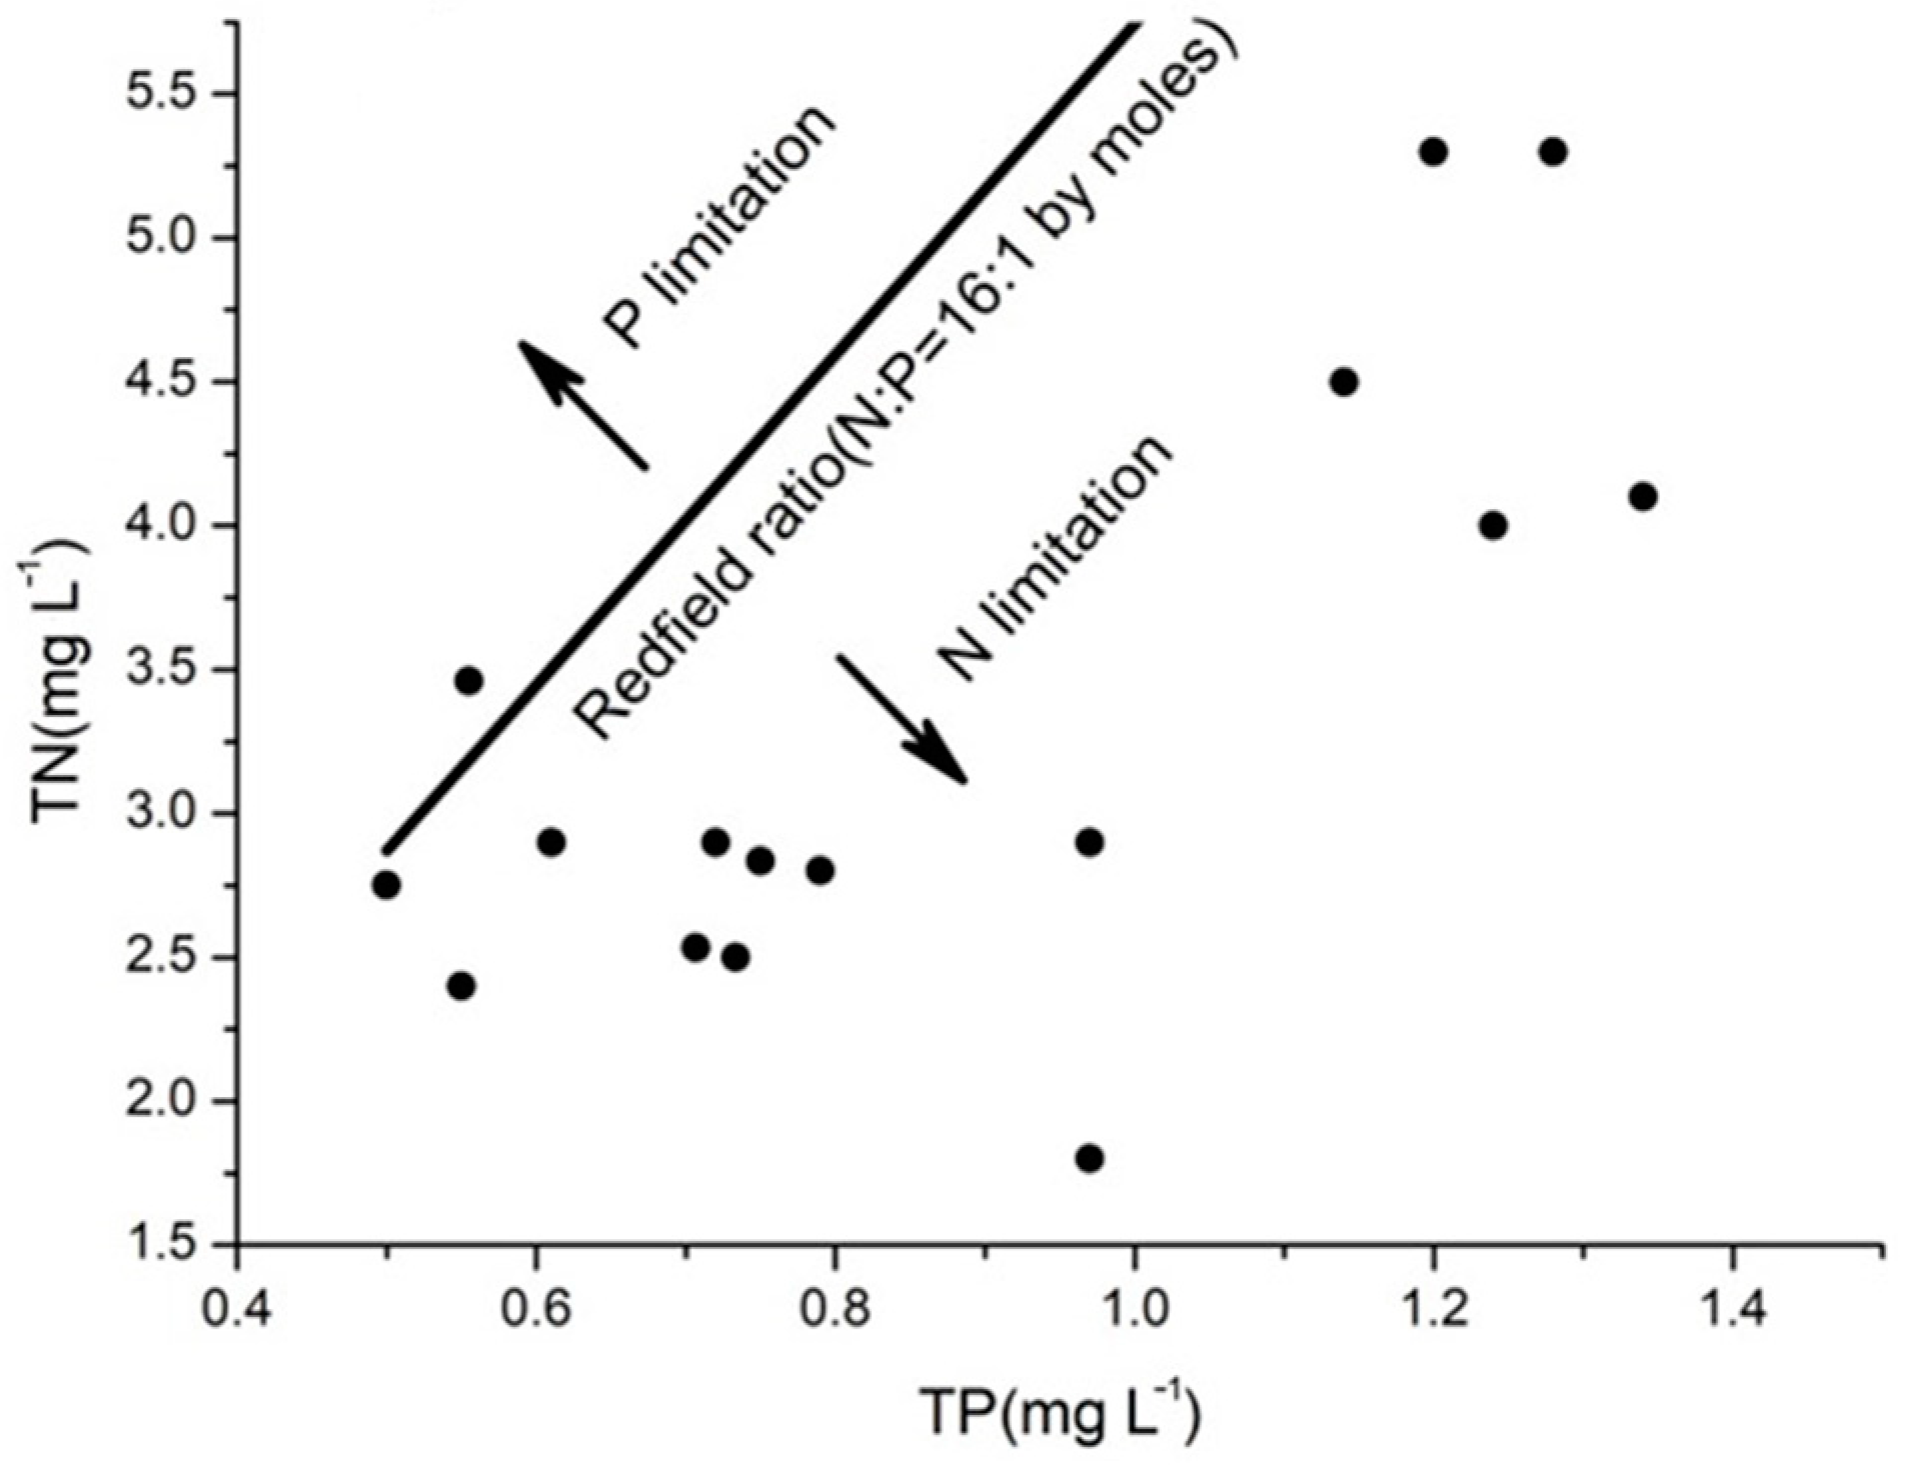
3.3. Potential Impacts of Nitrogen Deposition to Primary Production in the Lake

Temporal variations of organic matter, nitrogen and phosphorus in waters are determined by combined microorganism assimilation and dissimilation, detritus and particulate dissolution, sediment release, and total deposition flux [32]. Coupling observations of atmospheric P and N to the actual urban water body (nutrient availability and chlorophyll-a) during spring and summer (from March to July) shows that nutrients accumulated from early June–July and water quality strongly deteriorated (Figure 8). This is consistent with the trend of atmospheric deposition and the simulated water body, where Chemical Oxygen Demand (COD), TN, and TP showed peaks of 119, 5.3, and 1.34 mg L−1, respectively, at the end of June. Chl-a exceeded the algal bloom threshold (30 mg m−3) [27] with values greater than 45 mg m−3. This was in addition to the detection of strong odors and observed Microcystisincerta Lemm blooms. Christodoulaki et al. [12] investigated the impact of atmospheric deposition on the marine ecosystem of the East Mediterranean Sea through operational biogeochemical models (ERSEM-2004 and 3-D POSEIDON) that simulated the transport and mechanisms of atmospherically deposited nutrients into a water body. The phytoplankton biomass was enhanced by 2–26% because of atmospheric deposition, whereas bacteria biomass was calculated to be enhanced 7% monthly; these model results are consistent with this study. Therefore, atmospheric deposition plays an important role in determining the nutrient levels in water on a longer time scale [13,33].
Furthermore, a Redfield ratio N:P of 16:1 by moles in general indicates a roughly balanced supply of N and P, and algae assemblages tend to mirror this ratio fairly closely when growing under balanced growth conditions [34]. Obviously, the N/P ratio of the Quyang water body is lower than 16:1 in most cases, which indicates that the water body is predominantly limited by N, during the algal growth (Figure 9).
Algae, bacteria and fungi could use the atmospheric nitrogen deposited into water. HABs in urban water bodies are frequent consequences of N-driven eutrophication. Assuming that phytoplankton uptakes all of the N from atmospheric deposition with no losses, potential impacts of nitrogen deposition to primary production in the Quyang water body (Table 1) were calculated as follows [24,27]:
C h l a = D e p o N D e p t h × 1   m g   N 14   m g   N × 106   m g   C 16   m g   N × 12   m g   C 1   m g   C × 1   m g   C h l 30   m g   C ,
Clark and Kremer [27] reported that the maximum primary production (evaluated by Chl-a) stock in a 1-meter-deep water column with an input of 65 mg N m−2 can reach a calculated 12.3 mg Chl-a m−3. Since a Chl-a between 10 and 30 mg m−3 can be considered as algal blooms, estimates of new Chl-a production as a result of episodic atmospheric N deposition (ranging from 2.54–37.98 mg m−3) indicate it might stimulate minor blooms. Jung et al. [24] used the same estimation and found a relatively similar result that the calculated monthly Chl-a s contributes 1.1–16% of the average Chl-a measured. Urban water bodies in Shanghai have been subjected to HABs in the past decade [5]. Thus, as a continuous source of nutrients, the potential impacts of atmospheric deposition on primary production should not be underestimated.

3.4. Water Quality Maintenance, HAB Early Warning and Emergency Measures in Urban Water Bodies

Shanghai is the most urbanized metropolis in China with an area of 6,340.5 km2 and a population of 24.2 million (i.e., human population density of 3816 inhab. km−2) [35]. Urban water bodies are usually close to well-developed transportation infrastructure and densely populated areas. Atmospheric organic matter and nutrients originating from fuel combustion and anthropogenic sources are a significant source of the total input that influences eutrophication [21,22]. Isotopic analysis of nitrogen deposition shows that it is closely linked to increasing emissions from the volatilization of human and animal excreta and vehicle fuel combustion during the summer in Shanghai near the urban water bodies. Although annual average atmospheric deposition in the Yangpu District has dramatically declined since 2001, total amounts of atmospheric nitrogen and phosphorus deposition are still 4453 and 146 kg km−2 a−1, respectively. These values are about three times higher during June and July (the optimal period of algae growth) than during spring. Furthermore, the TNS and TPS fractions account for 83% of TN and 24% of TP, respectively. Atmospheric deposition is a strong driving force for both water quality deterioration and HABs [12].
Many low-cost and eco-friendly technologies, such as bio-filters [36], constructed wetlands [37], and multistage floating beds [38], are used in urban water body restoration. Early warning and prediction measures can also be applied to describe variations in water quality and algae growth rates [39] or to estimate the potential efficiency of PSII by Maximal Photochemical Efficiency FV/FM [5]. Once algae dramatically grow in moderate conditions, then accumulate and bloom, algaecide or other physical controls should be adopted to reduce algal bloom duration. The addition of copper sulfate (CuSO4) can be beneficial in eliminating harmful algae, but it may come at the cost of ecosystem toxicity as well as other risks [40]. The consequences of this dampening are currently not well understood [41]. Gravitational separation, coagulation and flotation are usually used for suspended solids removal. Considering the relatively low algae density, high-density micro-bubble flotation enhanced by micro-flocculation was tested for its effectiveness in algae removal using the Quyang water in this study during a bloom. The average diameter of micro-bubbles ranged from 40–100 μm. The dense and thick micro-bubbles collide and adhere to micro-flocculants (40–60 μm) of algae and suspended matter, then are separated from the water. The best algae separation, as determined by Chl-a, was 88.46% with an outflow concentration of 13.84 mg m−3, when hydraulic loading, flocculation dosage and the micro-bubble layer height were 5 m h−1, 4 mg L−1 and 130 cm, respectively [42].

4. Conclusions

Atmospheric deposition in urban water bodies was investigated in the present study. While different techniques for storm water runoff control and point source pollution truncation can be used to protect water quality, nutrient input from atmospheric deposition is still hard to control. Atmospheric TOC, TN, N-NH4+ and TP deposition ranged from 35–81, 3–40, 0.79–20.40 and 0.78–0.25 mg m−2 d−1, respectively. The actual loads to small and shallow urban water bodies were assessed to be around 50, 130, 130, and 80% of TOC, TN, N-NH4+, and TP, respectively, indicating nutrients transferred into the water phase. It is assimilated by phytoplankton and bacteria and acts as an essential driving force for algae growth, accumulation and blooms, especially in small, shallow urban water bodies located in densely populated and highly industrialized areas. Furthermore, atmospheric deposition plays an important role in determining the nutrient level of waters on a longer time scale.
Because there is a lack of effective controls in urban atmospheric deposition currently, atmospheric nutrient deposition cannot be ignored or underestimated in algae growth, aggregation and blooms in urban water bodies. Ecological restoration measures can, to some extent, eliminate nutrients and slow down the bloom rate and be used together with Maximal Photochemical Efficiency FV/FM to indicate potential algae blooms. Once there is a HAB, high-density micro bubble flotation enhanced by micro-flocculation can be applied to separate algae from the water body, thereby protecting the role of urban water bodies in improving the urban landscape aesthetics and ecosystem health.

Author Contributions

Conceptualization, T.Z., H.C., W.L., J.X. and Y.Y.; Data curation, T.Z., H.C. and W.L.; Formal analysis, T.Z., H.C., W.L., J.X. and Y.Y.; Funding acquisition, T.Z. and J.X.; Investigation, T.Z., H.C., W.L., Y.Y. and X.L.; Methodology, T.Z., H.C., W.L., J.X. and Y.Y.; Project administration, J.X. and J.H.; Resources, T.Z. and J.X.; Software, H.C.; Supervision, J.X. and J.W.; Validation, T.Z., H.C., W.L. and Y.Y.; Visualization, T.Z., H.C., W.L., Y.Y. and X.L.; Writing—original draft, T.Z., H.C., W.L. and Y.Y.; Writing—review & editing, T.Z., H.C., W.L., J.X., Y.Y., X.L. and J.H.

Funding

This research was funded by Science and Technology Commission of Shanghai Municipality (18DZ1203903).

Acknowledgments

Thanks for the great support and assistance from various aspects by relevant departments and organizations especially Science and Technology Commission of Shanghai Municipality and Tongji Architectural Design (Group) Co., Ltd. Moreover, the authors highly appreciate the reviewers’ greatly helpful comments and suggestions for the improvement of the paper.

Conflicts of Interest

The authors declare no conflict of interest.

References

  1. Jia, H.; Zhang, Y.; Guo, Y. The development of a multi-species algal ecodynamic model for urban surface water systems and its application. Ecol. Model. 2017, 221, 1831–1838. [Google Scholar] [CrossRef]
  2. Bakanov, A.I. Assessment of water and sediment quality in fresh water bodies based on characteristics of benthic communities. Russ. J. Ecol. 2004, 35, 417–420. [Google Scholar] [CrossRef]
  3. Krause-Jensen, D.; Greve, T.M.; Nielsen, K. Eelgrass as a bioindicator under the European Water Framework Directive. Water Resour. Manag. 2005, 19, 63–75. [Google Scholar] [CrossRef]
  4. Huang, X.; Ni, J.; Yang, C.; Feng, M.; Li, Z.; Xie, D. Efficient Ammonium Removal by Bacteria Rhodopseudomonas Isolated from Natural Landscape Water: China Case Study. Water 2018, 10, 1107. [Google Scholar] [CrossRef]
  5. Wei, Q.L. Research on Potential Largest Photosynthetic Efficiency of Algae of Urban Landscape Water and the Purification Technology of Microbubble. Master’s Thesis, Tongji University, Shanghai, China, 2011. [Google Scholar]
  6. Gao, Y.; Zhu, B.; He, N.; Yu, G.; Wang, T.; Chen, W.; Tian, J. Phosphorus and carbon competitive sorption–desorption and associated non-point loss respond to natural rainfall events. J. Hydrol. 2014, 517, 447–457. [Google Scholar] [CrossRef]
  7. Zhang, X.F.; Li, C.H. Wet deposition of atmospheric nitrogen and its eutrophication effect on Xihu Lake, Huizhou City. Chin. J. Eco-Agric. 2008, 16. [Google Scholar] [CrossRef]
  8. Yang, L.Y.; Qin, B.Q.; Hu, W.P.; Luo, L.C.; Song, Y.Z. The Atmospheric Deposition of Nitrogen and Phosphorus Nutrients in Taihu Lake. Oceanol. Limnol. Sin. 2007, 38, 104–110. [Google Scholar]
  9. Paerl, H.W.; Whitall, D.R. Anthropogenically-derived atmospheric nitrogen deposition, marine eutrophication and harmful algal bloom expansion: Is there a link? Ambio 1999, 28, 307–311. [Google Scholar]
  10. Shanghai Environmental Bulletin. Available online: http://www.sepb.gov.cn/fa/cms/shhj/shhj2143/shhj2144/index_show.shtml (accessed on 2 July 2018).
  11. Mizerkowski, B.D.; Hesse, K.J.; Ladwig, N.; Machado, E.D.; Rosa, R.; Araujo, T.; Koch, D. Sources, loads and dispersion of dissolved inorganic nutrients in Paranagua Bay. Ocean Dynam. 2012, 62, 1409–1424. [Google Scholar] [CrossRef]
  12. Christodoulaki, S.; Petihakis, G.; Kanakidou, M.; Mihalopoulos, N.; Tsiaras, K.; Triantafyllou, G. Atmospheric deposition in the Eastern Mediterranean. A driving force for ecosystem dynamics. J. Mar. Syst. 2013, 109, 78–93. [Google Scholar] [CrossRef]
  13. Zhai, S.; Yang, L.; Hu, W. Observations of atmospheric nitrogen and phosphorus deposition during the period of algal bloom formation in Northern Lake Taihu, China. Environ. Manag. 2009, 44, 542–551. [Google Scholar] [CrossRef] [PubMed]
  14. Longo, A.F.; Ingall, E.D.; Diaz, J.M.; Oakes, M.; King, L.E.; Nenes, A.; Mihalopoulos, N.; Violaki, K.; Avila, A.; Benitez-Nelson, C.R. P-NEXFS analysis of aerosol phosphorus delivered to the Mediterranean Sea. Geophys. Res. Lett. 2014, 41, 4043–4049. [Google Scholar] [CrossRef] [Green Version]
  15. Sickman, J.O.; Melack, J.M.; Clow, D.W. Evidence for nutrient enrichment of high-elevation lakes in the Sierra Nevada, California. Limnol. Oceanogr. 2003, 48, 1885–1892. [Google Scholar] [CrossRef] [Green Version]
  16. Vicars, W.C.; Sickman, J.O.; Ziemann, P.J. Atmospheric phosphorus deposition at a montane site: Size distribution, effects of wildfire, and ecological implications. Atmos. Environ. 2010, 44, 2813–2821. [Google Scholar] [CrossRef]
  17. Zhang, H.; Zhu, Y.; Li, F.; Chen, L. Nutrients in the wet deposition of Shanghai and ecological impacts. Phys. Chem. Earth Parts A/B/C 2011, 36, 407–410. [Google Scholar] [CrossRef]
  18. Opening Information of Government. Available online: http://www.shyp.gov.cn/zwgk/Home/List?parentModuleId=009300020009 (accessed on 8 March 2019).
  19. Akkoyunlu, B.O.; Tayanç, M. Analyses of wet and bulk deposition in four different regions of Istanbul, Turkey. Atmos. Environ. 2003, 37, 3571–3579. [Google Scholar] [CrossRef]
  20. Santos, P.S.M.; Santos, E.B.H.; Duarte, A.C. Dissolved organic and inorganic matter in bulk deposition of a coastal urban area: An integrated approach. J. Environ. Manag. 2014, 145, 71–78. [Google Scholar] [CrossRef] [PubMed]
  21. Luo, J.; Wang, X.; Yang, H.; Yu, J.Z.; Yang, L.; Qin, B. Atmospheric phosphorus in the northern part of Lake Taihu, China. Chemosphere 2011, 84, 785–791. [Google Scholar] [CrossRef]
  22. Ni, L.J.; Zhang, G.L.; Ruan, X.L.; Zhao, W.J.; Yang, J.L.; Zhou, L.X. The flux and pollution character of dust-fall in different functional zones of Nanjing. China Environ. Sci. 2007, 1, 2–6. (In Chinese) [Google Scholar]
  23. Imboden, A.S.; Christoforou, C.S.; Salmon, L.G. Determination of atmospheric nitrogen input to lake Greenwood, South Carolina-1. PM measurements. J. Air Waste Manag. 2002, 52, 1411–1421. [Google Scholar] [CrossRef]
  24. Jung, J.; Jang, Y.; Arimoto, R.; Uematsu, M.; Lee, G. Atmospheric nitrogen deposition and its impact to Lake Sihwa in South Korea from January 2004 to September 2005. Geochem. J. 2009, 43, 305–314. [Google Scholar] [CrossRef] [Green Version]
  25. Knapp, A.N.; Hastings, M.G.; Sigman, D.M.; Lipschultz, F.; Galloway, J.N. The flux and isotopic composition of reduced and total nitrogen in Bermuda rain. Mar. Chem. 2010, 120, 83–89. [Google Scholar] [CrossRef]
  26. Liu, X.Y.; Koba, K.; Makabe, A.; Li, X.D.; Yoh, M.; Liu, C.Q. Ammonium first: Natural mosses prefer atmospheric ammonium but vary utilization of dissolved organic nitrogen depending on habitat and nitrogen deposition. New Phytol. 2013, 199, 407–419. [Google Scholar] [CrossRef]
  27. Clark, H.; Kremer, J.N. Estimating direct and episodic atmospheric nitrogen deposition to a coastal waterbody. Mar. Environ. Res. 2005, 59, 349–366. [Google Scholar] [CrossRef] [PubMed]
  28. Chen, Y.; Mills, S.; Street, J.; Golan, D.; Post, A.; Jacobson, M.; Paytan, A. Estimates of atmospheric dry deposition and associated input of nutrients to Gulf of Aqaba seawater. J. Geophys. Res.-Atmos. 2007, 112. [Google Scholar] [CrossRef] [Green Version]
  29. Wang, M. Nitrogen Fixation Rate and Its Influencing Factors in Surface Waters of Shanghai. Master’s Thesis, East China Normal University, Shanghai, China, 2017. [Google Scholar]
  30. Isabell, K.; Stefano, B.; Volker, B.; Helle, P. Aerobic and anaerobic nitrogen transformation processes in N2-fixing cyanobacterial aggregates. ISME J. 2015, 9, 1456–1466. [Google Scholar]
  31. Zamora, L.M.; Landolfi, A.; Oschlies, A.; Hansell, D.A.; Dietze, H.; Dentener, F. Atmospheric deposition of nutrients and excess N formation in the North Atlantic. Biogeosciences 2010, 7, 777–793. [Google Scholar] [CrossRef] [Green Version]
  32. Park, R.A.; Clough, J.S.; Wellman, M.C. AQUATOX: Modeling environmental fate and ecological effects in aquatic ecosystems. Ecol. Model. 2008, 213, 1–15. [Google Scholar] [CrossRef]
  33. Tarnay, L.; Gertler, A.W.; Blank, R.R.; Taylor, G.E. Preliminary measurements of summer nitric acid and ammonia concentrations in the Lake Tahoe Basin air-shed: Implications for dry deposition of atmospheric nitrogen. Environ. Pollut. 2001, 113, 145–153. [Google Scholar] [CrossRef]
  34. Dodds, W.K.; Smith, V.H. Nitrogen, phosphorus, and eutrophication in streams. Inland Waters 2016, 6, 155–164. [Google Scholar] [CrossRef]
  35. Shanghai Almanac 2017. Available online: http://www.shanghai.gov.cn/nw2/nw2314/nw24651/nw43437/nw43442/u21aw1311502.html (accessed on 25 September 2018).
  36. Fuerhacker, M.; Haile, T.M.; Monai, B.; Mentler, A. Performance of a filtration system equipped with filter media for parking lot runoff treatment. Desalination 2011, 275, 118–125. [Google Scholar] [CrossRef]
  37. Wu, J.; Cheng, S.P.; Li, Z.; Guo, W.J.; Zhong, F.; Yin, D.Q. Case study on rehabilitation of a polluted urban water body in Yangtze River Basin. Environ. Sci. Pollut. Res. 2013, 20, 7038–7045. [Google Scholar] [CrossRef] [PubMed]
  38. Chen, Y.H.; Zhang, Y.; Huang, M.S.; Zhang, Y.F.; Zhao, F.; Luo, J.H. Ecological restoration by a multistage floating-bed system in a eutrophic urban river, China. In Mechatronics and Applied Mechanics, Pts 1 and 2; Guo, J., Ed.; Trans Tech Publications: Zurich, Switzerland, 2012; Volume 157–158, pp. 945–949. [Google Scholar]
  39. Cerco, C.F.; Noel, M.R.; Tillman, D.H. A practical application of Droop nutrient kinetics (WR 1883). Water Res. 2004, 38, 4446–4454. [Google Scholar] [CrossRef] [PubMed]
  40. Garcia-Villada, L.; Rico, M.; Altamirano, M.; Sanchez-Martin, L.; Lopez-Rodas, V.; Costas, E. Occurrence of copper resistant mutants in the toxic cyanobacteria Microcystis aeruginosa: Characterisation and future implications in the use of copper sulphate as algaecide. Water Res. 2004, 38, 2207–2213. [Google Scholar] [CrossRef] [PubMed]
  41. Song, L.; Marsh, T.L.; Voice, T.C.; Long, D.T. Loss of seasonal variability in a lake resulting from copper sulfate algaecide treatment. Phys. Chem. Earth 2011, 36, 430–435. [Google Scholar] [CrossRef]
  42. Chen, S.; Xu, J.; Liu, J.; Wei, Q.; Li, G.; Huang, X. Algae separation from urban landscape water using a high density microbubble layer enhanced by micro-flocculation. Water Sci. Technol. 2014, 70, 811–818. [Google Scholar] [CrossRef] [PubMed]
Figure 1. Sampling area in this study and monitoring sites set by Shanghai municipal department. Note: The yellow dot in the left figure marks the site for the water sample where lies in the place marked with a red star in the right figure; the black dots mark the regular monitoring sites set by Shanghai municipal department.
Sustainability 11 01703 g001
Figure 2. Annual average atmospheric deposition flux in Shanghai (a) and the Yangpu District (b) from 2005 to 2017. [10,18].
Sustainability 11 01703 g002
Figure 3. Schematic diagram of the experimental device.
Sustainability 11 01703 g003
Figure 4. Sample preparation flow chart and analytical methods for organic carbon, nitrogen, ammonia, and phosphorus.
Sustainability 11 01703 g004
Figure 5. Average atmospheric deposition flux of organic carbon, nitrogen and phosphorus during spring and summer (from March to July). The area between the line and x-axis indicates the total deposition amount of pollutants in a specific period.
Sustainability 11 01703 g005
Figure 6. Atmospheric deposition input (mg m−2 d−1) to the simulated water body (from March to July).
Sustainability 11 01703 g006
Figure 7. Proportion of TOC, TN, N-NH4+, and TP entering the waters through atmospheric deposition.
Sustainability 11 01703 g007
Figure 8. Water quality parameters (mg L−1) during the collection of atmospheric deposition samples (days).
Sustainability 11 01703 g008
Figure 9. The N/P ratio during the collection of atmospheric deposition samples.
Sustainability 11 01703 g009
Table 1. Contribution of atmospheric nitrogen to chlorophyll-a concentrations in Quyang Lake during spring and summer (from March to July).
Sampling Date (M/D)Calculated New Production of Chl-a (μg L−1)Measured Chl-a (μg L−1)Contribution of Atmospheric Nitrogen (%)
14 March–24 March9.8262.0715.8
24 March–3 April4.4468.086.5
3 April–13 April9.1052.3717.4
13 April–23 April6.9154.3512.7
23 April–3 May5.1789.635.8
3 May–13 May3.6564.695.6
13 May–23 May12.62114.4111.0
23 May–2 June2.5467.813.8
2 June–12 June27.69151.6818.3
12 June–22 June9.92150.016.6
22 June–2 July17.62165.4910.6
2 July–12 July37.98191.1519.8

