Use of Automated Control Systems and Advanced Energy Simulations in the Design of Climate Responsive Educational Building for Mediterranean Area


Abstract
1. Introduction
2. Materials and Methods
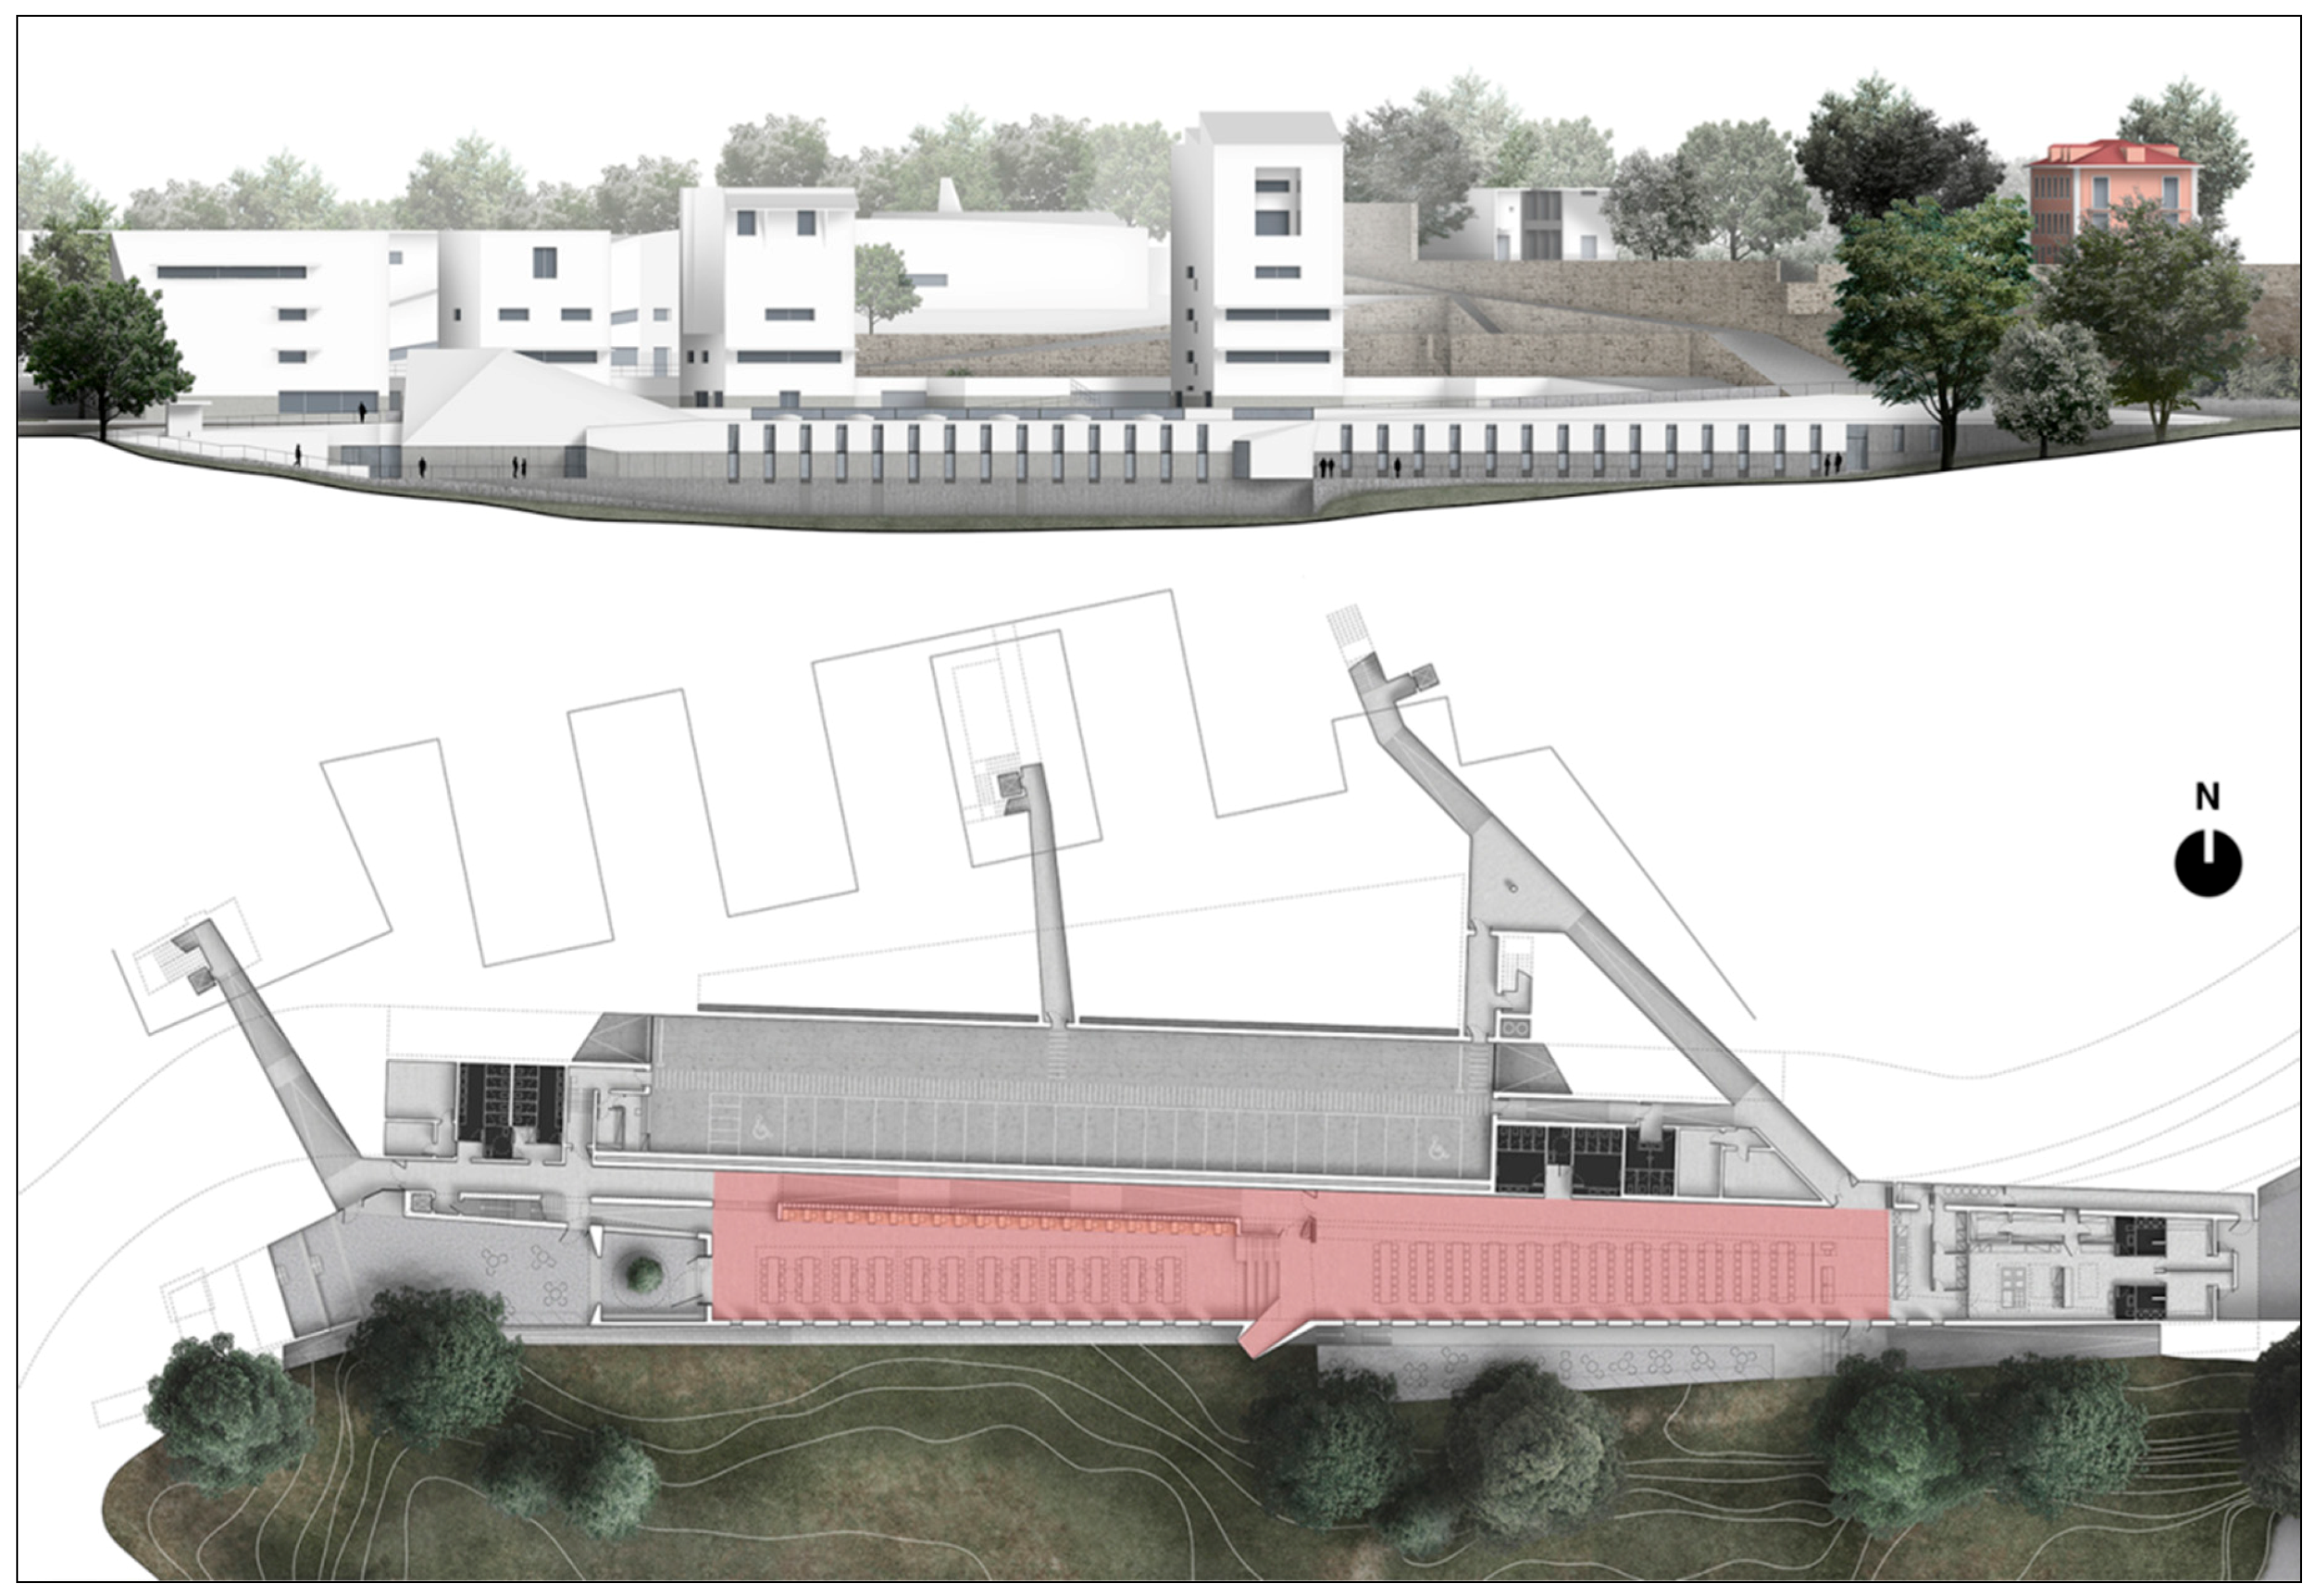
2.1. Case-Study Location
2.2. Design Approach
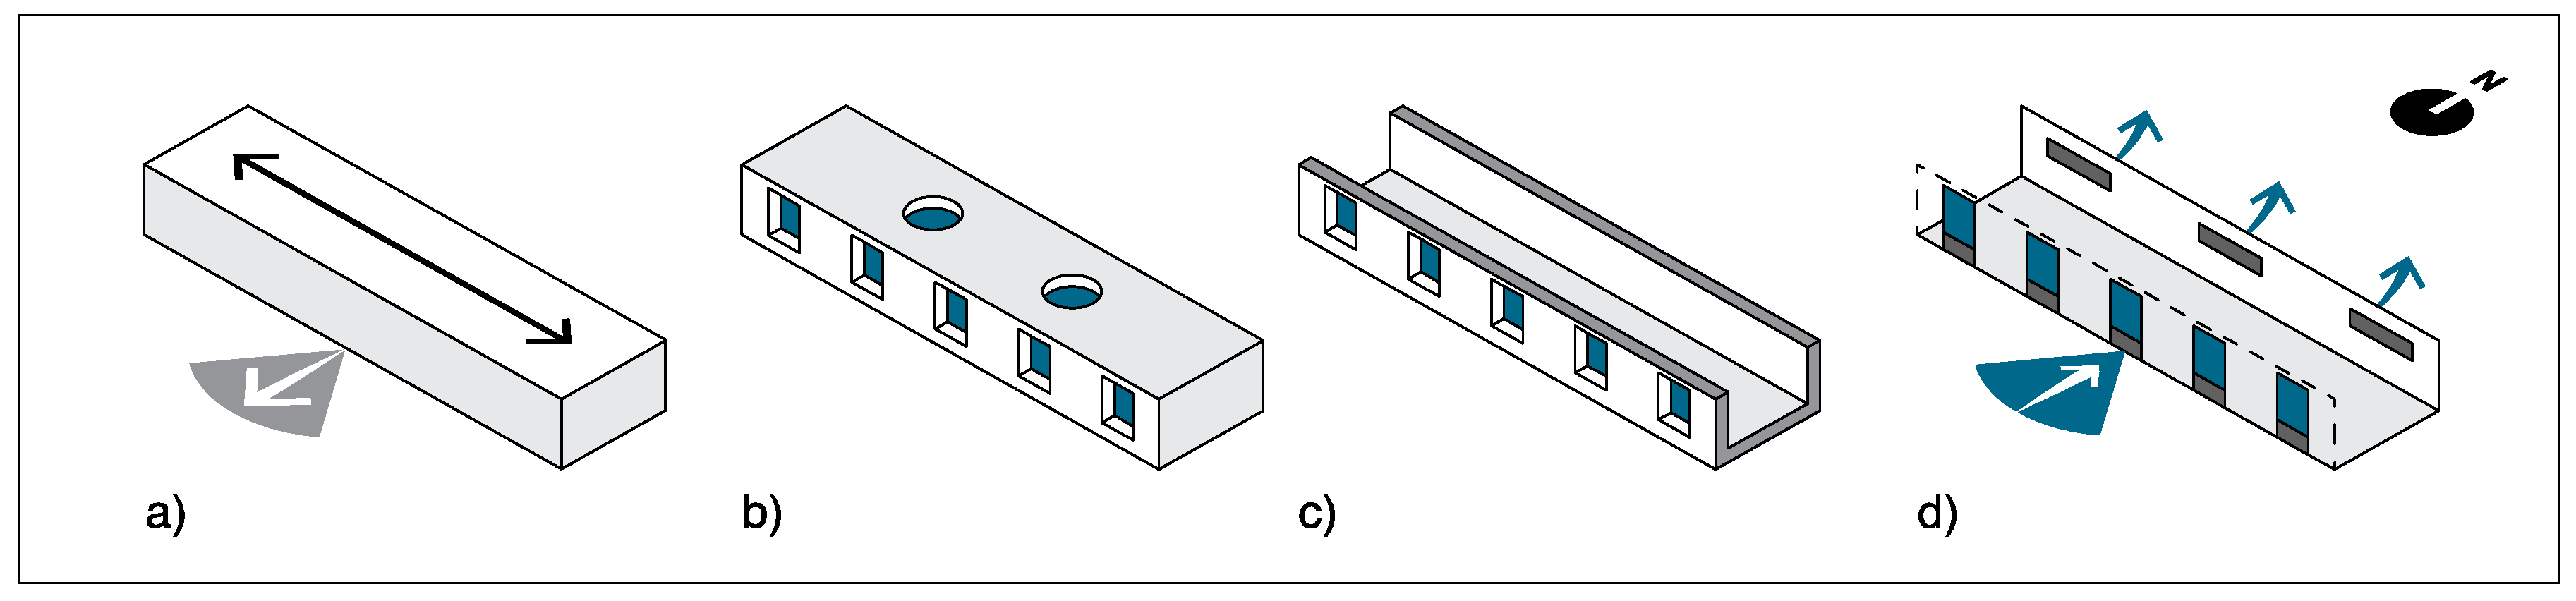
2.2.1. Orientation
2.2.2. Daylighting
2.2.3. Insulation/Glazing
2.2.4. Passive Solar Design
2.2.5. Thermal Inertia
2.2.6. Natural Ventilation
2.2.7. Building Automation Contribution
2.3. Technical Solutions Chosen for the Case Study
3. Energy Simulations Aimed at Climate Responsive Design
3.1. Descriptions of the Simulation Scenarios
- Scenario 1—Baseline Building - -
- Scenario 2—Solar Shading Solar shades Passive Solar, Daylighting
- Scenario 3—Natural Ventilation Operable vents Natural Ventilation
- Scenario 4—Daylight Control Light Controls Daylighting, Energy Efficiency
- Scenario 5—Enhanced All All
3.2. Inputs and References
3.2.1. Climate Data
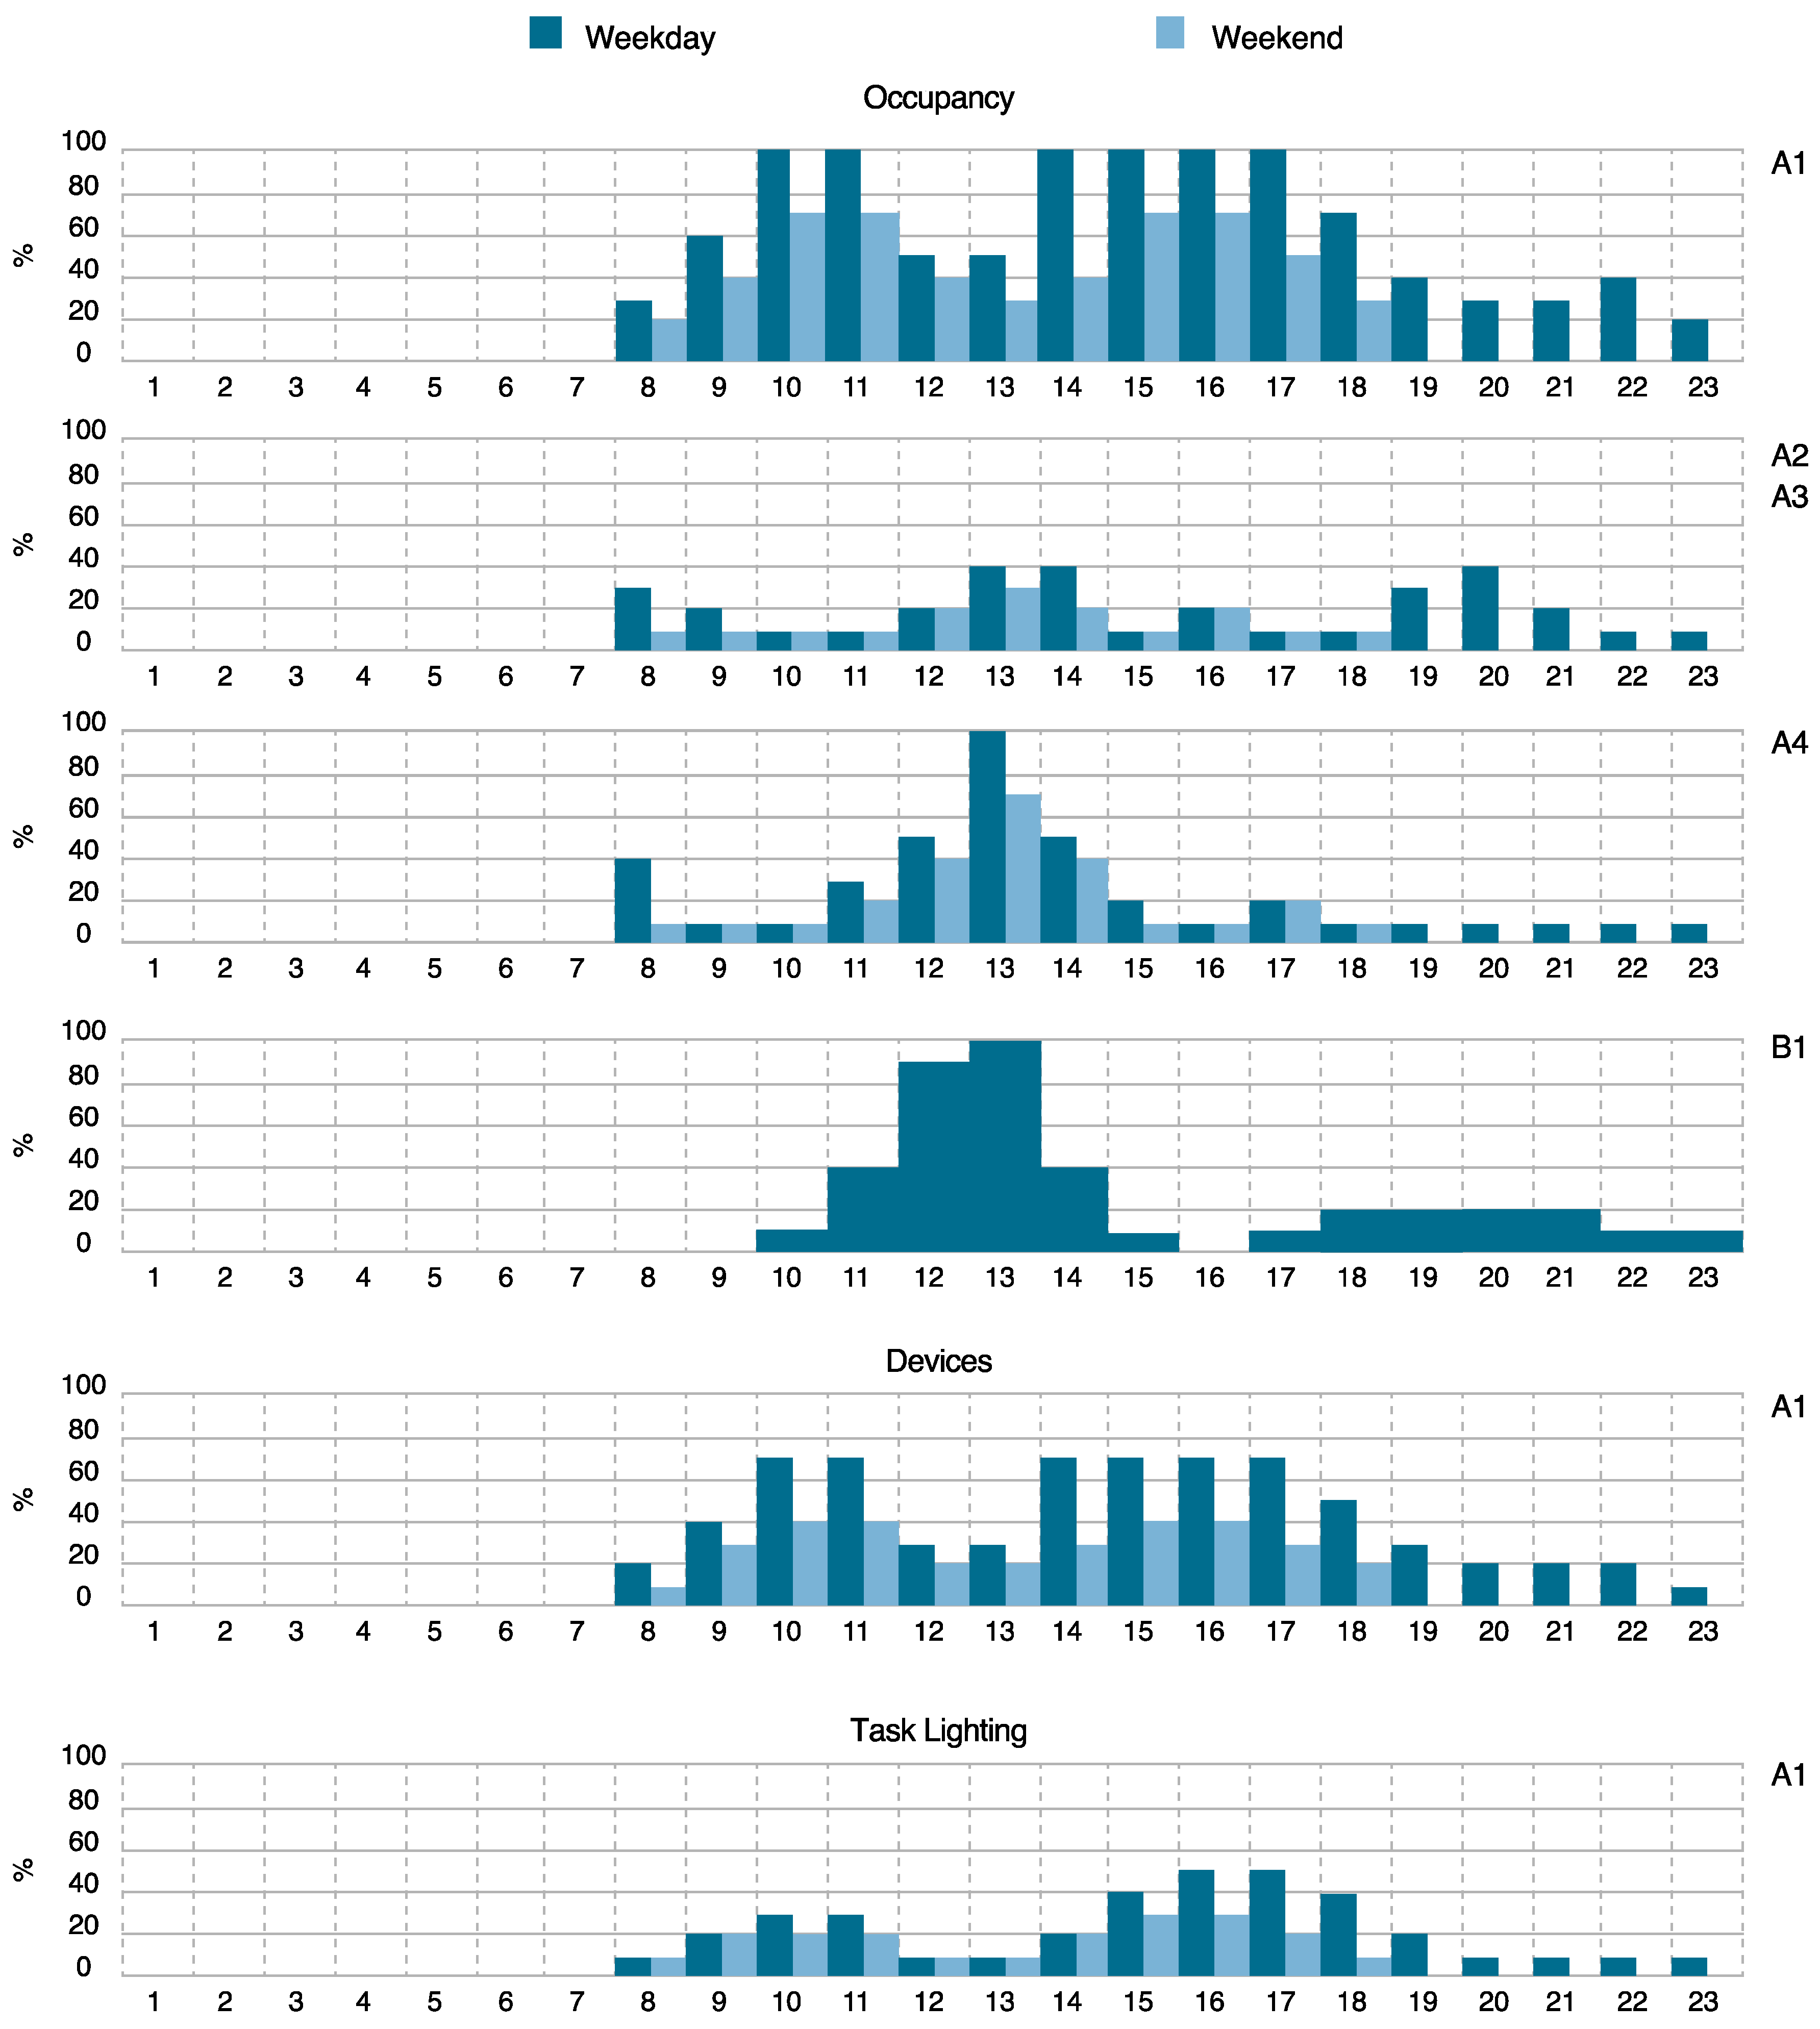
3.2.2. Internal Gains
3.2.3. Comfort Model
4. Results and Discussion
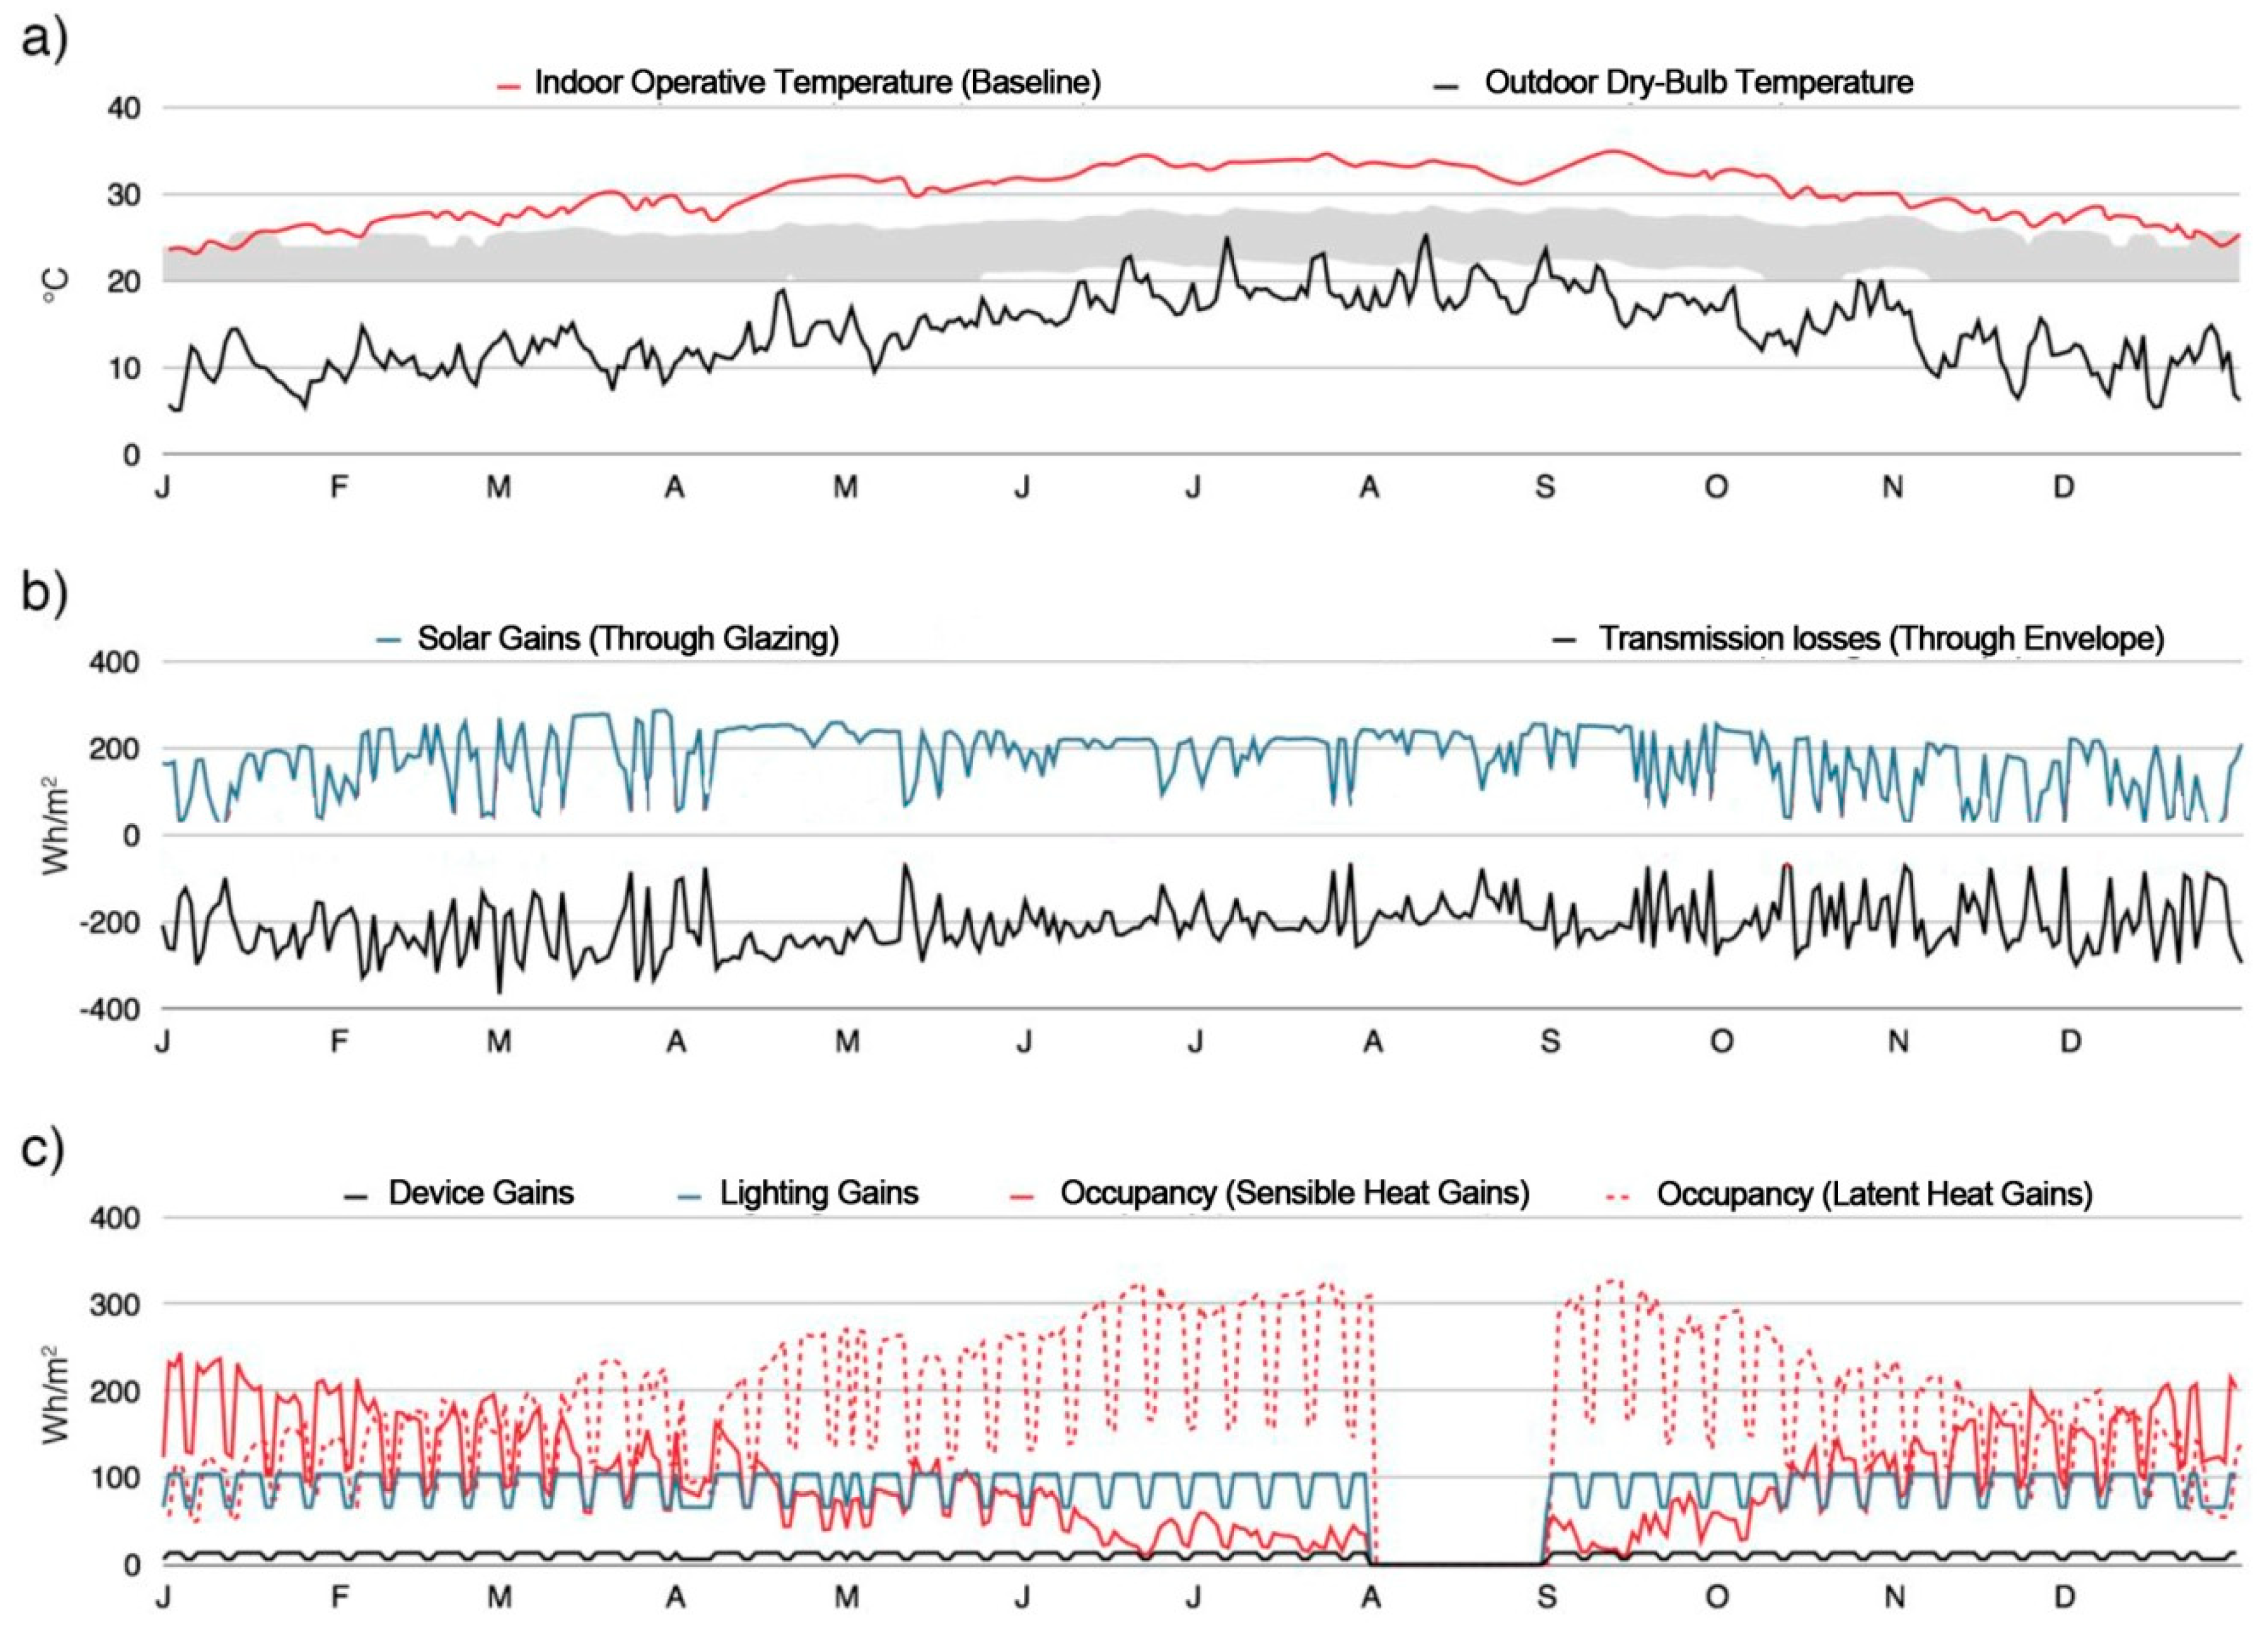
4.1. Scenario 1—Baseline
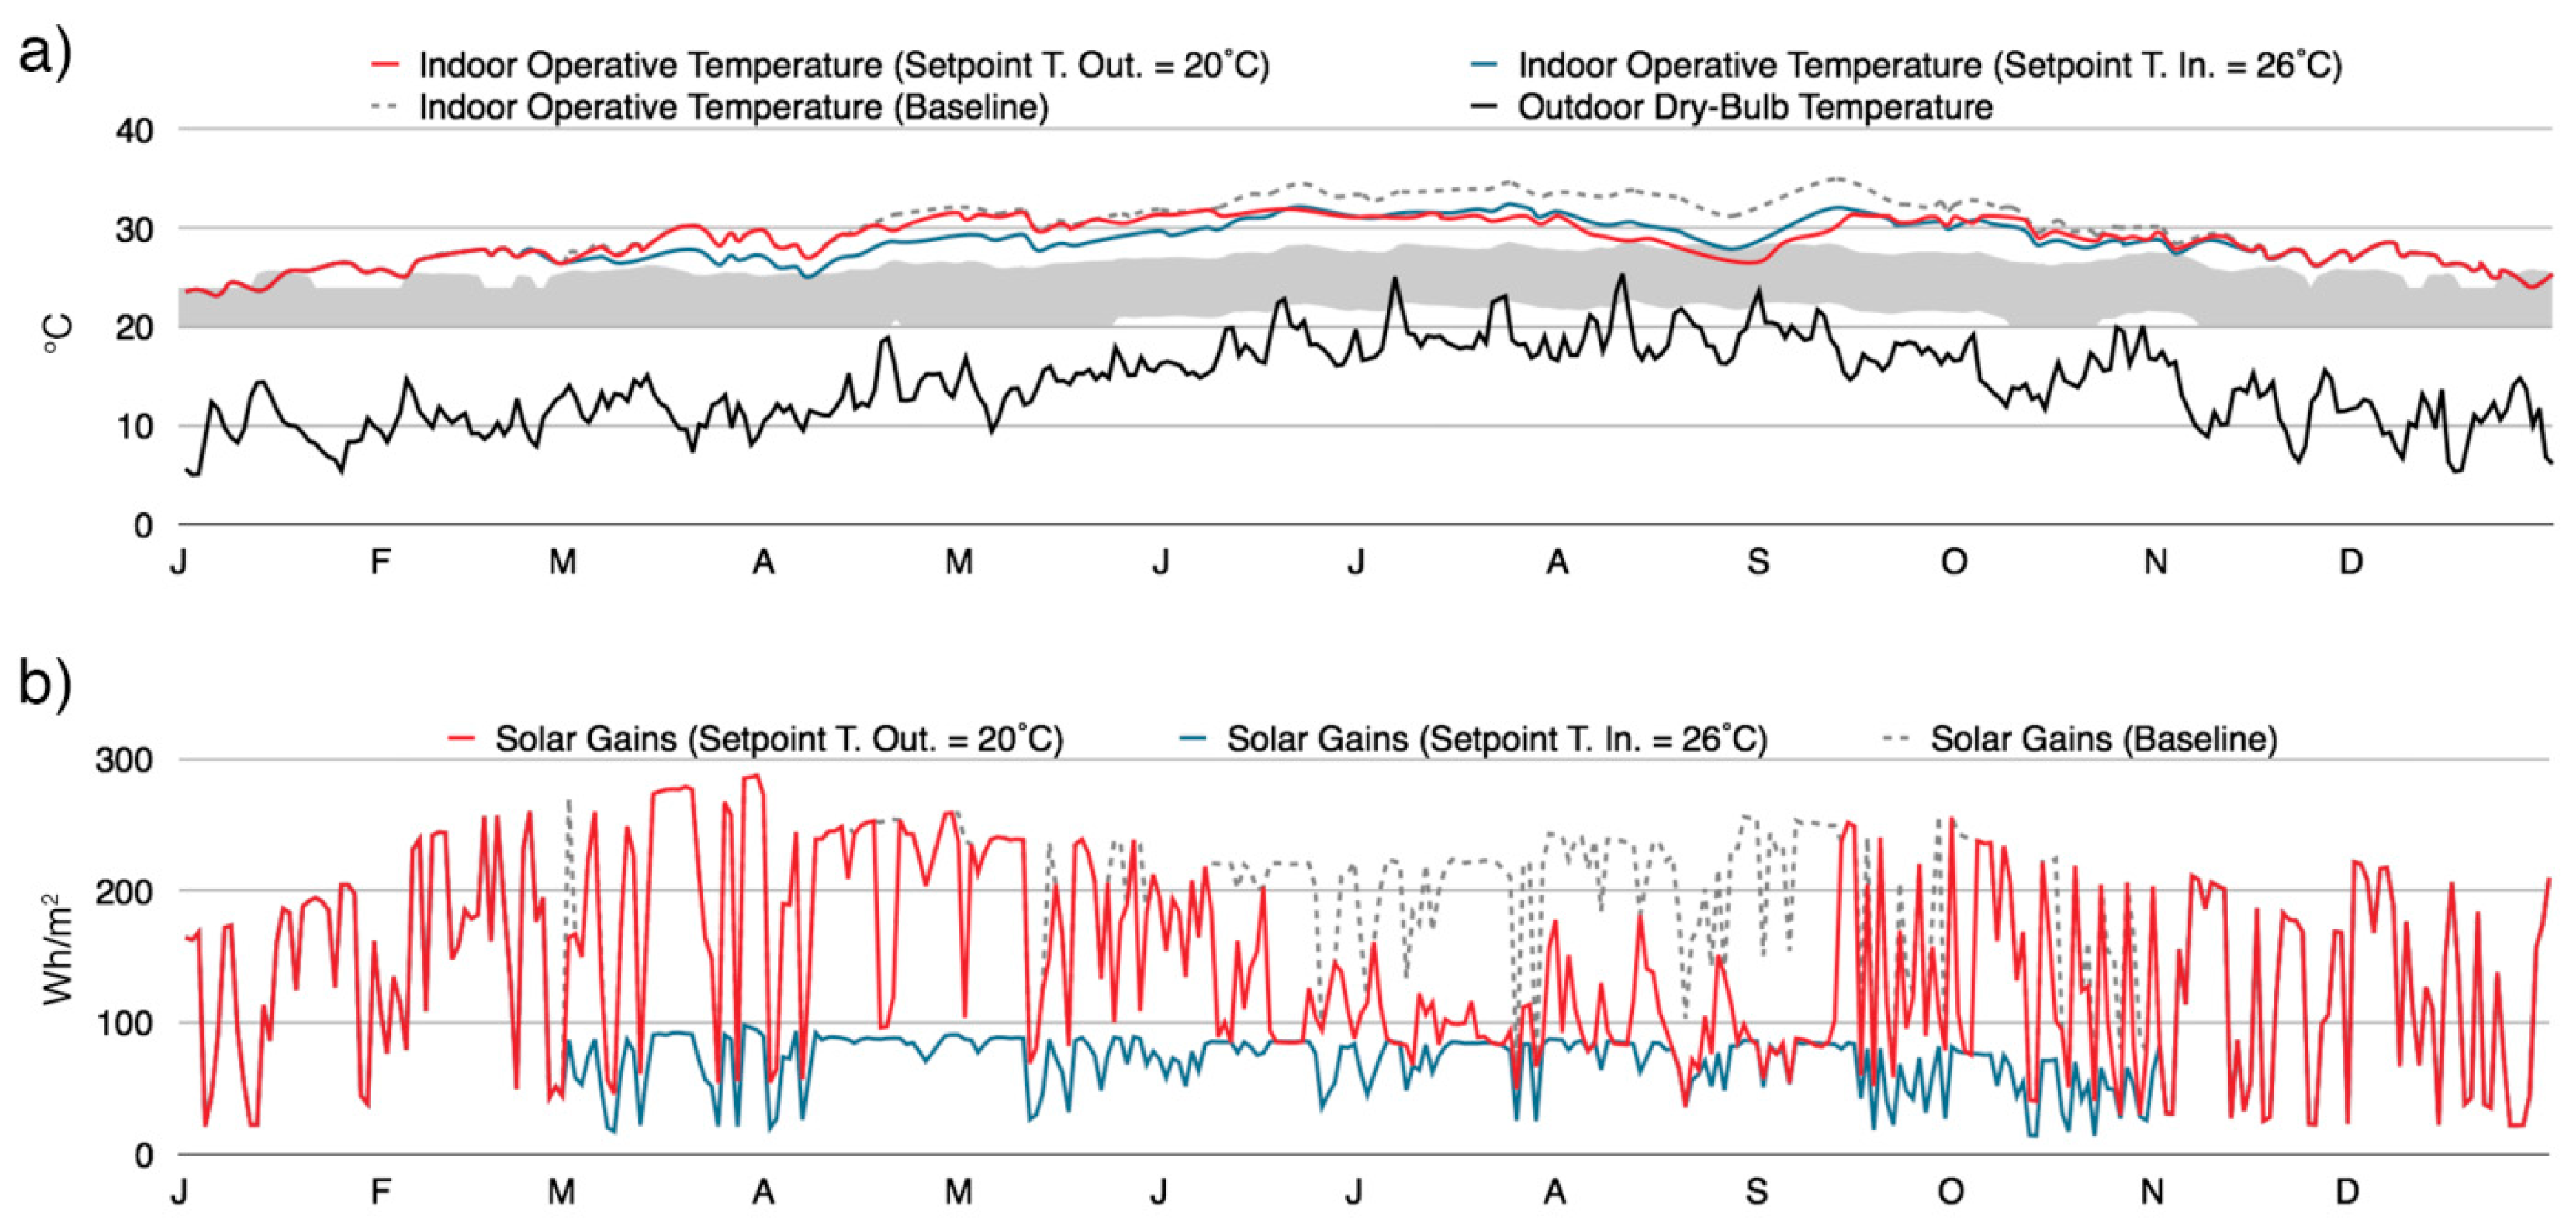
4.2. Scenario 2—Solar Shading
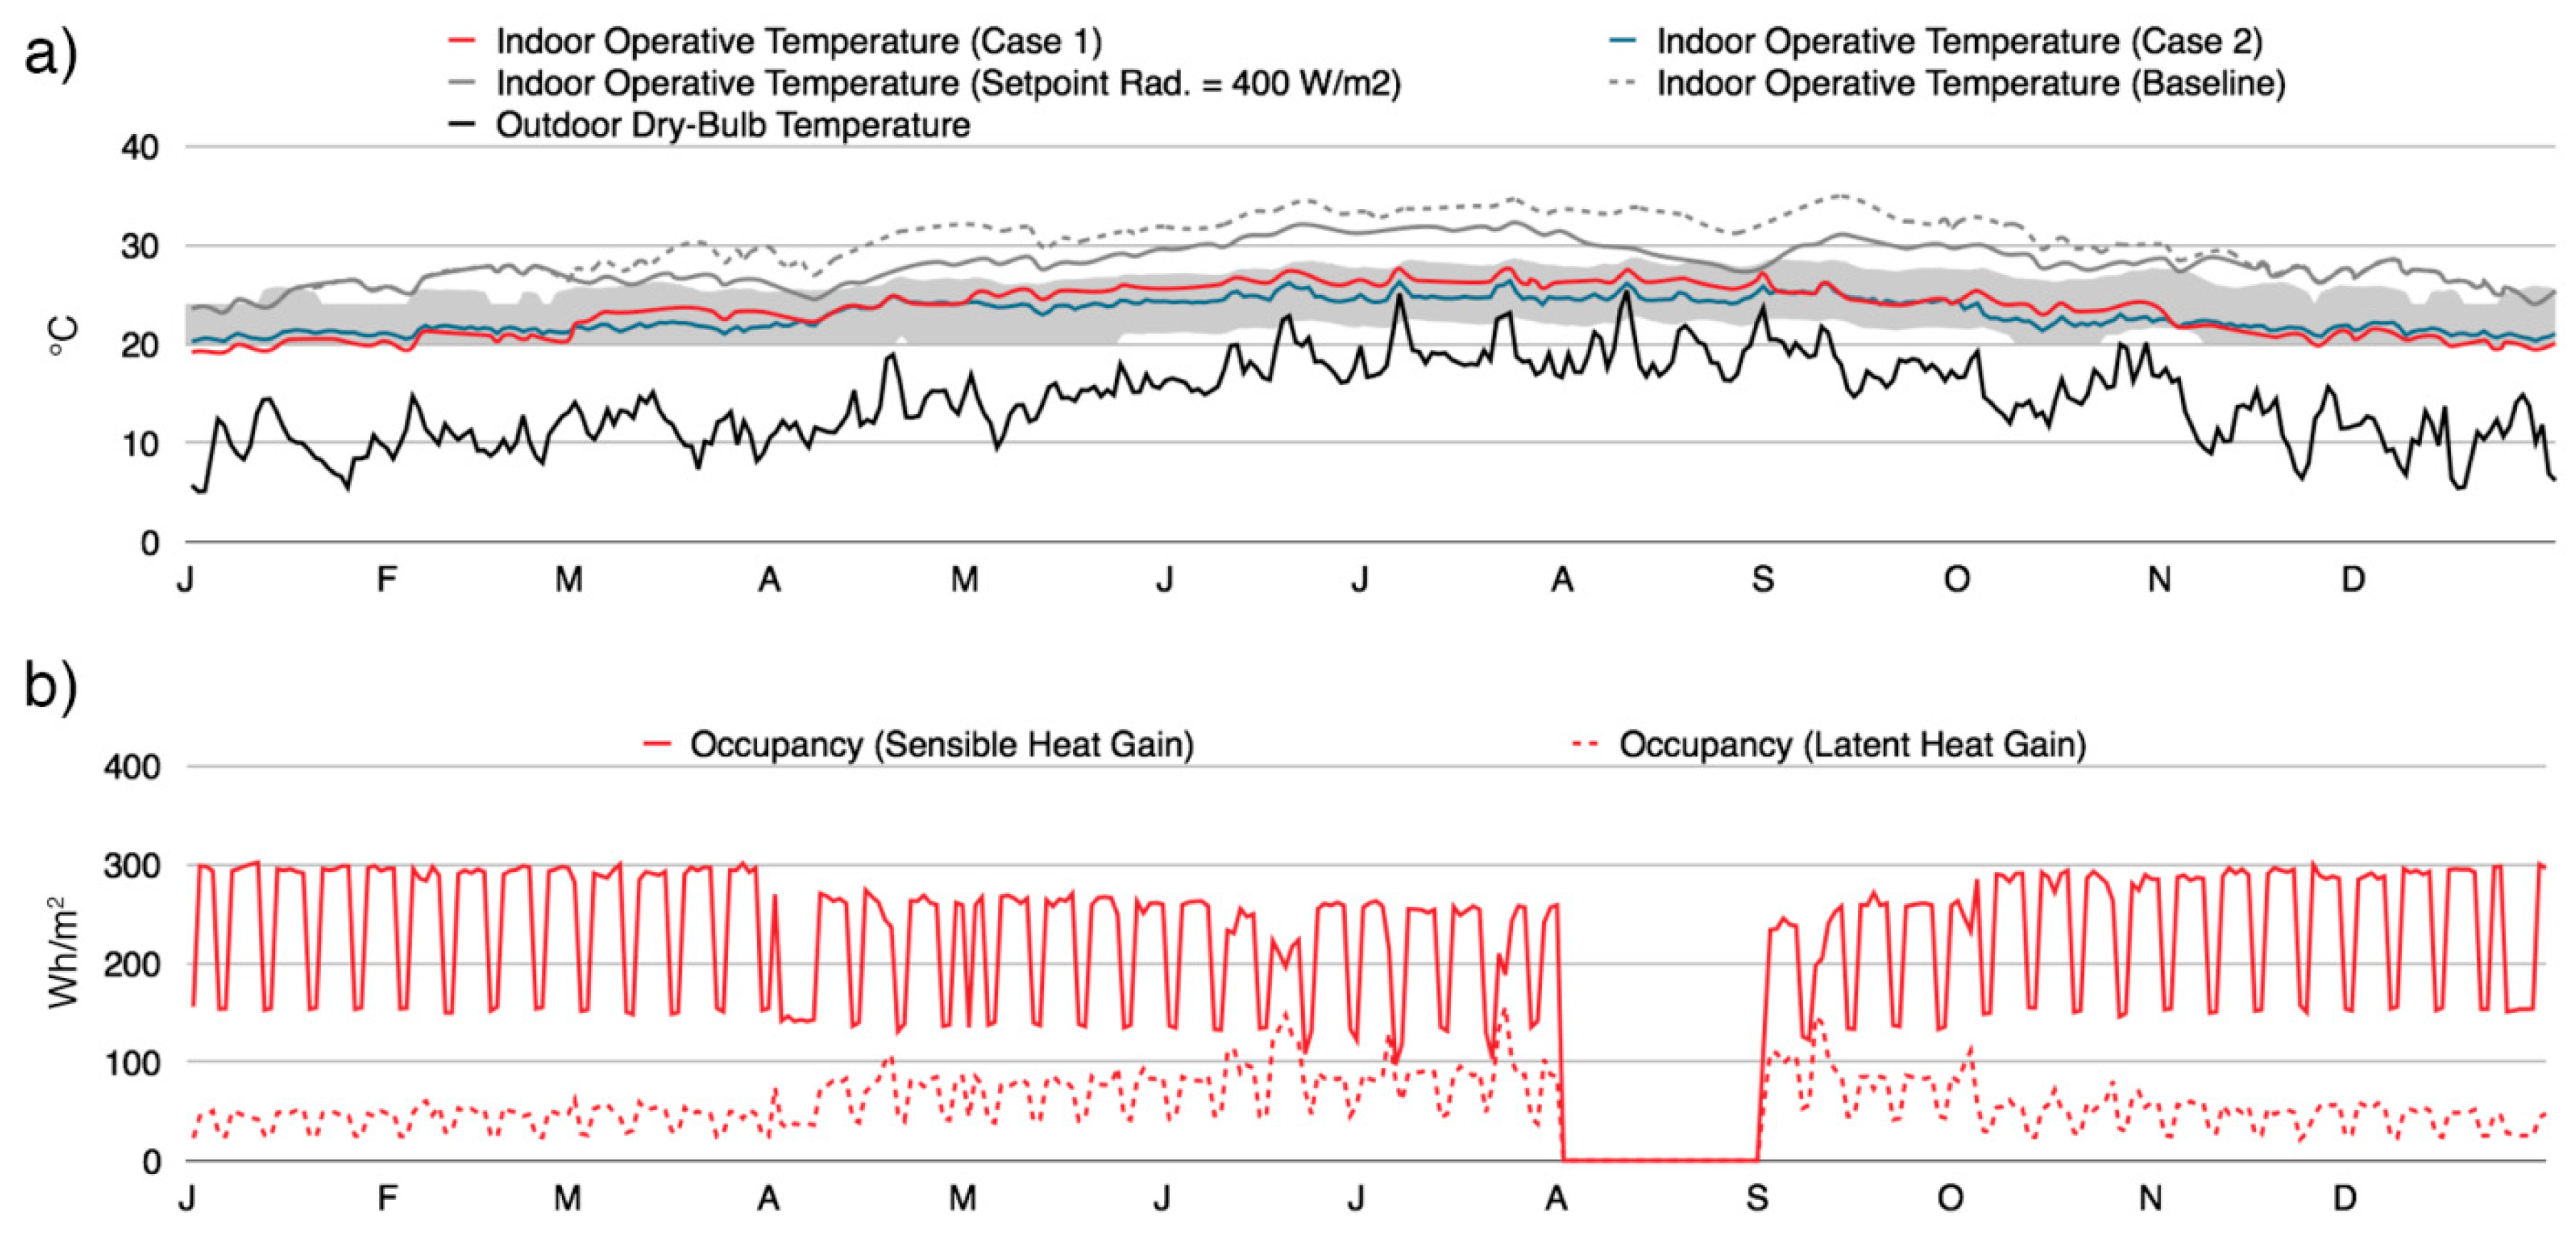
4.3. Scenario 3—Natural Ventilation
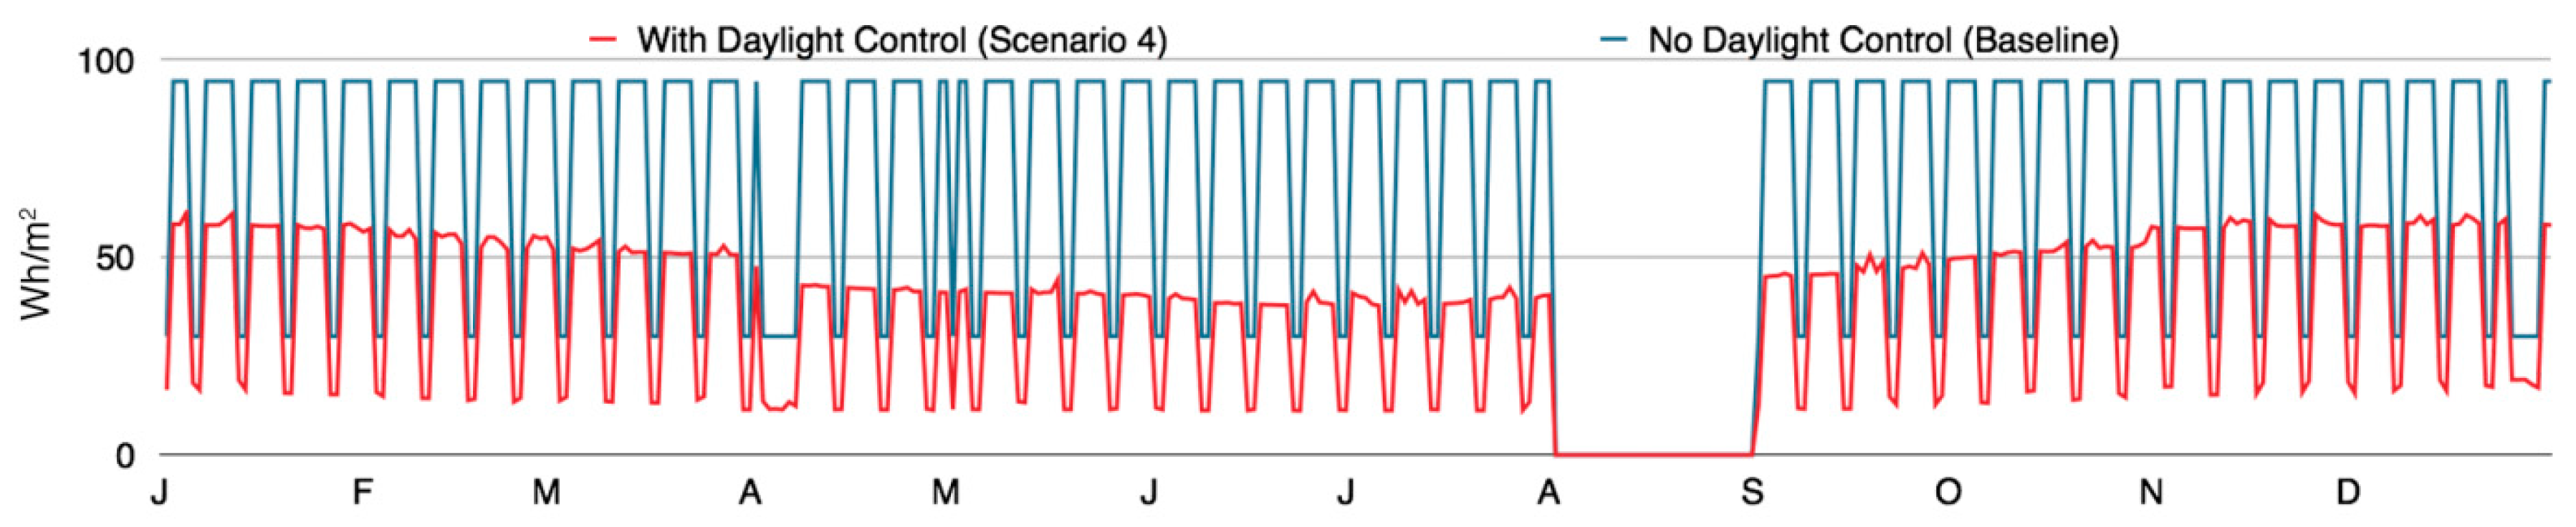
4.4. Scenario 4—Daylight Control
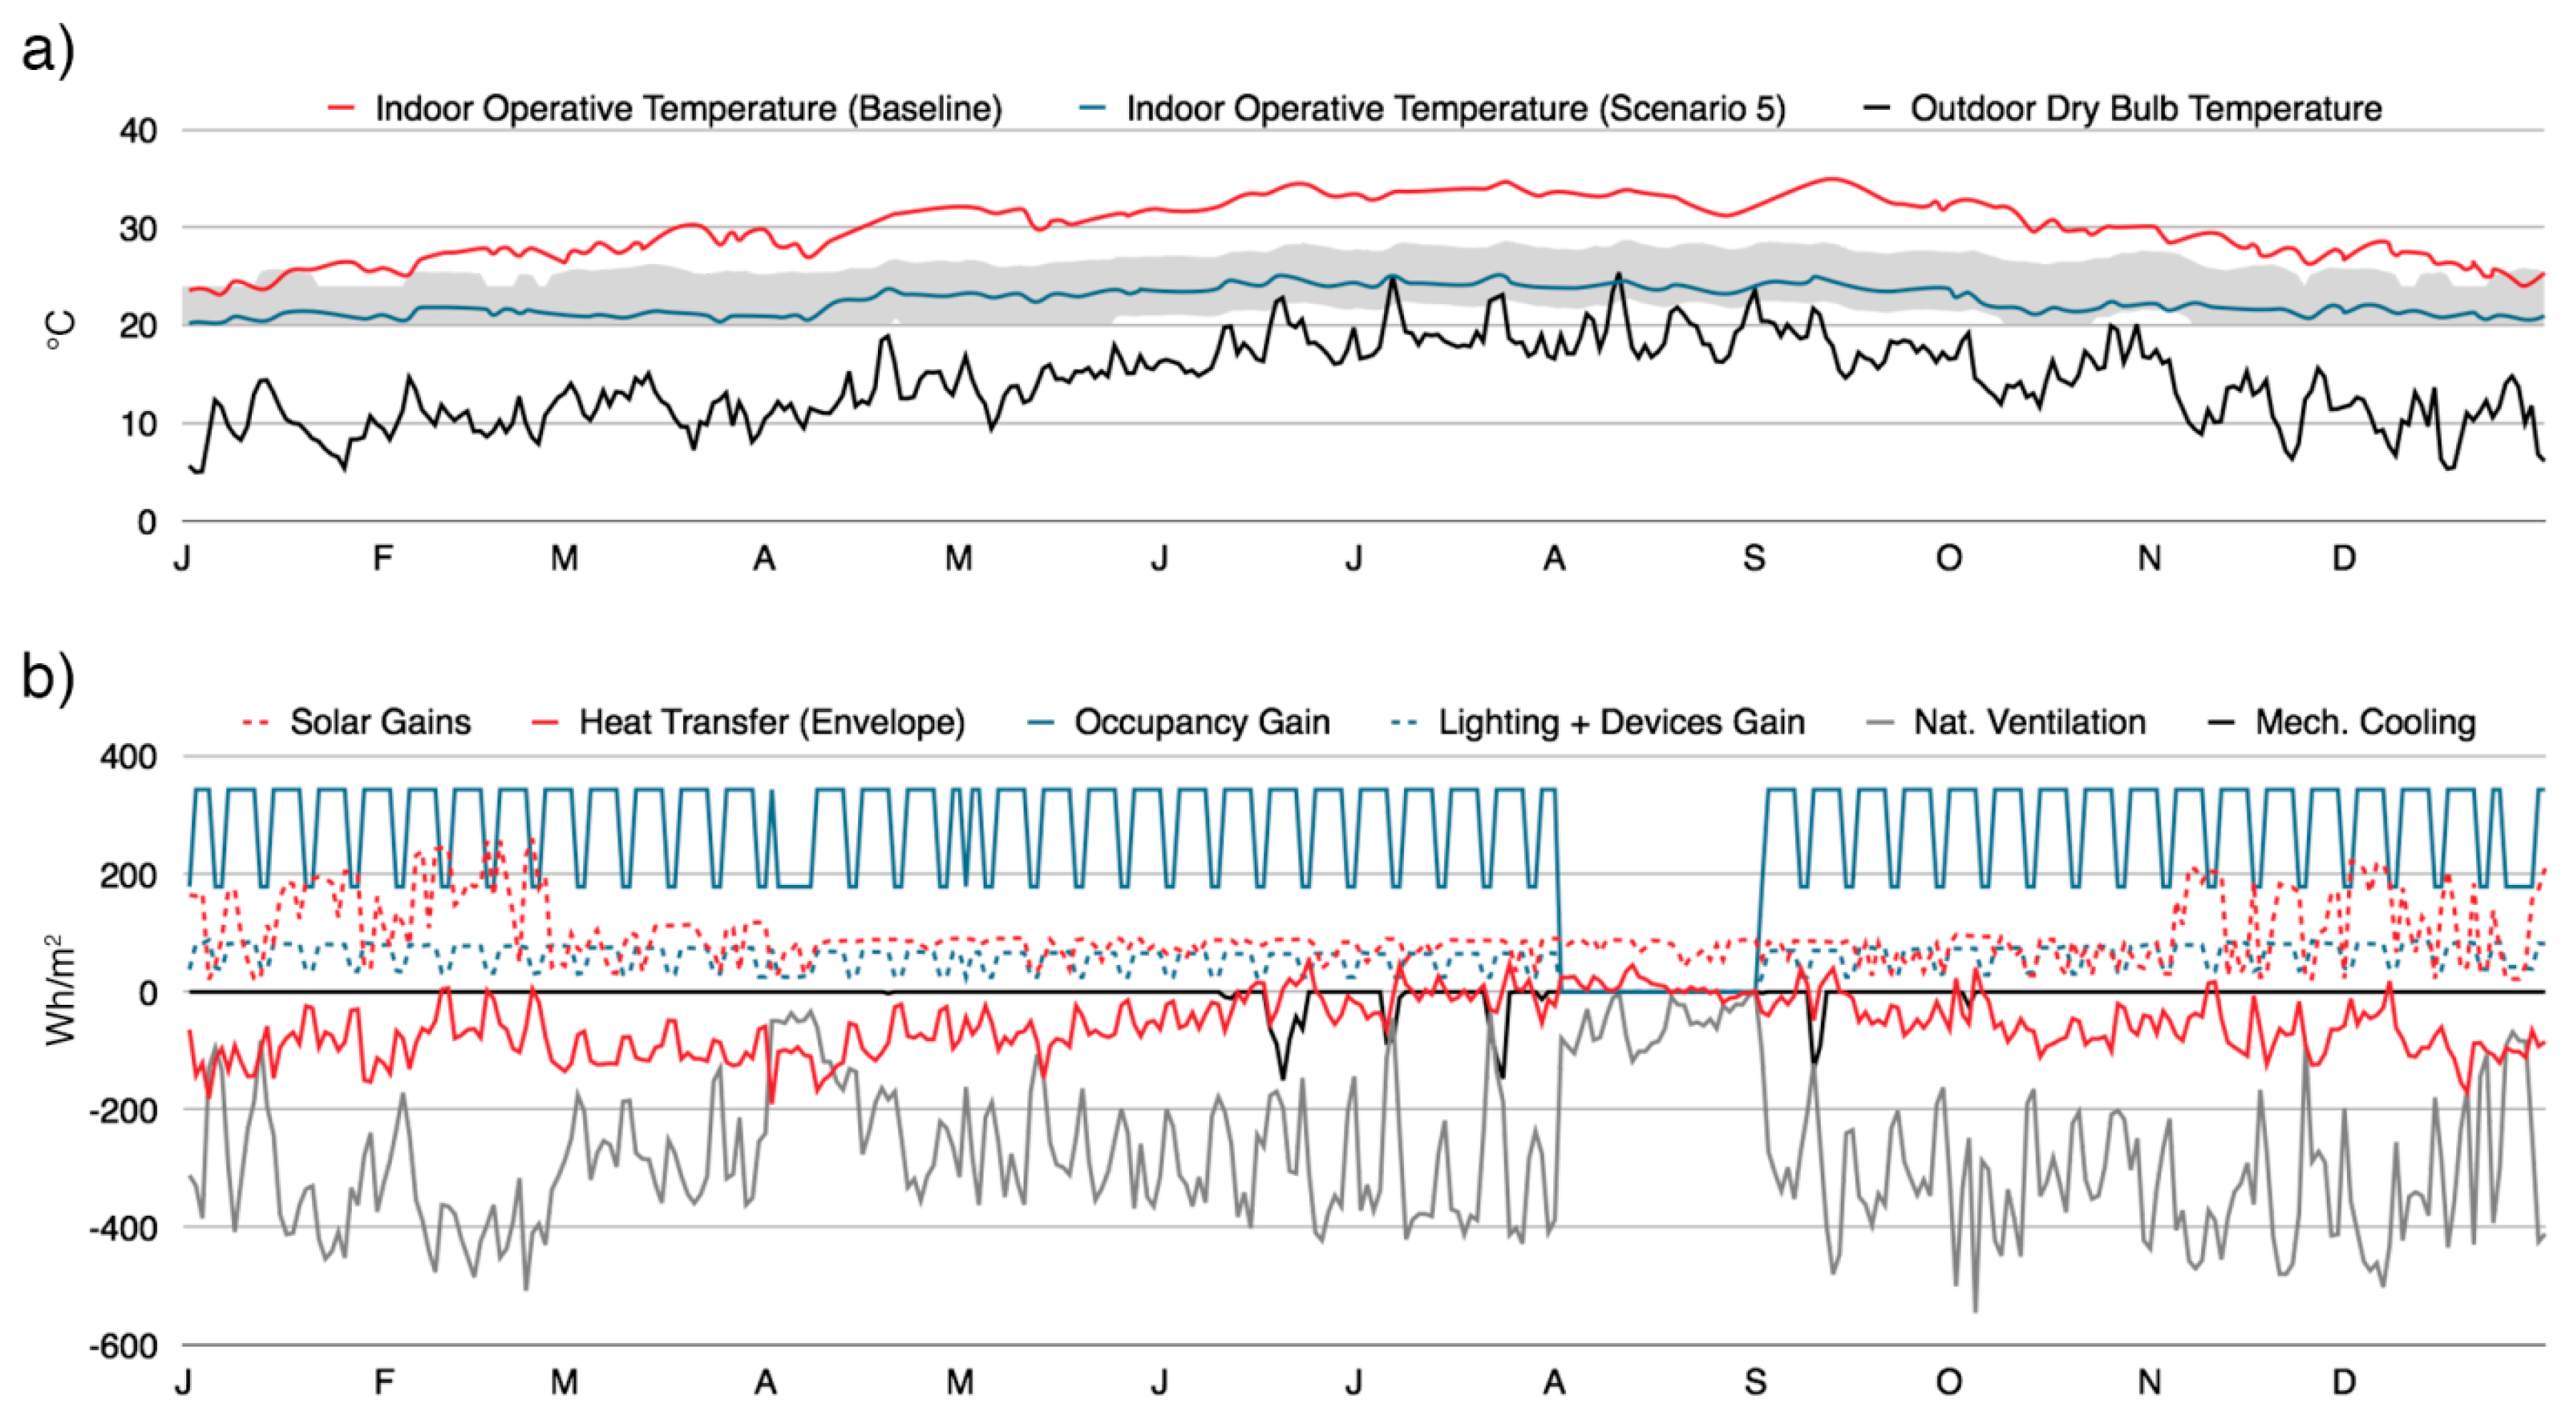
4.5. Scenario 5—Enhanced
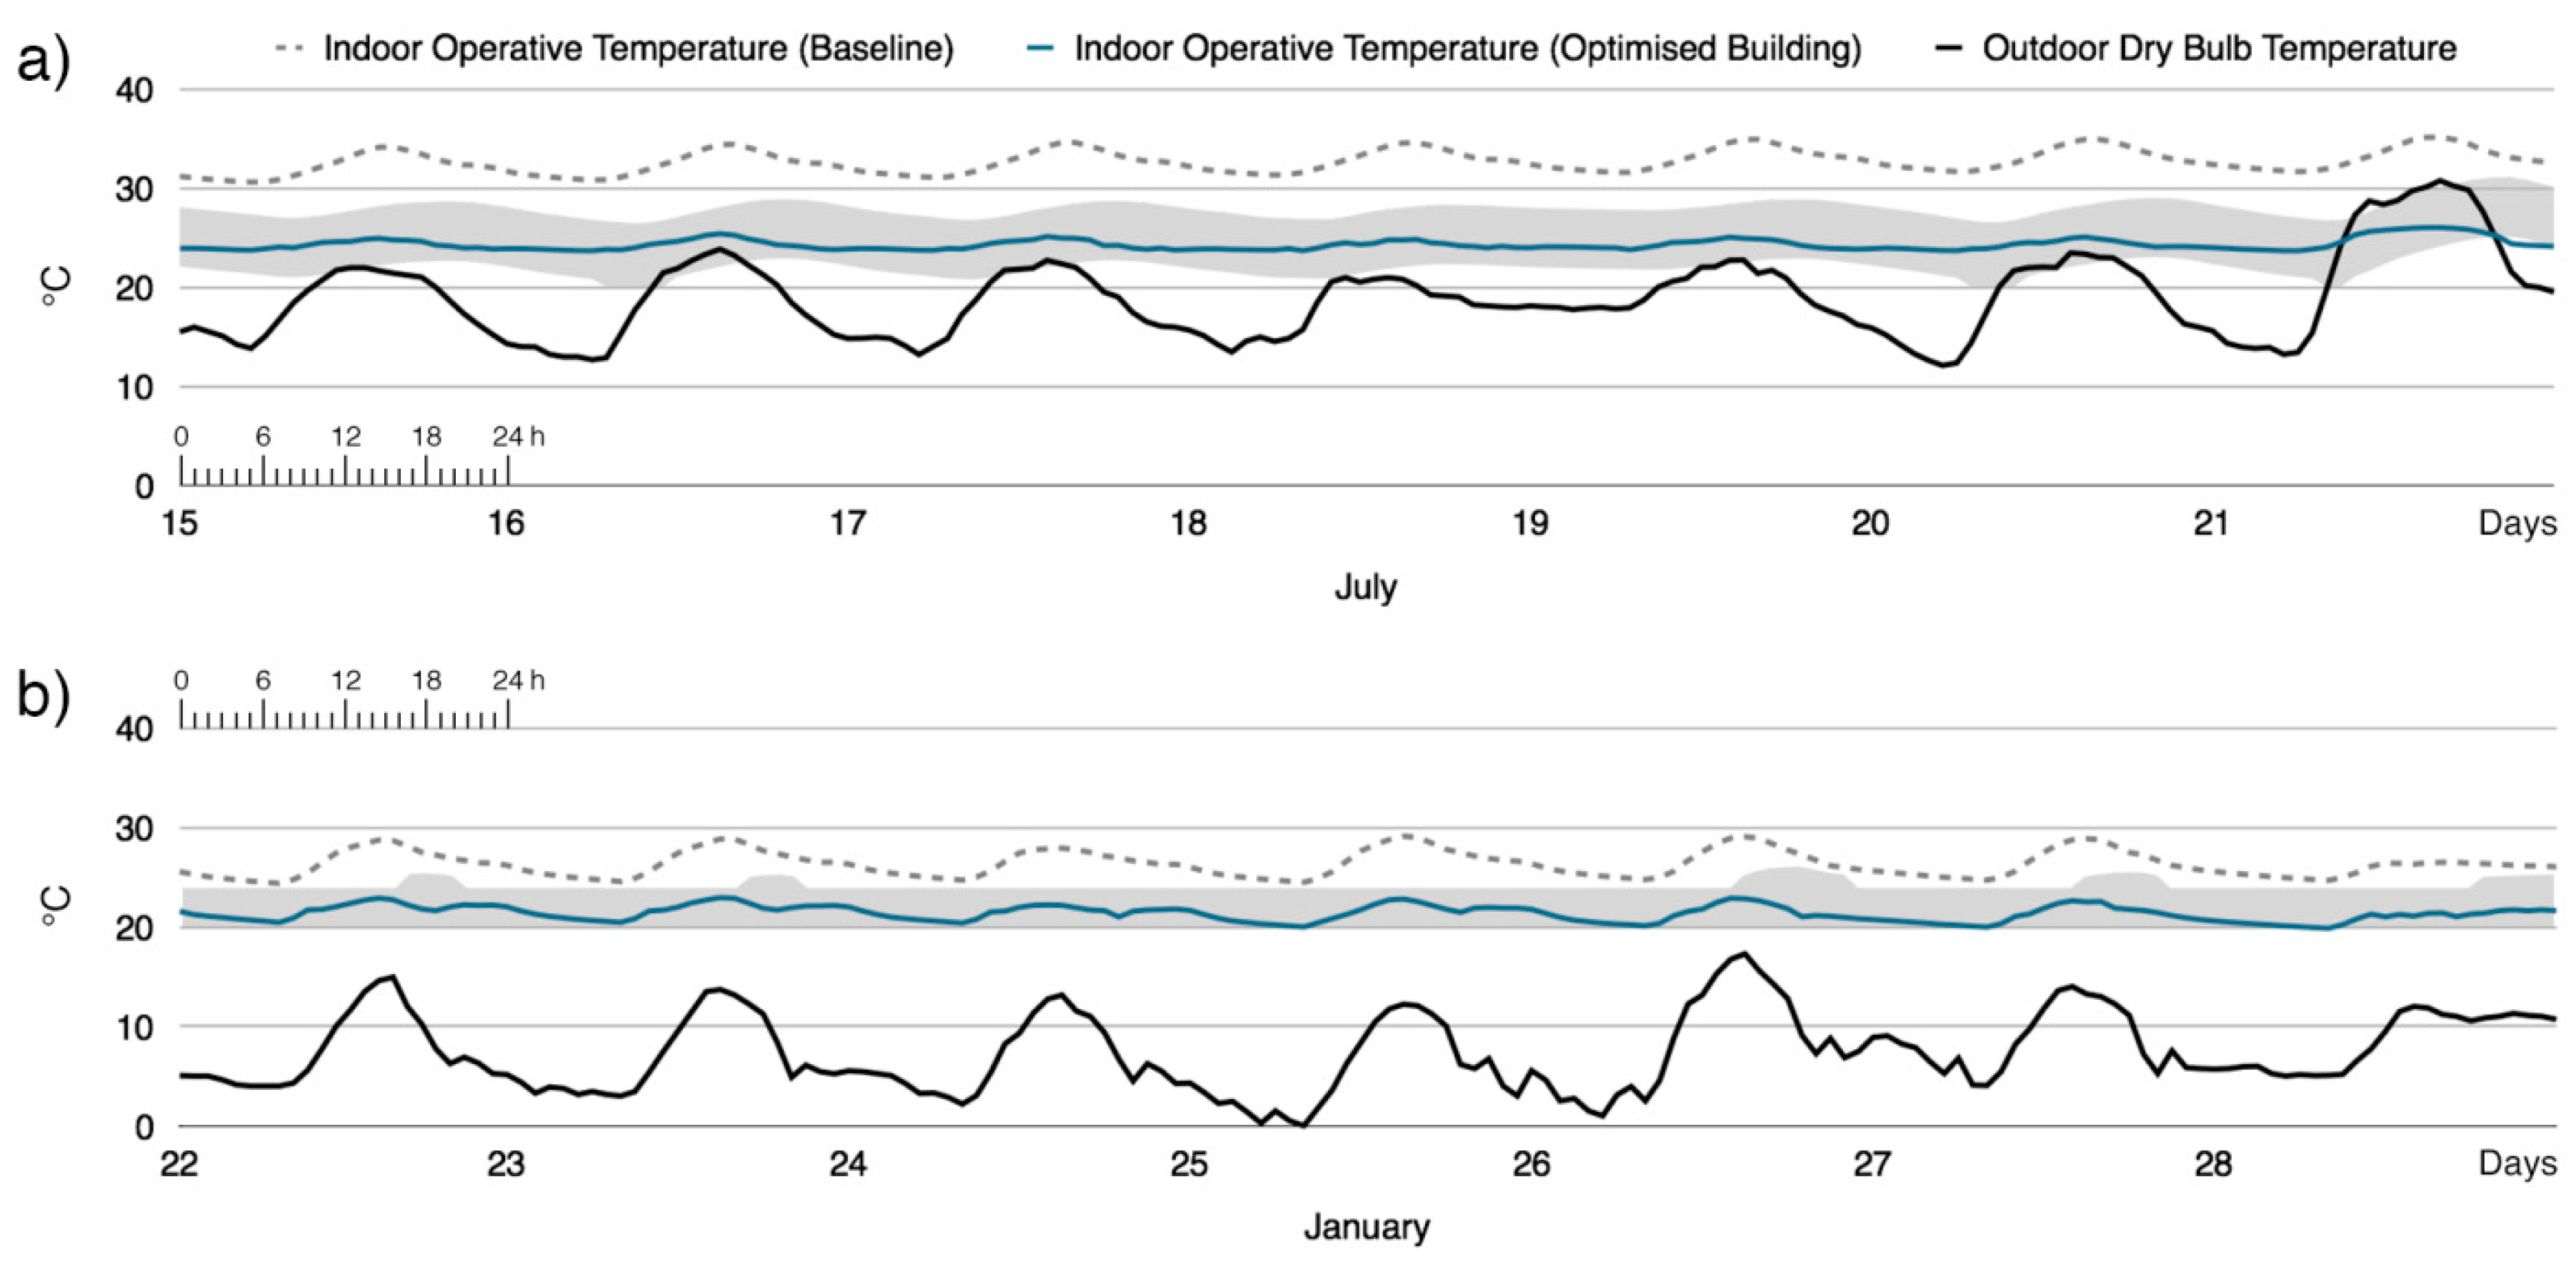
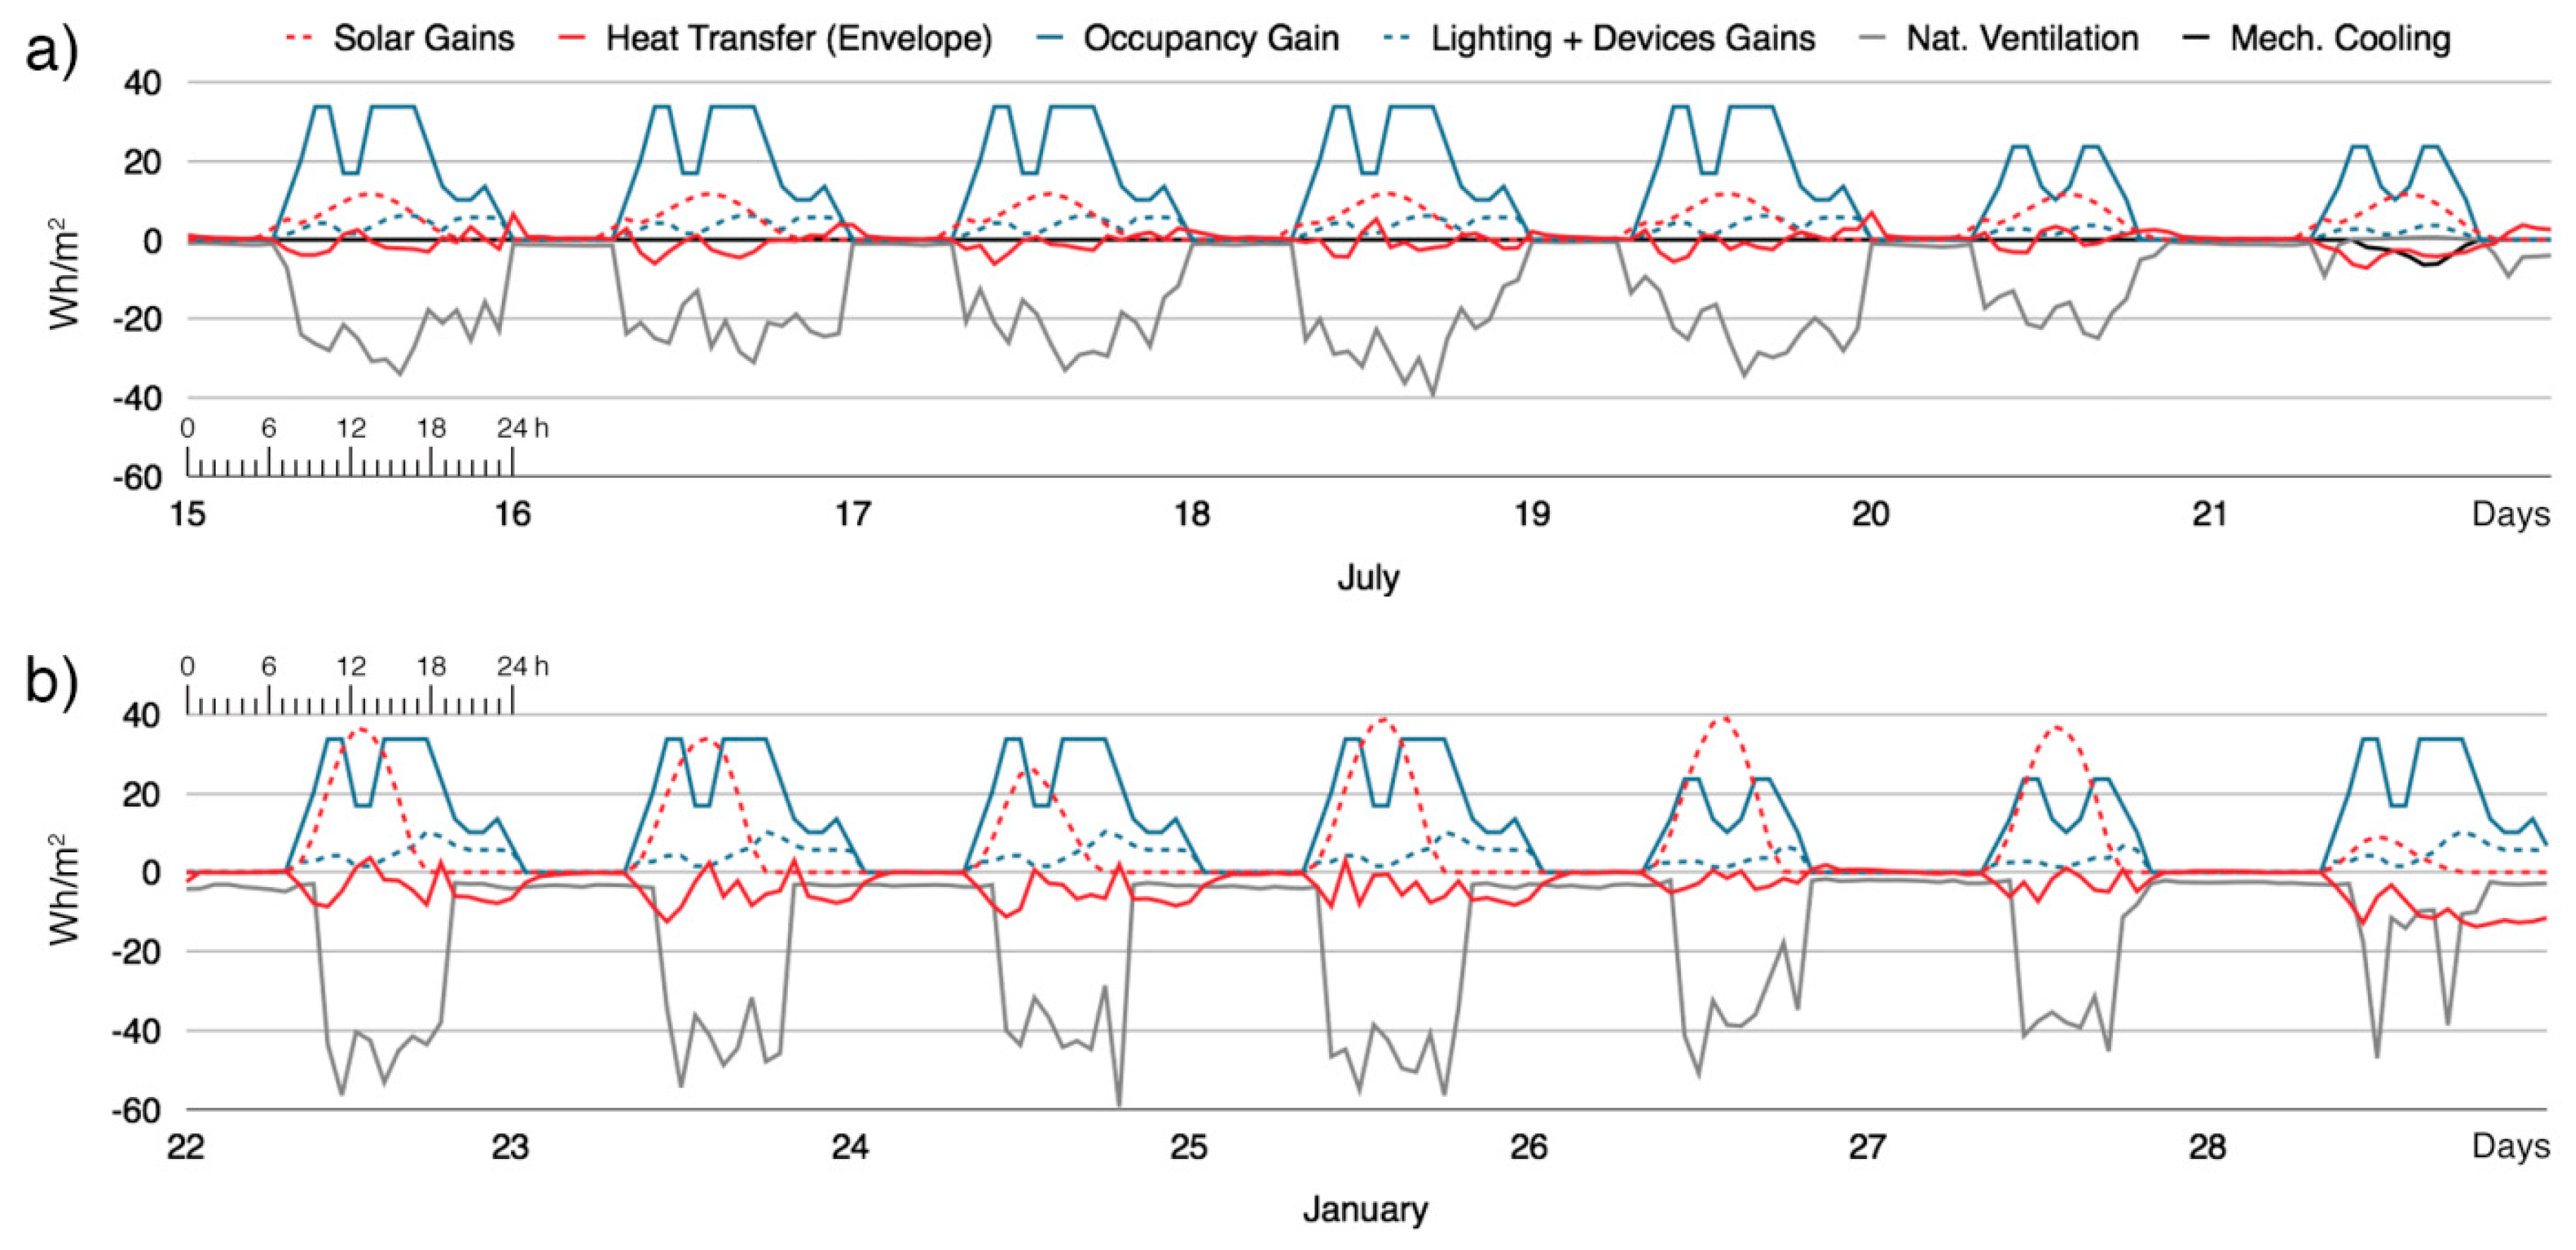
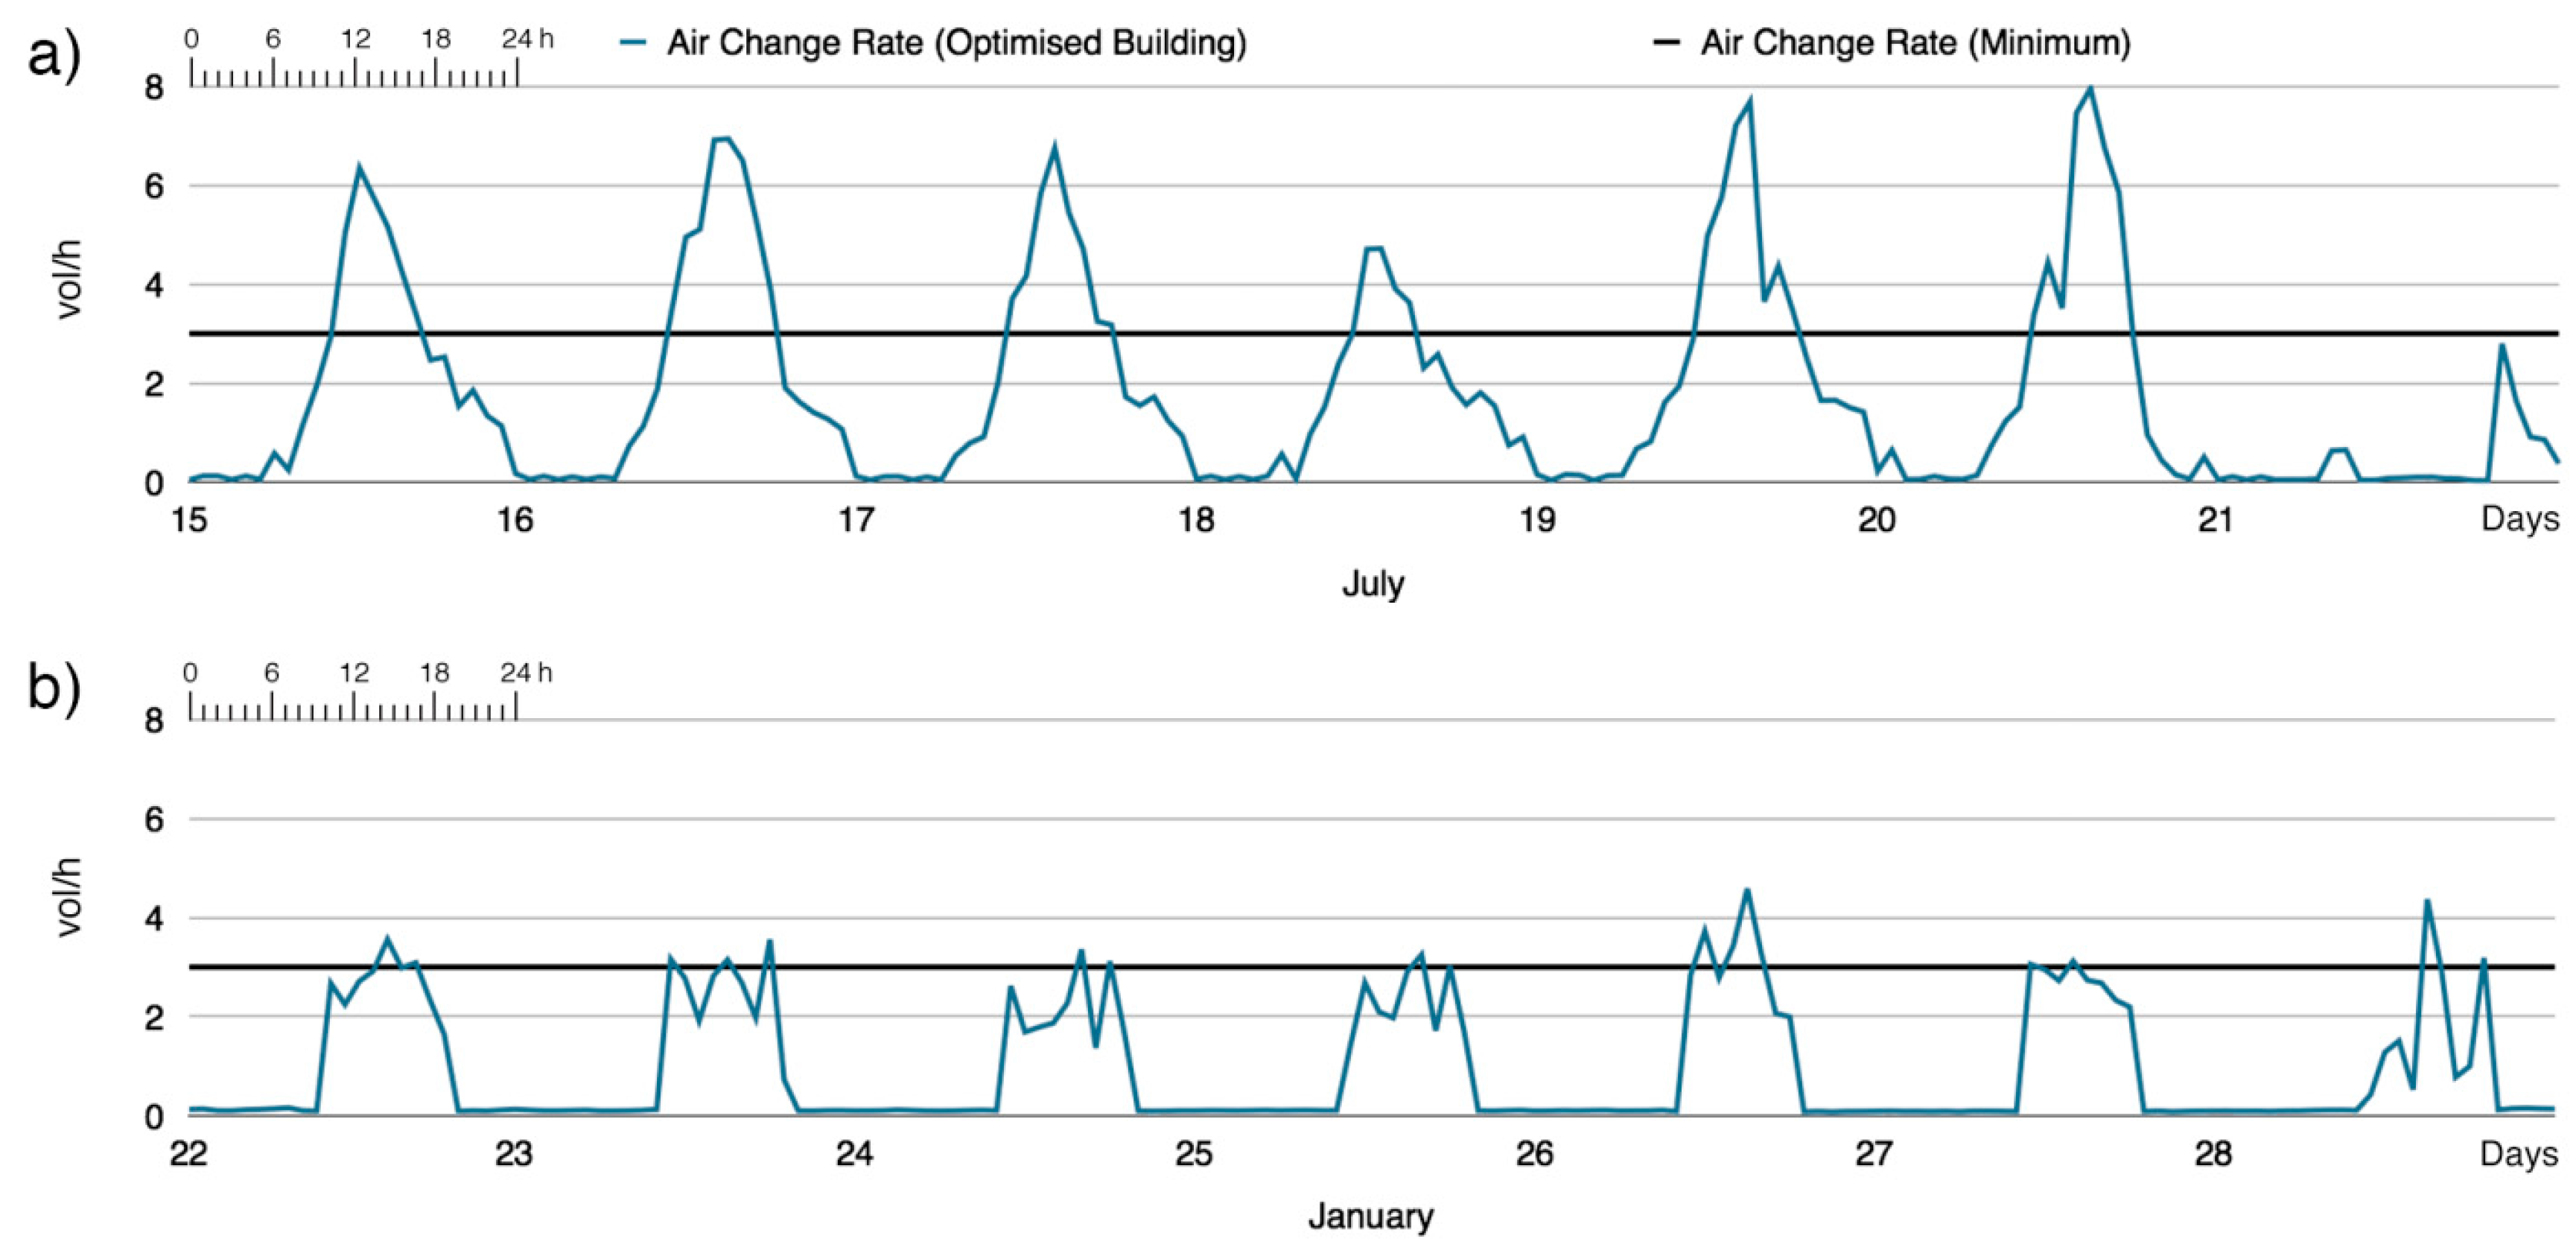
4.6. Hourly Breakdown
5. Conclusions
Author Contributions
Funding
Acknowledgments
Conflicts of Interest
References
- United Nations Framework Convention on Climate Change, Kyoto Protocol, UN. Available online: https://unfccc.int/kyoto_protocol/items/2830.php (accessed on 19 December 2018).
- European Environment Agency, EEA. Available online: https://www.eea.europa.eu (accessed on 19 December 2018).
- Directive 2009/29/EC of the European Parliament and of the Council of 23 April 2009 so as to Improve and extend the greenhouse gas emission allowance trading scheme of the Community. Off. J. Eur. Union 2009, 140, 63–87.
- Directive 2010/31/EU of the European Parliament and of the Council of 19 May 2010 (EPBD) on the Energy Performance of Buildings. Off. J. Eur. Union 2010, 153, 13–35.
- Buildings Performance Institute Europe, BPIE, Nearly Zero Energy Buildings definitions across Europe. Available online: http://bpie.eu/publication/nzeb-definitions-across-europe-2015/ (accessed on 19 December 2018).
- Marszal, A.J.; Heiselberg, P.; Bourrelle, J.S.; Musall, E.; Voss, K.; Sartori, I.; Napolitano, A. Zero Energy Building: A review of definitions and calculation methodologies. Energy Build. 2011, 43, 971–979. [Google Scholar] [CrossRef]
- Penna, P.; Prada, A.; Cappelletti, F.; Gasparella, A. Multi-objective optimization for existing buildings retrofitting under government subsidization. Sci. Technol. Built Environ. 2015, 21, 847–861. [Google Scholar] [CrossRef]
- Mattoni, B.; Guattari, C.; Evangelisti, L.; Bisegna, F.; Gori, P.; Asdrubali, F. Critical review and methodological approach to evaluate the differences among international green building rating tools. Renew. Sustain. Energy Rev. 2018, 82, 950–960. [Google Scholar] [CrossRef]
- PassivHaus Institut. Available online: http://www.passiv.de (accessed on 19 December 2018).
- Mihai, M.; Tanasiev, V.; Dinca, C.; Badea, A.; Vidu, R. Passive house analysis in terms of energy performance. Energy Build. 2017, 144, 74–86. [Google Scholar] [CrossRef]
- Rohdin, P.; Molin, A.; Moshfegh, B. Experiences from nine passive houses in Sweden e Indoor thermal environment and energy use. Build. Environ. 2014, 71, 176–185. [Google Scholar] [CrossRef]
- Figueiredo, A.; Figueira, J.; Vicente, R.; Maio, R. Thermal comfort and energy performance: Sensitivity analysis to apply the Passive House concept to the Portuguese climate. Build. Environ. 2016, 103, 276–288. [Google Scholar] [CrossRef]
- Costanzo, V.; Fabbri, K.; Piraccini, S. Stressing passive behaviour of a Passivehaus: An evidence-based scenario analysis for a Mediterranean case study. Build. Environ. 2018, 142, 265–277. [Google Scholar] [CrossRef]
- Colclough, S.; Kinnane, O.; Hewitt, N.; Griffiths, P. Investigation of nZEB social housing built to the Passive House standard. Energy Build. 2018, 179, 344–359. [Google Scholar] [CrossRef]
- Figueiredo, A.; Kampf, J.; Vicente, R. Passive house optimization for Portugal: Overheating evaluation and energy performance. Energy Build. 2016, 118, 181–196. [Google Scholar] [CrossRef]
- Leadership in Energy and Environmental Design, LEED. Available online: https://new.usgbc.org (accessed on 19 December 2018).
- Cost EFficient Passive Houses as EUropean Standards (C.E.P.H.E.U.S.), Community Research and Development Information Service (CORDIS). Available online: http://cordis.europa.eu (accessed on 19 December 2018).
- Barbosa, R.; Vicente, R.; Santos, R. Climate change and thermal comfort in Southern Europe housing: A case study from Lisbon. Build. Environ. 2015, 92, 440–451. [Google Scholar] [CrossRef]
- Soutullo, S.; Sanchez, M.N.; Enriquez, R.; Olmedo, R.; Jimenez, M.J.; Heras, M.R. Comparative thermal study between conventional and bioclimatic office buildings. Build. Environ. 2016, 105, 95–103. [Google Scholar] [CrossRef]
- Rodriguez-Ubinas, E.; Montero, C.; Porteros, M.; Vega, S.; Navarro, I.; Castillo-Cagigal, M.; Matallanas, E.; Gutiérrez, A. Passive design strategies and performance of Net Energy Plus Houses. Energy Build. 2014, 83, 10–22. [Google Scholar] [CrossRef]
- Ascione, F.; De Masi, R.F.; de Rossi, F.; Ruggiero, S.; Vanoli, G.P. Optimization of building envelope design for nZEBs in Mediterranean climate: Performance analysis of residential case study. Appl. Energy 2016, 183, 938–957. [Google Scholar] [CrossRef]
- Synnefa, A.; Laskari, M.; Gupta, R.; Pisello, A.L.; Santamouris, M. Development of net zero energy settlements using advanced energy technologies. Energy Procedia 2017, 180, 1388–1401. [Google Scholar] [CrossRef]
- Olgyay, V. Design with Climate: Bioclimatic Approach to Architectural Regionalism; Princeton University Press: Princeton, NJ, USA, 1963. [Google Scholar]
- Tzikopoulos, A.F.; Karatza, M.C.; Paravantis, J.A. Modelling energy efficiency of bioclimatic buildings. Energy Build. 2005, 37, 529–544. [Google Scholar] [CrossRef]
- Souza, E.; Archdaily. Faculty of Architecture of the University of Porto Through Fernando Guerra’s Lenses. 2017. Available online: http://www.archdaily.com (accessed on 19 December 2018).
- Köppen, W. The geographic system of climate. In Handbook of Climatology; Gebrüder Bornträger: Berlin, Germany, 1936; Part 1-C. [Google Scholar]
- Weather Data Sources, Energy. Available online: https://energyplus.net/weather/sources (accessed on 27 November 2017).
- Irulegi, O.; Torres, L.; Serra, A.; Mendizabal, I.; Hernández, R. The Ekihouse: An energy self-sufficient house based on passive design strategies. Energy Build. 2014, 83, 57–69. [Google Scholar] [CrossRef]
- Moita, F. Energia Solar Passive; Argomentum: Lisbona, Portugal, 2010. [Google Scholar]
- Okeil, A. A holistic approach to energy efficient building forms. Energy Build. 2010, 42, 1437–1444. [Google Scholar] [CrossRef]
- Caruso, G.; Fantozzi, F.; Leccese, F. Optimal theoretical building form to minimize direct solar irradiation. Sol. Energy 2013, 97, 128–137. [Google Scholar] [CrossRef]
- Depecker, P.; Menezo, C.; Virgone, J.; Lepers, S. Design of buildings shape and energetic consumption. Build. Environ. 2001, 36, 627–635. [Google Scholar] [CrossRef]
- Albatici, R.; Passerini, F. Bioclimatic design of buildings considering heating requirements in Italian climatic conditions: A simplified approach. Build. Environ. 2011, 46, 1624–1631. [Google Scholar] [CrossRef]
- Ourghi, R.; Al-Anzi, A.; Krarti, M. A simplified analysis method to predict the impact of shape on annual energy use for office buildings. Energy Convers. Manag. 2007, 48, 300–305. [Google Scholar] [CrossRef]
- Magrini, A.; Giobbi, L.; D’Ambrosio, F.R. Energy Audit of Public Buildings: The Energy Consumption of a University with Modern and Historical Buildings. Some Results. Energy Procedia 2016, 101, 169–175. [Google Scholar] [CrossRef]
- Fantozzi, F.; Leccese, F.; Salvadori, G.; Rocca, M.; Garofalo, M. LED lighting for indoor sports facilities: Can its use be considered as sustainable solution from a techno-economic standpoint? Sustainability 2016, 8, 618. [Google Scholar] [CrossRef]
- Leccese, F.; Salvadori, G.; Casini, M.; Bertozzi, M. Analysis and measurements of artificial optical radiation (AOR) emitted by lighting sources found in offices. Sustainability 2014, 6, 5941–5954. [Google Scholar] [CrossRef]
- Zhu, J.; Li, D. Current Situation of Energy Consumption and Energy Saving Analysis of Large Public Building. Procedia Eng. 2015, 121, 1208–1214. [Google Scholar] [CrossRef]
- Nocera, F.; Lo Faro, A.; Costanzo, V.; Raciti, C. Daylight Performance of Classrooms in a Mediterranean School Heritage Building. Sustainability 2018, 10, 3705. [Google Scholar] [CrossRef]
- Costanzo, V.; Evola, G.; Marletta, L.; Pistone Nascone, F. Application of Climate Based Daylight Modelling to Refurbishment of a School Building in Sicily. Sustainability 2018, 10, 2653. [Google Scholar] [CrossRef]
- Costanzo, V.; Donn, M. Thermal and visual comfort assessment of natural ventilated office buildings in Europe and North America. Energy Build. 2017, 140, 210–223. [Google Scholar] [CrossRef]
- Kazanasmaz, T.; Grobe, L.O.; Bauer, C.; Krehel, M.; Wittkopf, S. Three approaches to optimize optical properties and size of a South-facing window for spatial Daylight Autonomy. Build. Environ. 2016, 102, 243–256. [Google Scholar] [CrossRef]
- Mohsenin, M.; Hu, J. Assessing daylight performance in atrium buildings by using Climate Based Daylight Modeling. Sol. Energy 2015, 119, 553–560. [Google Scholar] [CrossRef]
- Leccese, F.; Salvadori, G.; Asdrubali, F.; Gori, P. Passive thermal behaviour of buildings: Performance of external multi-layered walls and influence of internal walls. Appl. Energy 2018, 225, 1078–1089. [Google Scholar] [CrossRef]
- Aste, N.; Angelotti, A.; Buzzetti, M. The influence of the external walls thermal inertia on the energy performance of well insulated buildings. Energy Build. 2009, 41, 1181–1187. [Google Scholar] [CrossRef]
- Stazi, F.; Bonfigli, C.; Tomassoni, E.; Di Perna, C.; Munafó, P. The effect of high thermal insulation on high thermal mass: Is the dynamic behaviour of traditional envelopes in Mediterranean climates still possible? Energy Build. 2015, 88, 367–383. [Google Scholar] [CrossRef]
- Leccese, F.; Salvadori, G.; Barlit, M. Ventilated flat roofs: A simplified model to assess their hygrothermal behaviour. J. Build. Eng. 2019, 22, 12–21. [Google Scholar] [CrossRef]
- Ciampi, M.; Leccese, F.; Tuoni, G. Ventilated facades energy performance in summer cooling of buildings. Sol. Energy 2003, 75, 491–502. [Google Scholar] [CrossRef]
- Wang, L.; Ma, P.; Hu, E.; Giza-Sisson, D.; Mueller, G.; Guo, N. A study of building envelope and thermal mass requirements for achieving thermal autonomy in an office building. Energy Build. 2014, 78, 79–88. [Google Scholar] [CrossRef]
- Nicol, F.; Humphreys, M. Derivation of the adaptive equations for thermal comfort in free-running buildings in European standard EN15251. Build. Environ. 2010, 45, 11–17. [Google Scholar] [CrossRef]
- Gratia, E.; Bruyère, I.; De Herde, A. How to use natural ventilation to cool narrow office buildings. Build. Environ. 2004, 39, 1157–1170. [Google Scholar] [CrossRef]
- Capeluto, I.G. A methodology for the qualitative analysis of winds: Natural ventilation as a strategy for improving the thermal comfort in open spaces. Build. Environ. 2005, 40, 175–181. [Google Scholar] [CrossRef]
- Kim, J.; Hong, T.; Jeong, J.; Lee, M.; Lee, M.; Jeong, K.; Koo, C. Establishment of an optimal occupant behaviour considering the energy consumption and indoor environmental quality by region. Appl. Energy 2017, 204, 1431–1443. [Google Scholar] [CrossRef]
- Sun, K.; Hong, T. A framework for quantifying the impact of occupant behaviour on energy savings of energy conservation measures. Energy Build. 2017, 146, 383–396. [Google Scholar] [CrossRef]
- Frontczak, M.; Wargocki, P. Questionnaire survey on factors influencing comfort with indoor environmental quality in Danish housing. Build. Environ. 2012, 50, 56–64. [Google Scholar] [CrossRef]
- Meerbeek, B.; de Bakker, C.; de Kort, Y.A.W.; van Loene, E.; Bergman, T. Automated blinds with light feedback to increase occupant satisfaction and energy saving. Build. Environ. 2016, 103, 70–85. [Google Scholar] [CrossRef]
- Bakker, L.G.; Hoes-van Oeffelen, E.C.M.; Loonen, R.C.G.M.; Hensen, J.L.M. User satisfaction and interaction with automated dynamic façades: A pilot study. Build. Environ. 2014, 78, 44–52. [Google Scholar] [CrossRef]
- Crawley, D.B.; Hand, J.W.; Kummert, M.; Griffith, B.T. Contrasting the capabilities of building energy performance simulation programs. Build. Environ. 2008, 43, 661–673. [Google Scholar] [CrossRef]
- Nicol, F.; Humphreys, M. Adaptive thermal comfort and sustainable thermal standards for buildings. Energy Build. 2002, 34, 563–572. [Google Scholar] [CrossRef]
- Zomorodian, Z.S.; Tahsildoost, M.; Hafezi, M. Thermal comfort in educational buildings: A review article. Renew. Sustain. Energy Rev. 2016, 59, 895–906. [Google Scholar] [CrossRef]
- Kim, J.; de Dear, R. Thermal comfort expectations and adaptive behavioural characteristics of primary and secondary school students. Build. Environ. 2018, 127, 13–22. [Google Scholar] [CrossRef]
- Jiang, J.; Wang, D.; Liu, Y.; Xu, Y.; Liu, J. A study on pupils’ learning performance and thermal comfort of primary schools in China. Build. Environ. 2018, 134, 102–113. [Google Scholar] [CrossRef]
- Fabbri, K. Indoor Thermal Comfort Perception: A Questionnaire Approach Focusing on Children; Springer: London, UK, 2015. [Google Scholar]
- Citterio, M.; Fasano, G. Indagine sui Consumi Degli Edifici Pubblici (Direzionale e Scuole) e Potenzialità Degli Interventi di Efficienza Energetica; Report RSE 165/2009; ENEA: Stockholm, Sweden, 2009. [Google Scholar]


| Month | TAIR,MM | TA,MIN,MM | TA,MAX,MM | TGRO,MM | IH,HM | RHMM | VWIND,MM | DWIND,MM |
|---|---|---|---|---|---|---|---|---|
| °C | °C | °C | °C | Wh/m2 | % | m/s | °NORTH,CW | |
| January | 9 | 0 | 17 | 12 | 187 | 80 | 2 | 100 |
| February | 11 | 2 | 21 | 11 | 253 | 81 | 4 | 172 |
| March | 12 | 1 | 21 | 11 | 346 | 78 | 3 | 185 |
| April | 13 | 5 | 26 | 12 | 425 | 76 | 3 | 194 |
| May | 15 | 3 | 24 | 14 | 443 | 78 | 4 | 227 |
| June | 18 | 9 | 29 | 15 | 474 | 75 | 1 | 231 |
| July | 19 | 10 | 32 | 17 | 457 | 80 | 3 | 229 |
| August | 19 | 10 | 31 | 18 | 450 | 76 | 2 | 163 |
| September | 18 | 9 | 30 | 18 | 374 | 81 | 1 | 202 |
| October | 16 | 6 | 27 | 17 | 293 | 76 | 3 | 168 |
| November | 12 | 1 | 20 | 15 | 181 | 80 | 3 | 157 |
| December | 10 | 0 | 19 | 13 | 164 | 82 | 1 | 162 |
| Location | Köppen | HDD | CDD |
|---|---|---|---|
| Porto (Airport) 41.23° N, 8.68° W | Csb | 1566 | 11 |
| (TREF = 20 °C) | (TREF = 26 °C) |
| ID | S | V | Occupants | Weekday | Weekend | ACH | EM | DF | |
|---|---|---|---|---|---|---|---|---|---|
| m2 | m3 | n° | h | h | Vol/h | lx | % | ||
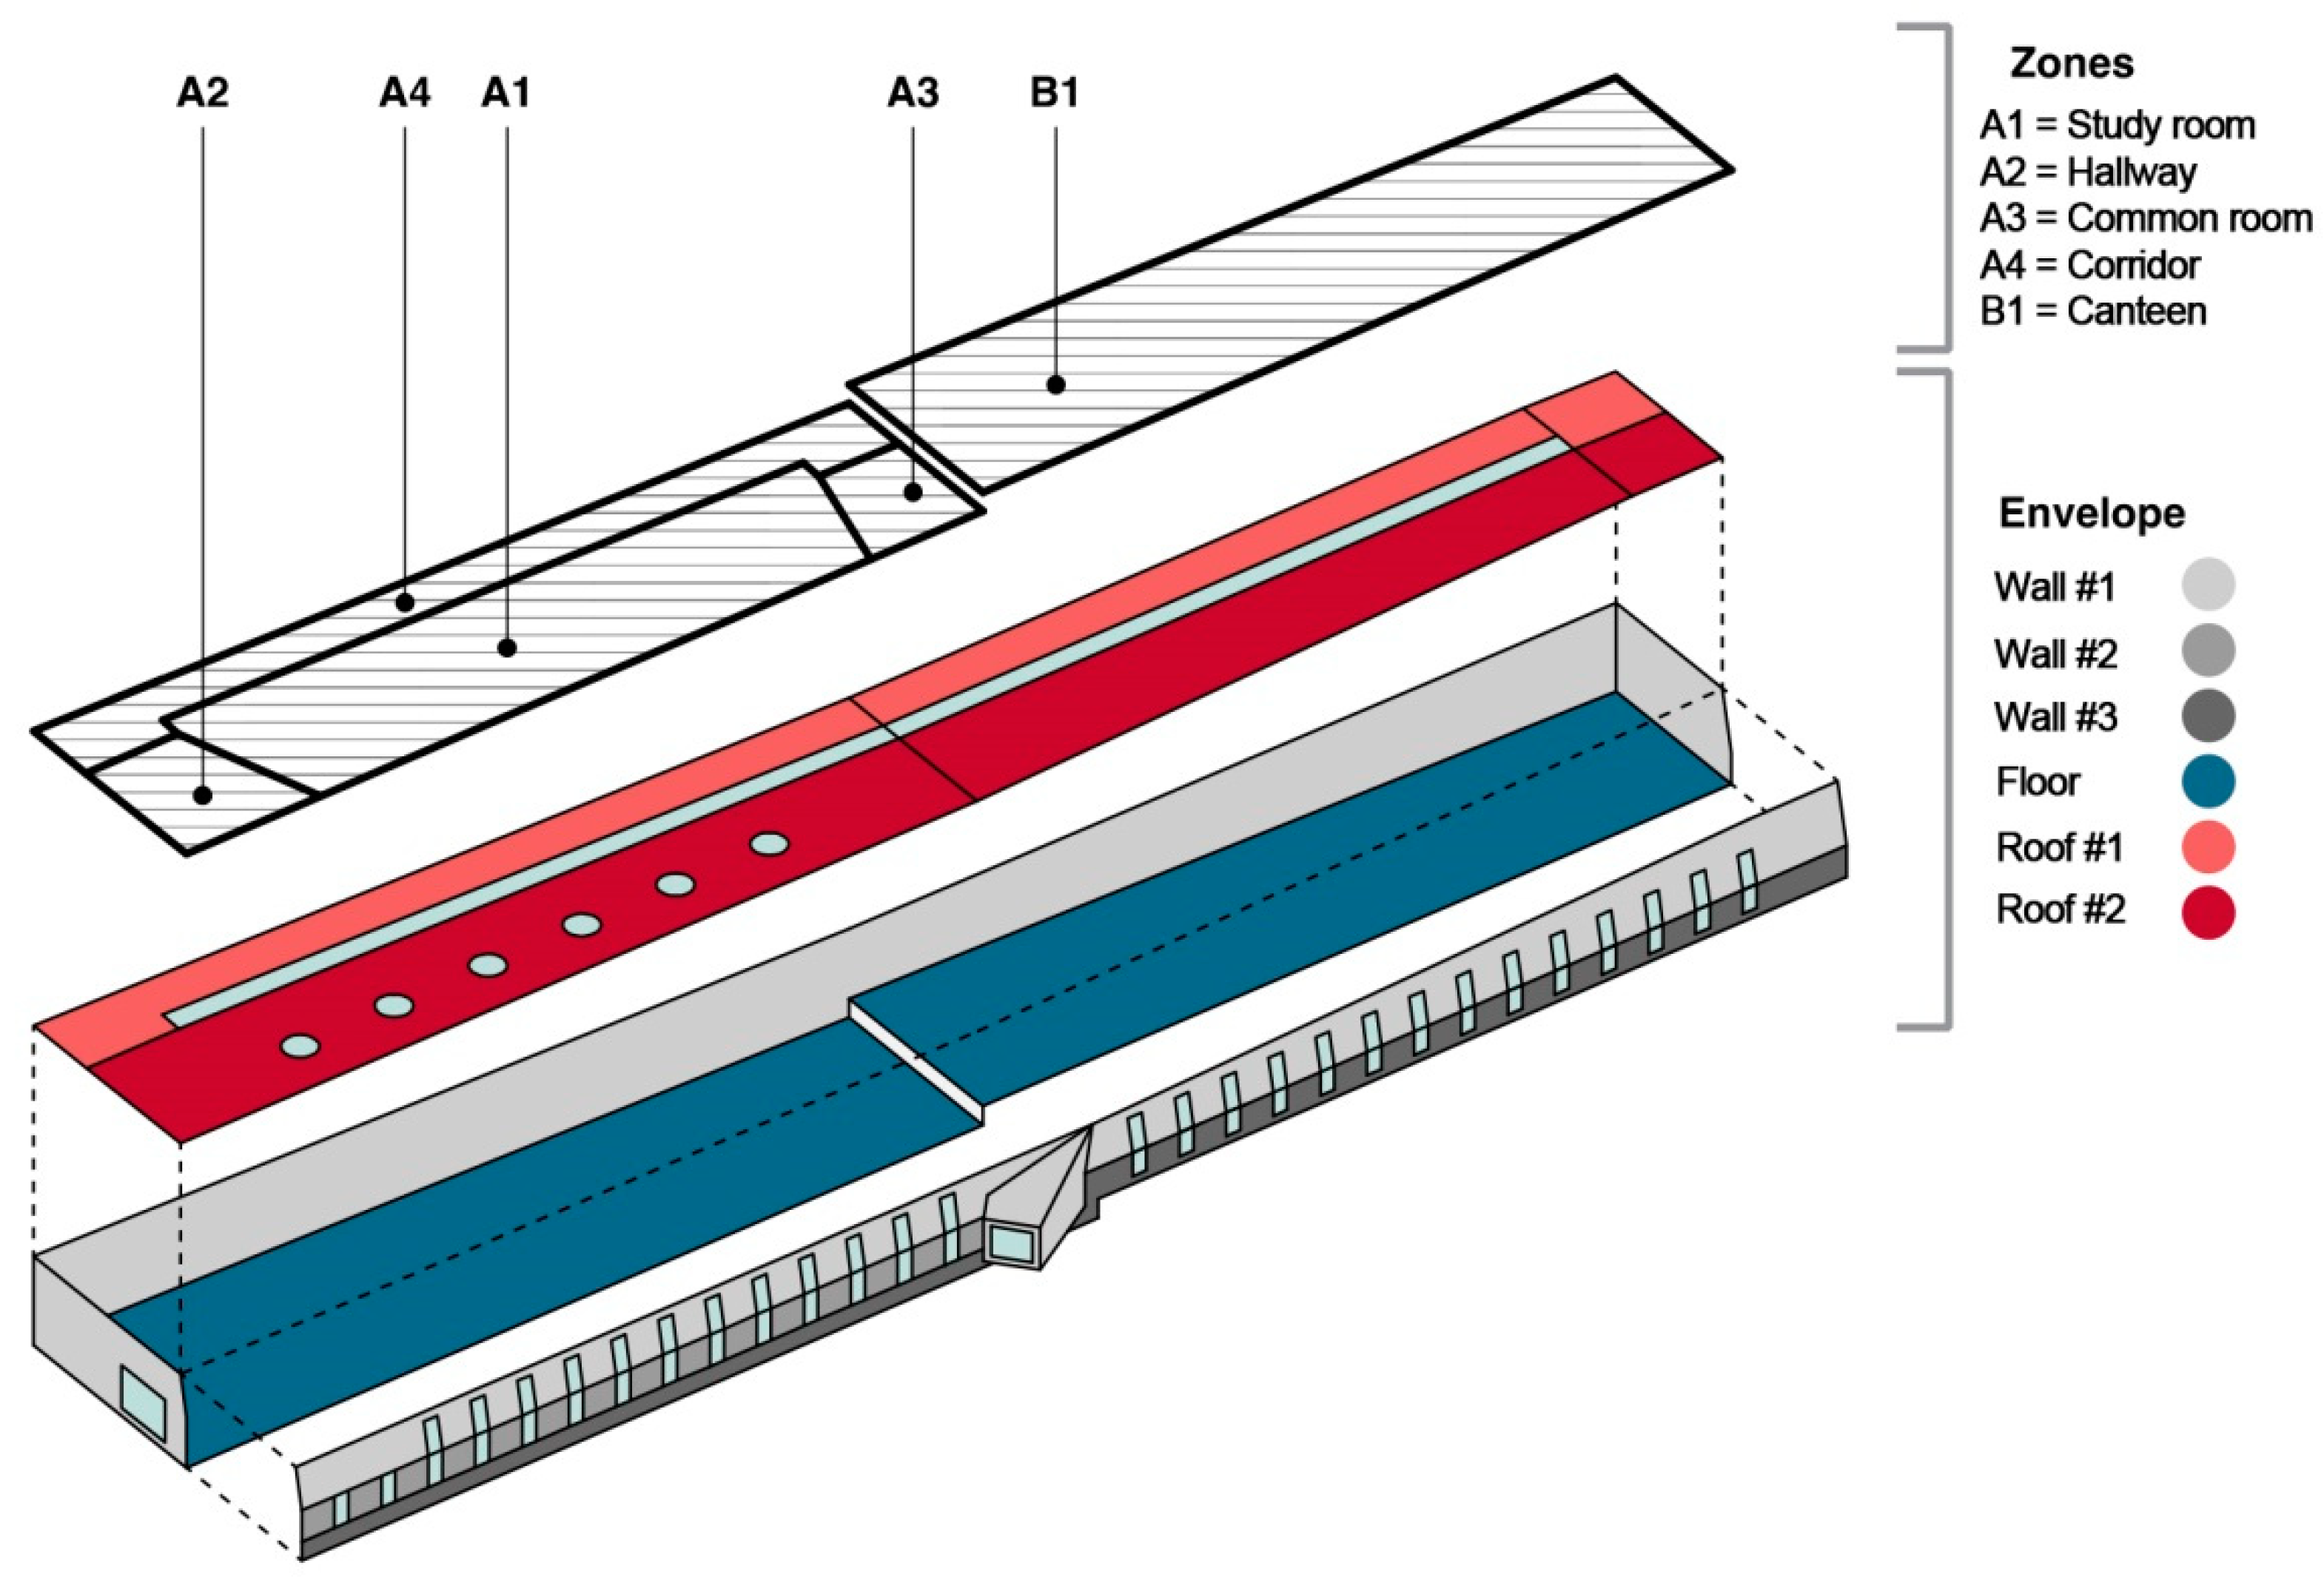
| A1 | Study room | 370 | 1590 | 110 | 08–24 | 08–18 | 3.0 | 500 | 3 |
| A2 | Hallway | 56 | 148 | 5 | 08–24 | 08–18 | 1.5 | 200 | 1 |
| A3 | Common room | 56 | 148 | 10 | 08–24 | 08–18 | 3.0 | 200 | 1 |
| A4 | Corridor | 166 | 510 | 5 | 08–24 | 08–18 | 0.5 | 100 | 1 |
| B1 | Canteen | 521 | 1820 | 240 | 10–16 | Closed | 6.0 | 300 | 2 |
| Total | 1170 | 4216 | 400 | ||||||
| Wall #1 | Plaster (2 cm), Concrete (26 cm), Membrane + EPS (15 cm), Thermal-insulating Plaster (2 cm). |
| Wall #2 | Plaster (2 cm), Concrete (26 cm), Membrane + EPS (20 cm), Granite Slab (4 cm). |
| Wall #3 | Plaster (2 cm), Concrete (26 cm), Membrane + EPS (12 cm), Fair-faced Concrete Slab (12 cm). |
| Floor | Concrete Slab (25 cm), EPS (15 cm), Fair-faced Concrete Finishing (10 cm). |
| Roof #1 | Concrete on Corrugated Steel (8 cm), Membrane + EPS (14 cm), Granite Blocks on Sand (15 cm). |
| Roof #2 | Concrete on Corrugated Steel (8 cm), Membrane + EPS (14 cm), Green Roof (20 cm). |
| Glazing | Low-e + Solar control Triple glazing (4-15-6, 8-15-4 mm; Argon-filled Air gaps). |
| Domes | Heat-stop external layer, Transparent middle layer, Translucent internal layer. |
| U | ULIM | g | gLIM | YIE | YIE,LIM | σ | σ LIM | τ | f | |
|---|---|---|---|---|---|---|---|---|---|---|
| W/m2K | W/m2K | W/m2K | W/m2K | kg/m2 | kg/m2 | h | - | |||
| Wall #1 | 0.16 | 0.30 | - | - | 0.016 | 0.10 | 671.00 | 230 | 11.03 | 0.099 |
| Wall #2 | 0.18 | 0.30 | 0.018 | 771.40 | 11.31 | 0.097 | ||||
| Wall #3 | 0.25 | 0.30 | 0.024 | 759.60 | 11.50 | 0.092 | ||||
| Floor | 0.22 | 0.25 | / | 337.50 | / | / | ||||
| Roof #1 | 0.18 | 0.25 | / | 522.50 | / | / | ||||
| Roof #2 | 0.21 | 0.25 | / | 823.00 | / | / | ||||
| Glazing | 0.50 | 2.20 | 0.37 | 0.60 | - | |||||
| Domes | 1.90 | 2.20 | 0.31 | 0.60 | - | |||||
| Building Data | Vents area (Inlets) | AV,IN | m2 | 12 | |||
| Gross floor area | AFLOOR,TOT | m2 | 4200 | Vents area (Outlets) | AV,OUT | m2 | 16 |
| Analyzed floor area | AFLOOR | m2 | 1170 | Vents area ratio | AV,IN/AV,OUT | - | 0.75 |
| Analyzed volume | V | m3 | 4700 | Opaque Envelope | |||
| External Surf. (total) | AEXT,TOT | m2 | 3400 | Compactness (total) | AEXT,TOT/V | - | 0.72 |
| External Surf. (air) | AEXT,AIR | m2 | 1700 | Compactness (air) | AEXT,AIR/V | - | 0.36 |
| South | AEXT,S | m2 | 538 | Compactness (ground) | AEXT,GRO/V | - | 0.36 |
| Roof | AEXT,R | m2 | 1105 | Directional Shape Factor | |||
| West | AEXT,W | m2 | 57 | North | AEXT,N/AEXT,TOT | - | 0.14 |
| External Surf. (ground) | AEXT,GRO | m2 | 1700 | South | AEXT,S/AEXT,TOT | - | 0.16 |
| North | AEXT,N | m2 | 462 | Roof | AEXT,R/AEXT,TOT | - | 0.32 |
| East | AEXT,E | m2 | 68 | Floor | AEXT,F/AEXT,TOT | - | 0.34 |
| Floor | AEXT,F | m2 | 1170 | West | AEXT,W/AEXT,TOT | - | 0.02 |
| Ext. Ratio (air/ground) | ARAT | - | 0.50 | East | AEXT,E/AEXT,TOT | - | 0.02 |
| Glazing Surface | AGL,TOT | m2 | 230 | Glazed Envelope | |||
| North | AGL,N | m2 | 0 | Window/Wall ratio | AGL,TOT/AEXT,TOT | - | 0.07 |
| South | AGL,S | m2 | 95 | Window/Ext. S. ratio | AGL,TOT/AEXT,AIR | - | 0.13 |
| Roof | AGL,R | m2 | 120 | Window/Floor ratio | AGL,TOT/AFLOOR | - | 0.19 |
| West | AGL,W | m2 | 15 | Directional WWR | |||
| East | AGL,E | m2 | 0 | North | AGL,N/AEXT,N | - | 0.14 |
| Length (approx.) | L | m | 111 | South | AGL,S/AEXT,S | - | 0.17 |
| Depth (approx.) | D | m | 12 | Roof | AGL,R/AEXT,R | - | 0.11 |
| Building Ratio | L/D | - | 9.25 | West | AGL,W/AEXT,W | - | 0.26 |
| Thermal Mass | AMASS | m2 | 1782 | East | AGL,E/AEXT,E | - | 0.02 |
| Daylight Factor | Glazing ratio | ||||||
| A1 | DFA1 | % | 4.10 | North | AGL,N/AGL,TOT | - | 0.00 |
| A2 | DFA2 | % | 1.75 | South | AGL,S/AGL,TOT | - | 0.41 |
| A3 | DFA3 | % | 1.90 | Roof | AGL,R/AGL,TOT | - | 0.52 |
| A4 | DFA4 | % | 3.25 | West | AGL,W/AGL,TOT | - | 0.07 |
| B1 | DFB1 | % | 3.30 | East | AGL,E/AGL,TOT | - | 0.00 |
| ID | Occupancy | Surface | Devices | Ambient Lighting | Task Lighting | ||
|---|---|---|---|---|---|---|---|
| n° | W/pers. | m2 | W/m2 | W/m2 | W/m2 | ||
| A1 | Study room | 110 | 100 | 370 | 2.00 | 4.5 | 9.0 |
| A2 | Hallway | 5 | 110 | 56 | - | 2.5 | - |
| A3 | Common room | 10 | 150 | 56 | - | 5.0 | - |
| A4 | Corridor | 5 | 140 | 166 | - | 3.5 | - |
| B1 | Canteen | 240 | 110 | 521 | - | 8.0 | - |
| TRM | <10 °C | 10 ÷ 30 °C | >30 °C |
| TCOMF,MAX | 24 °C | 0.33 · TRM + 18 + TDIFF | 26 °C |
| TRM | <10 °C | 10 ÷ 30 °C | / |
| TCOMF,MIN | 20 °C | 0.33 · TRM + 18 − TDIFF |
| Category | Description | PPD | TDIFF |
|---|---|---|---|
| % | °C | ||
| I | Special requirements | ≤6 | 2 |
| II | New buildings | ≤10 | 3 |
| III | Existing buildings | ≤15 | 4 |
| IV | Intolerable | ≥15 | - |
| J | F | M | A | M | J | J | A | S | O | N | D | ||
|---|---|---|---|---|---|---|---|---|---|---|---|---|---|
| (a) Solar shading—Radiation control | |||||||||||||
| Operation | Off | On | Off | ||||||||||
| Set-points—Solar radiation [W/m2] | 100-200-300-400 | ||||||||||||
| (b) Solar shading—Air temperature control | |||||||||||||
| Operation | Off | 08:00–19:00 | Off | ||||||||||
| Set-points—Air temp. [°C] | 26 (indoor)—20 (outdoor) | ||||||||||||
| (c) Natural ventilation | |||||||||||||
| Operation | 08:00–19:00 | 08:00–24:00 | 08:00–19:00 | ||||||||||
| Set-points—Air temp. [°C] | Case 1 | 20 | 24 | 26 | 24 | 20 | |||||||
| Case 2 | 22 | 24 | 22 | ||||||||||
| (d) Mechanical cooling | |||||||||||||
| Operation | On | ||||||||||||
| Set-points—Air temp. [°C] | 26 | ||||||||||||
| (e) Daylight control | |||||||||||||
| Operation | On | ||||||||||||
| Set-points—Illuminance [lx] | Table 3 | ||||||||||||
| Strategy | Thermal Zones | |||
|---|---|---|---|---|
| A1/A2/A3 | A4 | B1 | ||
| Solar Shading | W/m2 | 100 | X | 400 |
| Natural Vent. | °C | 22/24 | X | 22/24 |
| Mech. Cooling | °C | 26 | 26 | 26 |
| Daylight Control | - | V | V | V |
| Infiltrations | - | V | V | V |
| Scenario | Average Operative Temperature (°C) | Energy Use (kWh/m2∙year) | ||||
|---|---|---|---|---|---|---|
| Lighting | HVAC | BACS | Total | |||
| 1 | Baseline | 30.1 | 24.9 | 8.2 | 0.0 | 34.3 |
| 2 | Solar Shading—radiation based | 28.8 | 26.2 | 3.5 | 0.6 | 30.3 |
| Solar Shading—temperature based | 29.3 | 25.9 | 3.9 | 0.6 | 30.4 | |
| 3 | Natural ventilation | 24.8 | 24.9 | 5.1 | 0.6 | 30.6 |
| 4 | Daylight control | 29.5 | 11.4 | 8.0 | 0.6 | 20.0 |
| 5 | Enhanced | 22.4 | 12.7 | 0.2 | 1.8 | 15.9 |
© 2019 by the authors. Licensee MDPI, Basel, Switzerland. This article is an open access article distributed under the terms and conditions of the Creative Commons Attribution (CC BY) license (http://creativecommons.org/licenses/by/4.0/).
Share and Cite
Fantozzi, F.; Hamdi, H.; Rocca, M.; Vegnuti, S. Use of Automated Control Systems and Advanced Energy Simulations in the Design of Climate Responsive Educational Building for Mediterranean Area. Sustainability 2019, 11, 1660. https://doi.org/10.3390/su11061660
Fantozzi F, Hamdi H, Rocca M, Vegnuti S. Use of Automated Control Systems and Advanced Energy Simulations in the Design of Climate Responsive Educational Building for Mediterranean Area. Sustainability. 2019; 11(6):1660. https://doi.org/10.3390/su11061660
Chicago/Turabian StyleFantozzi, Fabio, Hassan Hamdi, Michele Rocca, and Stefano Vegnuti. 2019. "Use of Automated Control Systems and Advanced Energy Simulations in the Design of Climate Responsive Educational Building for Mediterranean Area" Sustainability 11, no. 6: 1660. https://doi.org/10.3390/su11061660
APA StyleFantozzi, F., Hamdi, H., Rocca, M., & Vegnuti, S. (2019). Use of Automated Control Systems and Advanced Energy Simulations in the Design of Climate Responsive Educational Building for Mediterranean Area. Sustainability, 11(6), 1660. https://doi.org/10.3390/su11061660