Abstract
The influence of learning space on users has been broadly accepted and tested. However, the literature has focused on single factor research, instead of holistic approaches. Additionally, lower educational levels have been the focus of interest, while higher education is moving towards multi-method teaching. This paper focuses on how learning spaces for different purposes (practice and lecture rooms) may influence academic performance from a holistic approach of learning physical environment perception. For this, the iPEP scale (Indoor physical environment perception) is used and validated through Cronbach Alpha and Exploratory Factorial Analysis. Then, multiple linear regression is conducted. The results indicate that iPEP measures near to 63 percent of the construct, which is structured in six factors. Moreover, linear regression analyses support previous literature concerning the influence of learning physical environment on academic performance (R2 = 0.154). The differences obtained between practice and lecture room in terms of predictor variables bring to the light the need to diagnose learning environments before designing changes in educational buildings. This research provides a self-reported way to measure indoor environments, as well as evidence concerning the modern university, which desires to combine several teaching methods.
1. Introduction
Educational buildings are designed for learning and are home to students from all over the world for several years and many hours a day. In recent decades, researchers have attempted to understand whether it is a mere physical space, or if, on the contrary, it is related the pedagogical processes. Therefore, researchers have focused on investigating the influence on learning of a single factor of the physical learning environment (lighting [1], temperature [2], acoustics [3], etc.), or have combined two or three factors [4,5,6].
Acoustic design has been evidenced to be related to achievement and spatial cognition, which is more pronounced in children than in adults [7]. When this condition does not meet student needs, it might negatively influence their perception and social relationships, and increase their stress level [8]. An auditory feature, such as background music, has proved to promote collaborative behaviour and support good humour [9]. Also, noise, reverberation and distracting sounds interfere with communication, which may lead students to low information processing efficiency [10,11,12,13,14]. These studies provide evidence that acoustic comfort is fundamental to support sustainable learning environments, which implement active pedagogies [15].
Illumination combines artificial lighting and daylight to offer visual support and it influences visual perception, cognitive processing, behaviour, learning and academic performance [16,17,18]. Therefore, lighting design perspectives should be task-driven, as well as focusing on comfort to human health and perception [19]. Appropriate levels of visual comfort have been evidenced to improve social relations [20]. While daylight helps students to retain and learn information [21], long exposure to artificial lighting may cause stress and lead to irritability [22]. Buildings are highly artificial lighting dependent, as there was no concern about energy efficiency when educational facilities were designed, and nowadays represent a major factor of energy consumption.
In traditional learning, the views through windows are considered as distractor, which may explain the lack of daylight through windows, despite its importance for children [23], who distinguish lighting requirements given the task performed. Nature inspires students through its aesthetic value and entails a restorative effect on the mind, which fosters concentration [24]. It stabilizes students’ psychology and reduces their negative emotions [25], and leads to a proactive knowledge of the natural environment. This fact may foster a culture in which life-based learning is a must and encourage positive social interaction [26]. Landscape views and walls with living plants are correlated with better academic results [27,28] and may reduce stress [29], whilst increasing learners’ attention, interest and enjoyment in learning, and providing a more cooperative context for learning [30].
Thermal comfort is related to thermal level and ventilation. High levels of temperature are related to an alteration in wellbeing, social relations and performance [31], depending on the task type [32,33]. Adults are less sensitive to higher temperatures than children [34]; in this regard, low temperature levels distract students and lead them to a state of alert, which increases their nerve activity to prepare the mind for action. Working in warm environments led to a lower performance than in thermos-neutral rooms [35,36]. In addition to calibrating the temperature, ventilation involves oxygen renewal, and exposure to poor air quality decreases student attention and entails passive social behaviour [37]. Manual window-airing is the usual method of ventilation in most Spanish educational buildings, and, in Portugal, this method under monitoring has provided appropriate ventilation for a quarter of the academic year [38]. As shown by Heracleous and Michael [39], the evaluation of manual ventilation processes and generation of ventilation patterns helps to minimize heat loss in winter and achieve better air quality.
Students’ furniture normally consists of a desk and a chair, whose use generates postural habits that do not match their anthropometrics [40,41]. Likewise, sitting for a long period of time in educational centres [42] can lead to various health problems, such as head, neck and lumbar aches [43,44], musculoskeletal disorders and attention deficit [45]. These health problems may be related to the mismatch between measurements of students and school furniture [46]. Therefore, anthropometric data would be necessary when designing any kind of furniture equipment [47]; considering ergonomic furniture may reduce these symptoms [48]. Ergonomics issues are a must in sustainability assessment tools [49].
ICT facilities have become part of the physical learning environment, since elements such as computers or plugs are part of the design and operation of the classroom. In fact, their inclusion alters the classroom temperature and may require the use of artificial light instead of daylight, due to its reflection on the screens. They may promote student interaction and opportunities for motivating learning in collaborative environments [50]. Moreover, ICT is related with student participation through the use of social networks [51]. It is a factor that connects active teaching methods with the learning space, as it attracts students with a psychological demand that relates to being involved in a technological environment with a comfortable feeling [52], which may generate a positive predisposition towards learning [53]. Previous research has indicated the need for adequate furniture to perform active methodologies in the classroom, although with traditional furniture and ICT infrastructure, this can be carried out with highly motivated students. The authors call for the adaptation of furniture, to that which implies a motivational improvement and academic performance [54].
This literature’s tendency to focus on one learning space factor in the research has not allowed for a global assessment, or to assess whether classroom design influences the performance. However, there are theoretical holistic studies [55] and empirical studies [56,57,58], suggesting that the tools and procedures for measuring physical space variables carry a high cost. Primary education and childhood had been the academic level targets [59,60,61], and more information is lacking at university level.
The measurement procedures with technical devices (such as a thermometer) focus on a value of each variable in a classroom full of students who differently perceive each factor. This is due to multiple reasons, such as the influence of metabolism in relation to gender in the case of temperature, [62] or a student’s location within the classroom in relation to natural or artificial lighting [63]. Therefore, measuring the educational space through the perception of students is a feasible opportunity to assess whether there are relationships that explain student performance, to detect problems and, accordingly, to solve them.
The author Andrew Cox has shown, in the theoretical framework of a study carried out on higher education, the influence of learning space on academic achievement [64], and other authors have aimed to prove the existence of a relationship between learning environment and teaching practice [65,66].
The main purpose of this study is to analyse the influence of learning space in academic performance in higher education through a holistic self-report approach, taking into consideration both practice and lecture spaces.
Several questions were formulated to answer this objective:
- Which factors does indoor physical environment integrate and how are they structured?
- Which learning space variables predict academic outcome in higher education?
- Does learning space differently influence academic outcome concerning the type of teaching methodology used?
2. Materials and Methods
This research follows a multi-method design based on quantitative and qualitative methodology. A cross-sectional design is used, because it is able to observe and describe variables as they are presented in their natural environment, and to investigate the incidence and the values of the variables.
The first step was to visit the faculties of the university to select classrooms with diverse learning space characteristics. Then, we contacted the professors who teach in those spaces to request the possibility of applying a questionnaire for this research. Consequently, the dates to apply it were agreed and the Indoor Physical Environment Perception scale (iPEP scale) was conducted.
Afterwards, the information was typed into a database and analysed. The first analyses were the mean comparisons and standard deviations to describe the sample. Then, Cronbach alpha statistic and the Exploratory Factor Analysis (EFA) were calculated to check the reliability and the construct validity of the instrument, while detecting a factor structure. Then, the 3mean value was calculated for all the variables of each classroom. So, each classroom is globally measured by their students.
Subsequently, to explain the relationship between academic performance from two or more independent variables of learning space, multiple linear regression analysis was conducted. Classical assumptions for regression analysis were also calculated or checked: the independent variables (predictors) are linearly independent and the variance of the error is constant across observations (homoscedasticity).
Then, the interview was prepared, and the professors were selected. Afterwards, semi-structured interviews were conducted, recorded, and were transcribed. Subsequently, a traditional qualitative data analysis of the interviews was conducted by using deductive and inductive processes. The purpose of individual interviews is to obtain real experiences from professors. It used a meaning-centred analysis approach: content analysis, coding, grouping data, and interpretation of the meaning.
2.1. Variables
This research involves one dependent variable and twenty independent variables. The Grade Point Average (GPA) measures academic performance (dependent variable). The independent variables refer to the learning space. In the Spanish university system, all subjects consist of theoretical and practical lessons. Accordingly, students have two different classrooms per course: a lecture room and a practice room. Moreover, each classroom type has similar characteristics, since they were not designed twenty-five years ago, when the main teaching method was lecture. Both classrooms will be measured to inquire whether learning space variables differ in their influence, depending on the teaching method (lecture or passive methods, and practice or active methods). Learning spaces are composed of the following factors: lighting, ventilation, thermal level, acoustics, chair and desk ergonomics, room size, ICT facilities, and nature.
2.2. Sample
The research sample consists of 796 undergraduate students and five professors in different faculties of the Universidade da Coruña (UDC). A scale is applied to the students’ sample and an interview with professors.
In the case of students, non-probability sampling by convenience and purposive has been conducted (concerning their use of the selected learning spaces). The final sample is formed of 796 undergraduate students (248 men and 548 women) from ten faculties and four High Schools of the UDC.
Regarding professors, the sample consists of five educational staff members. Representative teaching staff were chosen based on the following criteria: long academic career, belonging to different areas of knowledge, familiar with the functioning of the UDC, having a senior position, and a high level of knowledge about the European Higher Education Area.
2.3. Data Collection Instruments
Indoor Physical Environment Perception scale (iPEP scale), adapted from the Student Perception Questionnaire of Learning Space [67] was applied to measure the learning space construct. This scale is designed to measure indoor physical environments and consists of 20 variables measured on a Likert scale. This instrument is based on 94 literature studies, which are summarized in the Figure 1.
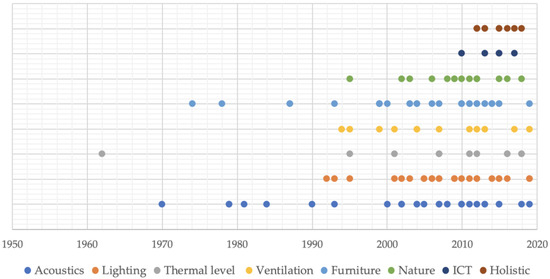
Figure 1.
Learning space literature background which support the indoor physical environment perception (iPEP) scale design.
Students had to anonymously rate the degree of the learning space variables (see Table 1) in their classroom from 1 (low degree) to 7 (high degree) and provide their GPA. In this study, iPEP was conducted twice, so students answered it regarding the lecture and the practice rooms. This questionnaire was administered on paper and the response rate was 91.28 percent (796/872), since some of them had missing-rated items.

Table 1.
iPEP scale items.
Regarding qualitative data, the semi-structured interview followed the statements of iPEP. The main purpose was to obtain personal data related to the principal variables and the findings of the statistical analysis of the test results.
3. Results
3.1. Descriptive Analysis
Mean statistics group up in four different values (see Table 2). Lighting items are the highest valued, with scores close to five; all the values are 0.30 lower in the practice room. Then, ventilation control, thermal level in cold and warm seasons, room size, Wi-Fi coverage and connection with nature are close to four points. In this case, most of the values are similar for both rooms, except for ventilation control and views, which are near to 0.30 points lower in the practice room. Subsequently, thermal level control, acoustic isolation, indoor noise, plug availability, and desk and chair ergonomics are close to 3.5 points. Students rated near 0.3 points higher the last three mentioned items in the practice room. The lowest values are near to three points, for ventilation during and after lessons, echo, and computer availability.
Table 2.
Descriptive analysis: mean value and standard deviation.
3.2. Reliability, Sample Adequacy
Cronbach alfa was conducted with the purpose of checking the reliability of the instrument (internal consistency). The inter-correlations among test items resulted in a high value (alpha = 0.836), which indicates that the variables are appropriate to measure the construct of the learning space.
In order to know whether the data is suited for Factor Analysis, Kaiser–Meyer–Olkin test (KMO) and Barlett’s test were conducted (see Table 3). On the one hand, KMO test achieved a high value (KMO = 0.802), which indicates that the proportion of variance in the variables should not be caused by underlying factors. On the other hand, Barlett’s Test of Sphericity was 10,459.273 (p190 < 0.001), meaning that the test items are unrelated. Therefore, both tests evidence that a factor analysis may be useful.
Table 3.
Kaiser–Meyer–Olkin (KMO) and Bartlett’s Test.
Subsequently, the EFA with the extraction method of Principal Component Analysis was conducted, and the varimax rotation method was applied. The construct resulted in a structure of six factors (F1–F6) which account for the 63.53 per cent of the construct (see Table 4).
Table 4.
Exploratory Factorial Analysis results.
- Ventilation (F1): the ventilation during classes (V5), the ventilation after classes (V6), the ventilation control (V7) and the thermal control (V10).
- IT set and room size (F2): the Wi-Fi coverage (V15), plugs availability (V16), computers availability (V17) and the room size (V14).
- Natural environment (F3): natural light quantity (V1), natural light control (V2) and connection with nature (V20).
- Building comfort (F4): artificial light control (V4), artificial light quantity (V3), thermal level in cold seasons (V8) and thermal level in warm seasons (V9).
- Workspace (F5): desk ergonomics (V19) and chair ergonomics (V18).
- Acoustics (F6): indoor noise (V12), echo level (V13) and acoustic isolation (V11).
3.3. Multiple Linear Regression Analysis
In order to predict academic performance (GPA), the Multiple linear regression test was conducted for the global sample, and for both lecture room and practice room data (see the models in Table 5): V5, V13, V15, V14, V19, V12 V7, V4, V3 and V18. The lecture room model explains 22.1 percent of GPA, with 11 variables: V5, V13, V18, V19, V7, V12, V17, V20, V9, V14 and V2. The practice room model explains the 22.0 percent of GPA, with nine variables: V19, V4, V14, V15, V17, V6, V5, V12 and V20. All the models are statistically meaningful (pg = 0.001; plr = 0.002; ppr = 0.010). The Durbin–Watson test scored values among 0 and 2, which indicates positive autocorrelation in the sample (D-Wg = 1.627; D-Wlr = 1.793; D-Wpr = 1.774).
Table 5.
Multiple linear regression results (dependent variable: grade point average (GPA)).
The homoscedasticity of the residues was also examined. Figure 2 represents the values that will predict our estimate concerning the regression residuals. This visual representation affirms the assumption of homoscedasticity, based on the fact that the variance is the same for the entire range of predicted values. Also, the same figure verifies the assumption of linearity, due to the linear pattern of the point cloud.
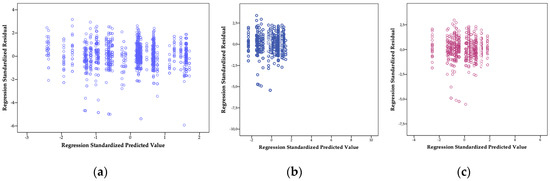
Figure 2.
Cloud points of standardized predicted values vs. standardized residuals (a) Global model graph; (b) Lecture room model graph; (c) Practice room model graph.
Standardized coefficients indicate how much each variable contributes to the model and the symbol indicates whether it is a direct or inverse relationship with the dependent variable (see Table 6). Ventilation during lessons (V5) contributes more to the model, because it has a larger absolute standardized coefficient. Moreover, ventilation during lessons, room size, indoor noise and artificial lighting control, are directly correlated with GPA. Chair ergonomics, echo, Wi-Fi coverage, desk ergonomics, ventilation control and artificial lighting quantity, are inverse correlated with the dependent variable. The amount of multicollinearity is calculated through Variance Inflation Factors (VIF), in order to check whether the input variables are correlated. Most VIF values are among 1 and 5, which indicate that the variables are moderately correlated, so the variance of the estimated regression coefficients is low inflated.
Table 6.
Global regression model for GPA prediction.
Regarding the practice and lecture room models, Beta values have been compared (see Table 7). VIF values for both models were moderated, except for ventilation items, which obtained values higher than five. Two variables influence both lecture and practice room in the same way: ventilation during lessons (V4) and indoor noise (V12). Moreover, four variables showed opposite relations concerning both classrooms: room size (V14), computer availability (V17), desk ergonomics (V19) and connection with nature (V20). V14 and V20 showed inverse correlations with GPA in lecture classroom and V17 and V19 a direct correlation, while the four variables obtained the opposite correlation for the same dependent variable. Five other items indicate significant inverse correlations with GPA only for the lecture room: natural light control (V2), ventilation control (V7), thermal level in warm seasons (V9), echo level (V13) and chair ergonomics. Meanwhile, two items showed inverse correlations with GPA in the practice room—ventilation after lessons (V6) and Wi-Fi coverage (V15)—and one indicated direct correlation—artificial light control (V4).
Table 7.
Beta values for lecture and practice room regression models.
3.4. Qualitative Analysis
Three elements were used in the data analysis focused on meaning: data reduction, disposal, and processing of information and extraction of conclusions. The analysis was performed through codes by extracting the voiced opinions of professors.
3.4.1. Room Size
In this case, professors highlighted their own experiences and a general belief was presented: a larger size classroom has a negative influence on academic performance, although some professors also expressed that this effect may depend on subject, professor and student attitude. Interviewee 2 explained that the traditional lecture method, based on a large audience and room size, had a negative influence on learning. Interviewee 3 indicated that active lessons were designed as a formula to improve academic performance.
3.4.2. Furniture
The comfort of working area is presented as an important issue. When students are not physically comfortable, it will negative affect their concentration and performance (Interviewee 4). This discomfort occurs mainly in the case of fixed tables and chairs (Interviewees 3, 4 and 5). Professors indicated that most classrooms (both lecture and practice rooms) had the same furniture. However, Interviewee 2 focused on functionality, both because of the extra cost that comes with the excess of “ergonomics”, and because of the mismatch of excess comfort in an environment that must be proactive.
3.4.3. Lighting
Daylight and lighting control are accepted as essential elements by the interviewees. They indicated that daylight generates a positive mood and predisposition to the classes (Interviewee 4), but the use of audio–visual media requires a better possibility of controlling both artificial and natural light in the classroom (Interviewee 3).
Moreover, the professors indicated the orientation of the facades as a major issue, due to the fact that sun exposure generates overheating inside the building. Therefore, in some cases, dark crystals or vinyl windows have been added, which permanently reduce the entry of natural light (Interviewee 2). On other occasions, this design promotes the use of blinds during daylight hours, promoting the unnecessary use of artificial light (Interviewee 5). Moreover, window height did not let students see the view when they are sat, so that they do not entertain themselves by looking out the windows (Interviewee 2).
3.4.4. Ventilation and Thermal Level
The interviewees agreed that the buildings have large thermal differences due to the orientation of the facades. They also state that this factor negatively affects the learning process, with interviewee 5 specifying that heat excess inhibits student concentration.
These buildings have a facade with full exposure to the sun and another facing the mountain. That is why, in some places, the temperature is ideal, and in others it is too cold (Interviewee 2). In addition, the location of the reading rooms on the west façade leads to excessive heat; in winter, this is due to central heating and in summer due to sun exposure (Interviewee 5).
Furthermore, they state that the centralized heating system does not allow the control of thermal levels in the classrooms. Its management is easier in small buildings. However, interviewee 2 states that it would be essential to sectorize heating, both for energy savings and for user comfort, and he add that windows are the mechanism they use to refrigerate the rooms (Interviewee 2 and 5).
3.4.5. Acoustics
This element is essential for knowledge communication among students and professors. In general, there are no acoustic problems. However, in large classrooms it is sometimes necessary to use support devices such as microphones, despite the fact that some professors are not comfortable with them (Interviewees 1 and 3). Otherwise, teachers develop vocal stress (Interviewee 5). This acoustic problem is also due to the noise caused by ‘student behavior’ (Interviewee 2).
3.4.6. ICT Design
Interviewees agree that there is a global problem, due to the lack of Wi-Fi coverage. Students move through the classroom and corridor to find internet access to download files or upload tasks. Interviewee 3 explains that, when the Faculty is full of users, this situation worsens, due to the multiplicity of devices (Tablets, laptops, mobile phones), since the Wi-Fi network has not been adapted to support this number of machines (Interviewee 4).
Concerning sockets, electrical facilities have not adapted to the audio–visual needs of the 21st century. Faced with this situation, teachers have generated the solution of introducing power strips in classrooms (Interviewees 1 and 4). This solution facilitates the loading of the devices, but does not eliminate the problem and converts some classroom into a jungle of wires (Interviewees 2 and 4).
One of the professors expressed concern regarding the negative connotations of ICT, saying that it can generate distractions (Interviewee 5). He explained that social networks are distractors for students, but they pay attention when they a specific software is used and they do not have access to Wi-Fi.
3.4.7. Nature
Interviewees state the connection of the interior of the class with nature as an element of quality, that helps concentration and relaxation, especially during breaks between lessons (Interviewees 1, 2 and 4). Interviewees 3 and 5 state that connection with nature is also due to the location of the university campus in a natural environment, a permanent factor of student enjoyment, which promotes sustainability values (Interviewee 2).
4. Discussion and Conclusions
The research goal was to generate a holistic learning space assessment method, to inquire whether it predicts academic outcome, considering both lecture and practice environments. For this, a holistic review of the factors of learning space was conducted, combining knowledge from the fields of Psychology, Education and Architecture. Consequently, an iPEP scale was designed, based on previous holistic approaches [55,56,57,58]. This measurement instrument was validated through Cronbach alpha and Exploratory Factor Analyses (EFA). The learning space resulted in a six-factors structure, with a high percentage of the construct explanation: ventilation, IT set and room size, natural environment, building comfort, workspace and acoustics. Furthermore, multiple regression analysis indicated that ten variables of the learning space predict close to fifteen percent of the Grade Point Average (GPA) of undergraduate students at the Universidade da Coruña: ventilation during lessons, chair ergonomics, echo level, Wi-Fi coverage, room size, desk ergonomics, indoor noise, ventilation control, artificial light control and artificial light quantity. Likewise, the GPA prediction analyses showed that practical and theoretical classrooms correlate differently with the classroom variables, which support the previous literature that indicates a relationship between teaching methods and learning space [65,66].
Ventilation variables evidenced the major influence in academic performance at Universidade da Coruña. Concerning manual windows-airing during lessons, a direct correlation with GPA is indicated, supporting previous results suggesting that proper ventilation habits achieve better air quality [39]. However, when this action is performed at the end of the lesson, classrooms are empty, because of the breaks between different courses. Considering this mechanism is not automatized, windows are open until the next group accesses the classroom, and the extreme cold can have a negative influence in the practice room, where students need to be prepared for active methodologies. In the lecture room, where passive actions are a must, the results evidence that the lack of thermal control is inversely correlated with academic performance. Moreover, the presence of the variable thermal control in this factor is supported by interview analyses, which always refer to manual-window airing as the mechanism used to control the temperature.
Concerning the building comfort factor, the primary influences consist of thermal comfort and artificial lighting variables. Previous research measured thermal level with Celsius or Kelvin degrees. The self-report scale takes into consideration user perceptions of their own thermal comfort, which differ depending on the individual [62]. Furthermore, the building’s orientation generate great temperature differences between some classrooms. They also have central heating without a regulator inside the classrooms. In this sense, thermal comfort in warm seasons showed an inverse correlation with GPA in lecture rooms, similar to previous results, which correlate warmer temperatures with lower performance [35,36]. Moreover, lecture rooms have at least double the number of students, which increases the thermal level. Artificial lighting control indicated a direct relation with GPA in the practice room. In these lessons, students normally work in small groups, so the ability to focus the light in their workspace improves their performance.
Concerning IT set and room size, on the one hand, room size and students number ratio indicated a global direct correlation with academic performance. However, this is due to the fact that its positive effect in the practice room is higher than its negative effect in the lecture room. For these, professors indicated that they try to move to smaller classrooms, where the ratio between the room size and the attendance of students is more consistent and efficient. In contrast, professors indicated that previous years’ lecture lessons, with larger student audiences, implied a negative influence on performance. On the other hand, Wi-Fi coverage evidenced an inverse correlation with academic performance, and computers’ availability differs in correlation, depending on whether they are in the lecture or the practice room. This was supported by the interviews, since professors believe that the use of such technologies generates distractions among students. Moreover, Wi-Fi coverage causes a waste of time, due to an out-dated infrastructure which collapses with a multiplicity of electronic devices. These results bring to light a different ICT reality to the positive approach in the literature [50,51,52,53]. ICT research applied in education normally focuses on control groups, while, in this case, a population in its natural state is studied, in which there seems to be a lack of use of ICT methodology, which may explain the inverse correlations with GPA.
The natural environment consists of the connection with nature, daylight and daylight control. Both connections with nature and daylight control evidenced an inverse correlation with GPA in the lecture room. This may be related to the fact that students control daylight through blinds, which increases their landscape views, and they get distracted from the professor’s speech. This fact is supported by previous research [23] and interview results. However, nature connection in the practice room is directly correlated with academic performance. In these lessons, students have their own tasks and are not disconnected from the learning process if they need to rest and observe the landscape. This is consistent with previous results that evidenced this action mitigates concentration fatigue in the classroom [24,27,28].
Workspace furniture is measured through desk and chair ergonomics. Students scored both variables with a medium value. However, they evidenced different results in terms of GPA prediction in the lecture room, where there was positive influence concerning the desk and a negative one in the case of the chair. This difference might be related to the students’ passive action in massive rooms, in which they have to hold their sitting position for hours [40,41] and the desk is just need the space to take notes in a laptop. However, desk ergonomics evidenced an inverse correlation in the practice room, where they are not suitable for collaborative work. So, in addition to a mismatch between anthropometric measurements and furniture ergonomics [46], there seems to be a mismatch concerning teaching method.
Indoor noise and echo level evidenced an inverse relation between acoustic factor and academic performance, which confirms previous research [10,11,12,13,14]. However, its influence is lower in the practice room, where students work in small groups and communication does not need to reach a big audience.
To conclude, learning space influences the performance of undergraduate students at UDC, and it is related to teaching approaches, based on the difference reported in lecture and practice room results. The iPEP scale serves to evaluate any particular learning space, to detect which factors have a positive or negative influence in performance and actuate in the architectural design. This self-reported approach involves a more personalized diagnosis of indoor environments than traditional measurement instruments. A holistic model of the relationship between space learning and student performance is established, which diverges from the individualist point that literature has carried over the years, with certain exceptions.
Finally, we encourage further research in an indoor environment, considering how it influences the way we live, study and work. We recommend correlating self-reported perceptions with traditional measures, in order to fulfil human needs concerning architectural design.
Author Contributions
Conceptualization, V.L.-C.; Formal analysis, V.L.-C.; Methodology, V.L.-C.; Supervision, A.A.L. and J.M.-G.; Validation, V.L.-C.; Writing—original draft, V.L.-C.; Writing—review and editing, A.A.L. and J.M.-G.
Funding
This research received no external funding.
Conflicts of Interest
The authors declare no conflict of interest.
References
- Leccese, F.; Salvadori, G.; Rocca, M.; Buratti, C.; Belloni, E. A method to assess lighting quality in educational rooms using analytic hierarchy process. Build. Environ. 2019. [Google Scholar] [CrossRef]
- Wang, D.; Xu, Y.; Liu, Y.; Wang, Y.; Jiang, J.; Wang, X.; Liu, J. Experimental investigation of the effect of indoor air temperature on students’ learning performance under the summer conditions in China. Build. Environ. 2018, 140, 140–152. [Google Scholar] [CrossRef]
- Leccese, F.; Rocca, M.; Salvadori, G. Fast estimation of Speech Transmission Index using the Reverberation Time: Comparison between predictive equations for educational rooms of different sizes. Appl. Acoust. 2018, 140, 143–149. [Google Scholar] [CrossRef]
- Lee, M.C.; Mui, K.W.; Wong, L.T.; Chan, W.Y.; Lee, E.W.M.; Cheung, C.T. Student learning performance and indoor environmental quality (IEQ) in air-conditioned university teaching rooms. Build. Environ. 2012, 49, 238–244. [Google Scholar] [CrossRef]
- De Giuli, V.; Da Pos, O.; De Carli, M. Indoor environmental quality and pupil perception in Italian primary schools. Build. Environ. 2012, 56, 335–345. [Google Scholar] [CrossRef]
- Xiong, L.; Huang, X.; Li, J.; Mao, P.; Wang, X.; Wang, R.; Tang, M. Impact of Indoor Physical Environment on Learning Efficiency in Different Types of Tasks: A 3× 4× 3 Full Factorial Design Analysis. Int. J. Environ. Res. Public Health 2018, 15, 1256. [Google Scholar] [CrossRef]
- Klatte, M.; Bergström, K.; Lachmann, T. Does noise affect learning? A short review on noise effects on cognitive performance in children. Front. Psychol. 2013, 4, 578. [Google Scholar] [CrossRef]
- Klatte, M.; Hellbruck, J.; Seidel, J.; Leistner, P. Effects of classroom acoustics on performance and well-being in elementary school children: A field study. Environ. Behav. 2010, 42, 659–692. [Google Scholar] [CrossRef]
- Hallam, S.; Price, J.; Katsarou, G. The effects of background music on primary school pupil’s task performance. Educ. Stud. 2002, 21, 111–122. [Google Scholar] [CrossRef]
- Imhof, M.; Välikoski, T.R.; Laukkanen, A.M.; Kai, O. Cognition and interpersonal communication: The effect of voice quality on information processing and person perception. Stud. Commun. Sci. 2014, 14, 37–44. [Google Scholar] [CrossRef]
- Larsen, J.D.; Baddeley, A. Disruption of verbal STM by irrelevant speech, articulatory suppression, and manual tapping: Do they have a common source? Q. J. Exp. Psychol. 2003, 56, 1249–1268. [Google Scholar] [CrossRef] [PubMed]
- Klatte, M.; Meis, M.; Sukowski, H.; Schick, A. Effects of irrelevant speech and traffic noise on speech perception and cognitive performance in elementary school children. Noise Health 2007, 9, 64–74. [Google Scholar] [CrossRef] [PubMed]
- Farley, L.A.; Neath, I.; Allbritton, D.W.; Surprenant, A.M. Irrelevant speech effects and sequence learning. Mem. Cogn. 2007, 35, 156–165. [Google Scholar] [CrossRef] [PubMed]
- Shield, B.; Conetta, R.; Dockrell, J.; Connolly, D.; Cox, T.; Mydlarz, C. A survey of acoustic conditions and noise levels in secondary school classrooms in England. J. Acoust. Soc. Am. 2015, 137, 177–188. [Google Scholar] [CrossRef] [PubMed]
- Montiel, I.; Mayoral, A.M.; Navarro Pedreño, J.; Maiques, S. Acoustic Comfort in Learning Spaces: Moving Towards Sustainable Development Goals. Sustainability 2019, 11, 3573. [Google Scholar] [CrossRef]
- Nakamura, H.; Karasawa, Y. Relationship between illuminance/color temperature and preference of atmosphere. J. Light Vis. Environ. 1999, 23, 29–38. [Google Scholar] [CrossRef]
- Noguchi, H.; Sakaguchi, T. Effect of illuminance and color temperature on lowering of physiological activity. Appl. Hum. Sci. 1999, 18, 117–123. [Google Scholar] [CrossRef]
- Gilavand, A.; Gilavand, M.; Gilavand, S. Investigating the impact of lighting educational spaces on learning and academic achievement of elementary students. Int. J. Pediatrics 2016, 4, 1819–1828. [Google Scholar] [CrossRef]
- Andersen, M. Unweaving the human response in daylighting design. Build. Environ. 2015, 9, 101–117. [Google Scholar] [CrossRef]
- Juslén, H.; Tenner, A. Mechanisms involved in enhancing human performance by changing the lighting in the industrial workplace. Int. J. Ind. Ergon. 2005, 35, 843–855. [Google Scholar] [CrossRef]
- Rittner, H.; Robbin, M. Color and light in learning. Sch. Plan. Manag. 2002, 41, 57–58. [Google Scholar]
- Küller, R.; Wetterberg, L. Melatonin, cortisol, EEG, ECG and subjective comfort in healthy humans: Impact of two fluorescent lamp types at two light intensities. Lighting Res. Technol. 1993, 25, 71–80. [Google Scholar] [CrossRef]
- Vásquez, N.G.; Felippe, M.L.; Pereira, F.O.; Kuhnen, A. Luminous and visual preferences of young children in their classrooms: Curtain use, artificial lighting and window views. Build. Environ. 2019, 152, 59–73. [Google Scholar] [CrossRef]
- Berman, M.; Jonides, J.; Kaplan, S. The cognitive benefits of interacting with nature. Psychol. Sci. 2008, 19, 1207–1212. [Google Scholar] [CrossRef] [PubMed]
- Tsung, K. Influence of Limitedly Visible Leafy Indoor Plants on the Psychology, Behavior, and Health of Students at a Junior High School in Taiwan. Environ. Behav. 2009, 41, 658–692. [Google Scholar] [CrossRef]
- Shamsuddin, S.; Bahauddin, H.; Abd-Aziz, N. Relationship between the outdoor physical environment and student’s social behaviour in Urban Secondary School. Procedia Soc. Behav. Sci. 2012, 50, 148–160. [Google Scholar] [CrossRef]
- Benfield, J.A.; Rainbolt, G.N.; Bell, P.A.; Donovan, G.H. Classrooms with nature views: Evidence of differing student perceptions and behaviors. Environ. Behav. 2015, 47, 140–157. [Google Scholar] [CrossRef]
- van den Berg, A.E.; Wesselius, J.E.; Maas, J.; Tanja-Dijkstra, K. Green walls for a restorative classroom environment: A controlled evaluation study. Environ. Behav. 2016, 49, 791–813. [Google Scholar] [CrossRef]
- Abkar, M.; Kamal, M.; Maulan, S.; Mariapan, M. Influences of viewing nature through windows. Aust. Basic Appl. Sci. 2010, 4, 5346–5351. [Google Scholar]
- Kuo, M.; Browning, M.H.; Sachdeva, S.; Westphal, L.; Lee, K. Might school performance grow on trees? Examining the link between “greenness” and academic achievement in urban, high-poverty schools. Front. Psychol. 2018, 9, 1669. [Google Scholar] [CrossRef]
- Anderson, C.; Deuser, W.; DeNeve, K. Hot temperatures, hostile affect, hostile cognition, and arousal: Tests of a general model of affective aggression. Personal. Soc. Psychol. Bull. 1995, 21, 434–448. [Google Scholar] [CrossRef]
- Jiang, J.; Wang, D.; Liu, Y.; Xu, Y.; Liu, J. A study on pupils’ learning performance and thermal comfort of primary schools in China. Build. Environ. 2018, 134, 102–113. [Google Scholar] [CrossRef]
- Zomorodian, Z.S.; Tahsildoost, M.; Hafezi, M. Thermal comfort in educational buildings: A review article. Renew. Sustain. Energy Rev. 2016, 59, 895–906. [Google Scholar] [CrossRef]
- Teli, D.; Jentsch, M.F.; James, P.A. Naturally ventilated classrooms: An assessment of existing comfort models for predicting the thermal sensation and preference of primary school children. Energy Build. 2012, 53, 166–182. [Google Scholar] [CrossRef]
- Lan, L.; Wargocki, P.; Wyon, D.P.; Lian, Z. Effects of thermal discomfort in an office on perceived air quality, SBS symptoms, physiological responses, and human performance. Indoor Air 2011, 21, 376–390. [Google Scholar] [CrossRef] [PubMed]
- Seppänen, O.; Fisk, W. Some quantitative relations between Indoor environmental quality and work performance or health. HVAC R Res. 2006, 12, 957–973. [Google Scholar] [CrossRef]
- Cheryan, S.; Ziegler, S.; Plaut, V.; Meltzoff, A.N. Designing Classrooms to Maximize Student Achievement. Behav. Brain Sci. 2014, 1, 4–12. [Google Scholar] [CrossRef]
- Duarte, R.; da Glória Gomes, M.; Rodrigues, A.M. Classroom ventilation with manual opening of windows: Findings from a two-year-long experimental study of a Portuguese secondary school. Build. Environ. 2017, 124, 118–129. [Google Scholar] [CrossRef]
- Heracleous, C.; Michael, A. Experimental assessment of the impact of natural ventilation on indoor air quality and thermal comfort conditions of educational buildings in the Eastern Mediterranean region during the heating period. J. Build. Eng. 2019. [Google Scholar] [CrossRef]
- Savanur, C.; Altekar, C.; De, A. Lack of conformity between Indian classroom furniture and student dimensions: Proposed future seat/table dimensions. Ergonomics 2007, 50, 1612–1625. [Google Scholar] [CrossRef]
- Castellucci, H.; Arezes, P.; Viviani, C. Mismatch between classroom furniture and anthropometric measures in Chilean schools. Appl. Ergon. 2010, 41, 563–568. [Google Scholar] [CrossRef] [PubMed]
- Agha, S.R. School furniture match to students’ anthropometry in the Gaza Strip. Ergonomics 2010, 53, 344–354. [Google Scholar] [CrossRef] [PubMed]
- Molenbroek, J.; Kroon-Ramaekers, N.; Snidjers, C. Revision of the design of a standard for the dimensions of school furniture. Ergonomics 2003, 46, 681–694. [Google Scholar] [CrossRef] [PubMed]
- Assiri, A.; Mahfouz, A.A.; Awadalla, N.J.; Abolyazid, A.Y.; Shalaby, M.; Abogamal, A.; Riaz, F. Classroom Furniture Mismatch and Back Pain Among Adolescent School-Children in Abha City, Southwestern Saudi Arabia. Int. J. Environ. Res. Public Health 2019, 16, 1395. [Google Scholar] [CrossRef]
- Bendix, T. Adjustment of the seated work place with special reference to heights and inclinations of seat and table. Dan. Med. Bull. 1987, 34, 125–139. [Google Scholar]
- Parcells, C.; Stommel, M.; Hubbard, R. Mismatch of classroom furniture and student body dimensions. J. Adolesc. Health 1999, 24, 265–273. [Google Scholar] [CrossRef]
- Mirmohammadi, S.; Houshang, M.; Somayyeh, J.; Mostaghaci, M. An assessment of the anhropometric data of iranian university students. Int. J. Occup. Hyg. 2011, 3, 85–89. [Google Scholar]
- Brewer, J.; Davis, K.; Dunning, K.; Succop, P. Does ergonomic mismatch at school impact pain in school children? Work 2009, 34, 455–464. [Google Scholar]
- Saraiva, T.; De Almeida, M.; Bragança, L.; Barbosa, M. Environmental comfort indicators for school buildings in sustainability assessment tools. Sustainability 2018, 10, 1849. [Google Scholar] [CrossRef]
- Duta, N.; Martínez-Rivera, O. Between theory and practice: The importance of ICT in Higher Education as a tool for collaborative learning. Porc. Soc. Behav. Sci. 2015, 180, 1466–1473. [Google Scholar] [CrossRef]
- Junco, R.; Elavsky, C.; Heiberger, G. Putting twitter to the test: Assessing outcomes for student collaboration, engagement and success. Br. J. Educ. Technol. 2013, 44, 273–287. [Google Scholar] [CrossRef]
- Whiteside, A.; Brooks, D.; Walker, J. Making the Case for Space: Three Years of Empirical Research on Learning Environments. Educ. Q. 2010, 33, 11. [Google Scholar]
- López-Chao, V.; Muñoz-Cantero, J.M.; López-Pena, V. Analysis of the relaton between it school design and the lack of teaching method based on digital competence. In Proceedings of the ACM International Conference Proceeding Series, 5th International Conference on Technological Ecosystem for Enhancing Multiculturality, Cádiz, Spain, 17 October 2017; Manuel Dodero, J., Ibarra Sáiz, M.S., Ruiz Rube, I., Eds.; The Association for Computing Machinery: New York, NY, USA, 2017; Volume 79. [Google Scholar] [CrossRef]
- Martin-Gutierrez, J.; Mora, C.E.; Añorbe-Díaz, B.; Bendicho, M.P.F.; Manuel, A.; Marrero, G.; Rodríguez, P.R. Managing first PBL experiences: Cross competences in a traditional environment. In Proceedings of the 2015 IEEE Frontiers in Education Conference (FIE), El Paso, TX, USA, 21–24 October 2015; IEEE: Piscataway, NJ, USA, 2015; pp. 1–8. [Google Scholar] [CrossRef]
- Muñoz-Cantero, J.M.; García-Mira, J.M.; López-Chao, V. Influence of Physical Learning Environment in Student’s Behavior and Social Relations. Anthropologist 2016, 25, 249–253. [Google Scholar] [CrossRef]
- Barrett, P.; Zhang, Y.; Moffat, J.; Kobbacy, K. A holistic, multi-level analysis identifying the impact of classroom design on pupils’ learning. Build. Environ. 2013, 59, 678–689. [Google Scholar] [CrossRef]
- Barrett, P.; Davies, F.; Zhang, Y.; Barrett, L. The impact of classroom design on pupils’ learning: Final results of a holistic, multi-level analysis. Build. Environ. 2015, 89, 118–133. [Google Scholar] [CrossRef]
- Barrett, P.; Davies, F.; Zhang, Y.; Barrett, L. The holistic impact of classroom spaces on learning in specific subjects. Environ. Behav. 2017, 49, 425–451. [Google Scholar] [CrossRef]
- Knauf, H. Visual Environmental Scale: Analysing the Early Childhood Education Environment. Early Child. Educ. J. 2019, 47, 43–51. [Google Scholar] [CrossRef]
- Basińska, M.; Michałkiewicz, M.; Ratajczak, K. Impact of physical and microbiological parameters on proper indoor air quality in nursery. Environ. Int. 2019, 132, 105098. [Google Scholar] [CrossRef]
- Camacho-Montano, S.C.; Wagner, A.; Erhorn-Kluttig, H.; Mumovic, D.; Summerfield, A. Clearing the air on EU guidance projects for school buildings. Build. Res. Inf. 2019, 47, 624–634. [Google Scholar] [CrossRef]
- Kingma, B.; van Marken, W. Energy consumption in buildings and female thermal demand. Nat. Clim. Chang. 2015, 5, 1054–1056. [Google Scholar] [CrossRef]
- Lourenço, P.; Pinheiro, M.D.; Heitor, T. Light use patterns in Portuguese school buildings: User comfort perception, behaviour and impacts on energy consumption. J. Clean. Prod. 2019, 228, 990–1010. [Google Scholar] [CrossRef]
- Cox, A. Students’ Experience of University Space: An Exploratory Study. Int. J. Teach. Learn. High. Educ. 2011, 23, 197–207. [Google Scholar]
- Daniels, H.L.; Leadbetter, J.; Wargminton, P.; Edwards, A.; Martin, D.; Popova, A.; Apostolov, A.; Middleton, D.; Brown, S. Learning in and for Multiagency Working. Oxf. Rev. Educ. 2007, 34, 521–538. [Google Scholar] [CrossRef]
- Tse, H.; Learoyd-Smith, S.; Stables, A.; Daniels, H. Continuity and conflict to in school design: A case study from Building Schools for the Future. Intell. Build. Int. 2015, 7, 64–82. [Google Scholar] [CrossRef]
- López-Chao, V. El Impacto del Diseño del Espacio y otras Variables Socio-físicas en el Proceso de Enseñanza-Aprendizaje. Ph.D. Thesis, Universidade da Coruña, A Coruña, Spain, 17 January 2017. [Google Scholar]
© 2019 by the authors. Licensee MDPI, Basel, Switzerland. This article is an open access article distributed under the terms and conditions of the Creative Commons Attribution (CC BY) license (http://creativecommons.org/licenses/by/4.0/).