Development of an Indoor Environmental Quality Assessment Tool for the Rating of Offices in Real Working Conditions


Abstract
1. Introduction
2. Materials and Methods
2.1. Selection of Criteria
2.2. Benchmarking
2.3. Weighting
- si
- is the score of i indicator
- wi
- is the weight of i indicator within its category
- wc
- is the weight of i indicator category within its thematic area.
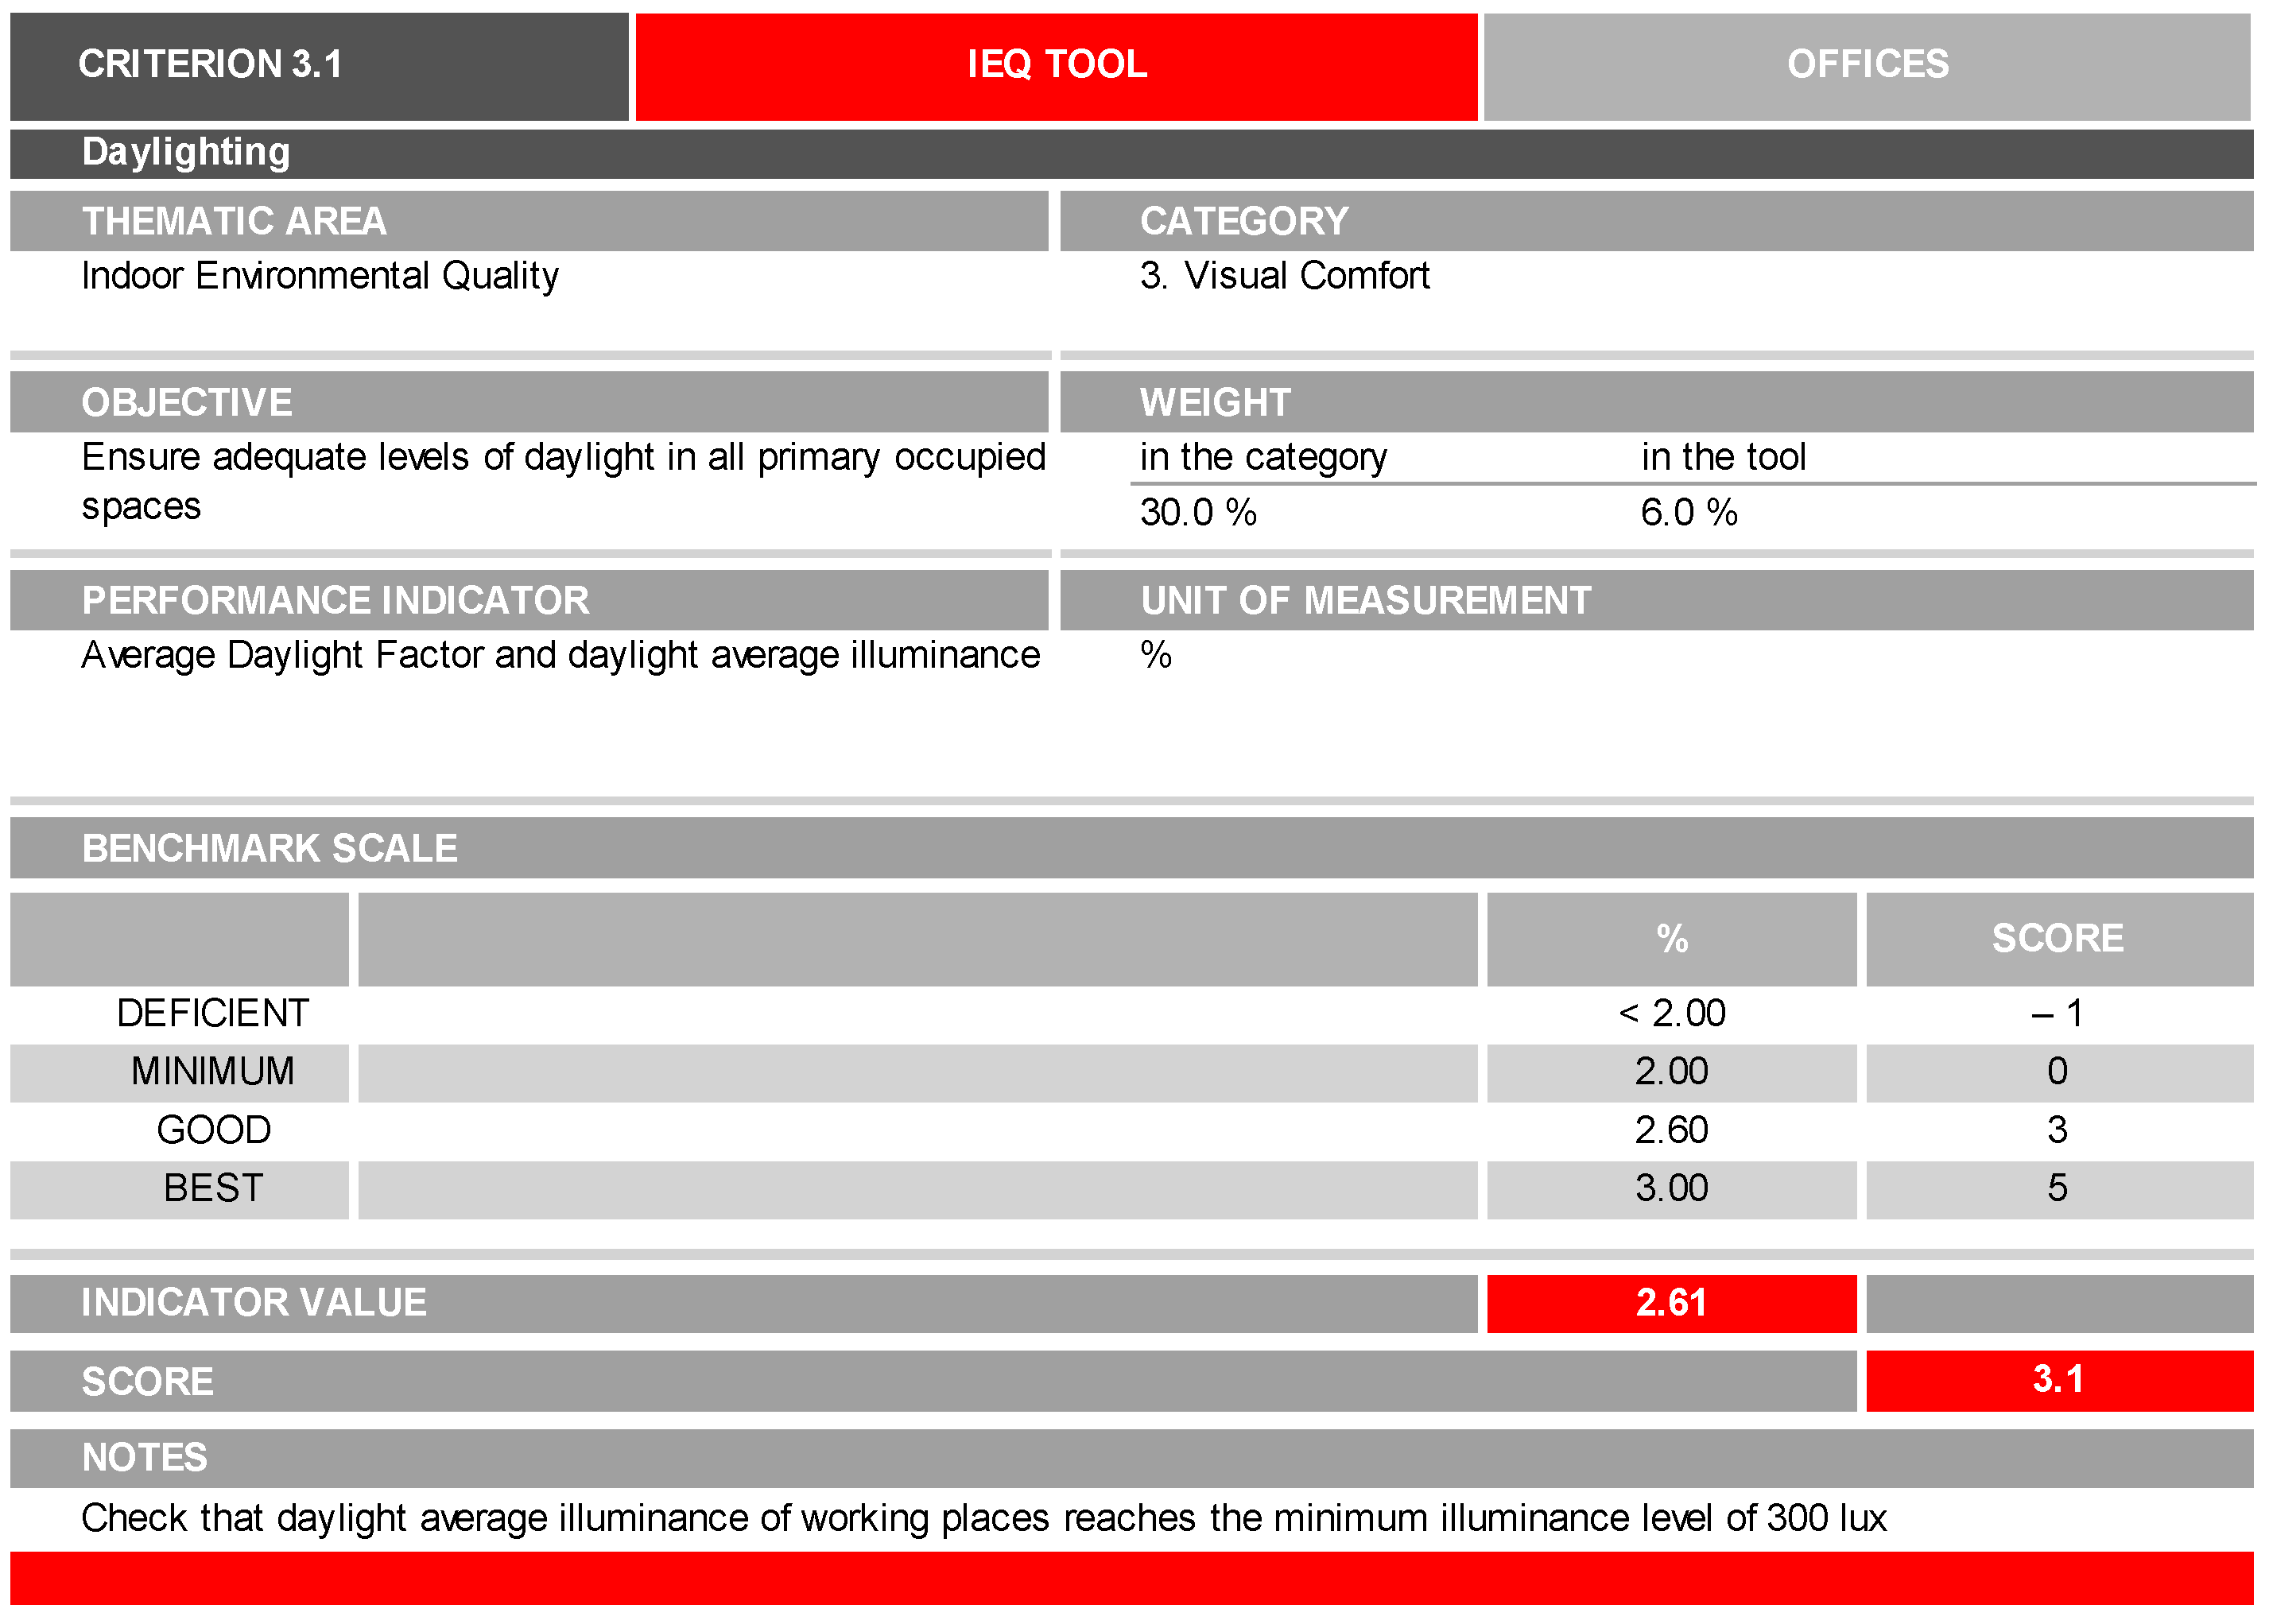
2.4. Structure
- Name, code and position of the indicator in the general framework (i.e., category it belongs to);
- Objective: target of sustainability for which the indicator is relevant;
- Weight: weight criterion in the category and weight criterion in the tool as a whole;
- Performance Indicator: the value used to assess the level of performance of the criterion; it can be either quantitative or qualitative (in this case it is described as a ‘scenario’);
- Unit of measurement;
- Benchmark scale: indicator reference values;
- Indicator value; calculated value of urban area evaluated;
- Score: performance score of the indicator in relation to the indicator value and the related benchmark;
- Notes: clarifications about the calculation method of indicator value and/or about the measurement method of the parameter.
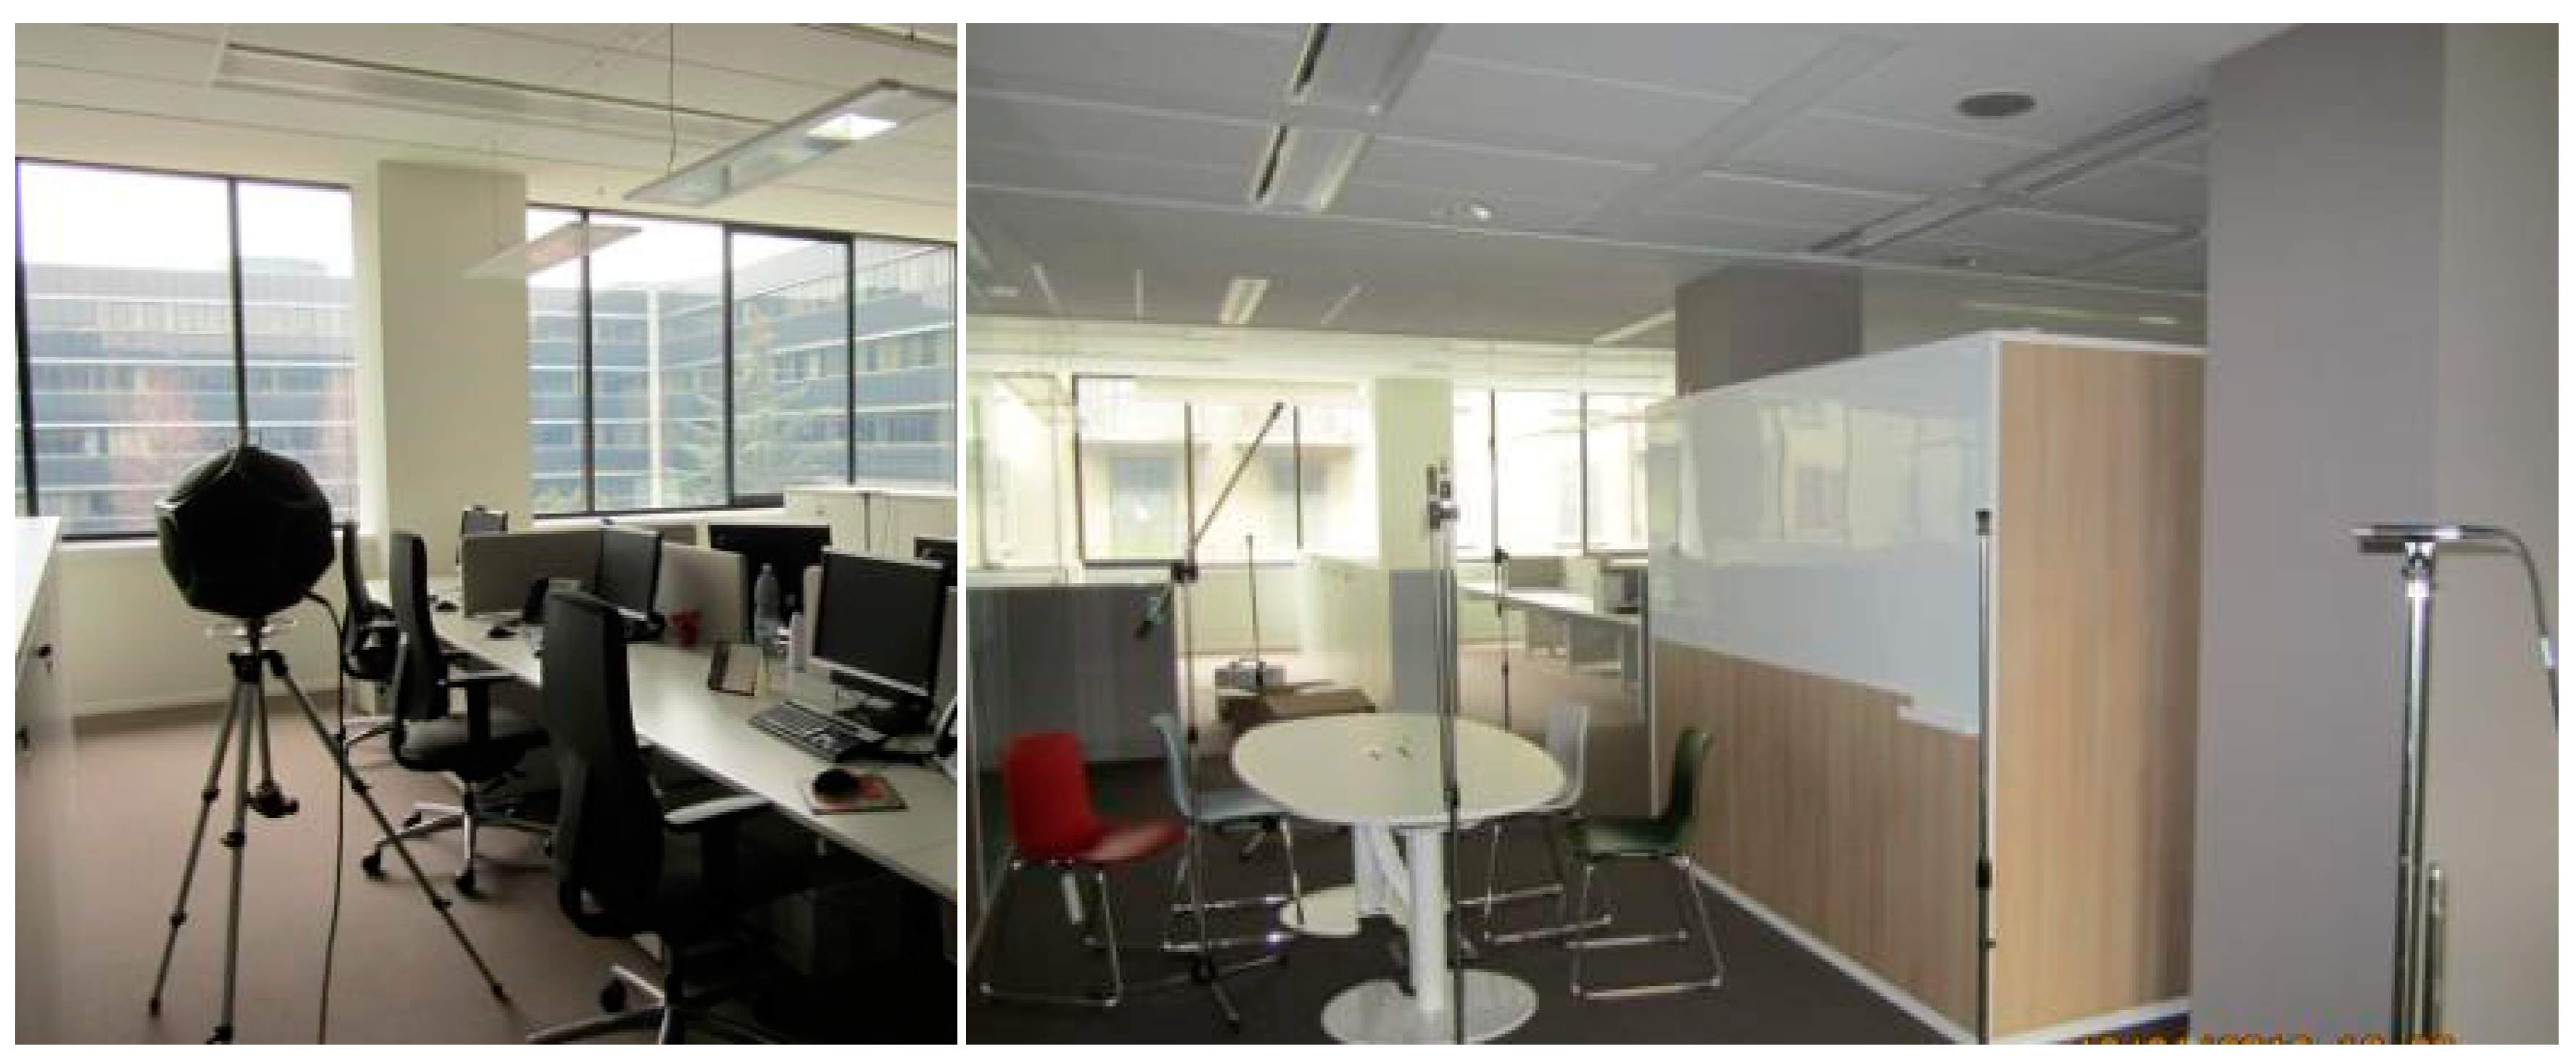
3. Case Study
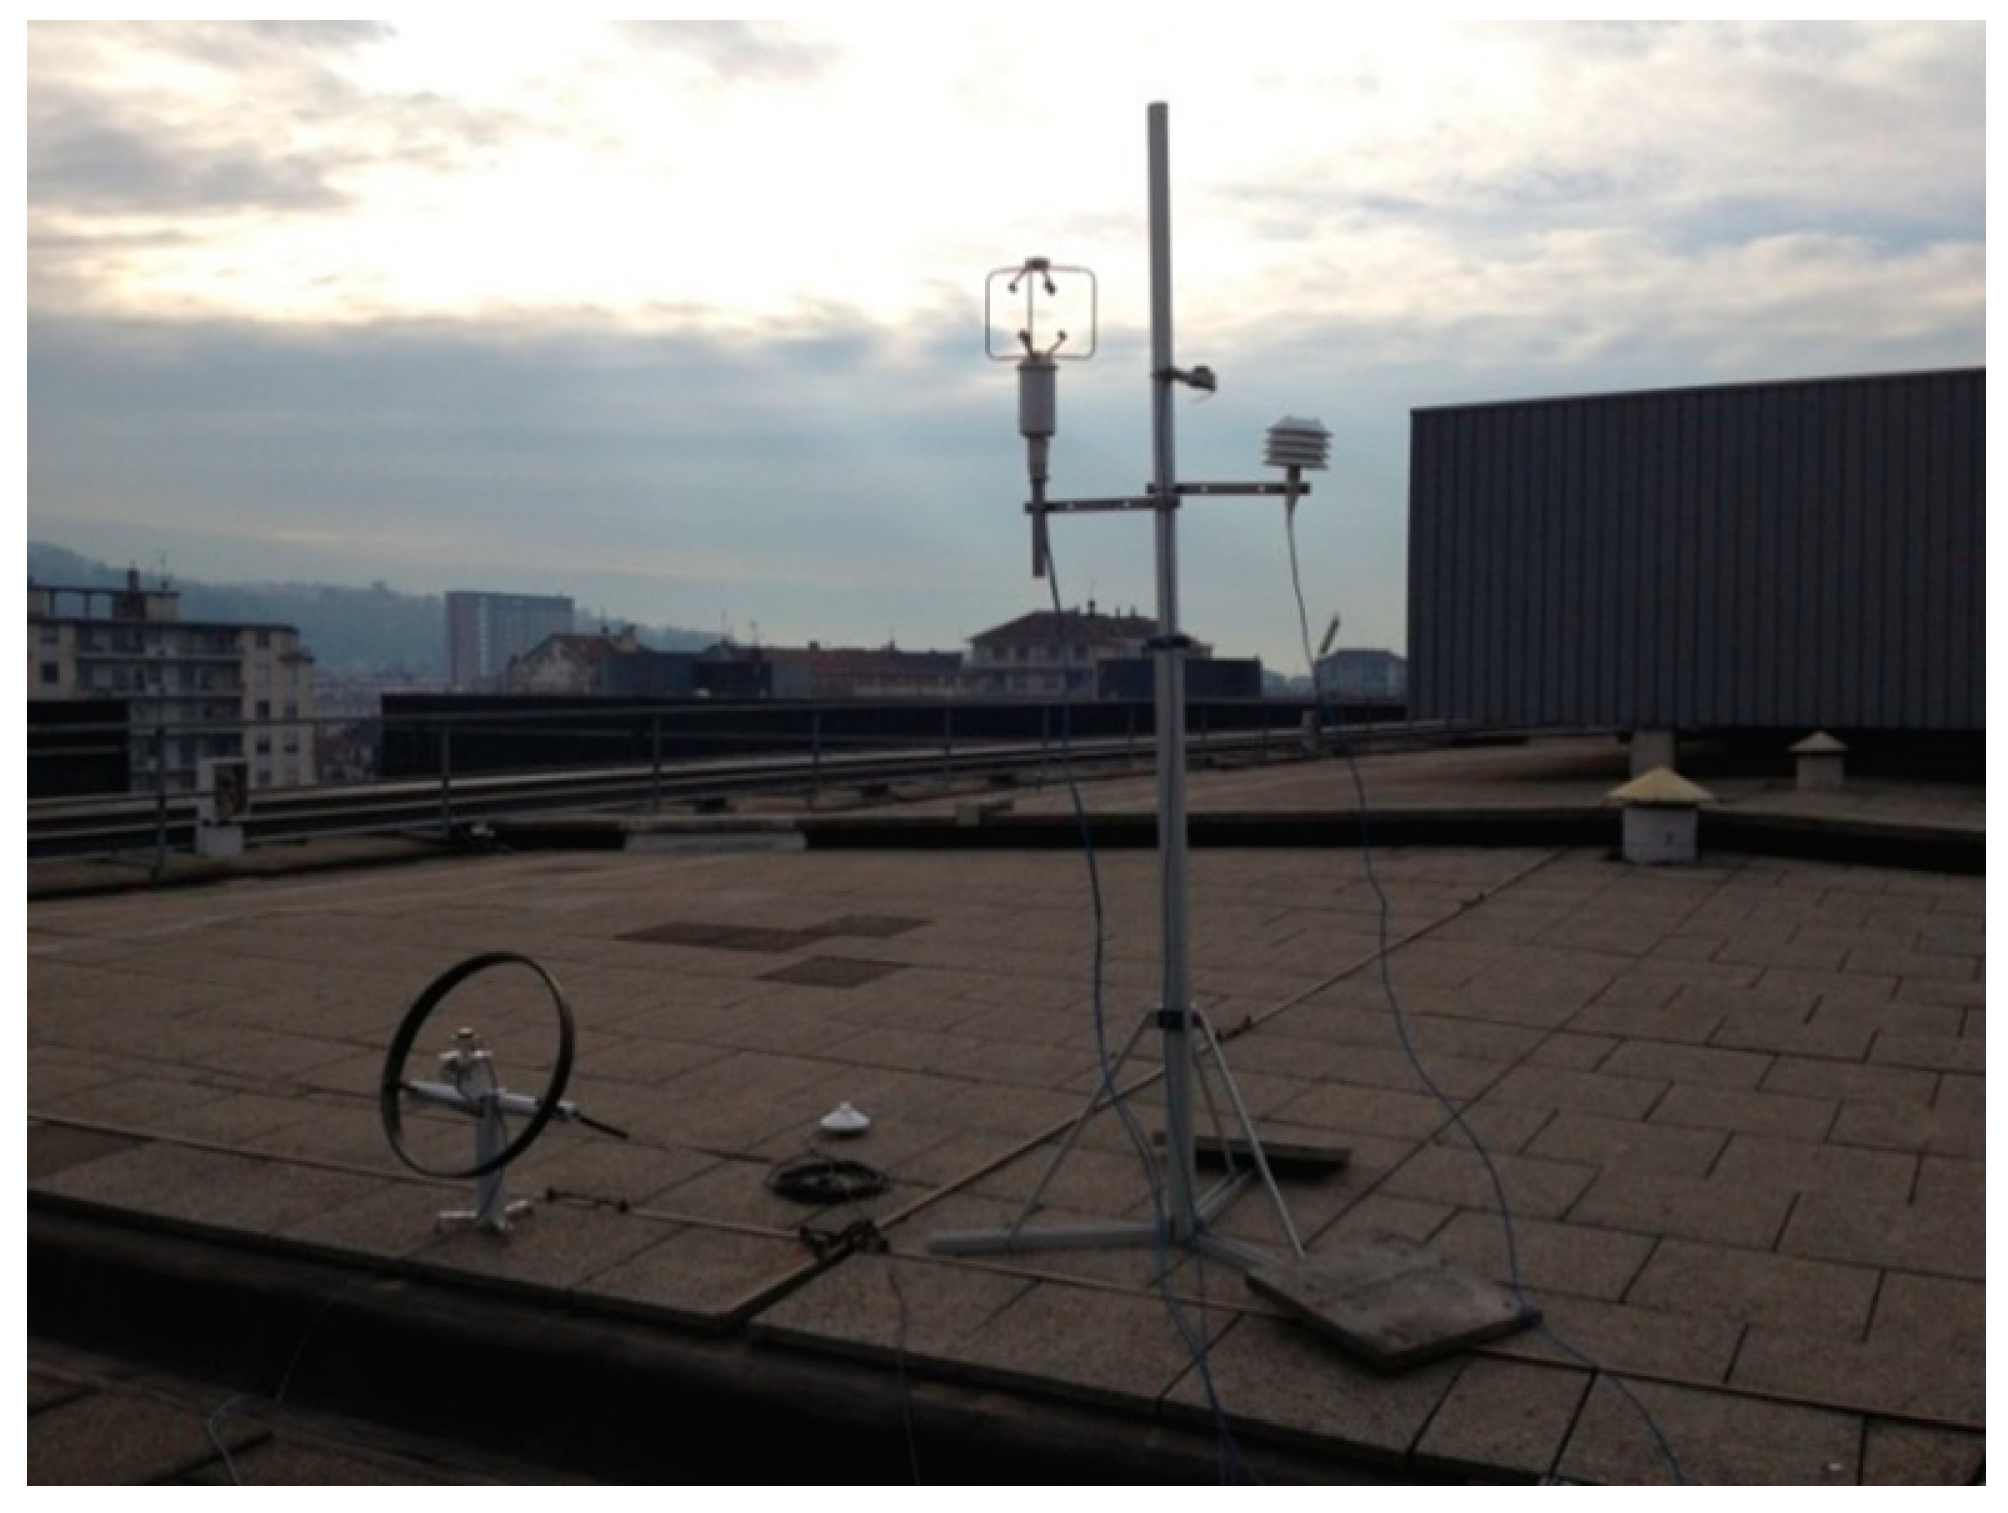
- External air temperature and relative humidity;
- Global radiation (diffuse and direct);
- Wind velocity and direction;
- Direct and diffuse illuminance.
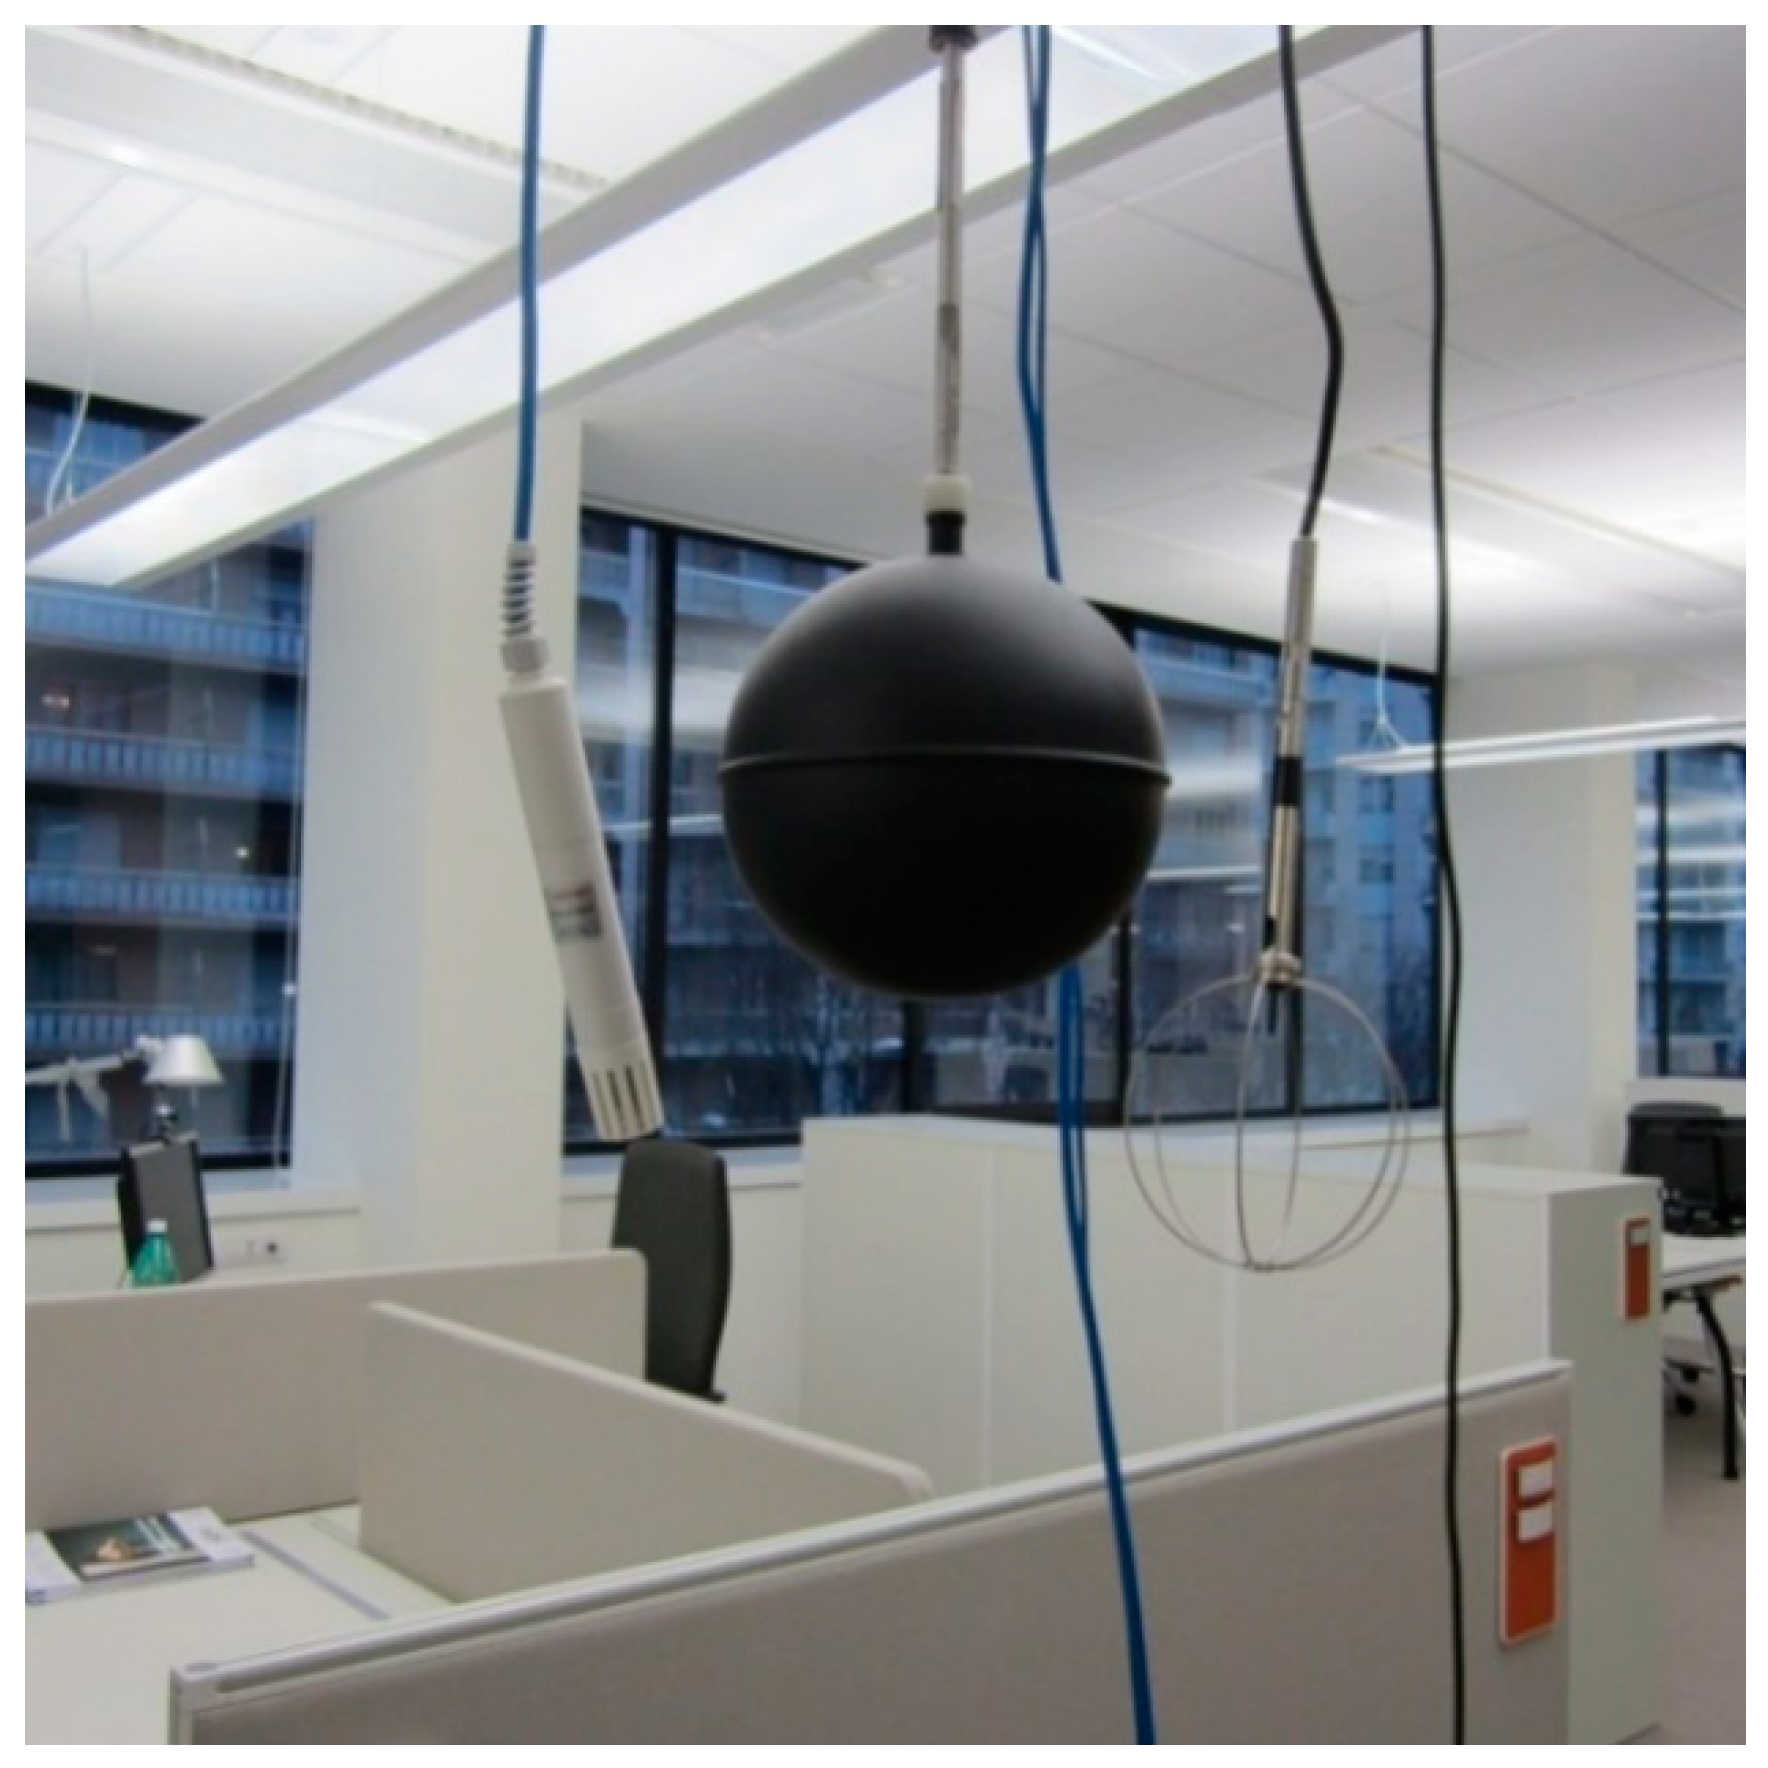
- Resistance thermometers pt 100 (RTD);
- Indoor humidity sensor;
- Black-globe thermometer for the detection of the mean radiant temperature;
- Omnidirectional hot-wire anemometer.
- Sound Level Meter;
- Prepolarized Free-Field ½” microphones;
- Omnidirectional sound source;
- Sound level calibrator.
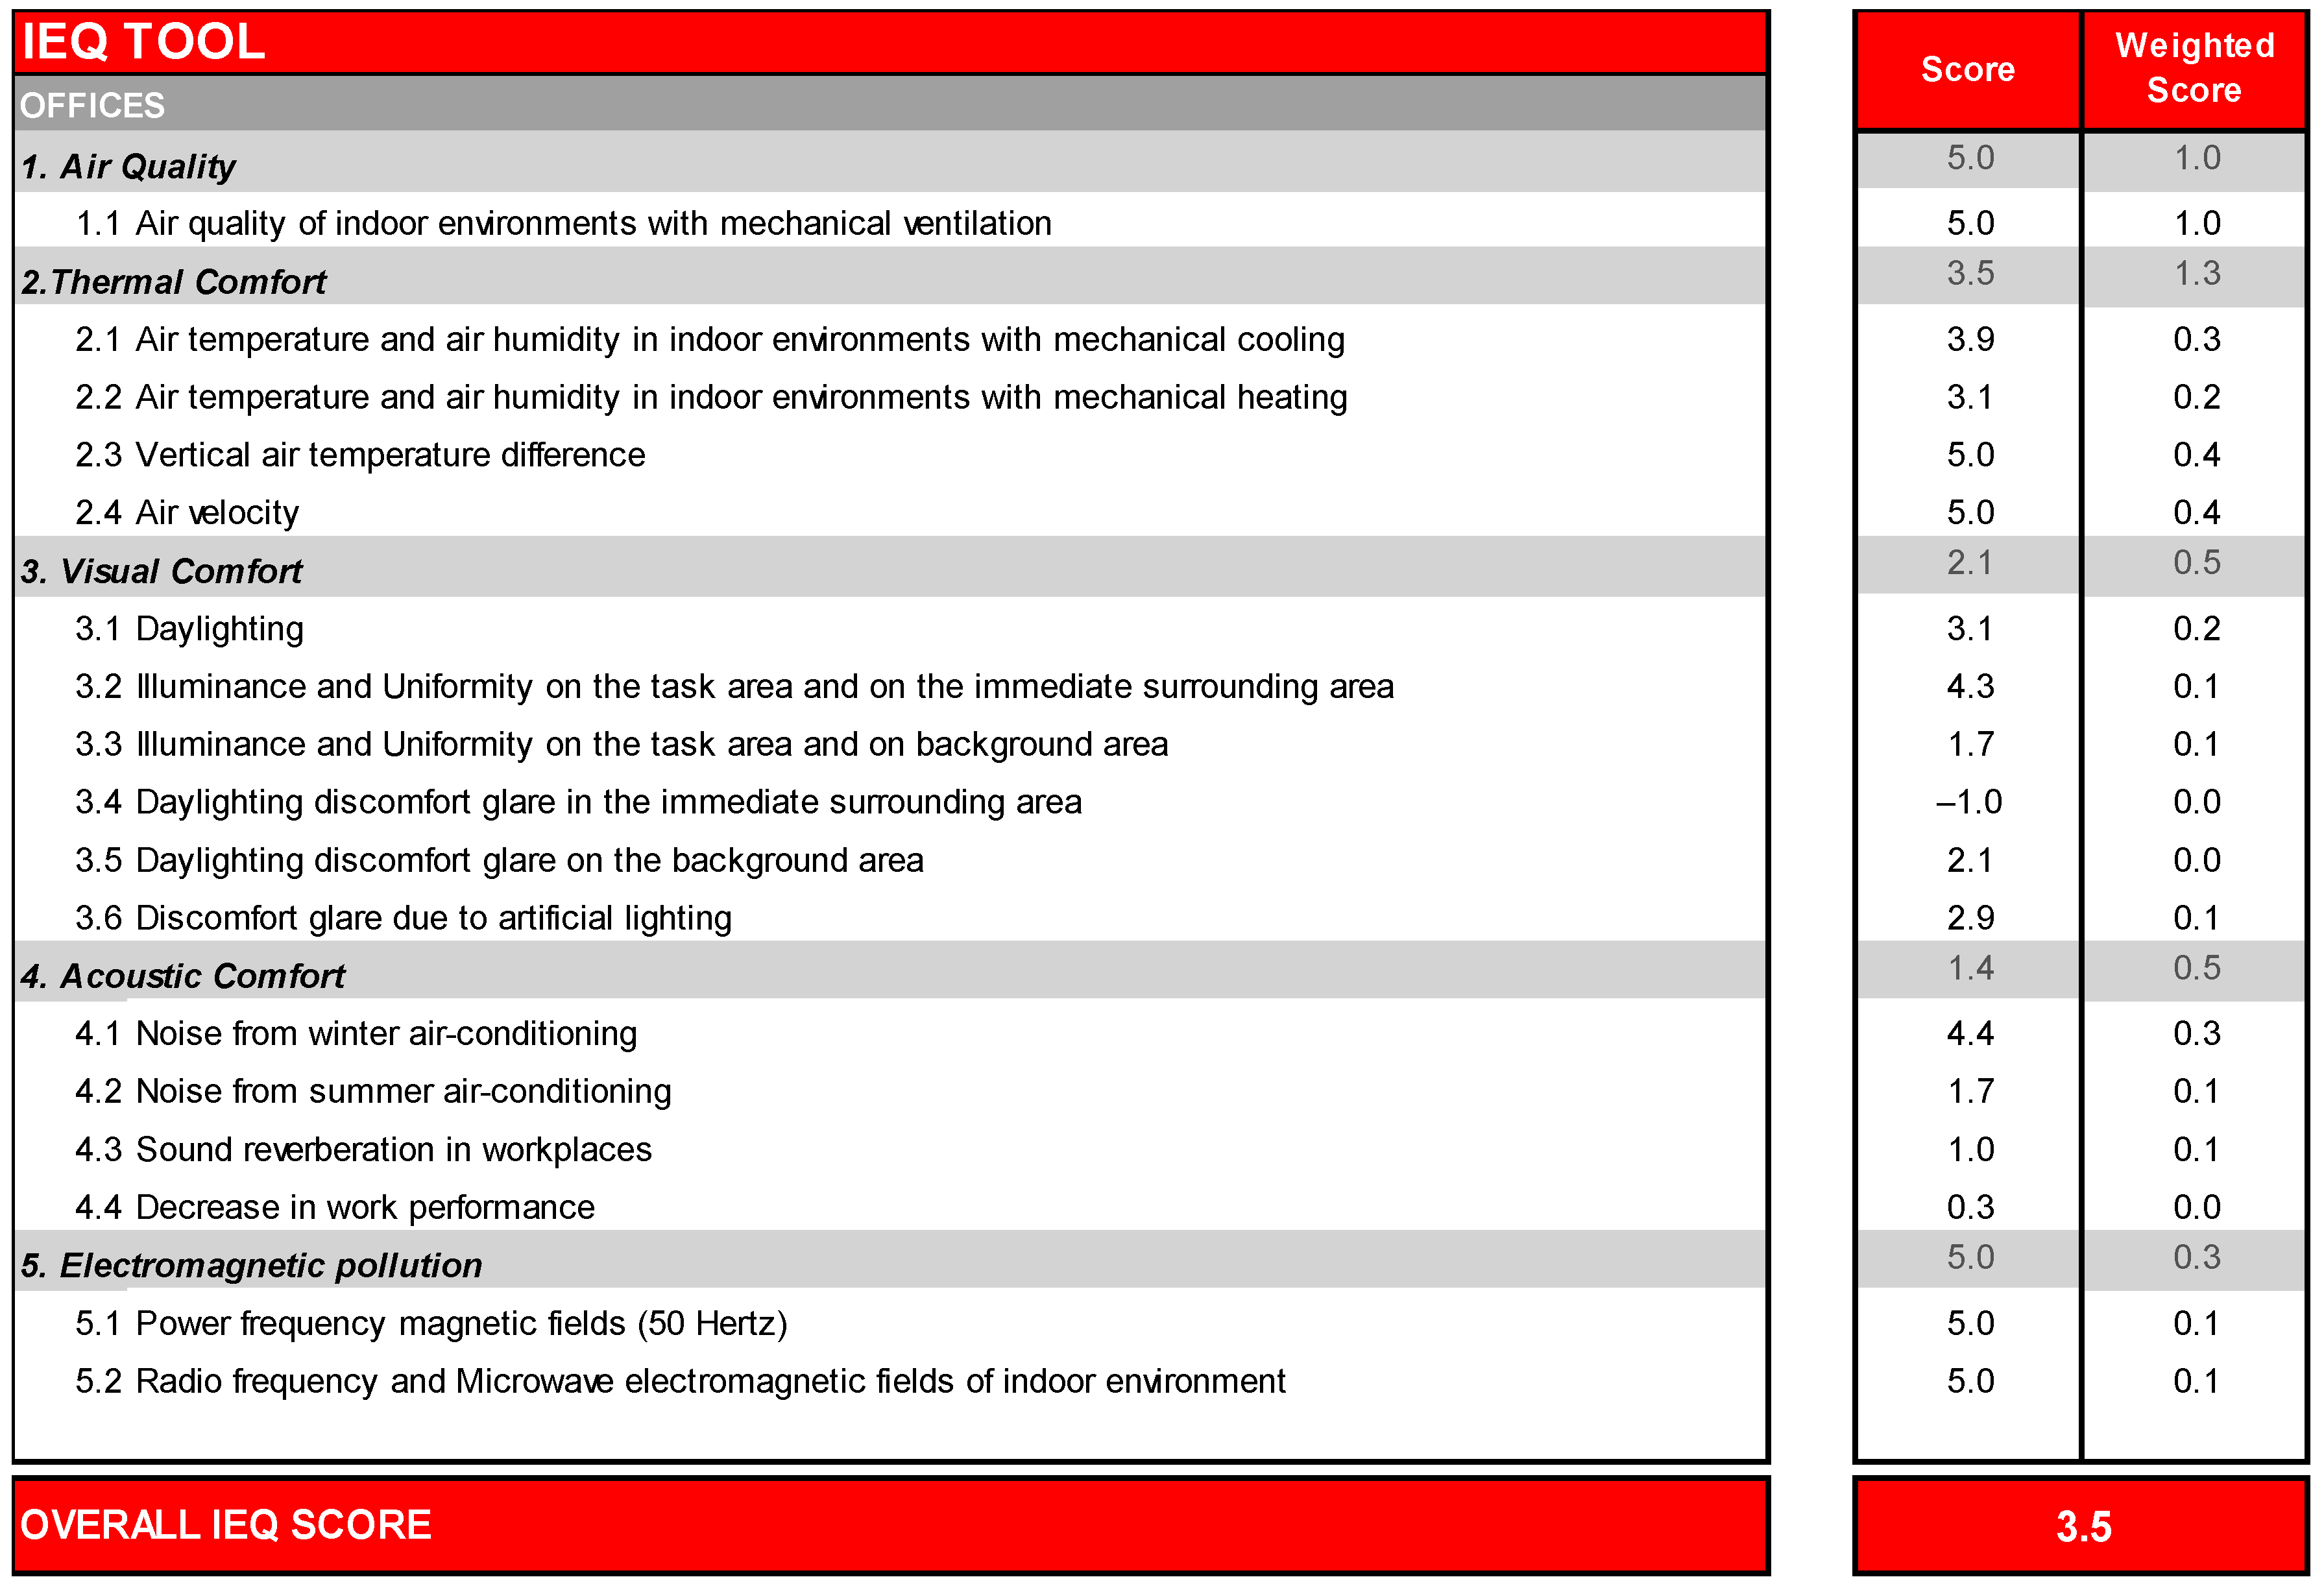
4. Results
5. Discussion
6. Conclusions
Author Contributions
Funding
Acknowledgments
Conflicts of Interest
References
- Brundtland, G. Chair of the World Commission on Environment and Development (WCED) Our Common Future, United Nations World Commission on Environment and Development. 1987. Available online: http://www.un-documents.net/our-common-future.pdf (accessed on 17 February 2019).
- Allouhi, A.; El Fouih, Y.; Kousksou, T.; Jamil, A.; Zeraouli, Y.; Mourad, Y. Energy consumption and efficiency in buildings: Current status and future trends. J. Clean. Prod. 2015, 109, 118–130. [Google Scholar] [CrossRef]
- Cao, X.; Dai, X.; Liu, J. Building energy-consumption status worldwide and the state-of-the-art technologies for zero-energy buildings during the past decade. Energy Build. 2016, 128, 198–213. [Google Scholar] [CrossRef]
- Kolokotsa, D.; Santamouris, M. Review of the indoor environmental quality and energy consumption studies for low income households in Europe. Sci. Total Environ. 2015, 536, 316–330. [Google Scholar] [CrossRef]
- Esfandiari, M.; Zaid, S.M.; Ismail, M.A. Investigating the Indoor Environment Quality Parameters and Their Relationship with Occupants’ Satisfaction in Office Buildings: A Review. J. Des. Built Environ. 2017, 17, 181–194. [Google Scholar]
- Secchi, S.; Astolfi, A.; Calosso, G.; Casini, D.; Cellai, G.; Scamoni, F.; Scrosati, C.; Shtrepi, L. Effect of outdoor noise and façade sound insulation on indoor acoustic environment of Italian schools. Appl. Acoust. 2017, 126, 120–130. [Google Scholar] [CrossRef]
- Piasecki, M.; Kozicki, M.; Firląg, S.; Goljan, A.; Kostyrko, K. The approach of including TVOCS concentration in the indoor environmental quality model (IEQ)—Case studies of BREEAM certified office buildings. Sustainability 2018, 10, 3902. [Google Scholar] [CrossRef]
- Calama-González, C.M.; Suárez, R.; León-Rodríguez, Á.L.; Ferrari, S. Assessment of Indoor Environmental Quality for Retrofitting Classrooms with an Egg-Crate Shading Device in a Hot Climate. Sustainability 2019, 11, 1078. [Google Scholar] [CrossRef]
- Vilcekova, S.; Meciarova, L.; Burdova, E.K.; Katunska, J.; Kosicanova, D.; Doroudiani, S. Indoor environmental quality of classrooms and occupants’ comfort in a special education school in Slovak Republic. Build. Environ. 2017, 120, 29–40. [Google Scholar] [CrossRef]
- Salamone, F.; Belussi, L.; Danza, L.; Ghellere, M.; Meroni, I. Integration of a do it yourself Hardware in a Lighting Device for the Management of Thermal Comfort and Energy Use. Energy Procedia 2016, 101, 161–168. [Google Scholar] [CrossRef]
- Salamone, F.; Belussi, L.; Danza, L.; Ghellere, M.; Meroni, I. How to control the Indoor Environmental Quality through the use of the Do–It–Yourself approach and new pervasive technologies. Energy Procedia 2017, 140, 351–360. [Google Scholar] [CrossRef]
- Casini, D.; Cellai, G.; Fogola, J.; Scamoni, F.; Secchi, S. Correlation between facade sound insulation and urban noise: A contribution to the acoustic classification of existing buildings. Build. Acoust. 2016, 23, 145–158. [Google Scholar] [CrossRef]
- Mateus, R.; Bragança, L. Sustainability assessment and rating of buildings: Developing the methodology SBToolPT–H. Build. Environ. 2011, 46, 1962–1971. [Google Scholar] [CrossRef]
- Alyami, S.H.; Rezgui, Y. Sustainable building assessment tool development approach. Sustain. Cities Soc. 2012, 5, 52–62. [Google Scholar] [CrossRef]
- Chew, M.Y.L.; Das, S. Building grading systems: A review of the state–of–the–art. Archit. Sci. Rev. 2008, 51, 3–13. [Google Scholar] [CrossRef]
- Andrade, J.B.; Bragança, L. Sustainability assessment and standardization: Steel buildings. Concepts Methods Steel Intensive Build. Proj. 2012, 213–224. [Google Scholar]
- Sev, A. A comparative analysis of building environmental assessment tools and suggestions for regional adaptations. Civil Eng. Environ. Syst. 2011, 28, 231–245. [Google Scholar] [CrossRef]
- Mattoni, B.; Guattari, C.; Evangelisti, L.; Bisegna, F.; Gori, P.; Asdrubali, F. Critical review and methodological approach to evaluate the differences among international green building rating tools. Renew. Sustain. Energy Rev. 2018, 82, 950–960. [Google Scholar] [CrossRef]
- Ghellere, M.; Devitofrancesco, A.; Meroni, I. Urban sustainability assessment of neighborhoods in Lombardy. Energy Procedia 2017, 122, 44–49. [Google Scholar] [CrossRef]
- Devitofrancesco, A.; Ghellere, M.; Meroni, I.; Modica, M.; Paleari, S.; Zoboli, R. Sustainability assessment of urban areas through a multicriteria decision support system. In CESB 2016—Central Europe Towards Sustainable Building 2016: Innovations for Sustainable Future; Grada Publishing: Prague, Czech Republic, 2016; pp. 499–506. [Google Scholar]
- Pons, O.; de la Fuente, A.; Aguado, A. The use of MIVES as a sustainability assessment MCDM method for architecture and civil engineering applications. Sustainability 2016, 8, 460. [Google Scholar] [CrossRef]
- Alborz, N.; Berardi, U. A post occupancy evaluation framework for LEED certified US higher education residence halls. Procedia Eng. 2015, 118, 19–27. [Google Scholar] [CrossRef]
- Shika, S.A.; Sapri, M.; Jibril, J.D.A.; Sipan, I.; Abdullah, S. Developing post occupancy evaluation sustainability assessment framework for retrofitting commercial office buildings: A proposal. Procedia Soc. Behav. Sci. 2012, 65, 644–649. [Google Scholar] [CrossRef]
- Agha–Hossein, M.M.; El–Jouzi, S.; Elmualim, A.A.; Ellis, J.; Williams, M. Post–occupancy studies of an office environment: Energy performance and occupants’ satisfaction. Build. Environ. 2013, 69, 121–130. [Google Scholar] [CrossRef]
- Bonde, M.; Ramirez, J. A post–occupancy evaluation of a green rated and conventional on–campus residence hall. Int. J. Sustain. Built Environ. 2015, 4, 400–408. [Google Scholar] [CrossRef]
- Kern, A.P.; Antoniolli, C.B.; Wander, P.R.; Mancio, M.; González, M.A.S. Energy and water consumption during the post–occupancy phase and the users’ perception of a commercial building certified by Leadership in Energy and Environmental Design (LEED). J. Clean. Prod. 2016, 133, 826–834. [Google Scholar] [CrossRef]
- Baird, G.; Field, C. Thermal comfort conditions in sustainable buildings–Results of a worldwide survey of users’ perceptions. Renew. Energy 2013, 49, 44–47. [Google Scholar] [CrossRef]
- Heinzerling, D.; Schiavon, S.; Webster, T.; Arens, E. Indoor environmental quality assessment models: A literature review and a proposed weighting and classification scheme. Build. Environ. 2013, 70, 210–222. [Google Scholar] [CrossRef]
- Larsson, N. SB Method and SBTool for 2011. Overview. International Initiative for a Sustainable Built Environment. 2011. Available online: http://iisbe.org/sbmethod-2010 (accessed on 17 February 2019).
- Asdrubali, F.; Baldinelli, G.; Bianchi, F.; Sambuco, S. A comparison between environmental sustainability rating systems LEED and ITACA for residential buildings. Build. Environ. 2015, 86, 98–108. [Google Scholar] [CrossRef]
- ITACA Protocols. Available online: http://itaca.org/valutazione_sostenibilita.asp (accessed on 17 February 2019).
- Epstein, M.J.; Roy, M.J. Sustainability in action: Identifying and measuring the key performance drivers. Long Range Plan. 2001, 34, 585–604. [Google Scholar] [CrossRef]
- European Committee for Standardization. CEN 15251:2007 Indoor Environmental input Parameters for Design and Assessment of Energy Performance of Buildings Addressing Indoor Air Quality, Thermal Environment, Lighting and Acoustics; European Committee for Standardization: Brussels, Belgium, 2007. [Google Scholar]
- European Committee for Standardization. CEN 13779:2007. Ventilation for Non–Residential Buildings–Performance Requirements for Ventilation and Room–Conditioning Systems; European Committee for Standardization: Brussels, Belgium, 2007. [Google Scholar]
- International Organization for Standardization. ISO 7730:2005. Ergonomics of the Thermal Environment—Analytical Determination and Interpretation of Thermal Comfort Using Calculation of the PMV and PPD Indices and Local Thermal Comfort Criteria; International Organization for Standardization: Geneva, Switzerland, 2005. [Google Scholar]
- European Committee for Standardization. CEN 12464-1:2011. Light and Lighting—Lighting of Work Places–Part 1: Indoor Work Places; European Committee for Standardization: Brussels, Belgium, 2011. [Google Scholar]
- European Committee for Standardization. CEN 15193:2017. Energy Performance of Buildings–Energy Requirements for Lighting; European Committee for Standardization: Brussels, Belgium, 2017. [Google Scholar]
- International Organization for Standardization. ISO 3382-2:2008. Acoustics—Measurements of Room Acoustics Parameters—Part, 2, Reverberation Time in Ordinary Rooms; International Organization for Standardization: Geneva, Switzerland, 2008. [Google Scholar]
- International Organization for Standardization. ISO 3382-3:2012. Acoustics—Measurement of Room Acoustic Parameters—Part, 3, Open Plan Offices; International Organization for Standardization: Geneva, Switzerland, 2012. [Google Scholar]
- International Organization for Standardization. ISO 9921:2003. Ergonomics—Assessment of Speech Communication; International Organization for Standardization: Geneva, Switzerland, 2003. [Google Scholar]
- International Electrotechnical Commission. IEC 60268-16:2011. Sound System Equipment—Part 16: Objective Rating of Speech Intelligibility by Speech Transmission Index; International Electrotechnical Commission: Geneva, Switzerland, 2011. [Google Scholar]
- Legislative Decree 9 april 2008, n. 81. 2008 Attuazione dell’articolo 1 della legge 3 agosto 2007, n.123, in materia di tutela della salute e della sicurezza nei luoghi di lavoro—Allegato XXXVI “Valori limite di esposizione e valori di azione per i campi elettromagnetici”. Available online: http://www.lavoro.gov.it (accessed on 19 March 2019).
- De Gennaro, G.; Dambruoso, P.R.; Loiotile, A.D.; Di Gilio, A.; Giungato, P.; Tutino, M.; Marzocca, A.; Mazzone, A.; Palmisani, J.; Porcelli, F. Indoor air quality in schools. Environ. Chem. Lett. 2014, 12, 467–482. [Google Scholar] [CrossRef]
- Fisk, W.J.; Black, D.; Brunner, G. Benefits and costs of improved IEQ in US offices. Indoor Air 2011, 21, 357–367. [Google Scholar] [CrossRef]
- Al-horr, Y.; Arif, M.; Katafygiotou, M.; Mazroei, A.; Kaushik, A.; Elsarrag, E. Impact of indoor environmental quality on occupant well-being and comfort: A review of the literature. Int. J. Sustain. Built Environ. 2016, 5, 1–11. [Google Scholar] [CrossRef]
- BREEAM In–Use International: Technical Manual. 2016. Available online: https://tools.breeam.com (accessed on 2 February 2019).
- LEED v4.1 Operations and Maintenance. 2018. Available online: https://www.usgbc.org (accessed on 15 February 2019).


| Categories | Reference Standard |
|---|---|
| Indoor air quality | EN 13779 [34] |
| Indoor thermal comfort | ISO 7730 [35] |
| Visual comfort | EN 12464–1 [36], EN 15193 [37], |
| Acoustic quality | EN ISO 3382–2 [38], EN ISO 3382–3 [39], EN ISO 9921 [40], IEC 60268–16 [41] |
| Electromagnetic pollution | Legislative Decree 81, Decree of the President of the Council of Ministers 8 July 2003 [42] |
| Score | Performance |
|---|---|
| −1 | Represents a performance below the standard required |
| 0 | Represents the minimum acceptable performance defined by laws or regulations in force |
| 3 | Represents the best performance compared to regulations in force |
| 5 | Represents a higher performance compared to the current best practice (excellence) |
| Criteria | Indicators | Indices | |
|---|---|---|---|
| 1. | Indoor Air Quality | ||
| 1.1 | Air quality of indoor environments with mechanical ventilation | Difference between indoor air CO2 concentration and that of outdoor air concentration | ΔCO2 |
| 2. | Thermal Comfort | ||
| 2.1 | Air temperature and air humidity in indoor environments with mechanical cooling | Predicted Mean Vote average during winter season | PMVw |
| 2.2 | Air temperature and air humidity in indoor environments with mechanical heating | Predicted Mean Vote average during summer season | PMVs |
| 2.3 | Vertical air temperature difference | Percentage of Dissatisfied as a function of the vertical air temperature difference between head and ankles | PD |
| 2.4 | Air velocity | Draught Risk | DR |
| 3. | Visual Comfort | ||
| 3.1 | Daylighting | Average Daylight Factor and daylight average illuminance | DF |
| 3.2 | Illuminance and Uniformity on the task area and on the immediate surrounding area | The ratio of the minimum illuminance to the average illuminance on the immediate surrounding area | U0,surr |
| 3.3 | Illuminance and Uniformity on the task area and on background area | The ratio of the minimum illuminance to the average illuminance on the background area | U0,back |
| 3.4 | Daylighting discomfort glare in the immediate surrounding area | The ratio of the visual task discomfort glare to the average discomfort glare in the immediate surrounding area | Rsurr |
| 3.5 | Daylighting discomfort glare on the background area | The ratio of the visual task discomfort glare to the average discomfort glare on the background area | Rback |
| 3.6 | Discomfort glare due to artificial lighting | Unified Glare Rating | UGR |
| 4. | Acoustic Quality | ||
| 4.1 | Noise from winter air–conditioning | Sound pressure level of winter air–conditioning | Li,w |
| 4.2 | Noise from summer air–conditioning | Sound pressure level of summer air–conditioning | Li,s |
| 4.3 | Sound Reverberation in workplaces | Reverberation time | T |
| 4.4 | Decrease in work performance | Speech Transmission Index | STI |
| 5. | Electromagnetic Pollution | ||
| 5.1 | Power frequency magnetic fields (50 Hertz) | Magnetic induction mean value | B |
| 5.2 | Radio frequency and Microwave electromagnetic fields of indoor environment | Electrical field level | E |
| Period | Criteria | ||||||||||||||||
|---|---|---|---|---|---|---|---|---|---|---|---|---|---|---|---|---|---|
| 1.1 | 2.1 | 2.2 | 2.3 | 2.4 | 3.1 | 3.2 | 3.3 | 3.4 | 3.5 | 3.6 | 4.1 | 4.2 | 4.3 | 4.4 | 5.1 | 5.2 | |
| Winter weeks | – | ● | – | ● | ● | – | – | – | – | – | – | – | – | – | – | – | – |
| Summer weeks | – | – | ● | ● | ● | – | – | – | – | – | – | – | – | – | – | – | – |
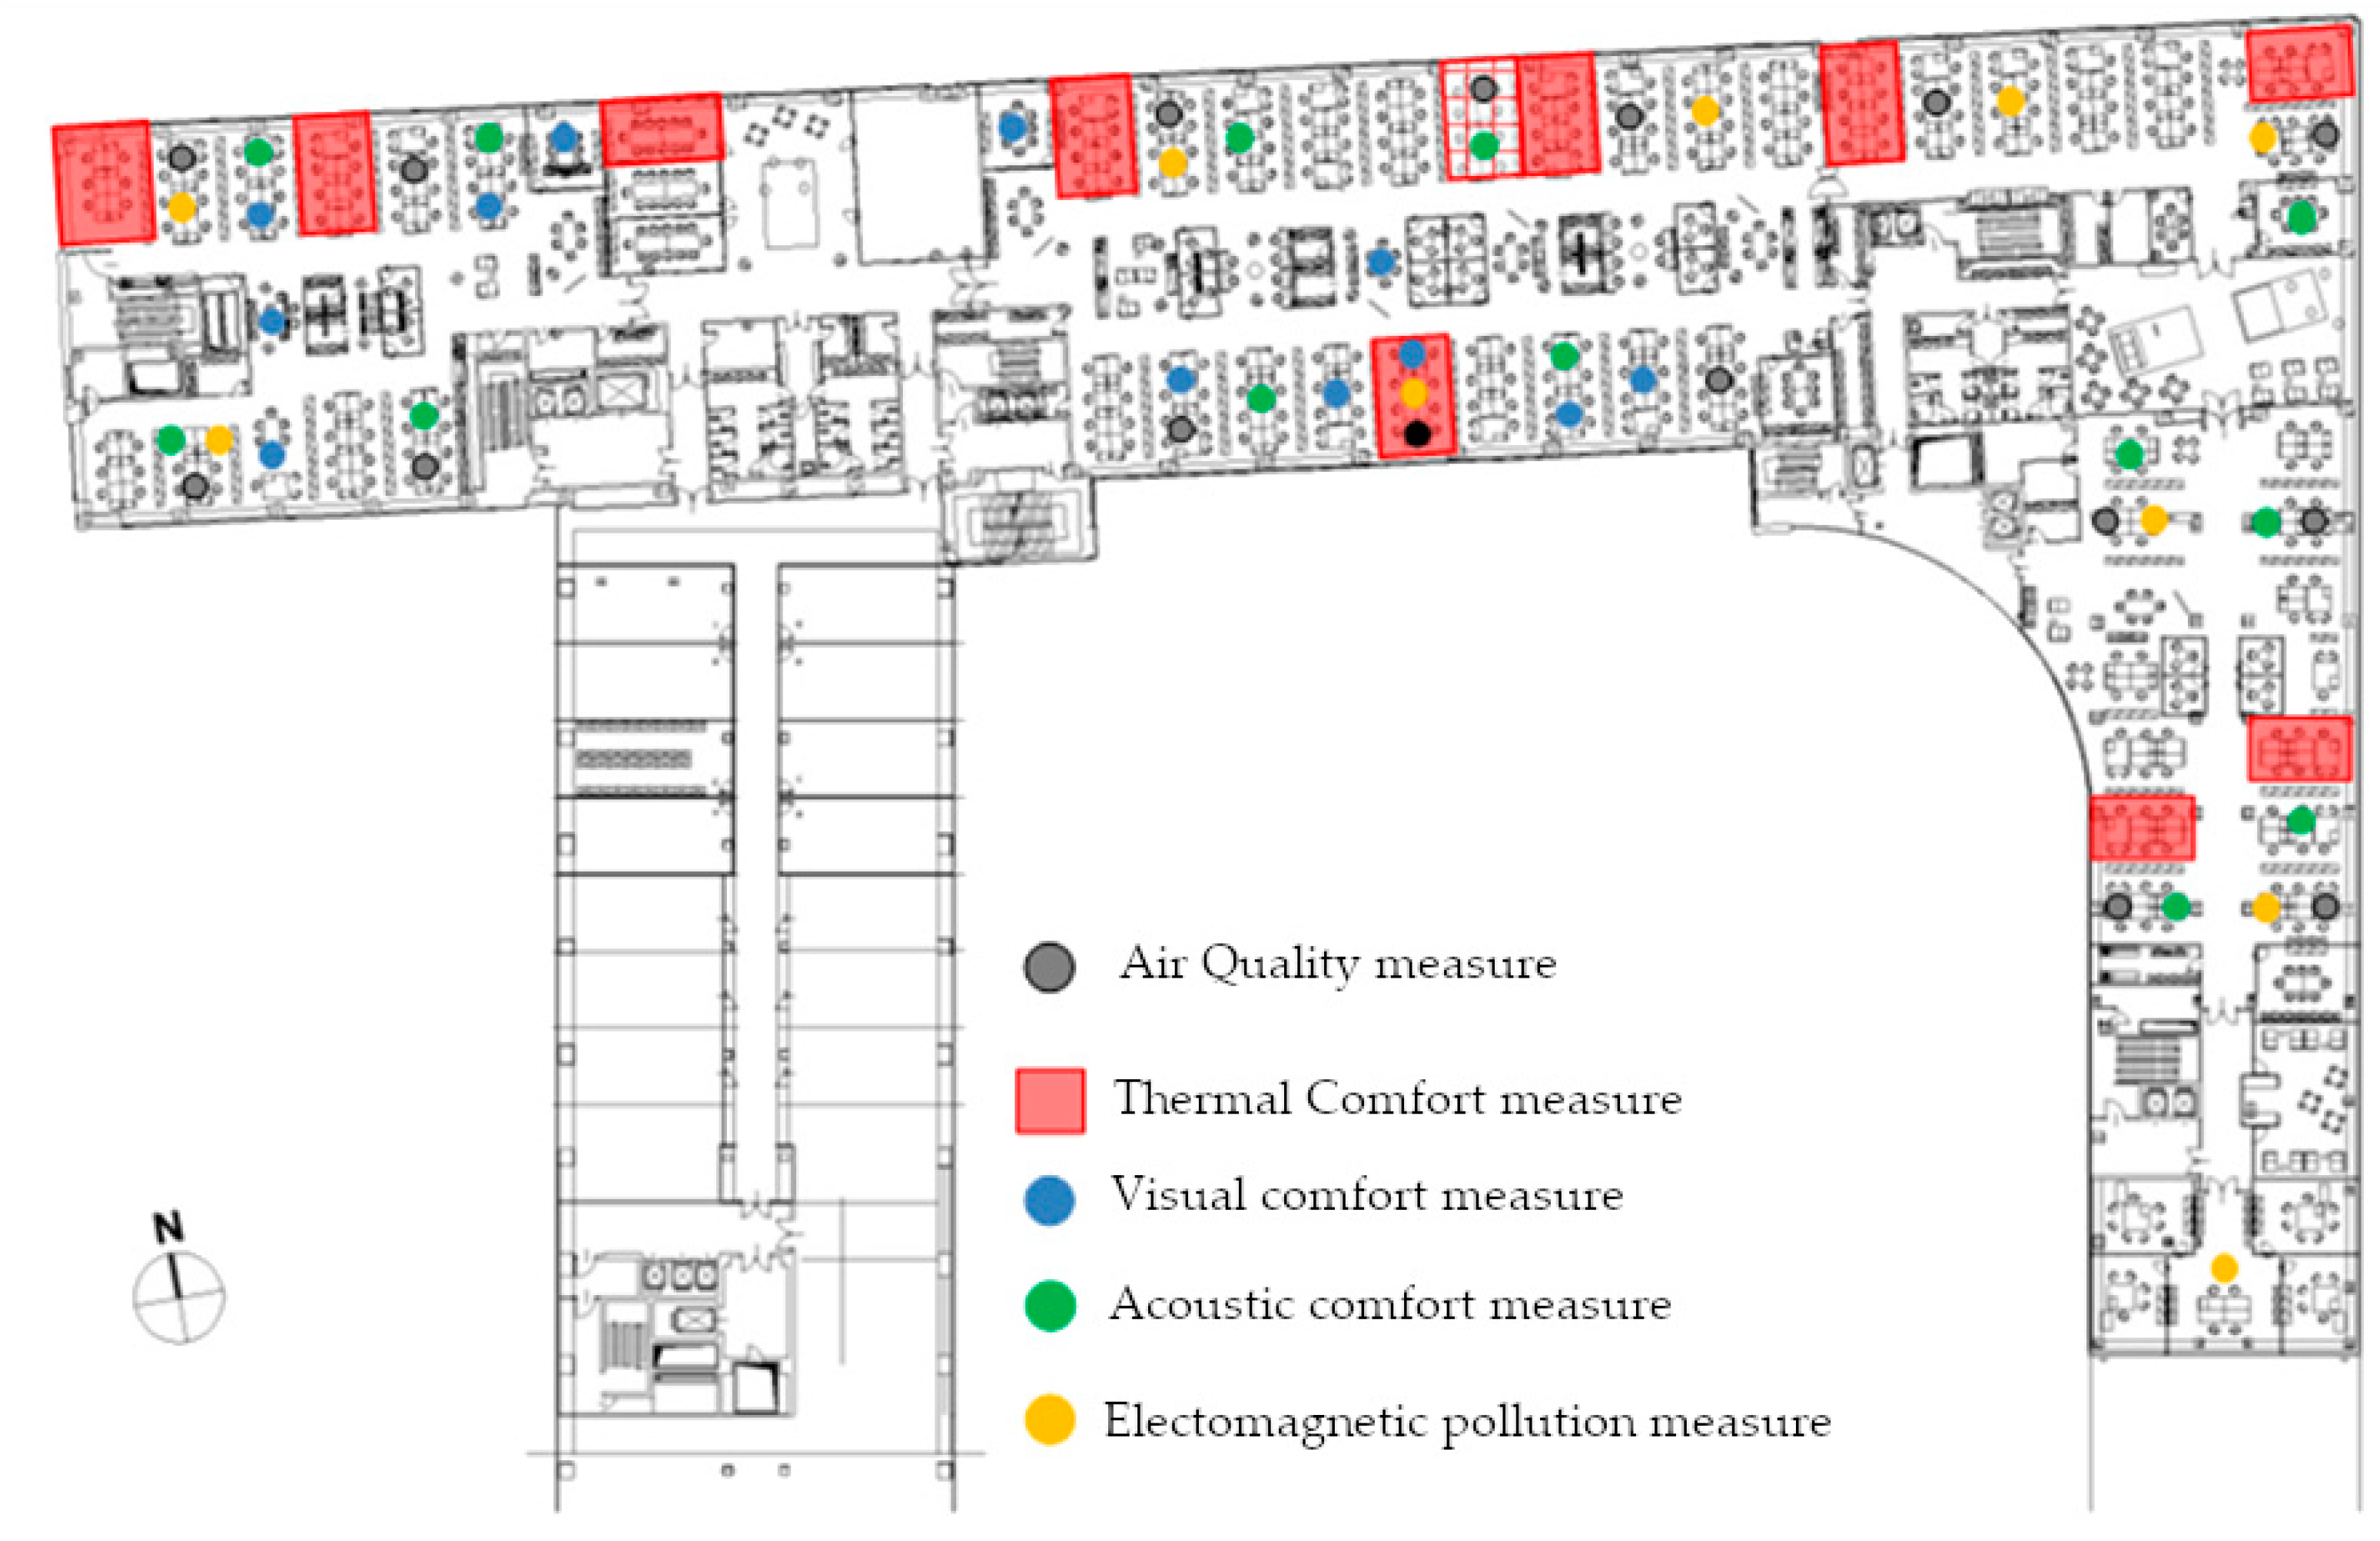
| Punctual surveys | ● * | – | – | – | – | ● | ● | ● | ● | ● | ● | ● * | ● ** | ● | ● | ● | ● |
| Variable | Sensor | Technical Characteristics |
|---|---|---|
| Air temperature | Thermo-hygrometric sensor | Measuring range −40 to 80 °C Accuracy ±0.1 °C |
| Relative Humidity | Thermo-hygrometric sensor | Measuring range 0%–100% Accuracy ±< 1% |
| Global radiation | Pyranometer | Measuring range 0 to 2000 W/m2 Accuracy <± 2% |
| Wind velocity and direction | Triaxial sonic anemometer | Measuring range 0 to 60 m/s Accuracy ± % |
| Direct and diffuse illuminance | Luxmeter | Measuring range 0 to 200 klux Accuracy <8% |
| Variable | Sensor | Technical Characteristics |
|---|---|---|
| CO2 concentration | CO2 analyser | Measuring range 0 to 9999 ppm Accuracy ±75 ppm |
| Variable | Sensor | Technical Characteristics |
|---|---|---|
| Air temperature | Pt100 RTD and electrical capacity | Measuring range −40 to +80 °C Accuracy ±0.1 °C |
| Relative humidity | Measuring range 0%–100% Accuracy ±1% | |
| Mean air temperature | Globetermometer | Measuring range −40 to +60 °C Accuracy ±0.1 °C |
| Air velocity | Hot wire anemometer | Measuring range 0 to 5 m/s Accuracy ±0.1 m/s |
| Variable | Sensor | Technical Characteristics |
|---|---|---|
| Internal illuminance | Luxmeter | Measuring range 0 to 2 klux Accuracy <8% |
| Punctual luminance | Luminance meter | Measuring range 0.01 to 999.900 cd/m2 Accuracy ±2% |
| Quantity | Sensor | Technical Characteristics |
|---|---|---|
| Sound pressure level | Microphone | Measuring range 3.15 Hz–20 kHz Sensitivity 50 mV/Pa |
| Variable | Sensor | Technical Characteristics |
|---|---|---|
| Magnetic Field | Magnetic Field Measurement System | Measuring range 0.1 to 700 mG Accuracy 2–4% |
| Electromagnetic field | Electromagnetic field measurement sensors | Measuring range 0.35 to 450 V/m Accuracy n.a. |
| Criteria | Indicator | Winter Weeks | Summer Weeks | Punctual Surveys | Benchmark |
|---|---|---|---|---|---|
| 1.1 | ΔCO2 | – | – | 158 ppm | ΔCO2 < 800 ppm |
| 2.1 | PMVw | 0.3 | – | – | −0.7 < PMV < 0.7 |
| 2.2 | PMVs | – | 0.4 | – | −0.7 < PMV < 0.7 |
| 2.3 | PD | 0.96 | 0.42 | – | PD < 10% |
| 2.4 | DR | 4.17 | 13.25 | – | DR < 30 |
| 3.1 | DF | – | – | 2.61% | DF > 2% |
| 3.2 | U0,surr | – | – | 0.91 | U > 0.4 |
| 3.3 | U0,back | – | – | 0.67 | U > 0.1 |
| 3.4 | Rsurr | – | – | 3.36 | Rsurr < 3 |
| 3.5 | Rback | – | – | 6.2 | Rback < 10 |
| 3.6 | UGR | – | – | 2.9 | UGR < 19 |
| 4.1 | Li,w | – | – | 30.3 dB(A) | Li,w < 45 |
| 4.2 | Li,s | – | – | 39.3 dB(A) | Li,s < 45 |
| 4.3 | T | – | – | 0.7 s | T < 0.8 |
| 4.4 | STI | – | – | 0.47 | STI < 0.5 |
| 5.1 | B | – | – | 0.01 µT | B < 10 µT |
| 5.2 | E | – | – | 0.74 V/m | E < 20 V/m |
© 2019 by the authors. Licensee MDPI, Basel, Switzerland. This article is an open access article distributed under the terms and conditions of the Creative Commons Attribution (CC BY) license (http://creativecommons.org/licenses/by/4.0/).
Share and Cite
Devitofrancesco, A.; Belussi, L.; Meroni, I.; Scamoni, F. Development of an Indoor Environmental Quality Assessment Tool for the Rating of Offices in Real Working Conditions. Sustainability 2019, 11, 1645. https://doi.org/10.3390/su11061645
Devitofrancesco A, Belussi L, Meroni I, Scamoni F. Development of an Indoor Environmental Quality Assessment Tool for the Rating of Offices in Real Working Conditions. Sustainability. 2019; 11(6):1645. https://doi.org/10.3390/su11061645
Chicago/Turabian StyleDevitofrancesco, Anna, Lorenzo Belussi, Italo Meroni, and Fabio Scamoni. 2019. "Development of an Indoor Environmental Quality Assessment Tool for the Rating of Offices in Real Working Conditions" Sustainability 11, no. 6: 1645. https://doi.org/10.3390/su11061645
APA StyleDevitofrancesco, A., Belussi, L., Meroni, I., & Scamoni, F. (2019). Development of an Indoor Environmental Quality Assessment Tool for the Rating of Offices in Real Working Conditions. Sustainability, 11(6), 1645. https://doi.org/10.3390/su11061645