1. Introduction
Financial statements are the basic documents that reflect a company’s financial status, its operating results and cash flows during a specific accounting period [
1]. So, financial statements are the main reference for decision-making for regulators, investors, creditors, and stakeholders. However, in the past few years, financial statement fraud incidents have occurred frequently in China. Examples are Yin Guangxia in 2001, Lantian stock in 2002, Green Land in 2013, and Xin Tai Electric in 2016. Moreover, both the magnitude and pace of financial statement fraud are growing. Increasing high-profile financial statement fraud has not only impeded corporate growth, but has also resulted in great damage to the sustainable development of the socio-economy in China [
1]. Therefore, in China’s capital market, it is critical to develop effective methods to detect financial statement fraud activities.
With regards to the issue of the financial statement fraud, in practice, auditors have become limited in their ability to detect fraudulent financial statements. On the one hand, they lack experience in fraud identification. On the other hand, considering the ratio of cost and return it is impossible for auditors to spend the time required to discover all the fraud that occurs. As a result, some accounting firms and companies have begun to use data mining techniques such as cloud auditing to identify fraudulent financial statements (FFS). In academia, research is gradually shifting from using traditional statistical analysis methods to using data mining techniques. The use of data mining techniques can solve the two main shortcomings of the traditional statistical analysis methods: (1) the data used must satisfy strict hypotheses, for example, the data must meet the normal distribution. However, the data used to detect fraudulent financial statements (FFS) usually contain a large number of financial indicators, which are generally not normally distributed [
2]; and (2) there are many disadvantages in the detection results, for example, the classification error rate is always very high [
3].
Although data mining has generally been shown to be an effective approach in detecting FFS, many problems still remain. First, most of the data mining predictive models of FFS are only trained with financial indicators such as the debt to equity ratio, the sales growth ratio and so on [
2,
4,
5,
6,
7], but non-financial indicators have received relatively little attention. In fact, some empirical studies have unveiled a significant relationship between abnormal non-financial indicators and financial statement fraud. [
8,
9]. For instance, Basely [
8] found that the inclusion of lower proportions of outside members on the board of directors significantly increases the likelihood of financial statement fraud. Kim et al. [
9] also discovered that intentionally misstating firms tend to show a higher firm-efficiency ranking. Second, with the continuous development of China’s socio-economy, China has become the world’s second largest economy, and China’s capital market has also developed rapidly. Financial fraud activities have occurred frequently due to lack of effective supervision. Therefore, it is very necessary to establish an effective predictive model of FFS for China’s capital market. Unfortunately, almost all of the existing models are developed in the United States [
10,
11]. Since the US capital market and China’s capital market are different in many respects, most of the existing models may not be as well suited for China. Third, detecting FFS is a complex but important task. The number of predictive variables in the models ranges from 20 [
12,
13,
14] to 100 [
6]. When adding more and more predictive variables, dimension disaster may happen, which may cause (1) overfitting of sample data; (2) instability of models; and (3) difficulty in promoting the models. Therefore, it is better to select a subset of the original predictive variables by eliminating variables that are redundant: this is called dimensionality reduction. At present, the most common and relatively mature dimensionality reduction techniques can be summarized into two categories, namely, feature selection and feature transformation. Feature selection techniques select the best indicators from the original variables pool, which retains the raw data and makes it easier to explain. Feature transformation techniques combine many original variables with new variables by means of linear or nonlinear transformation methods. These two techniques have their own advantages and disadvantages. However, studies have rarely adopted both of them or made a comparative analysis to investigate which type of techniques is more suitable to detect fraudulent financial statements [
2,
7].
Overall, based on previous research, this study makes the following contributions to the literature. First, in order to further improve the performance of the predictive models, we have added Altman’s Z-score, a comprehensive financial indicator, and financial variables that reflect a company’s profitability, operational capabilities, solvency and growth capabilities. Altman’s Z-score is an indicator that predicts whether a company will face financial distress and Kirkos et al. [
2] believe that financial distress may be related to financial fraud. Besides, an additional seven non-financial variables that reflect a company’s management structure, internal control, shareholders structure and external audit were also included in our study to catch as many predictors as possible. Second, the predictive models for FFS detecting were conducted in the context of China and the Wind database was used to collect the experimental data in our study. Wind is the leading financial data, information and software services company in mainland China, and a large number of domestic and international media, research reports, academic papers, etc. often quote data provided by Wind. The Wind database contains comprehensive historical fraud information for Chinese listed companies. Third, in the process of dimensionality reduction, stepwise regression and principal component analysis (PCA) were adopted as the feature selection technique and the feature transformation technique, respectively, and we made a comparative analysis to find which type of techniques is more suitable for FFS detection.
In this study, we conducted a comparative study by employing six data mining techniques and two dimensionality reduction methods to detect the FFS of companies listed on the Shanghai and Shenzhen stock exchange during the period 2008–2017. The six classifiers are support vector machine (SVM), classification and regression tree (CART), back propagation neural network (BP-NN), logistic regression (LR), Bayes classifier (Bayes), K-nearest neighbor (KNN). Also, we selected accuracy, recall (sensitivity), precision, F-score and area under the receiver operating characteristic curve (AUC) as metrics to evaluate the classification performance of each classifier.
The remainder of this paper is structured as follows. The next section reviews previous literature on FFS detection with data mining techniques, introduces the main data mining techniques and dimensionality reduction methods in detecting FFS, and also describes the data collected from the Wind database and the experimental setting of this research.
Section 3 presents the experimental results. Finally, a detailed discussion appears in
Section 4.
2. Materials and Methods
Previous studies have reported the superior classification performance of data mining techniques over traditional statistical methods [
1,
2,
3,
4,
5,
6,
7,
9,
10,
11,
12,
13,
14,
15,
16,
17,
18,
19,
20]. The literature related to FFS detection driven by data mining techniques is presented in
Table 1.
In this paper, 19 related articles were selected to analyze and summarize the data mining techniques and dimensionality reduction methods frequently used in the field of fraudulent financial statements detection. The reasons for selecting the 19 articles as our review literature are: (1) these articles were published in journals or conferences that are closely related to our research topic so this ensures the representativeness of our review; (2) these articles were published from 1999 to 2018, so the time span is large and it reflects the progress of research in this field in a more comprehensive way.
2.1. Data Mining Techniques in FFS Detection
To determine the main data mining techniques used for detecting FFS, we present a simple analysis of the 19 articles in
Table 2. We found that support vector machine, decision trees, neural networks, and logistic regression were the most popular techniques, being used in 71.93% (41 of 57). Also some articles used the Bayesian network, and text mining techniques to identify the FFS. The K-nearest neighbor, rough set theory, genetic programming, and random forest are used relatively infrequently in these 19 selected articles. After comprehensive consideration, we chose support vector machine (SVM), classification and regression tree (CART) (which belongs to decision tree), back propagation neural network (BP-NN), logistic regression (LR), Bayes classifier (Bayes) and K-nearest neighbor (KNN) as the data mining techniques tested in this paper.
These selected data mining techniques have varied backgrounds and different theories to support them. In this way, we ensured that the problem at hand was analyzed by disparate models with varying degrees of computational complexity and performance on FFS detection problems.
Support vector machine (SVM) is an artificial intelligence learning method developed by Vapnik [
20]. It is a machine learning technique based on statistical learning theory and structural risk minimization. The purpose is to identify the optimal separating hyperplane to divide two or more classes of data with the learning mechanism by training the input data. It is a type of supervised learning to predict and classify items in the field of data mining. SVM is prone to overfitting but performs well on noisy financial fraud data [
21].
Classification and regression tree (CART) is a binary decision tree technique used for continuous data or non-parametric data for classification. The decision of dividing conditions is based on the quantity and attributes of the data, as well as the Gini index. Each division separates the data into two subsets, and the process is repeated for each subset to identify the next dividing conditions. Data continue to be divided into two subsets in order to construct a tree structure. The process is finished when data is no longer divisible.
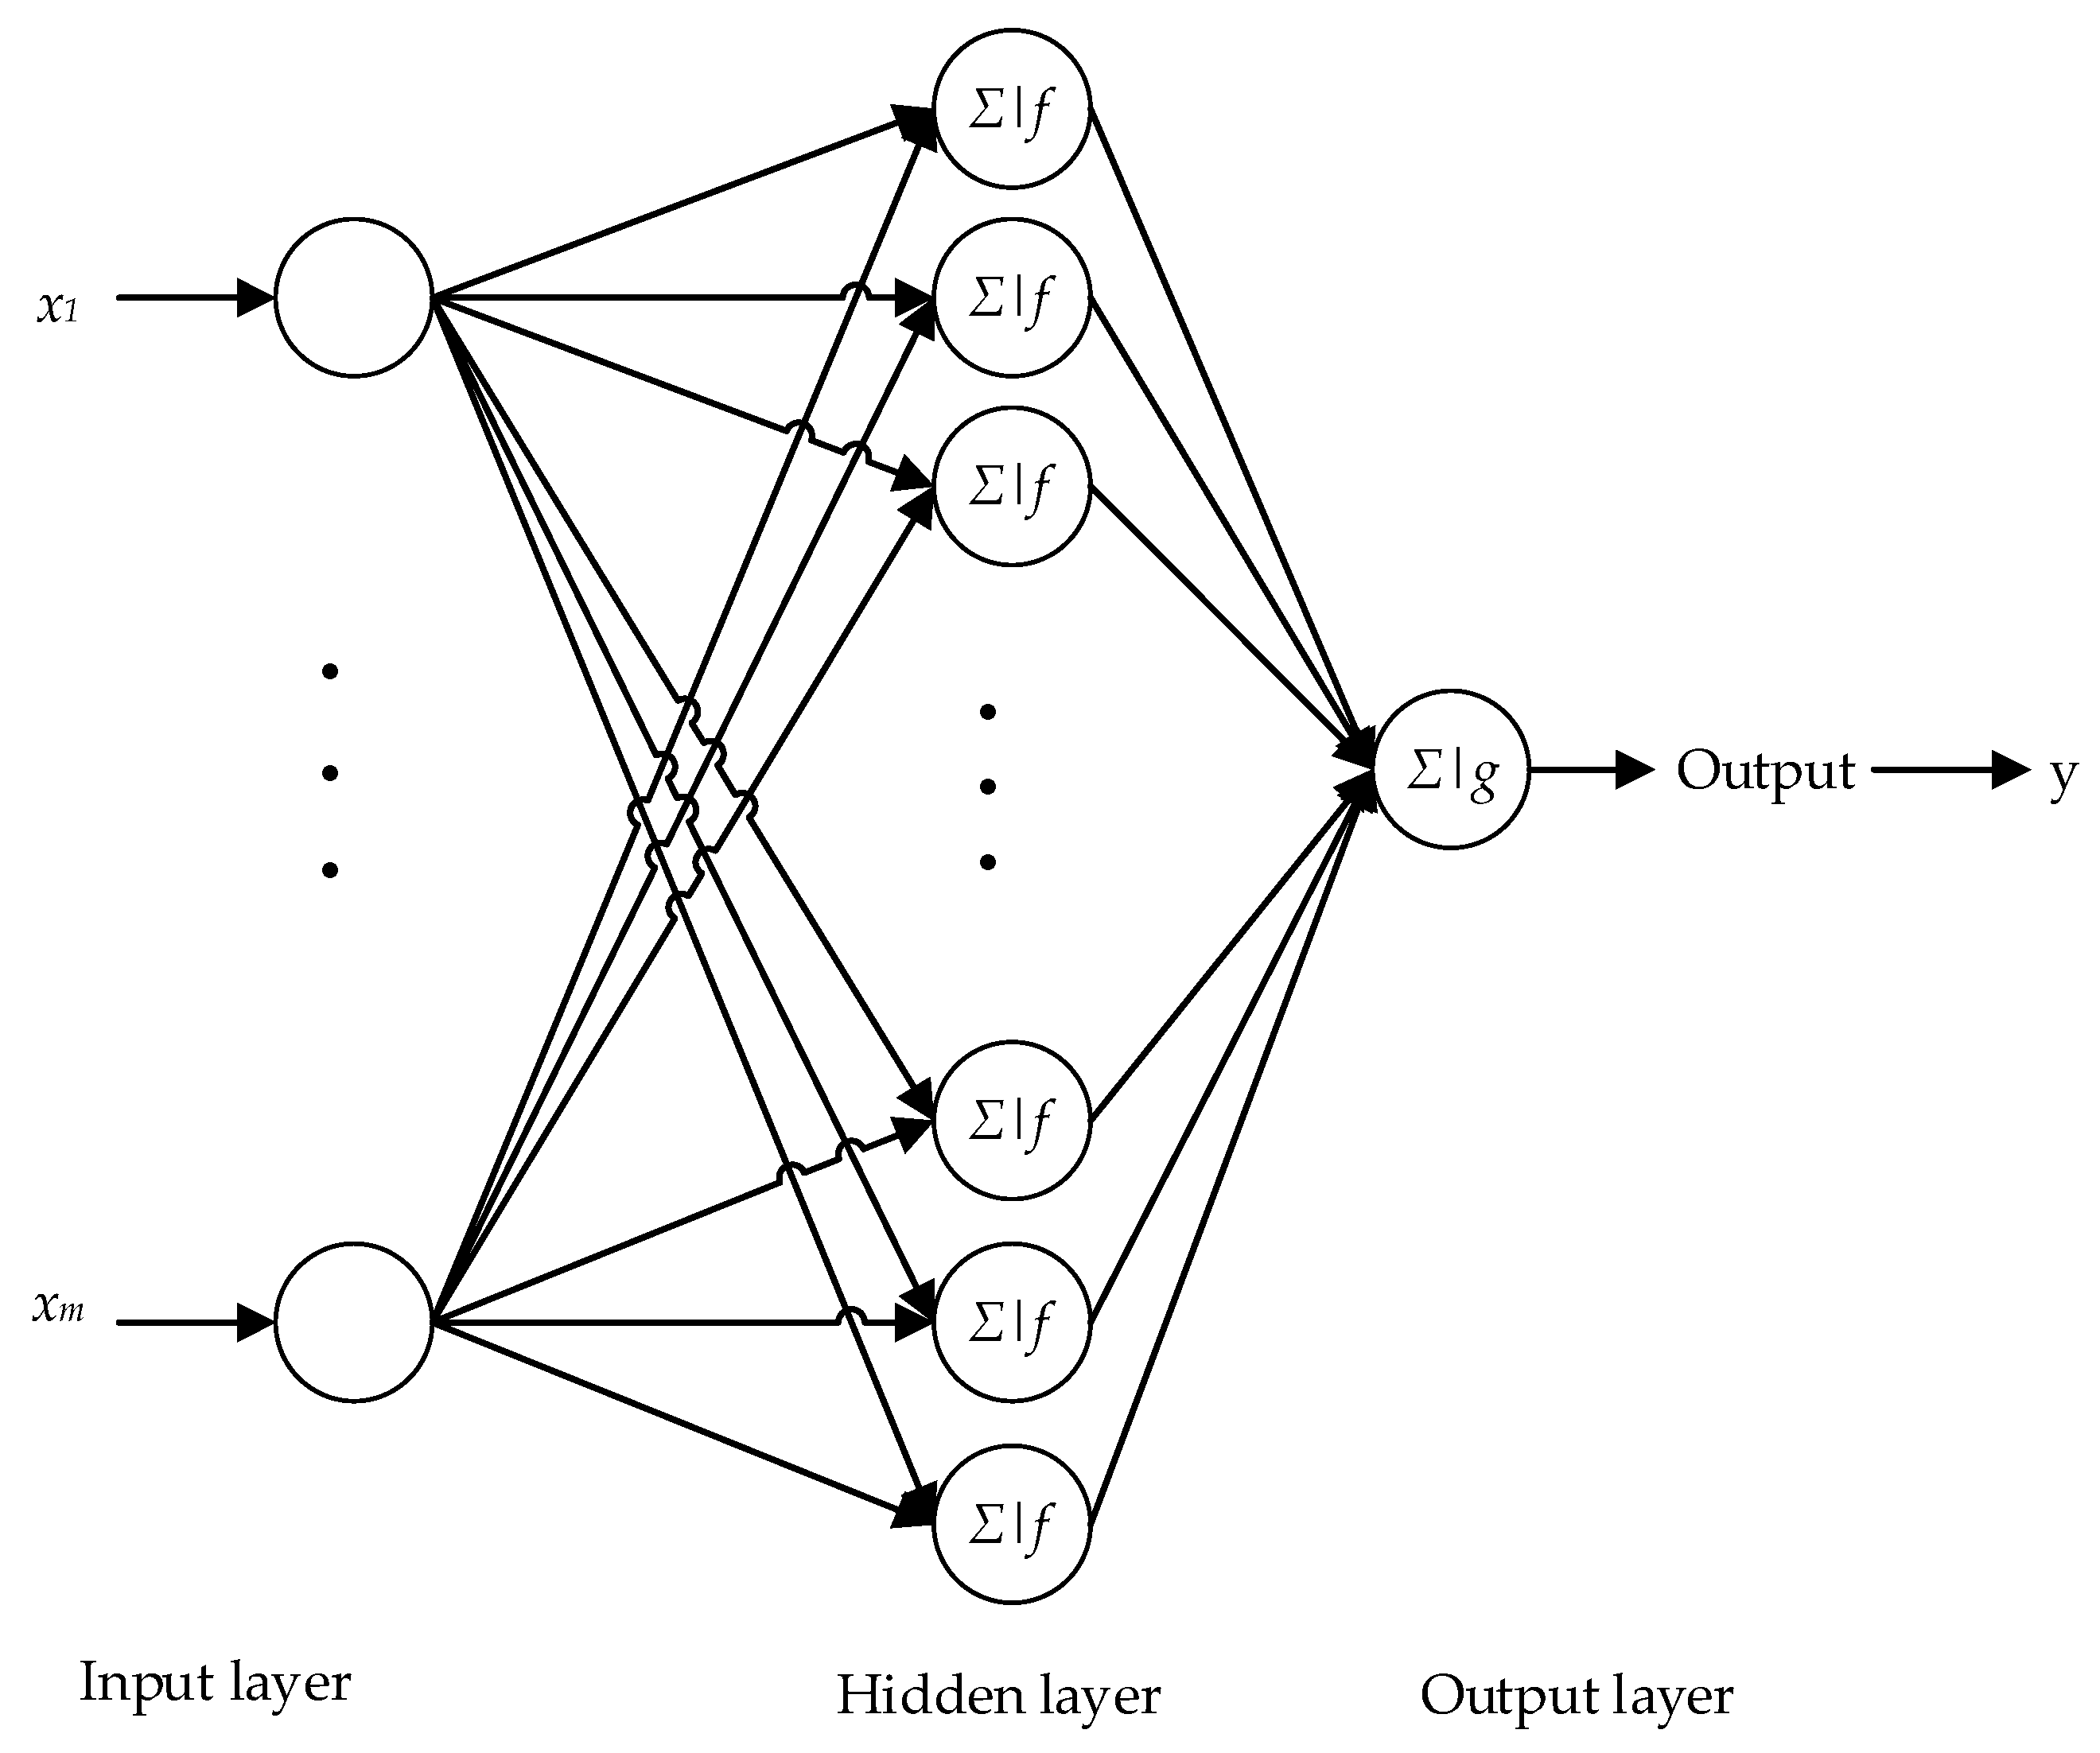
Neural networks derived from the modeling of the human brain and display good performance in signal restoration. Back propagation (BP) is a common method of training artificial neural network to minimize the objective function, which is a supervised learning method. It requires making up the training set for a dataset with many inputs.
Figure 1 is a classical back propagation neural network (BP-NN) architecture containing the input layer, hidden layer, and output layer, which has one output, m inputs, and n neurons in the hidden layer.
Logistic regression (LR) is used to deal with regression problems where the dependent variable is a classification variable. According to Williams et al. [
22], LR is a commonly used approach for performing binary classification. The advantage of the LR is its computation which is not expensive and it is easy to understand and implement. However, its outcome is easily under-fitted and the classification accuracy is not always high.
The Bayes classifier is a popular classification algorithm used extensively in financial fraud detection. Its design method is one of the most basic statistical classification methods. The classification principle is to calculate the posterior probability by using the Bayesian formula through the prior probability of an object, that is, the probability that the object belongs to a certain class and selecting the class with the largest posterior probability as the class to which the object belongs.
The K-nearest neighbor (KNN) method computes the class label for the test samples by the labels of the k nearest neighbors of the test samples. The KNN method is only relevant to a very small number of adjacent samples in class decision making. Since the KNN method mainly relies on the surrounding limited samples, rather than relying on the discriminant domain method to determine the category, the KNN method is more suitable for the cross-over or overlapping sample sets of the class domain.
2.2. Dimensionality Reduction Methods in FFS Detection
The accuracy can be improved significantly by screening out those variables which have the greater effect in detecting FFS [
1]. In the field of detection FFS, dimensionality reduction methods are often used to screen out those variables. So, we summarized the dimensionality reduction methods used in these 19 articles. First of all, we found that 14 articles adopted the dimensionality reduction methods and the other five articles did not use these techniques. It can be seen that the use of dimensionality reduction methods is the mainstream in detecting FFS. Secondly, we further summarized the specific dimensionality reduction methods used in these articles, which are shown in
Table 3. Obviously, every article either selected a feature selection technique or a feature transformation technique. Few articles used two categories of dimensionality reduction methods at the same time to make a comparative analysis. In order to address this research gap, we selected the stepwise regression method and PCA method, which are good representatives of the two categories of dimensionality reduction methods, to analyze which type of method is more suitable for fraud detection.
The stepwise regression method is based on the assumption that under linear conditions, the variable combinations that can account for more dependent variable variation are retained. There are three specific methods of stepwise regression: (1) Forward selection. First, there is only one independent variable that can explain the largest variation of the dependent variable. Next, another independent variable is added to see if the variation in the dependent variable can be significantly explained. This process is iterative until there is no independent variable that meets the conditions for joining the model; (2) Backward elimination. First, all independent variables are put into the model. Then, one of the independent variables is removed to see if the entire model still interprets the variation in the dependent variable significantly. This process is iterative until there is no independent variable that meets the culling conditions; and (3) Bi-directional elimination. This method is equivalent to combining the methods of forward selection and backward elimination. This method does not blindly increase independent variables or eliminate independent variables. Instead, after adding an independent variable, it tests all the independent variables in the whole model and then eliminates the independent variables to get an optimal combination of variables. So, we selected the bi-directional elimination method.
Principal component analysis (PCA) is a data dimensionality reduction method for continuous attributes. It constructs an orthogonal transformation of the original data. The base of the new space removes the correlation of the data under the original spatial base and only a few new variables can be used to explain most of the variation in the raw data. These new variables are called principal components. The calculation steps of PCA are as follows:
- Step 1.
Let
n times observed data matrix of the original variables
X1,
X2, …,
Xp be:
- Step 2.
The data matrix is centrally standardized by column. For convenience, the standardized data is still recorded as X.
- Step 3.
Calculate the correlation coefficient matrix
, the definition of
is as follows: (
=
):
- Step 4.
Calculate eigenvalue: .
- Step 5.
Determine the number of principal components
m:
α is determined according to the actual problem, generally taking 80%.
- Step 6.
Calculate corresponding unit eigenvectors:
- Step 7.
Calculate principal components:
2.3. Data and Experimental Setting
2.3.1. Data Sources
The academic community has developed two main definitions of financial statement fraud: first, the Securities Regulatory Commission (SRC) administrative penalty announcements; and second, the audit opinion in the audit report. Among these, the method of defining fraud according to the SRC’s administrative penalty announcements has been accepted by most scholars. The advantage of this method is that the fraud samples obtained have true fraud. However, the drawback is that the number of fraud samples that can be obtained is often relatively small. Meanwhile, according to the audit opinion in the audit report, the number of fraud samples that can be obtained is often relatively large, however, this method of definition is not reliable. Due to the existence of commercial buyouts and collusion, there are few audit reports that clearly indicate the existence of fraud in financial statements. At the same time, the financial statements that get “standard unqualified” audit opinions are not necessarily true.
In view of the fact that the purpose of this paper is to identify truly fraudulent financial statements (FFS), we chose the method of defining fraud according to the SRC’s administrative penalty announcements. Therefore, the fraudulent companies in this paper are the companies punished by the China Securities Regulatory Commission (CSRC) for violating financial statement disclosure standards.
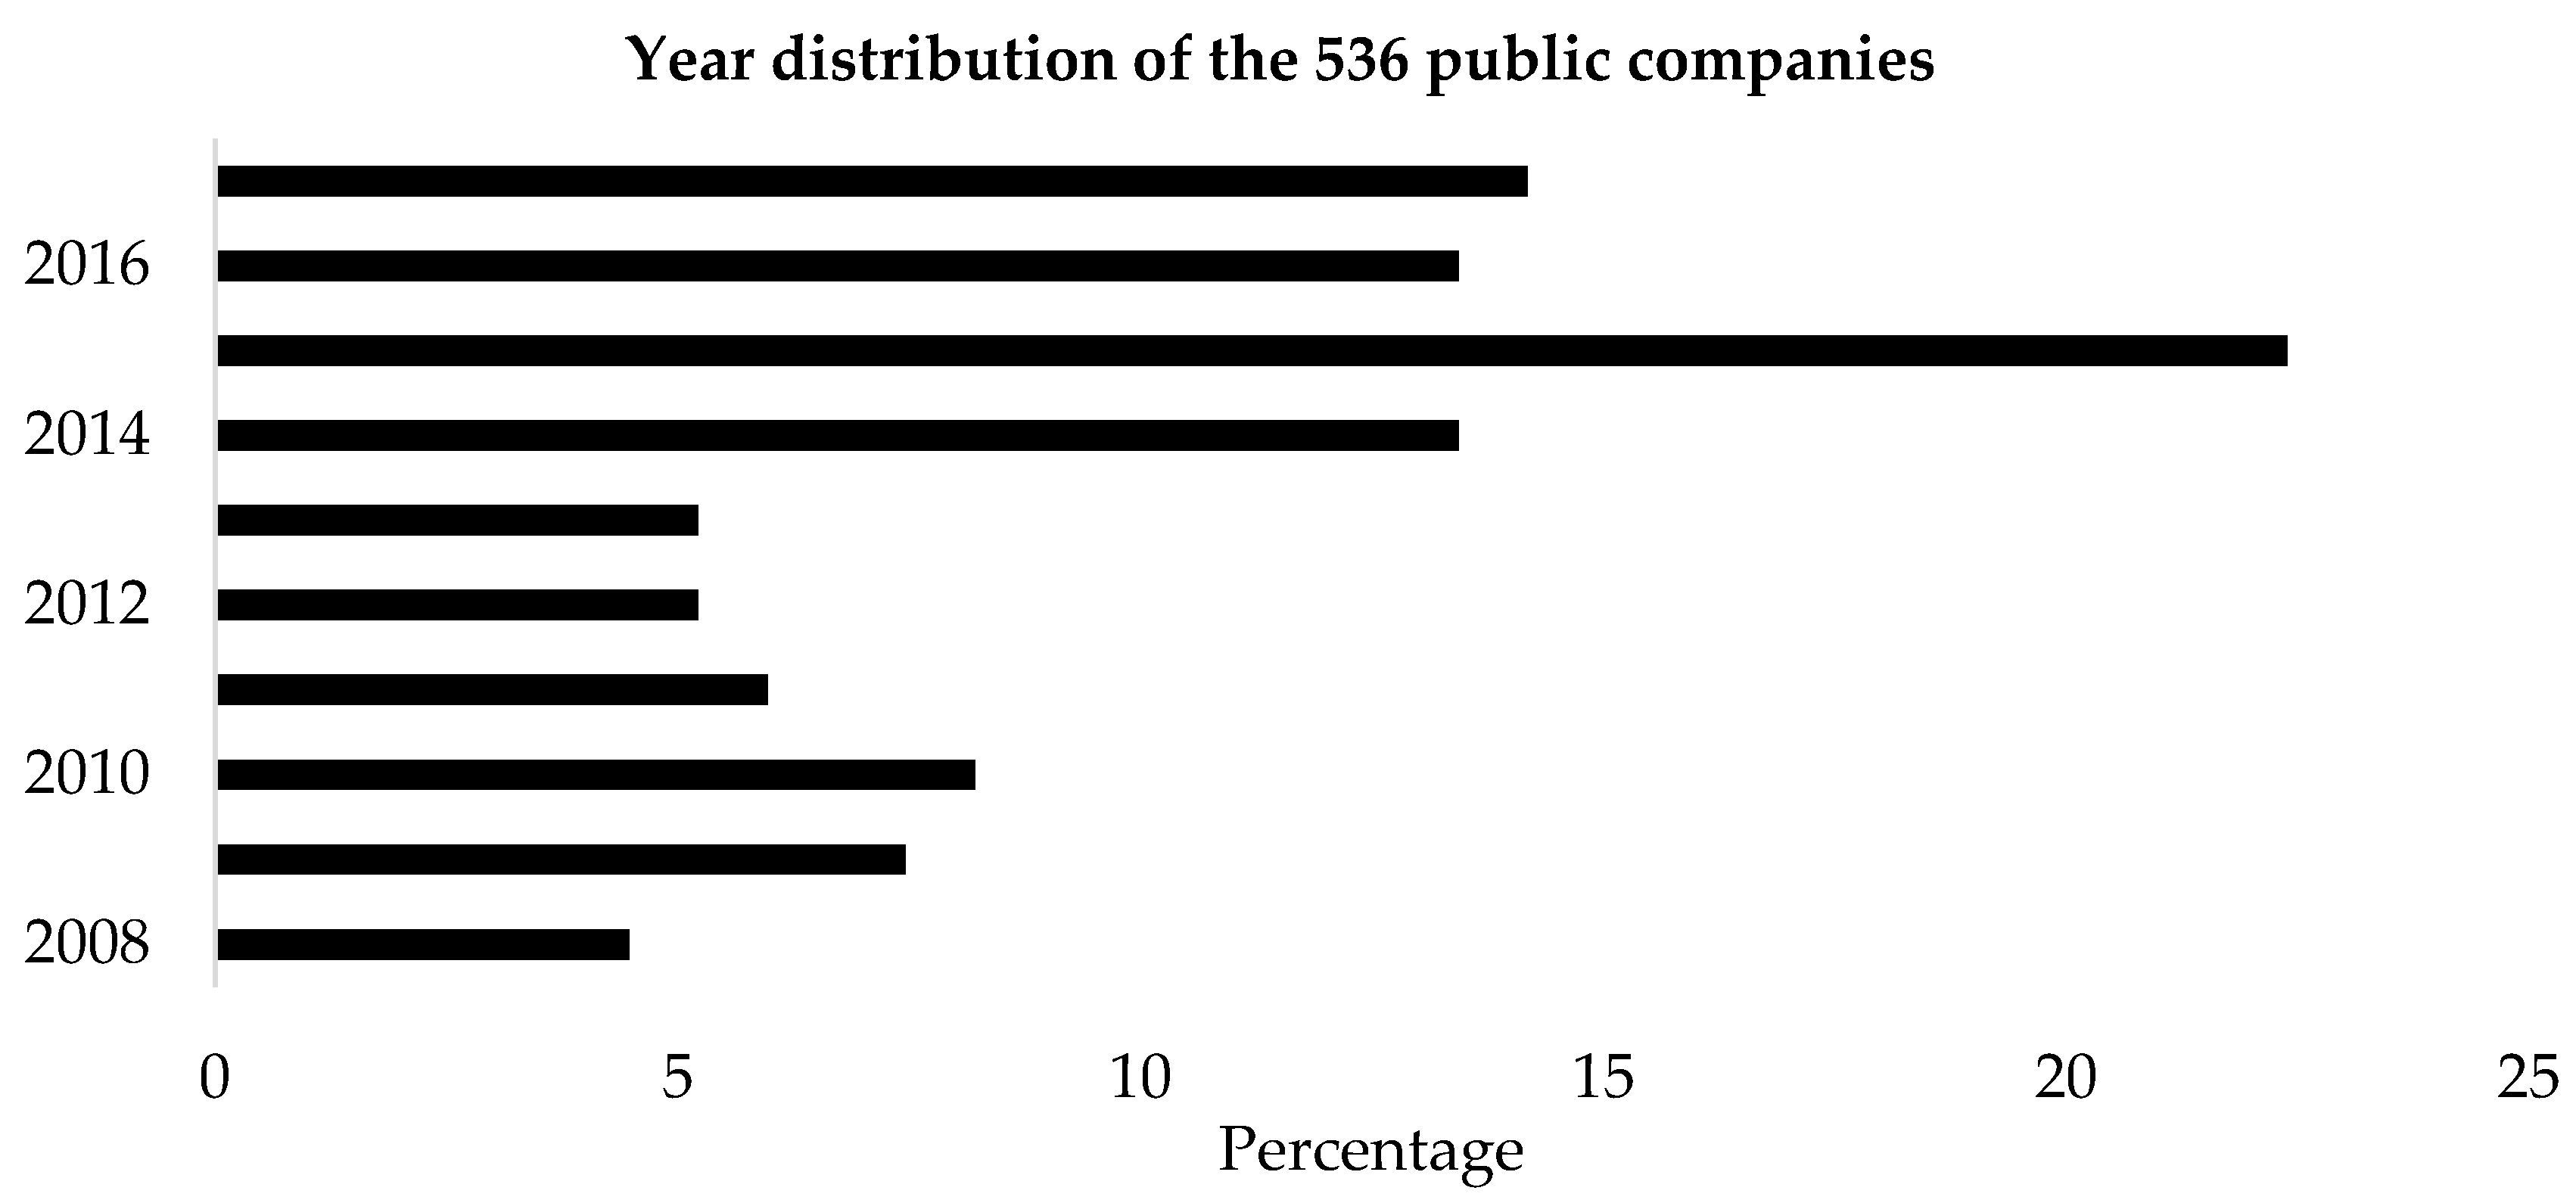
We identified a total of 134 public companies involved in alleged instances of fraudulent financial statements (FFS) during the period 2008–2017 from the Wind database. They are all listed companies in the Shanghai Stock Exchange and Shenzhen Stock Exchange. To obtain a matched sample of non-fraudulent firms, we identified 402 firms with the same scale of total assets (±10%), same industry (industry standard of CSRC) and the same year with a matching ratio of 1:3 [
7]. The industry and year distribution of these 536 public companies are shown in
Table 4 and
Figure 2.
From
Table 4, we can see that nearly half of the companies are in the manufacturing industry, which may result from the fact that the proportion of manufacturing companies to all public companies itself is large. From
Figure 2, we see that the year the fraud occurred is concentrated in 2014–2017, which accounts for more than 50 percent.
2.3.2. Variables Selection
According to existing research, both financial variables and non-financial variables have a relationship with fraudulent financial statements (FFS). Thus, we selected financial variables and non-financial variables from the Wind database to detect the FFS. All variables were extracted from the annual consolidated financial statements.
• Financial Variables
In this paper, financial variables were selected to detect FFS and the chosen set of financial variables cover most aspects of a firm’s financial performance in order to detect various kinds of FFS. Previous literature has provided strong theoretical evidence for the use of financial variables [
23]. Our selection of the financial variables listed in
Table 5 was therefore influenced by previous FFS detection studies. The financial variables selected can be divided into five categories: (1) Z-score, a comprehensive financial indicator used to predict the financial distress of a company proposed by Altman [
2]; (2) profitability indicators; (3) solvency indicators; (4) operation indicators; and (5) growth indicators.
• Non-Financial Variables
In order to effectively detect FFS, it is necessary to use not just financial variables but also non-financial variables that have been found to have some predictability in detecting FFS. Researchers have found that non-financial variables (e.g., low proportions of outside members on the board of directors) may signal the presence of possible accounting manipulation [
8]. So, in this paper, seven non-financial variables were selected that reflect a company’s management structure, internal control, shareholders structure and external audit. Our selection of the non-financial variables is listed in
Table 6.
2.3.3. Descriptive Statistics of the Data
In this paper, we collected the financial and non-financial variables from the Wind database. For the imputation of the missing values, we used the “mean value” to estimate the missing values, and we also dealt with the outliers by using the “mean value”.
Table 7 shows the basic descriptive statistics of the samples. The most striking result to emerge from the data is that fraudulent firms showed a higher debt-asset ratio (DAR), a lower total asset turnover (TAT), a lower current asset turnover (CAT) and a lower shareholding ratio for the largest shareholder (Top1). In
Table 7, the Big4 line represents the number of firms audited by the Big 4 accounting firms or not (the number of companies not audited by the Big4 accounting firms is on the left of the colon and the number of companies audited by the Big4 is on the right of the colon). The Aud_rep line represents the number of firms that got a qualified opinion or not (the number of companies who got an unqualified opinion is on the left of the colon and the number of companies who got a qualified opinion is on the right of the colon).
2.3.4. Experimental Setting
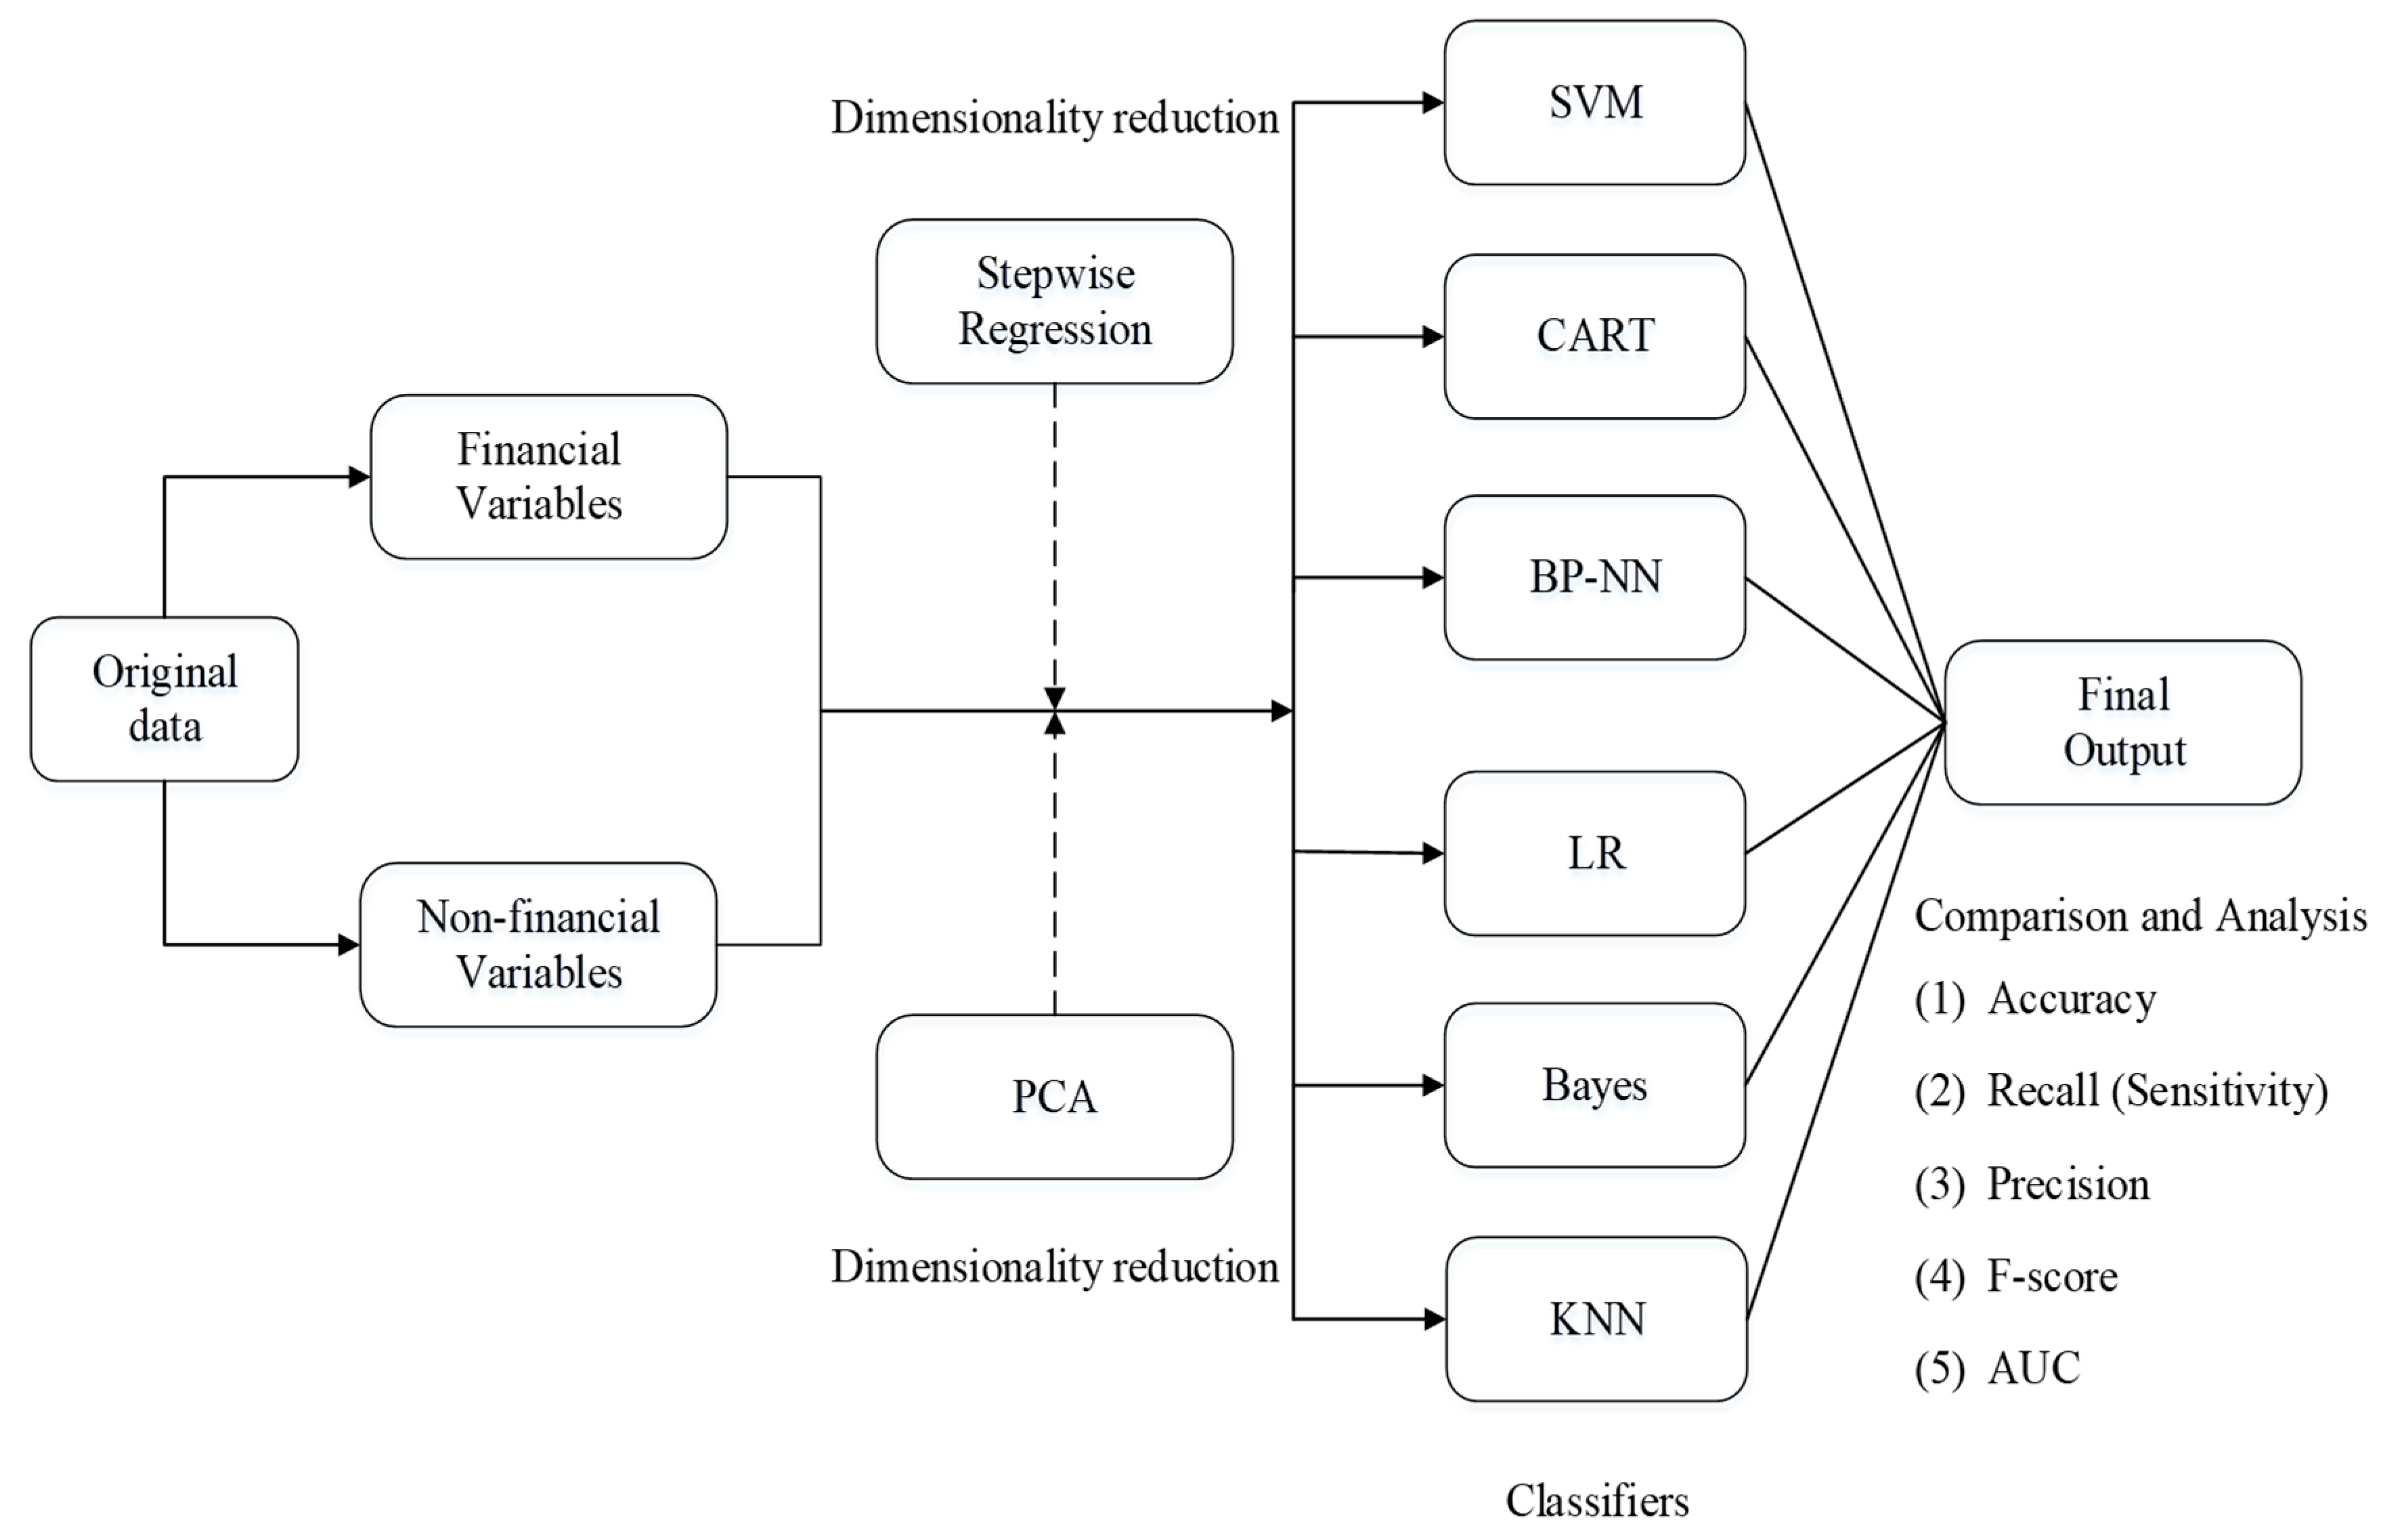
The experimental setting used in this study is shown in
Figure 3. In order to eliminate the influence of the dimensional differences between different variables on the experiment, we implemented the “zero-mean” normalization process and normalized each of the independent variables from the original dataset during the data preprocessing stage. Also, we randomly created 10 stratified samples from the normalized dataset in which a 7:3 ratio was followed for training (376 firms in total, 188 fraudulent and 188 non-fraudulent) and testing data (160 firms in total, 80 fraudulent and 80 non-fraudulent). Furthermore, ten-fold cross-validation is performed to improve the reliability of the results. Then, we analyzed the normalized dataset using six data mining techniques including SVM, CART, BP-NN, LR, Bayes, KNN. We chose these six techniques not only because they were used frequently in prior studies, but also because they have varied backgrounds and different theories to support them. So, we ensured that the problem of detecting FFS was studied and analyzed comprehensively from all perspectives.
Next, we performed dimensionality reduction on the normalized dataset to identify the most significant variables that could detect the presence of financial statement fraud. We used the stepwise regression method and the PCA method to reduce the dimensionality of the dataset. The stepwise regression method is a feature selection technique and PCA is a feature transformation technique. This process resulted in new combinations such as stepwise regression-SVM, stepwise regression-CART, stepwise regression-BP-NN, stepwise regression-LR, stepwise regression-Bayes, stepwise regression-KNN, PCA-SVM, PCA-CART, PCA-BP-NN, PCA-LR, PCA-Bayes, and PCA-KNN.
Finally, we compared and analyzed the performance of the six data mining techniques with: (1) an all normalized dataset without dimensionality reduction; (2) a selected dataset by stepwise regression; and (3) a transformed dataset by PCA. The performance metrics are accuracy, recall (sensitivity), precision, F-score and area under the receiver operating characteristic curve (AUC).
• Performance Metrics
Financial statement fraud detection represents a binary classification problem with four possible classification outcomes [
24]: (1) true positive (a non-fraud firm correctly classified as a non-fraud firm); (2) false negative (a non-fraud firm incorrectly classified as a fraud firm); (3) true negative (a fraud firm correctly classified as a fraud firm); and (4) false positive (a fraud firm incorrectly classified as a non-fraud firm).
Classification performance can be measured in many different ways: absolute ability, performance relative to other factors, probability of success, and others [
25]. In this paper we adopted accuracy, recall (sensitivity), precision, F-score and the area under the receiver operating characteristic curve (AUC). They are described in
Table 8.
4. Discussion
Financial statement fraud not only causes huge losses for investors, but also creates a crisis of distrust in accounting firms. Furthermore, it puts the company’s financial situation in a vicious cycle that reduces the long-term sustainable development of the whole socio-economy [
1]. Therefore, detection of fraudulent financial statements plays an important role in enhancing sustainability of the socio-economy in China. This study adopted a multi-analytic method and integrated multi-source variables to detect fraudulent financial statements of listed companies in China. Some interesting findings are provided in this study.
Our experimental results can be divided into three parts. Part 1: We found that the SVM classifier performs most outstandingly when there are 24 input variables and the accuracy is 0.8063. The accuracy of the other classifiers is 0.7438, 0.7313, 0.8000, 0.7313 and 0.7813. Part 2: Thirteen significant original variables were selected by using the stepwise regression feature selection technique. They are ROE, ROA, NPS, DAR, CR_2, FAT, CAT, ART, EPS-growth, NP-growth, Num_dir, Top1 and Top10. We found that these variables cover the four aspects of financial variables and non-financial variables. In addition, the accuracy of the classification of financial statements can be further improved by using the 13 input variables selected by the stepwise regression method compared to the 24 input variables used. Moreover, the performance of the SVM classifier is the most outstanding. Part 3: After using the PCA method to transform the original 24 input variables, we selected the first 16 principal components based on previous studies. They can explain 95.67% of the original input variables. These principal components do not have a linear relationship. However, we found that the results of using these 16 principal components to classify financial statements are not satisfactory. The accuracy of almost all classifiers decreased compared to classifiers that use 24 input variables. Overall, the experimental results based on accuracy and F-score indicated that SVM is the top performer and the classification performance is improved more by stepwise regression rather than PCA.
This study has several theoretical implications. First, traditional statistical analysis methods for the detection of fraudulent financial statements are mostly flawed in terms of strict hypotheses and detection results [
2,
3]. Many previous studies using data mining techniques also have problems, such as the insufficient selection of predictors. In addition, most of the past fraud detection studies were not conducted in China [
10,
11]. Therefore, the results obtained from these studies cannot be directly used in China because of different cultural and socio-economic contexts. This paper adopted a multi-analytic method to detect fraudulent financial statements from listed companies in China, which is a study specifically for China’s emerging capital market. Second, we made a comparative analysis of six data mining techniques in our study. The dataset consisting of 536 Chinese companies was analyzed using stand-alone techniques like SVM, CART, BP-NN, LR, Bayes and KNN. Moreover, 17 financial variables and 7 non-financial variables constitute the original feature set. The selected 24 variables comprehensively reflect the various aspects of a company, including financial distress, profitability, solvency, operational capability, development capability, management structure, internal control, shareholder structure and external audit. This is the second main strength that should be highlighted. Then, stepwise regression and PCA were used for dimensionality reduction, in which stepwise regression represents the feature selection technique and PCA represents the feature transformation technique. Then 13 significant original variables were selected with stepwise regression and 16 principal components were transformed with PCA. With the reduced feature subset, the classifiers SVM, CART, BP-NN, LR, Bayes and KNN were invoked again. We are not aware of much research that has also compared two different types of dimensionality reduction methods in financial statement fraud detection, however, such comparative analysis will help us to more accurately select the dimensionality reduction method for fraud detection in the future, thereby improving the efficiency of detection. This is the third main strength in this paper. Finally, we compared and analyzed the classification performance of six data mining techniques with different input variables based on five performance metrics, which are accuracy, recall (sensitivity), precision, F-score and area under the receiver operating characteristic curve (AUC).
This study highlights some practical implications for auditors, investors, and so on. First, detection of fraudulent financial statements is extremely important as it can save huge amounts of money from being embezzled. Our study is an important step in that direction and it highlights the use of data mining for solving this serious problem In our study, the combination of SVM and stepwise regression was found to be a good model for detecting FFS, with a classification of 0.8250. This optimal model could be of assistance to auditors, both internal and external, by saving a lot of audit time. Second, the use of the proposed multi-analytic approach also could be applied to the tax authorities or other government regulatory agencies, individual and institutional investors, stock exchange markets, law firms, credit scoring agencies and banking systems.
There are still shortcomings in this study. First, this study did not cover overall companies that listed in the Shanghai Stock Exchange and Shenzhen Stock Exchange. Future studies are thus encouraged to collect more sample to retest our model. In addition, the proposed multi-analytic approach in this paper may also require some necessary modification when it is applied to other countries or regions. Finally, there are more classification algorithms in the field of data mining than the six mentioned in the article. So, future studies could use other ensemble learning methods such as the random forest to predict FFS.


