Article

Can There be Water Scarcity with Abundance of Water? Analyzing Water Stress during a Severe Drought in Finland

1
Finnish Environment Institute, Latokartanonkaari 11, 00790 Helsinki, Finland
2
Water & Development Research Group, Aalto University, 02015 Espoo, Finland
*
Author to whom correspondence should be addressed.
Sustainability 2019, 11(6), 1548; https://doi.org/10.3390/su11061548
Submission received: 5 February 2019 / Revised: 7 March 2019 / Accepted: 9 March 2019 / Published: 14 March 2019

Abstract

:
Severe droughts can affect water security even in countries with ample water resources. In addition, droughts are estimated to become more frequent in several regions due to changing climate. Drought affects many socio-economic sectors (e.g., agriculture, water supply, and industry), as it did in 2018 in Finland. Understanding the basin-wide picture is crucial in drought management planning. To identify vulnerable and water stressed areas in Finland, a water use-to-availability analysis was executed with a reference drought. Water stress was analyzed with the Water Depletion Index WDI. The analysis was executed using national water permits and databases. To represent a severe but realistic drought event, we modelled discharges and runoffs from the worst drought of the last century in Finland (1939–1942). The potential for performing similar analyses in data scarce contexts was also tested using estimates from global models as a screening tool. The results show that the South and Southwest of Finland would have problems with water availability during a severe drought. The most vulnerable areas would benefit from drought mitigation measures and management plans. These measures could be incorporated into the EU River Basin Management Plans.

1. Introduction

We investigate whether water availability would be limited for agriculture, industry, and water supply during a severe drought in Finland, which is famous for its ample water resources. Possible drought impacts, policy, and mitigation measures for water security, food security, society, and the environment (including water quality) are discussed. The analysis contributes to the discussion about water scarcity. Water scarcity is a man-made problem resulting from insufficient water availability to meet the demands of water users. Physical water scarcity is typically distinguished from economic scarcity, where the former counts water availability in terms of every drop available within a region, whereas the latter explicitly assesses whether the socio-economic system is able to mobilize that water for use. Physical water scarcity is itself a multi-facetted issue, including water shortage (population-driven scarcity, i.e., low water availability per person) and water stress (demand-driven scarcity, i.e., high water use divided by water availability) [1]. Drought, on the other, is a natural phenomenon, which reduces available water resources for months or years. Our analysis focuses on water stress during a severe prolonged drought.
Drought affects local and national water security. Water security is an emerging and increasingly dominant concept in both research and policy-making [2,3,4,5]. While its definitions are numerous, the key is that water security emphasizes the importance of water simultaneously for local and national security and sustainability, including the societal resilience to environmental impacts and water-borne diseases [6]. For this analysis we use the definition by UN-water [6], which notes the importance of water-related disasters, e.g., droughts. The linkages between water, food, and energy security have recently been the subject of intensive research, both globally as well as in Finland, most prominently under the so-called nexus paradigm [7,8,9,10]. Additionally, Sustainable Development Goal 6 (SDG6) is very much linked to water security. Thus, by increasing water security, one promotes the SDG6 targets also. However, there are some gaps and limitations raised related to the indices and implementation of SDG6 [11,12].
Many nations globally and in Europe strive to assess and mitigate drought risks [13]. In contrast to many other European countries, Finland does not have national or local drought mitigation plans [14]. Finland, with 187,888 lakes, is a country with plentiful fresh water resources. This is probably why drought in Finland has gained less attention. However, drought can affect the water security of the country via many sectors directly and indirectly. While severe inter-annual droughts can cause significant damage in Finland [15,16], drought risk mitigation has gained little attention thus far. In addition, climate change might increase the frequency and severity of droughts in some parts of Scandinavia, especially during summer [17], yet water use during drought has not been analyzed comprehensively on a basin level in Finland. The only recent larger drought study was carried out in 2004 [15], focusing on the impacts of the drought in 2002–2003. The impacts during the drought in 2018 were even greater [18] and the government agreed on an €86.5 million aid package for the agriculture sector, though without a comprehensive study of the impacts. Water supply companies and large water intensive industries have individual risk plans that usually include water shortages, but a basin wide, multi-sectoral view of drought impacts and water usage during drought is missing. However, a basin level analysis is crucial for the comprehension of drought related water security risks and implementation of mitigation measures [19].
Several different water availability and water stress indices exist [20,21,22]. Most indices use global estimations for consumptive water use (withdrawals subtracted with returned waters) or just withdrawals with annual or monthly time-steps [23]. Water use-to-resource threshold ratios have also been used, though the correct levels are debatable and case specific [20,22,24,25]. Despite some challenges with these indices, they tend to be useful in indicating possible problem areas that might require more detailed studies [26].
To indicate possible problem areas in Finland, we developed a method for the diagnosis of water stress to key water use sectors at the basin and sub-basin scale. The method involves comparing consumptive water use to water availability during a reference drought with the Water Depletion Index (WDI) [24]. The method also identifies basins and sectors that use large amounts of water, and reflects on how the results affect water security nationwide. In addition, a comparison between local statistical data and open-source globally modeled data is conducted and the differences are scrutinized to evaluate the potential for applying the method in data scarce contexts.

2. Materials and Methods

We assess drought vulnerability and water availability in Finland during a severe drought with the Water Depletion Index (WDI) [24]. Severe drought is used as a reference drought during which consumptive water use is compared against water availability at the sub-basin level. The index was calculated with statistical national water use data and compared with estimates from several global models from the Inter-Sectoral Impact Model Intercomparison Project (ISI-MIP) [27]. The steps of the analysis are briefly presented in Figure 1. This section introduces the study area followed by methods and data. Lastly, the comparison between local datasets and globally modelled data is explained.

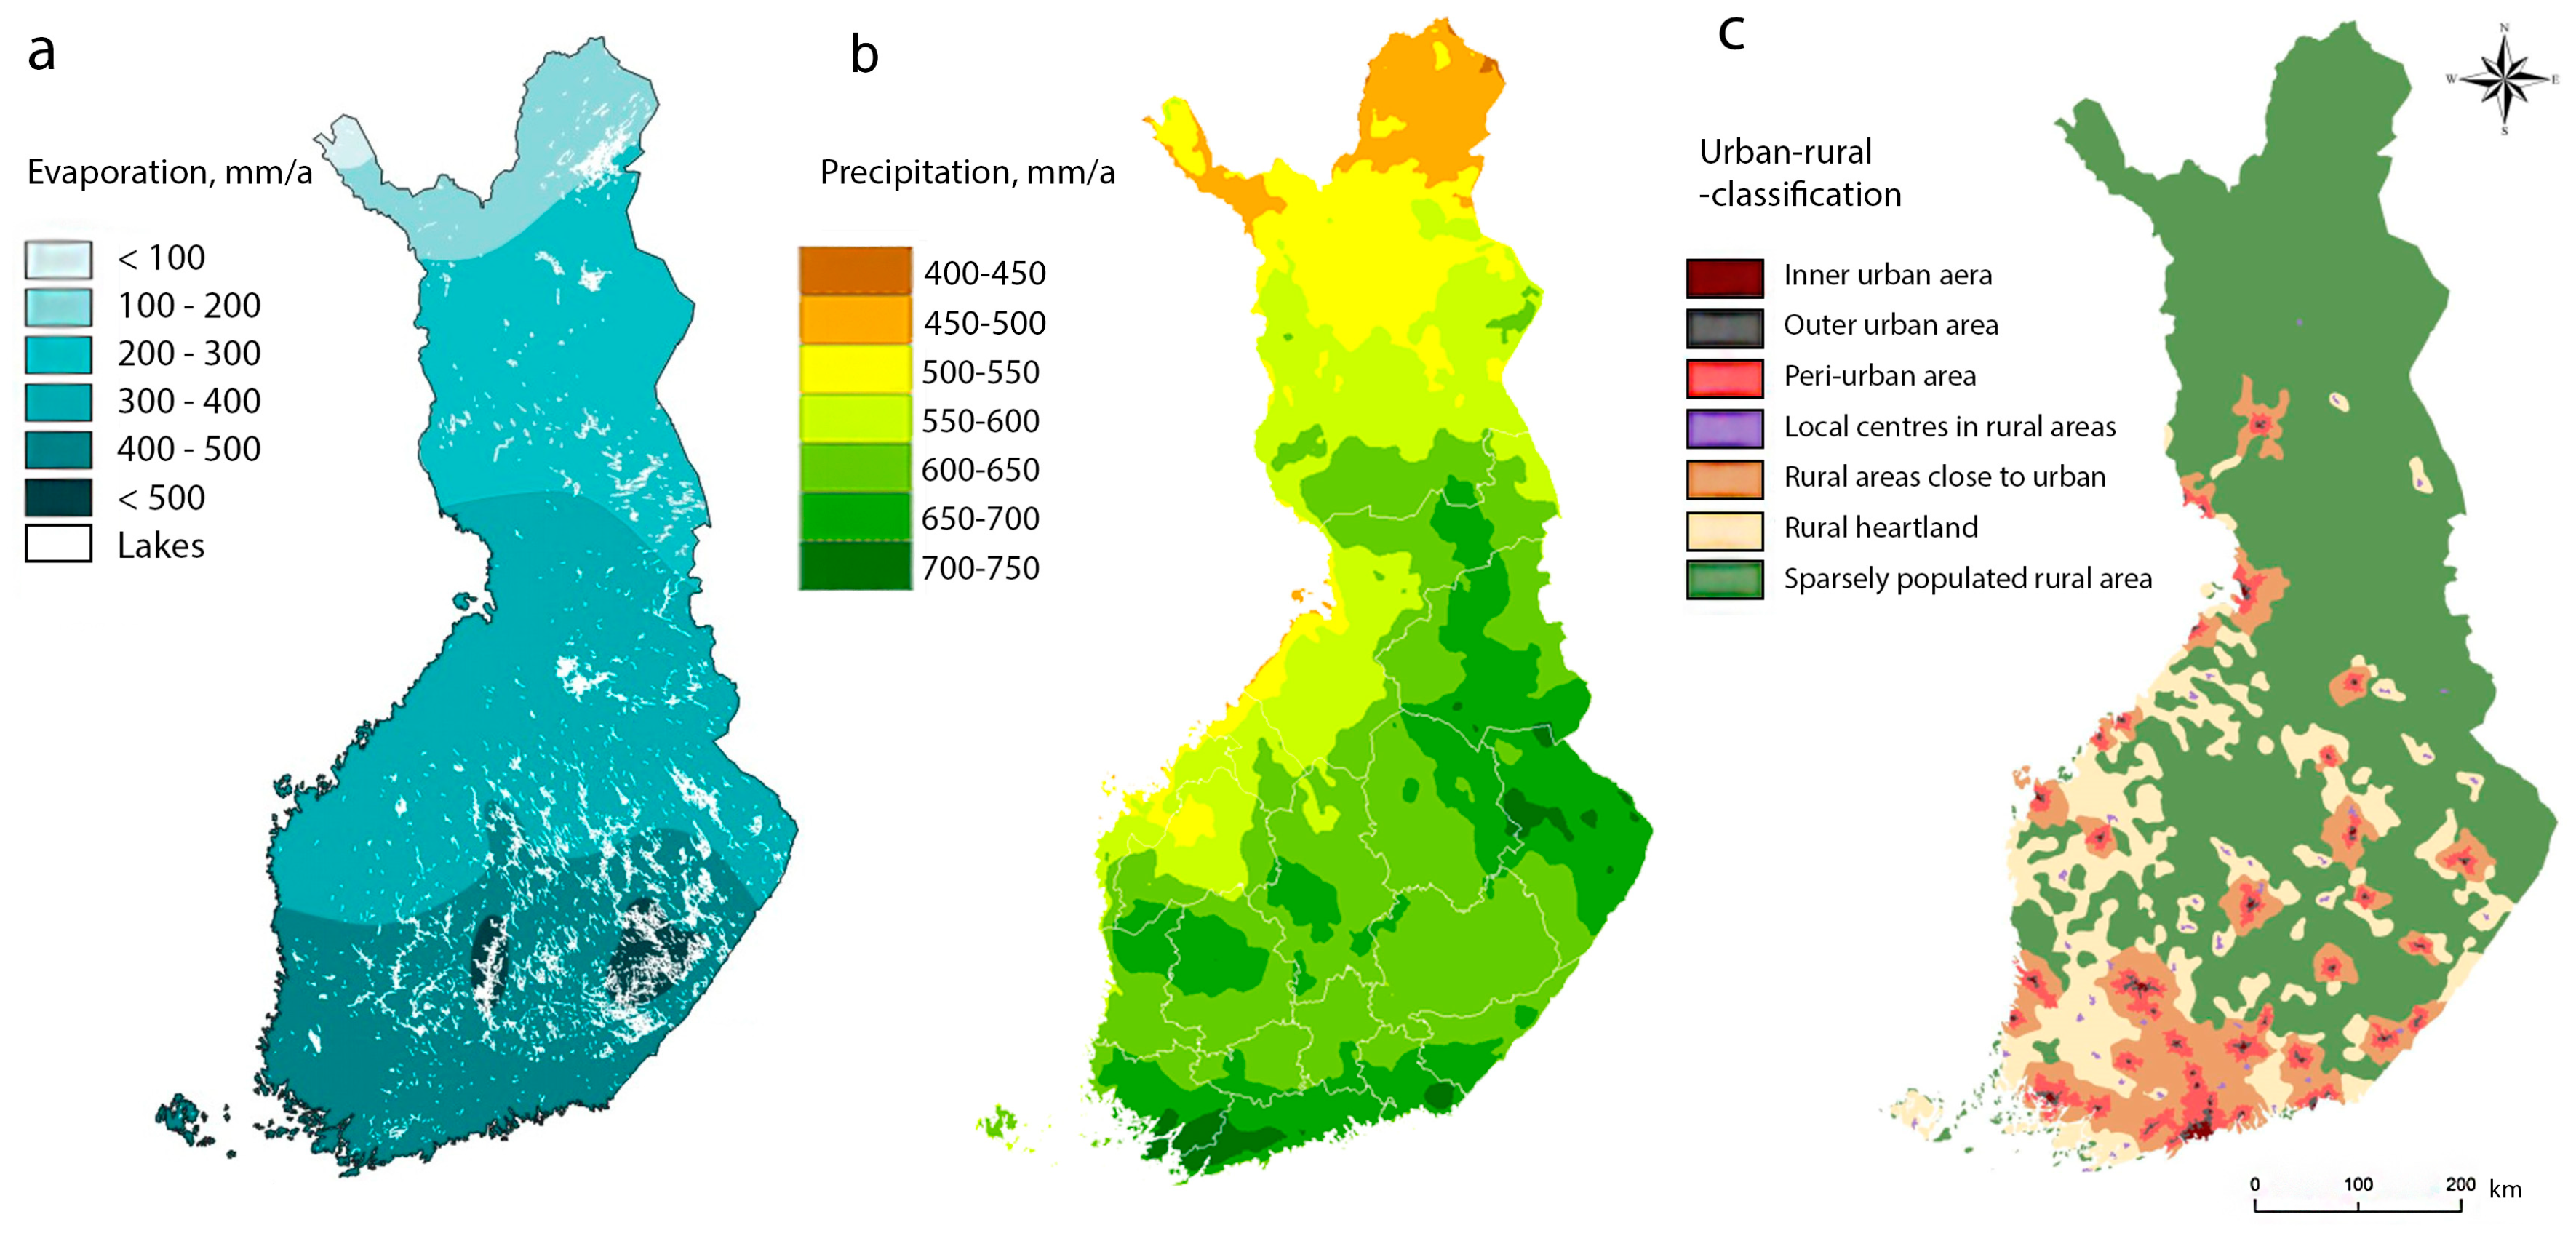
2.1. Study Area: Finland

Finland has ample water resources. Due to its northerly location next to the Baltic Sea, the climate is cold and humid, with moderate precipitation (450–700 mm annually) and evaporation (200–450 mm annually) (see Figure 2). The country has four distinct seasons, but no dry season. Large amounts of lakes and forest areas decrease the hydrological variability [28]. Long-term meteorological droughts are rare, due to the prevailing moist westerly winds. In addition, periods of no precipitation are relatively short. Thus, a drought in Finland does not mean that there is no precipitation; it just rains noticeably less than average.
The majority of the lakes are situated in the inner parts of the country, whereas the population is concentrated in the coastal areas in the south and southwest, where the basins and rivers are smaller. Most small basins have only a few lakes, making them hydrologically more variable than the large basins with large lakes, thus increasing the vulnerability to droughts. The amount of lakes and lake-percentage (ratio of lake area to total basin area) varies substantially between basins (from 0.03% to 20%). Finland’s lakes are numerous but shallow by character, with an average depth of less than 7 meters. One third of the lake area (more than 330 lakes) and most of the large lakes are regulated with dams at the outlet [29]. The main purposes of regulation are hydropower production and flood protection. Droughts are not usually explicitly considered in the regulation permits, but dams could provide help to drought management by regulating water levels and minimum flows. Finland’s groundwaters are local and shallow due to glacial erosion in the last ice age, thus increasing the vulnerability to drought [30]. Soils and fields in South and Southwest of Finland are former clayish seafloor, and particularly vulnerable to drought [31].
Finland is geographically a large country (338,424 km²) with a population of 5.5 million. Industry is the largest water user (66%) followed by domestic water use (22%). Irrigation accounts roughly only for 1–3% of the total water use. Of the total freshwater use, 41% is surface water, 42% is groundwater, and 17% is artificial groundwater [32]. Population is concentrated in South and Southwest Finland, and thus land and water use are more intensive in these areas due to more water utilities, agriculture, and industry. The drainage of fields, forests, wetlands, and peatlands has also intensified the drought effect by decreasing the water retention capability, and has worsened the water quality of lakes and rivers.

2.2. Water Depletion Index

Most water use-to-resource indices were designed for long-term water scarcity analyses on a national or basin scale (i.e., to find structural water overuse issues). The Water Depletion Index (WDI) developed by Brauman et al. in 2015 [24] was chosen for this study because it is one of the newest indices, created to assess also seasonal and dry-year water depletion at the sub-basin scale. The formula for WDI is as follows:
WDI = consumptive water use/(inflows + runoff generated within the sub-basin)
In this study, WDI was calculated at monthly temporal resolution for consumptive water use [22,23,36] on a sub-basin level. Basin and sub-basin scales are relevant for mitigation plans if they are incorporated in the River Basin Management Plans (RMBPs), as mandated by EU [19]. WDI uses consumptive water use instead of withdrawals, since Perry [37] suggested that using only withdrawals would overstate shortages.
Inflows and runoff were modelled using The Finnish Watershed Simulation and Forecasting System (WSFS) [38,39] developed by the Finnish Environment Institute. Groundwater recharges were taken into account in the modelled values (see Section 2.4). Desalination and non-renewable groundwater use are minuscule in Finland, and thus not accounted for in this analysis.
It is important to notice that water scarcity is complex and partly a socially constructed phenomenon. As has been noted by many scholars [40,41,42,43], water scarcity can be analyzed from different perspectives, ranging from hydrological assessments focusing on water quantities to economic, social, and political analyses considering institutional arrangements, interests, and politics related to the scarcity. This also means that technical understandings of water scarcity can hide the real causes of scarcity, leading to inefficient or even incorrect actions [40]. Thus, in some situations water scarcity can be used as a means to justify certain agendas, interests, or discourses [42,44,45]. In Finland, “the land of a thousand lakes” [46], the dominant narratives related to water typically evolve around the abundance of water, making the promotion of measures related to drought and water stress in Finland more challenging.
Thresholds for water scarcity indices are a constant debate [25,26]. For screening purposes, this study adopts the same thresholds as Brauman et al. [24]. This is sufficient to identify possible water-stressed areas or other vulnerable areas for deeper analyses. Brauman et al. [24] used a 75% threshold to define a “depleted” sub-basin. Other often-used thresholds for scarcity are 20% for moderate scarcity and 40% for severe water scarcity [26].
These water scarcity thresholds implicitly include a provision for environmental flows, but are not tailored to local circumstances. Drought causes stress to ecosystems and deteriorates water quality. Estimating environmental flows can, therefore, be useful when estimating the drought impact to the environment. Finnish rivers have generally stable flows, due to the large number of lakes and steady precipitation (no dry seasons or monsoons), but snow accumulation and melting brings considerable fluctuation to the rivers’ flow regime. Many rivers are in a relatively natural condition, although only a few are completely undammed, unregulated, or undredged. These characteristics lead to higher environmental flow requirements than average [26,47,48]. Nature can normally adapt to short droughts, but longer drought episodes can be damaging [49,50]—especially in Finland, where no annual dry-season occurs, and the nature is not accustomed to drought. Humans may worsen the impact by not cutting down water use to adapt to drought conditions, regardless of the needs of the environment. Therefore, this analysis should not be taken to provide a comprehensive analysis of drought impacts on the environment.
Similarly, the thresholds can be assumed to implicitly include a provision for the need to dilute pollutants or salts to acceptable levels (as considered by “grey” water footprints [51]). Finland has many industries that have large water withdrawal but relatively low water consumption, including the paper and pulp industry, mining industry, and aquaculture. Thus, they might affect water quality during drought more than quantity. Heat waves during dry summer also create algal blooms that affect recreational use, and sometimes water withdrawal. Water quality is usually the reason a water user needs a permit in Finland, and the permitting and governance systems have been designed more from a quality than quantity perspective. Mining, aquaculture, and industries generally withdraw substantial amounts of water but consume only a little. They might have considerable effects on the ecological status of the water bodies into which they discharge the process waters. During drought, water bodies are in a more fragile state than usual. In addition, water quality in aquifers and lakes deteriorate [52,53]. On the other hand, nutrient washout from agriculture is usually smaller due to less precipitation and erosion. While water quality is important for water users, these phenomena are not explicitly investigated here.
This analysis focuses on blue water (i.e., lakes, rivers, and aquifers). For agriculture, only impacts on irrigation are therefore considered, and not impacts on rainfed agriculture (relying on green water). While potentially significant, these impacts are outside the scope of this analysis. Irrigation is of special interest as it provides protection from drought, but a severe drought would drain some smaller water sources that irrigators would use, potentially accentuating the impacts experienced.

2.3. Data: Water Use

Finland’s water use and hydrology differs from the global averages, most notably due to the country’s northern location and (usually) snowy winters. Thus, global estimations do not necessarily give the best result in Finland [36]. Water management and related monitoring is generally of high standard and quality, providing actual data on intensive water users via water use permits. Nevertheless, even with good data sources, a study of sub-national scale includes assumptions and generalizations.
Selecting an appropriate unit of analysis is important, as it can have a major effect on the results [54]. The unit of analysis in this study is a river basin. The larger river basins (area over 1000 km2) were further divided into sub-basins based on the Finnish catchment division system [55]. We analyzed all 74 main basins and 949 sub-basin areas (avg. area 351 km2) of the country. The water use data is generally available at annual timescale resolution. However, looking at water availability annually gives an insufficient picture [26,56]. Finland has four distinct seasons with specific hydrological features. The growing season is short and irrigation is used mostly in June and July. Temporal downscaling of each sector is outlined below.
The water use data was mostly available at municipal resolution. There are 295 municipalities in mainland Finland. They vary greatly in size (6 km2 to 17,334 km2) and population (734 to 642,000). After estimating water use for every municipality, it was aggregated to the 949 sub-basins and the main basins. The water use was divided into sub-basins on the areal extent ratio that the municipality had on each catchment with GIS software. However, to make the aggregation more accurate, irrigation (see next chapter) and all water permits that exceeded 1Mm3 withdrawals from freshwater annually were analyzed in more detail and the exact sub-basin of water use was used instead of adding it to the municipal value. The criterion was met with 91 water permits out of 565. The 91 permits account for 88% of all industrial freshwater withdrawal volumes that have water permits. The consumptive water uses for the sub-basin are available as Supplementary Materials.

2.3.1. Agriculture

Agricultural water use in this study includes two categories: livestock and irrigation. The water use estimates of livestock were based on the reported headcounts of livestock by the Natural Resources Institute Finland (LUKE) [57,58]. Only a small percentage of the fields are irrigated regularly in Finland (1–2% or ~8000 ha) [59], since it is not generally profitable. Despite the small percentage, the irrigated fields and greenhouses generate approximately half of the market value of the whole plant production [31]. However, the true value of irrigation might become visible only during droughts. For example, in England and Wales, the net economic benefit of irrigation in a dry year was estimated at £665 million [60]. Irrigation has been in decline in Finland since 1995 after Finland joined the EU. The EU agricultural subsidies focus on area instead of crop yield, making irrigation less profitable. This has, in part, led to the decline of irrigation schemes in Finland, making the agricultural sector less resilient to drought.
No reliable records are available on water abstractions for irrigation in Finland. As there was no data, we estimated the irrigation with an unpublished model that was built on an existing VEMALA model [61] developed by the Finnish Environment Institute. The irrigation water use was modelled with hydrology similar to the dry year of 1941, but with today’s land use and crops. The irrigation model uses soil moisture to assess the need for irrigation. When soil moisture decreases below a threshold, a specific amount of water is irrigated. Both the threshold of soil moisture and the amount of water irrigated is a crop specific parameter estimated based on irrigation guidelines [31,62]. We assumed that during a severe drought, all farmers with irrigation equipment (101,900 ha in 2013 [59]) would irrigate. For the purpose of the depletion index, we estimated potential water use rather than actual use. Hence, irrigation was not limited by water availability. The annual irrigation amount was divided to months as follows: May 15%, June 35%, July 35%, and August 15%.

2.3.2. Industry

We used water permits from the national VAHTI-database to estimate industrial water use, dividing it into cooling water use, paper and pulp industry, aquaculture, and other industrial water use. A permit is needed in Finland if groundwater abstraction is larger than 250 m3 per day. In addition, water supply utilities and large-scale facilities need a permit for surface and groundwater abstraction. Water abstractions have to be reported annually (Water act 2011, 3§3). The amount of water use without water permits (abstracting less than 250 m3 per day) is not recorded, but some estimates have been made for the total water use per sector [32]. Water use was divided equally across months, in absence of evidence otherwise.

2.3.3. Public Water Supply

Water use of the public water supply was based on municipality populations. Water use per capita has been estimated at 204 liters per day per person. The estimate is based on information provided by the water supply companies (VEETI-database). Of the 204 liters, inhabitants use approximately 130 liters, and the remaining 74 liters derive from network leakages and water use by companies and industry, who buy water from the water supply companies. Approximately 90% of the population get their water from water supply companies and the remaining 10% have their own wells. There are roughly 0.5 million wells in Finland providing water to permanent residents (50%), but also to hundreds of thousands of summer cottages (50%). Many wells would run dry during a severe drought, so we estimated potential water use, similarly to irrigation, assuming that water use was not limited by the drought.
The two largest water transfer schemes were also taken into account. The Päijänne tunnel brings water to the Helsinki region (100 Mm3 annually) and Virttaankangas aquifer recharge project brings water to the Turku region (23 Mm3 annually). There are also other smaller water transfers, like emergency water transfer pipes between water supply companies, but we excluded them due to lack of data. Water use for public water supply and water transfer schemes was also divided equally across months.

2.3.4. Returned Water

As WDI analysis is based on consumptive water use, the returned water (i.e., the proportion of water returned back to the ecosystems) has to be accounted for. However, the returned water in Finland is not reported in any way and there are no studies on the matter either, so estimated values have to be used. The analysis used the following return flow percentages, which were derived from the WaterGAP model [57] and USGS (United States Geological Survey) reports [63,64]: domestic 83%, industry 78%, and cooling water 97% (thermoelectric cooling in Finland is once-through cooling). Livestock return water percentage was estimated to be 78% [57,58]. Irrigation was modelled with theoretical optimal irrigation water need, creating no return flows. Domestic and industrial water users close to the sea return their waters straight to the sea, thus municipalities with coastline had no returned waters from domestic and industry sectors. The largest inland fish-farming facilities are all “run-through” facilities in Finland and have only a small consumptive effect. Thus, the 15 facilities with annual water withdrawal over 1 Mm3 were estimated to have a 97% return rate. Hydropower was assumed not to consume or withdraw water.

2.4. Data: Reference Drought

This study uses the most severe drought period of the last century in Finland, the drought of 1939–1942, as a reference drought. The actual drought lasted for 3.5 years, starting in May 1939 and ending in November 1942, yet to understand seasonal variation, we extend the analysis to the full calendar years 1939–1942. The return period of this hydrological drought was estimated to be once in 100–150 years for most of Finland [65], and it is modelled and described in more detail by Veijalainen et al. [66]. The observed temperature and precipitation were used to simulate the runoff and discharges of 1939–1942 using the WSFS model, but with the current regulation rules and dams in the catchments. This enables the estimation of impacts during a severe but realistic drought situation.
During the period of 1939–1942, winters were cold and snow amounts were reasonably large, despite the drought. Since climate change has already increased the temperatures in Finland over 2 degrees [67], these kinds of cold winters have become rarer. According to the results of Veijalainen et al. [66], however, climate change would not significantly change the 1939–1942 drought severity. Winters would become somewhat wetter and summers drier, but the general water availability would change only modestly. Snow amounts were, therefore, not altered.
Inflows and runoff values for sub-basins were modelled with the Finnish Environment Institute’s WSFS model [38,39]. WSFS is a hydrological model used in Finland for national operational hydrological and flood forecasting and for research purposes [68]. The reference drought water resources were simulated for the full 4 years period of 1939–1942. The model calculates daily values from which mean monthly discharge and runoff for every sub-basin is calculated. The WSFS includes a conceptual three-layer soil model, where the lowest storage represents groundwater storage and the middle storage soil water and the variations in these storages are calculated. The surface water storages (i.e., lakes and rivers) are taken into account in the model. However, only lakes with area larger than 1 km2 are included (see Supplementary Materials for a diagram of the model modules).

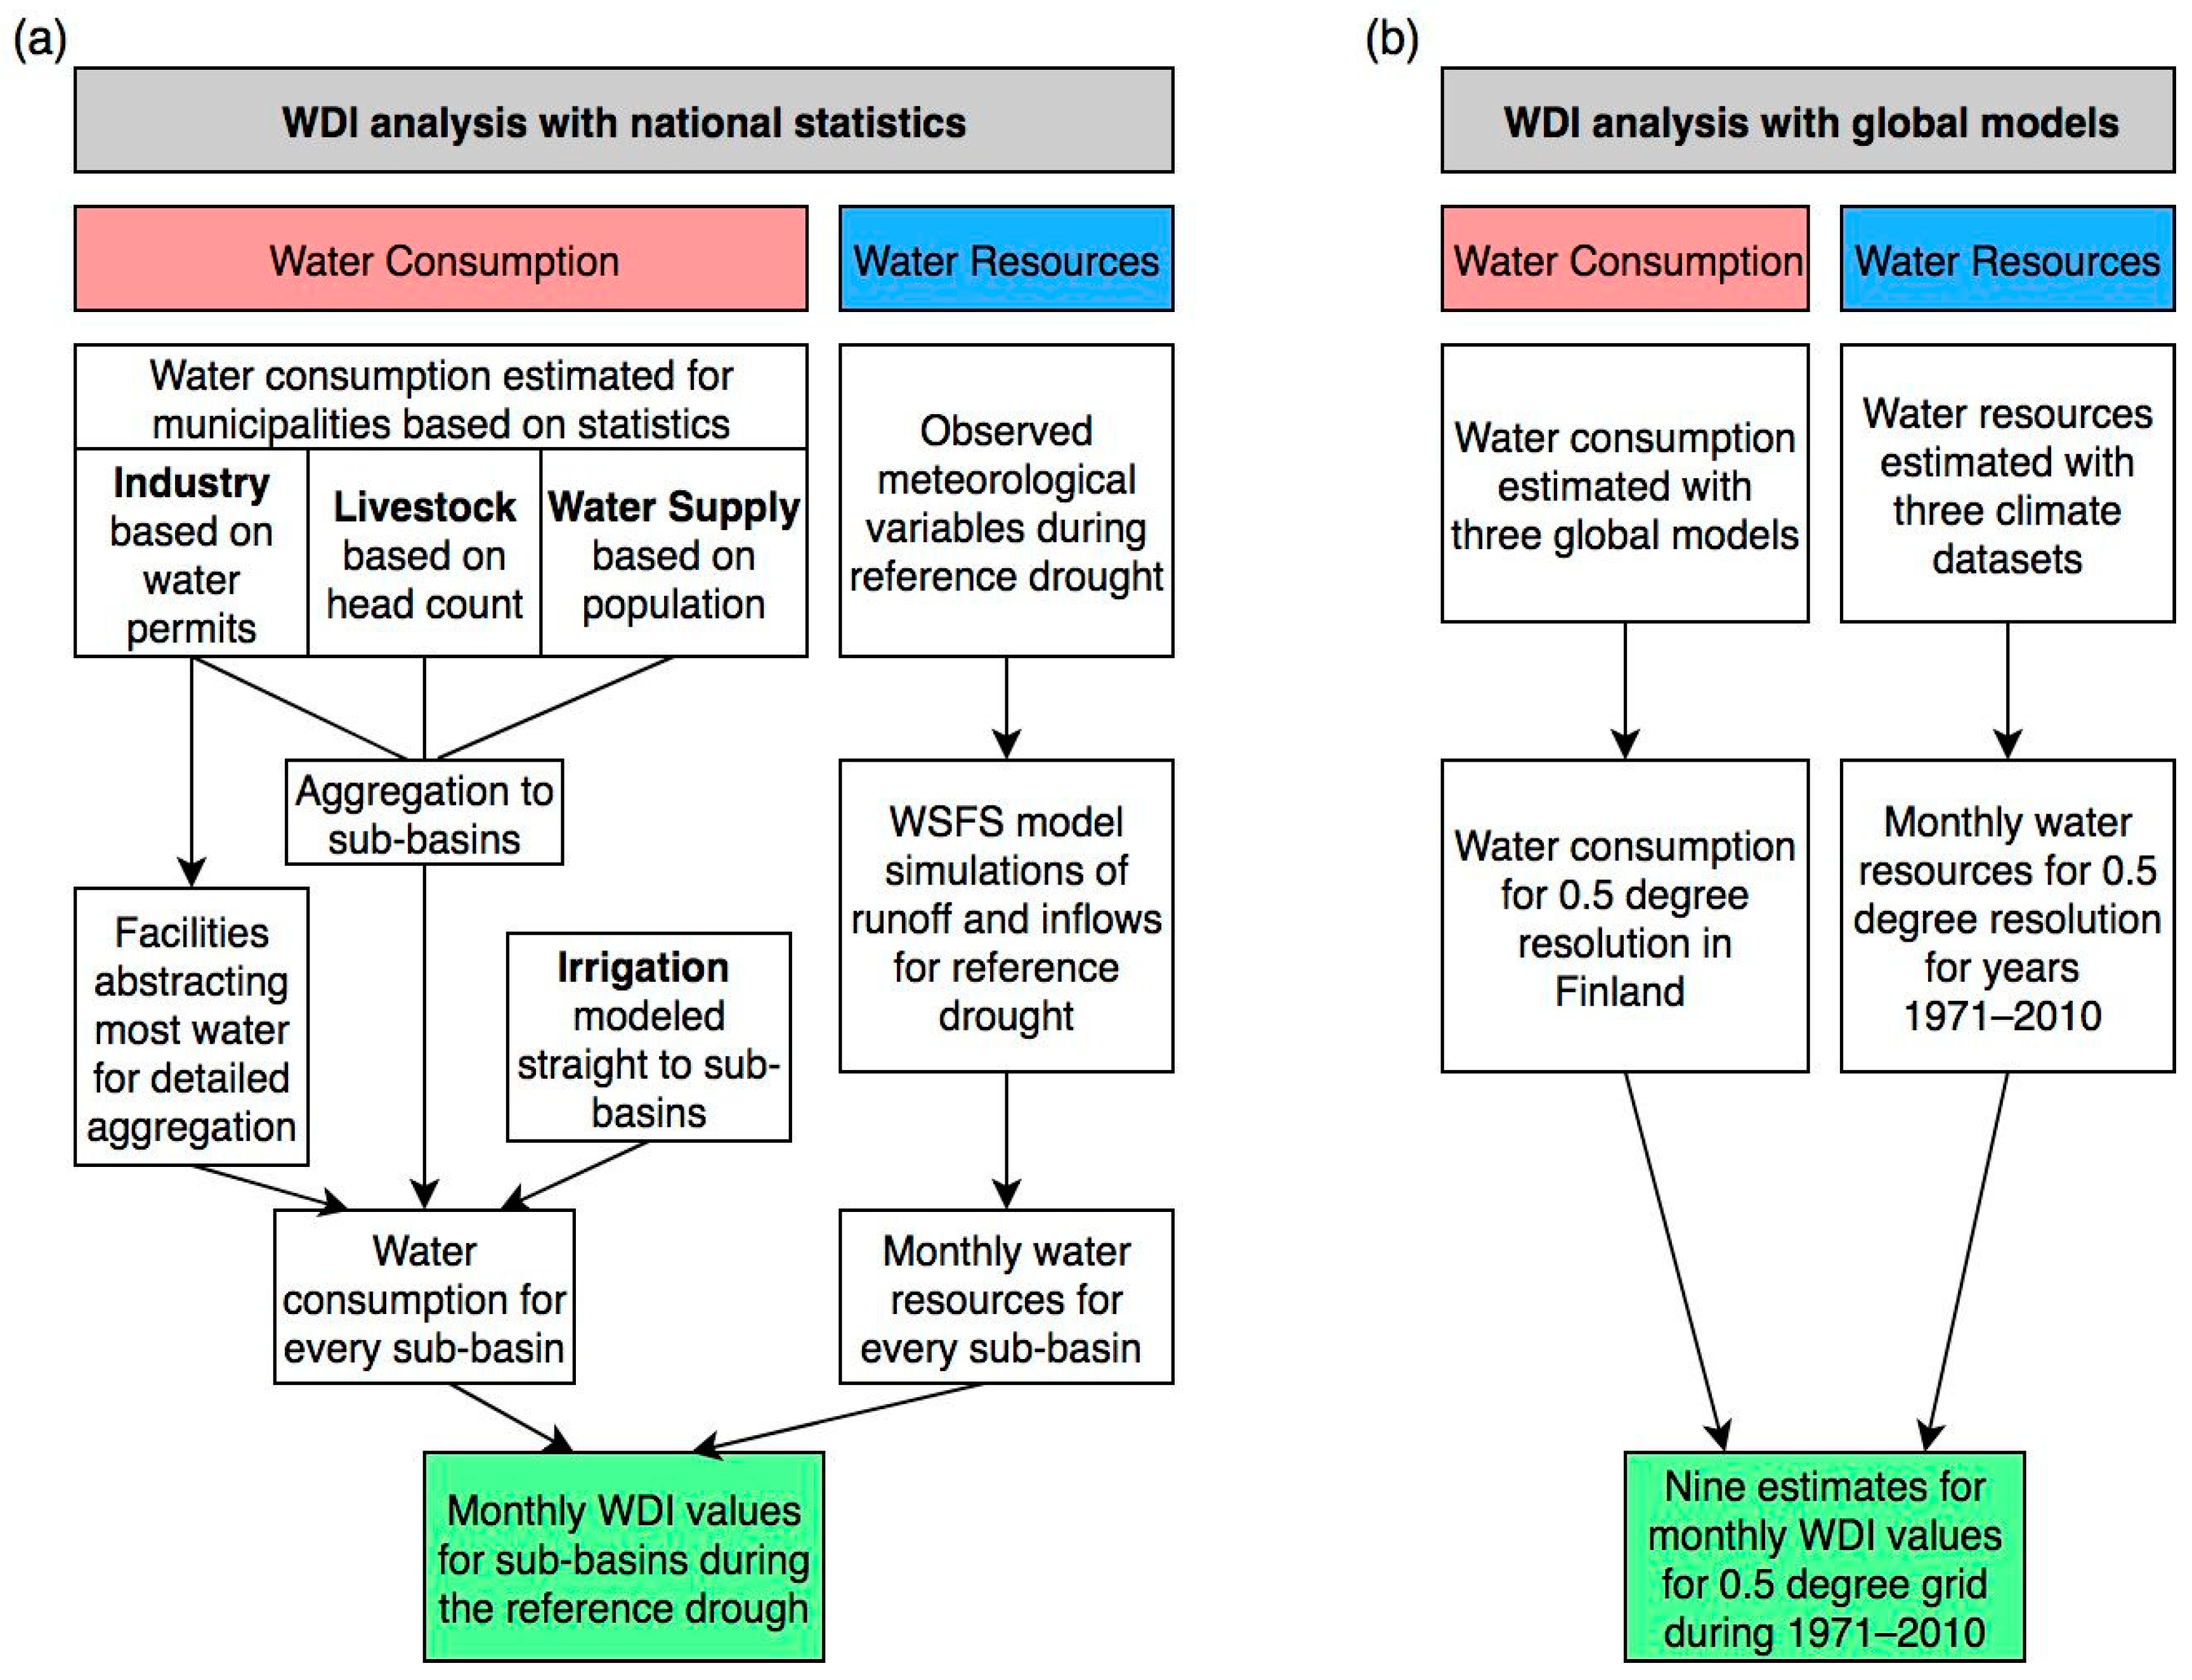
2.5. WDI Analysis with Global Models

Many water use-to-availability analyses use globally modelled data (e.g., Brauman et al. [24] and Kummu et al. [1]). For comparison with the national statistical water stress analysis, the authors did a similar analysis with global datasets. This was carried out to test whether the global data produce similar results than the more detailed national water permit-based data, and to assess if global data with 0.5 degree resolution (approximately 25 × 50 km or 1250 km2 in Finland) could be used for sub-national water availability analyses, at least as a screening tool.
To test the above-mentioned questions, the WDI was calculated with data extracted from the Inter-Sectoral Impact Model Intercomparison Project (ISIMIP2a [69]). ISIMIP2a is a historical validation experiment, in which historical climate and socio-economic datasets are used to evaluate the performance of the models from 1971 to2010. While this does not cover the reference drought years 1939–1942, it provides the most reliable benchmark for the purpose of comparison. The climate datasets are based on reanalysis of observations, and therefore, in principle, are more reliable than using a climate model. ISIMIP2a includes four climate datasets. We used Princeton, GSWP3, and WFDEI, leaving out WATCH as it only covers the period 1971–2001.
The three global water models used were PCR-GLOBWB, H08, and WaterGAP2. These are the only three models currently available that estimate domestic and industrial water use in addition to irrigation. PCR-GLOBWB and WaterGAP2 additionally estimate livestock water use. Estimates of irrigation water use are typically obtained using climate forcing, land use data, and crop models. Estimates of other water uses are typically obtained by downscaling country-scale statistics. A variety of assumptions are used, often including water use intensities, technological changes over time, and local data, e.g., population, GDP, and livestock populations. Most of the data was obtained at the monthly scale as separate variables from the ISIMIP website. WaterGAP2 water use data was downloaded as a single file containing the sum of industrial, domestic, manufacturing, electricity, and livestock water use. Industrial water use for PCR-GLOBWB was obtained directly from IIASA (International Institute for Applied Systems Analysis), and the livestock water use for H08 model runs was taken from PCR-GLOBWB. The full list of files used is available in the Supplementary Materials.
Inflows and runoffs were calculated similarly to the analysis based on national statistics as the sum of monthly inflows and local runoff. Inflows and runoffs, however, were calculated on 30 arcmin grid cells, which is the smallest spatial unit provided in ISIMIPa. Large water transfer schemes are not incorporated. Routing between cells is included within the models using the DDM30 Drainage Direction Map [70], and some large dams are accounted for. Water consumption estimates were taken from the year 2010. For each cell and each combination of climate dataset and water model (i.e., 9 estimates), we extracted the maximum WDI values over time in order to capture the most severe conditions within 1971–2010.

3. Results

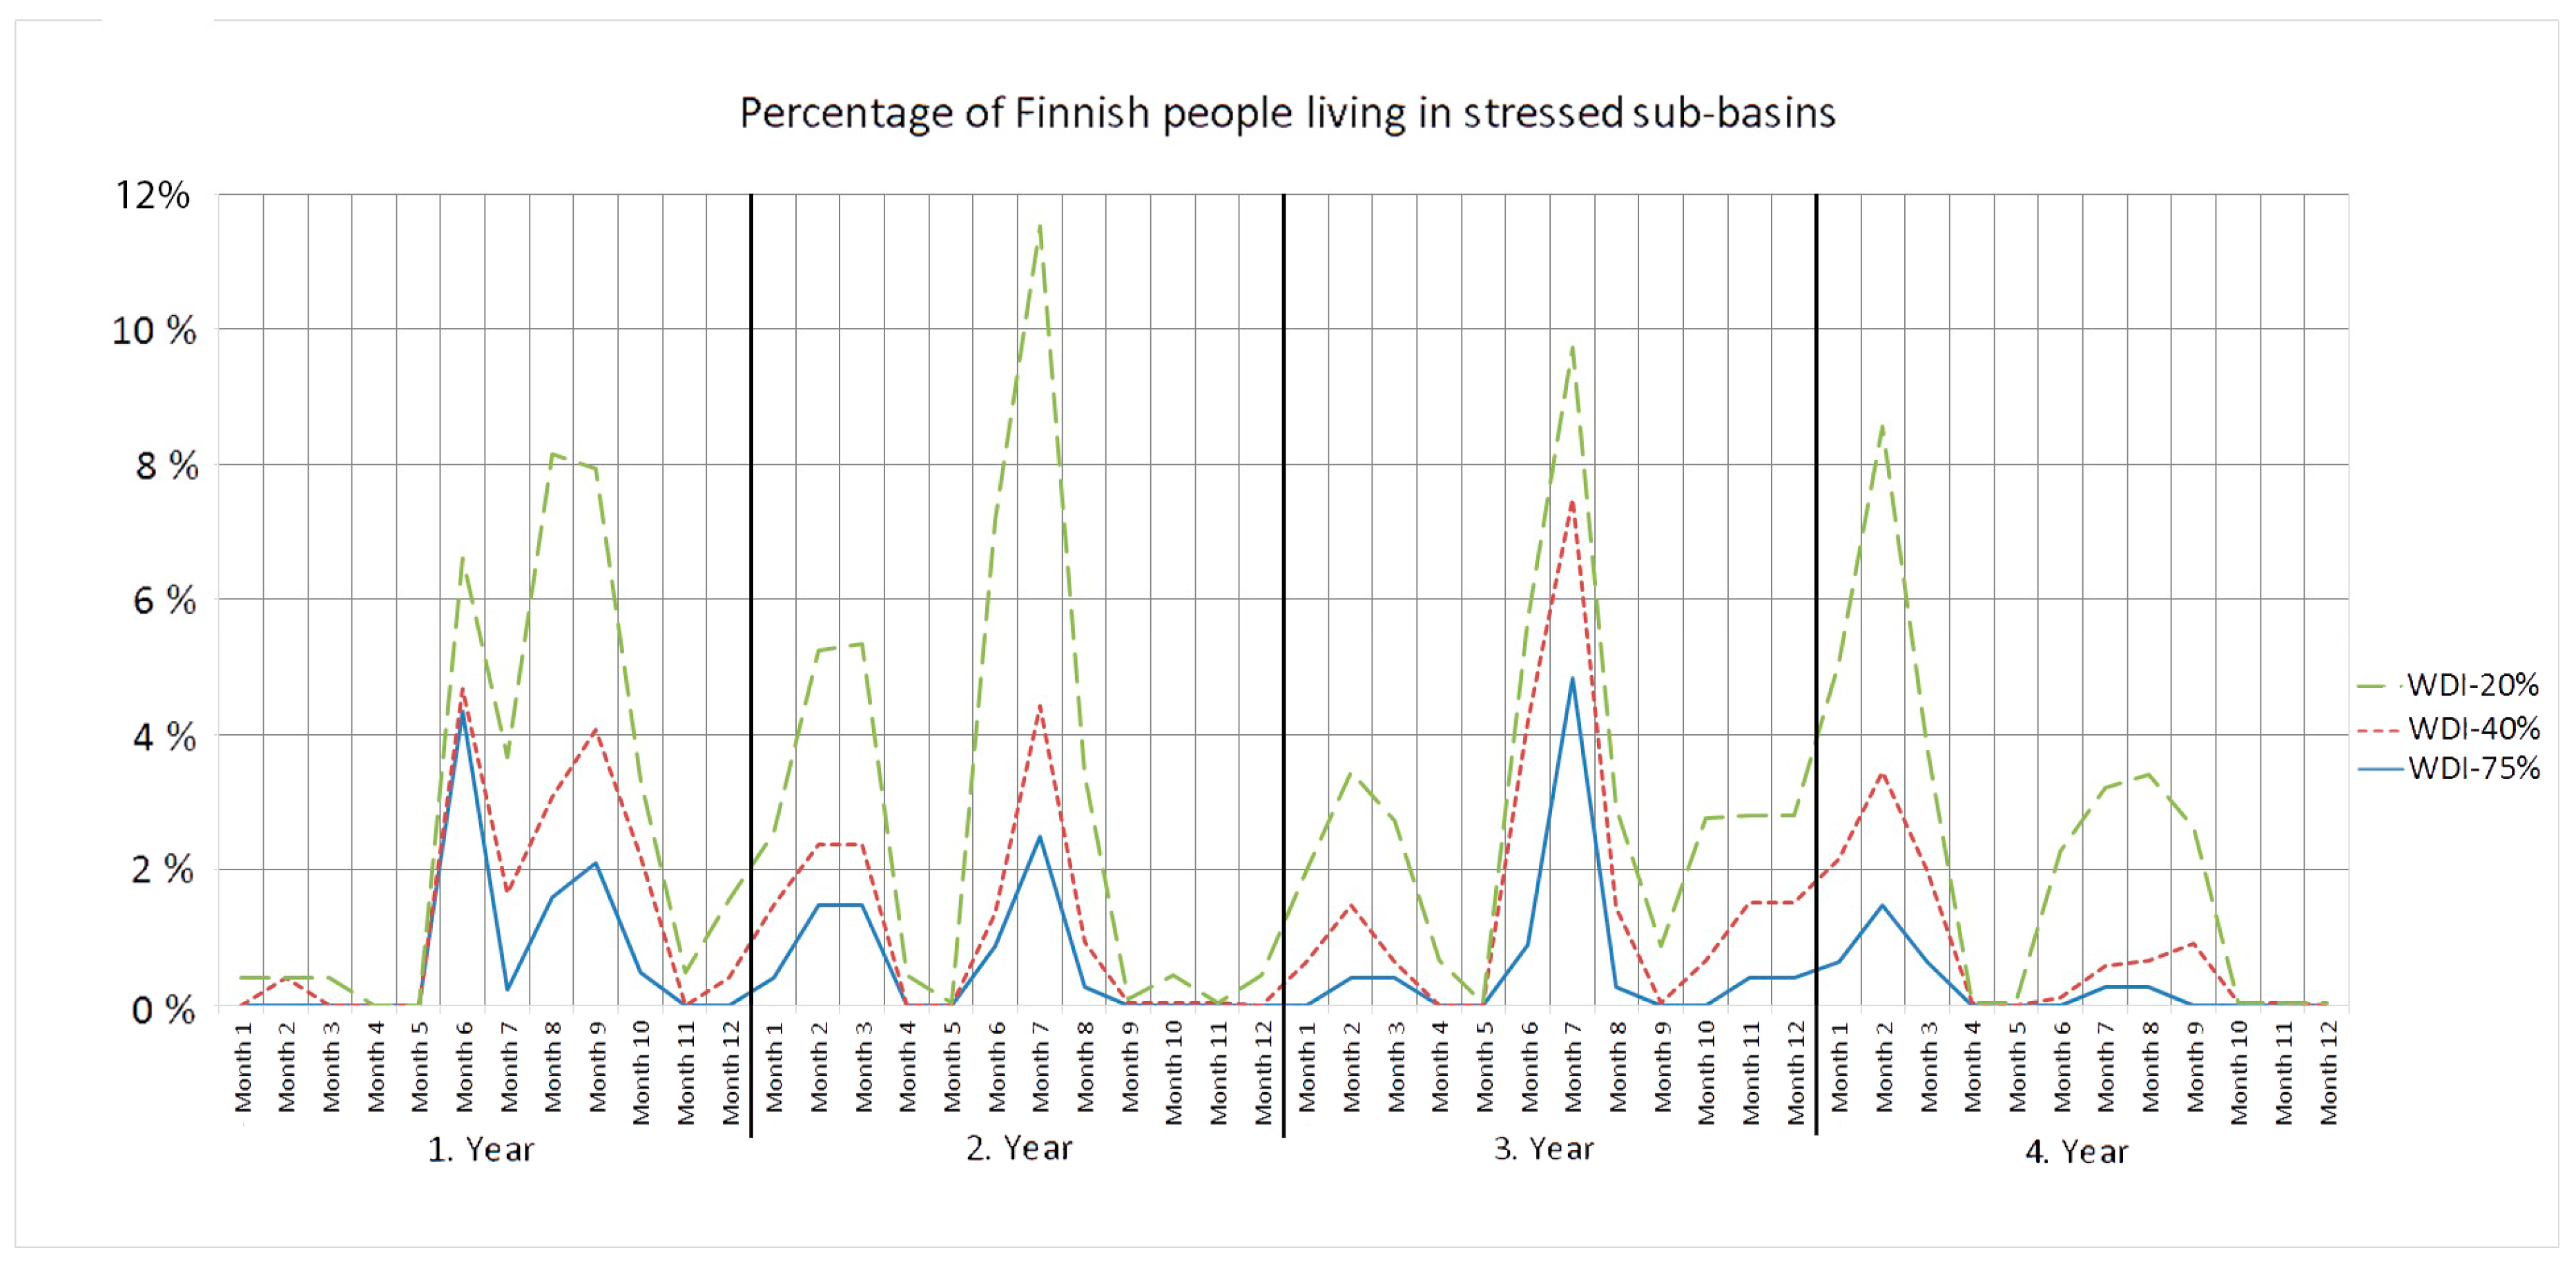
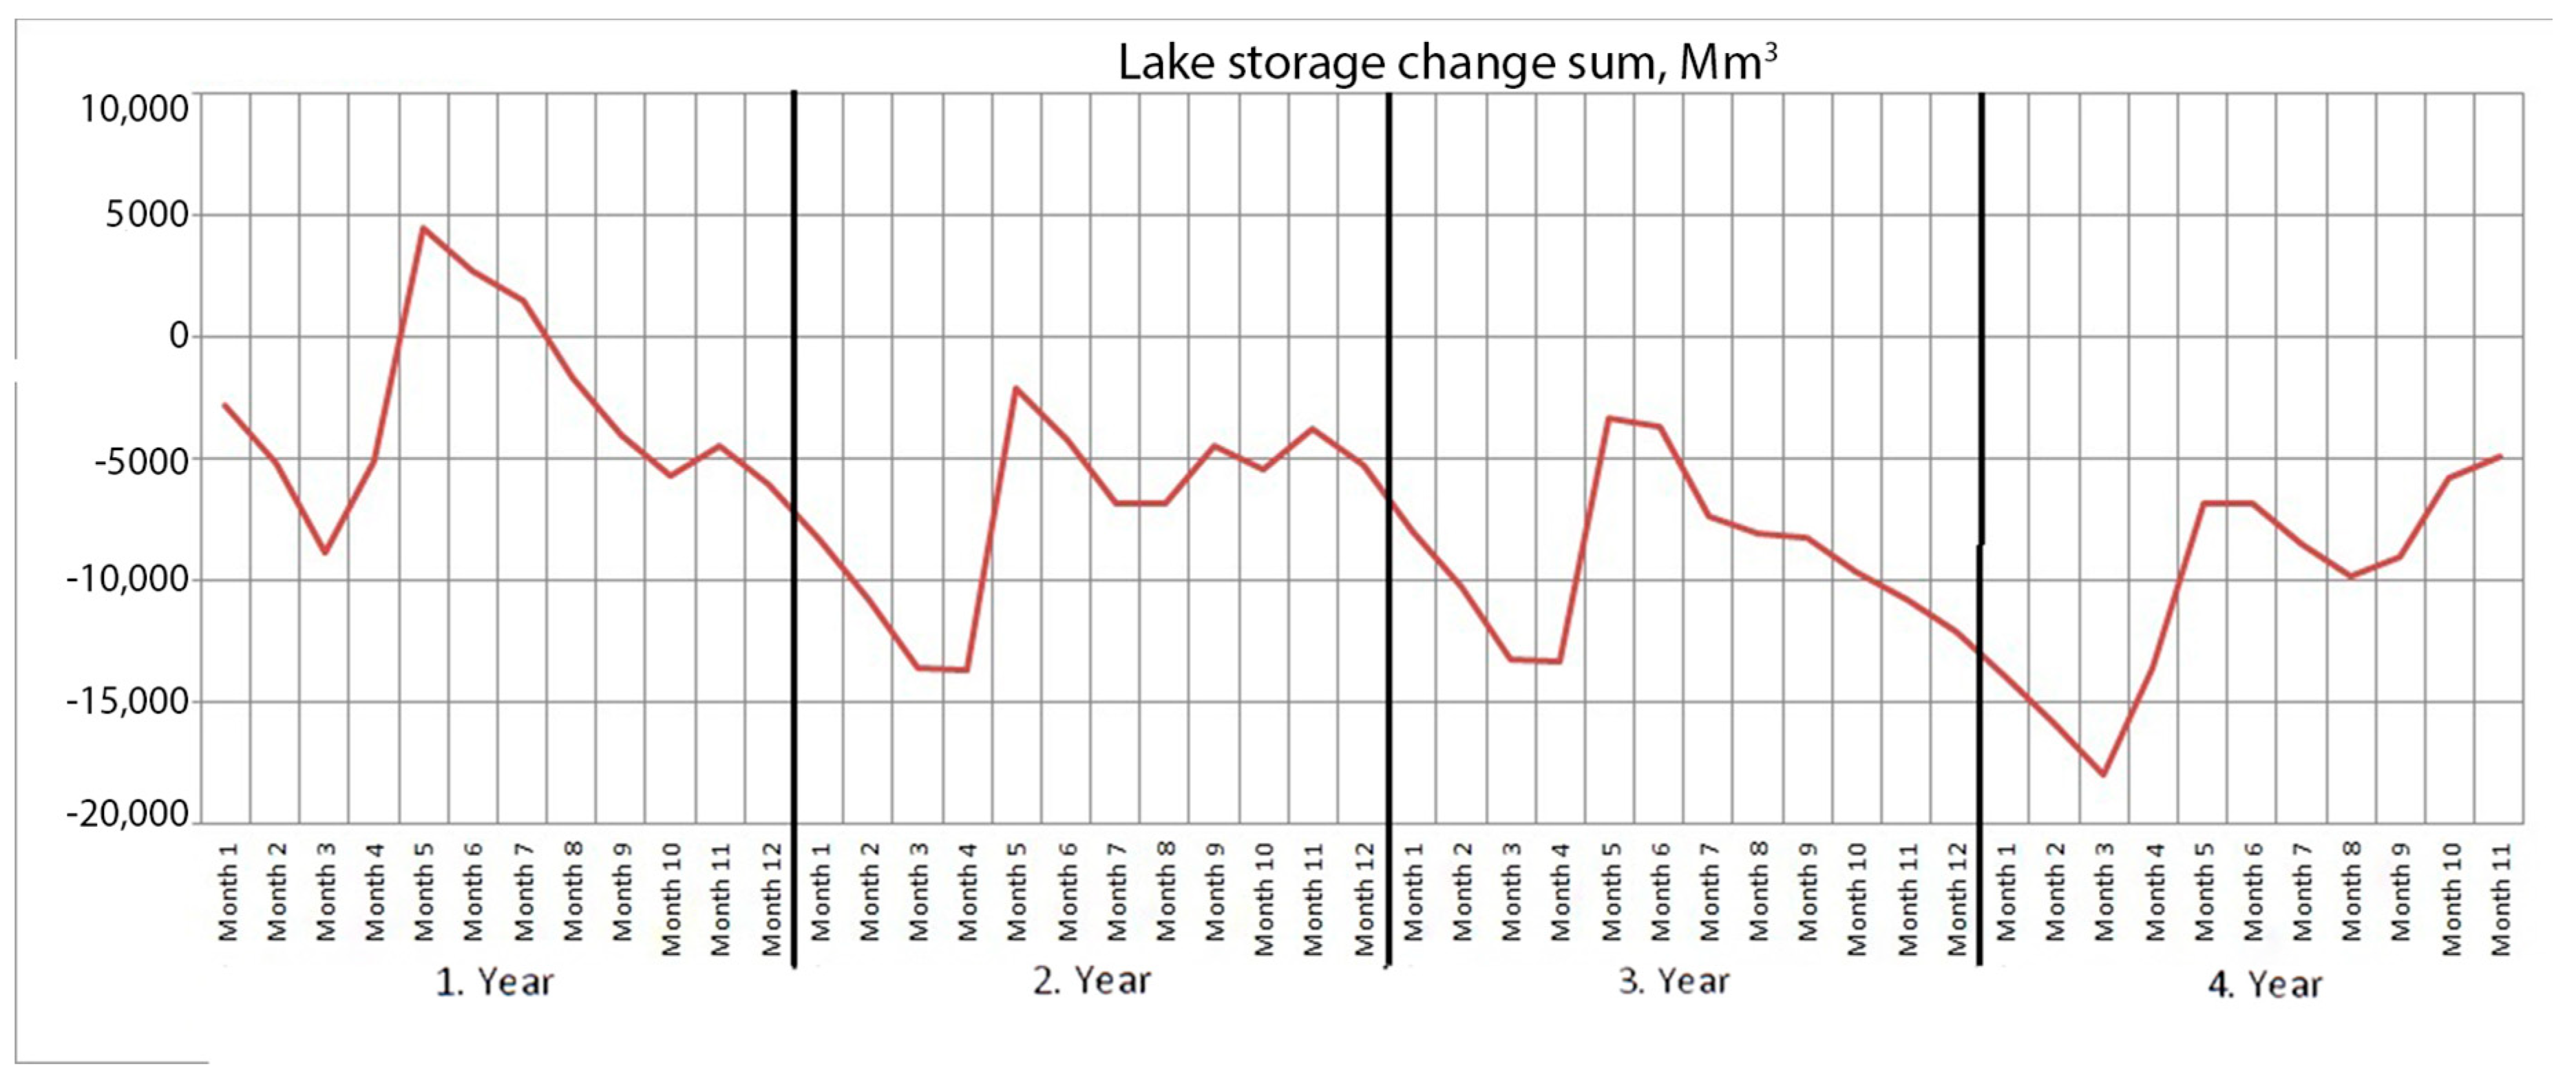
3.1. WDI Results with National Statistics

The core of the analysis consists of the Water Depletion Index (WDI) results. Figure 3 presents the percentage of the Finnish population living in water-stressed areas during a severe drought with three different WDI-thresholds (see below). The WDI is calculated with monthly water consumption from the year 2015 during the reference drought. As can be seen from Figure 3, the population living in sub-basins experiencing drought has a clear seasonal variation. The scarcest month is during the seventh month of the third year, when 11 sub-basins, or 5% (~275,000 people) of population, are above WDI-75%. According to Brauman [24], these basins would be depleted, meaning that usable water is limited in these months. A further 41 sub-basins, or 10% of the population, are above WDI-20%, indicating that another 275,000 people might experience water stress. WDI-20% should be chosen as a threshold when some difficulties start to appear in accessing water (including potential water management, water quality, or environmental impacts [1]). WDI-40% should be chosen as a threshold when some difficulties can be expected and WDI-75% when the sub-basin can be seen as depleted. However, as discussed earlier, the thresholds are exemplary, and should not be treated as absolutes. In 9 sub-basins, the WDI goes occasionally above 100%. While data errors cannot be ruled out (e.g., in consumption, return flows), this can also occur due to unaccounted water storages and water transfers, which shift water availability, and therefore stress, across time and space. More importantly, it includes areas where potential irrigation water use and groundwater extractions may exceed available water, and would therefore need to be curtailed. Therefore, these are important sub-basins for further work to focus on.
The majority of basins exhibiting potential water stress problems are located in the South and Southwest of Finland (Figure 4). These basins are mostly small and have few lakes, but also have relatively large amounts of population, farmland, irrigation, and industry. On the other hand, the most water intensive industry is mostly located outside these areas along the large basins, where water is available even during a severe drought. It is notable that the Helsinki region shows relatively low WDI values: this is due to the Päijänne tunnel water transfer. In addition, while many small coastal basins show high WDI values, their public water supply may, in reality, be sourced from neighboring larger basins. In addition, some sub-basins on large lakes, like Päijänne and Saimaa, show elevated WDI values, but when investigating the lakes as whole, water availability is sufficient to avoid water stress.
Figure 4 also shows where the largest industrial and fish-farming units are located. One hundred units that abstract the most freshwater are shown in the figure. The largest units are mostly located in the large basins and near large water bodies or rivers, as expected. The largest water abstractors are the paper and pulp industry, energy production, aquaculture, and the chemical industry. The largest water withdrawals are usually cooling water, with most of the water returning.
Figure 5 shows how the modelled total storage capacity of lakes and reservoirs decreases during the reference drought. The model includes lakes larger than 1 km2. The storage was at a normal level at the beginning of the drought. The figure shows that the spring floods did not fill the lakes to the previous year’s level. The storage is lowest in March of the fourth year. When comparing this to the March of the first year, a difference of over 9000 Mm3 can be observed. This is almost ten-fold the annual water consumption. Diminished water storage means that there are less options to mitigate drought impacts with regulation and irrigation. The figure does not include groundwater storage, but typically, groundwater storage follows the surface water storage with a short delay. Lower groundwater levels lead to more difficulties, with water users relying on groundwater.

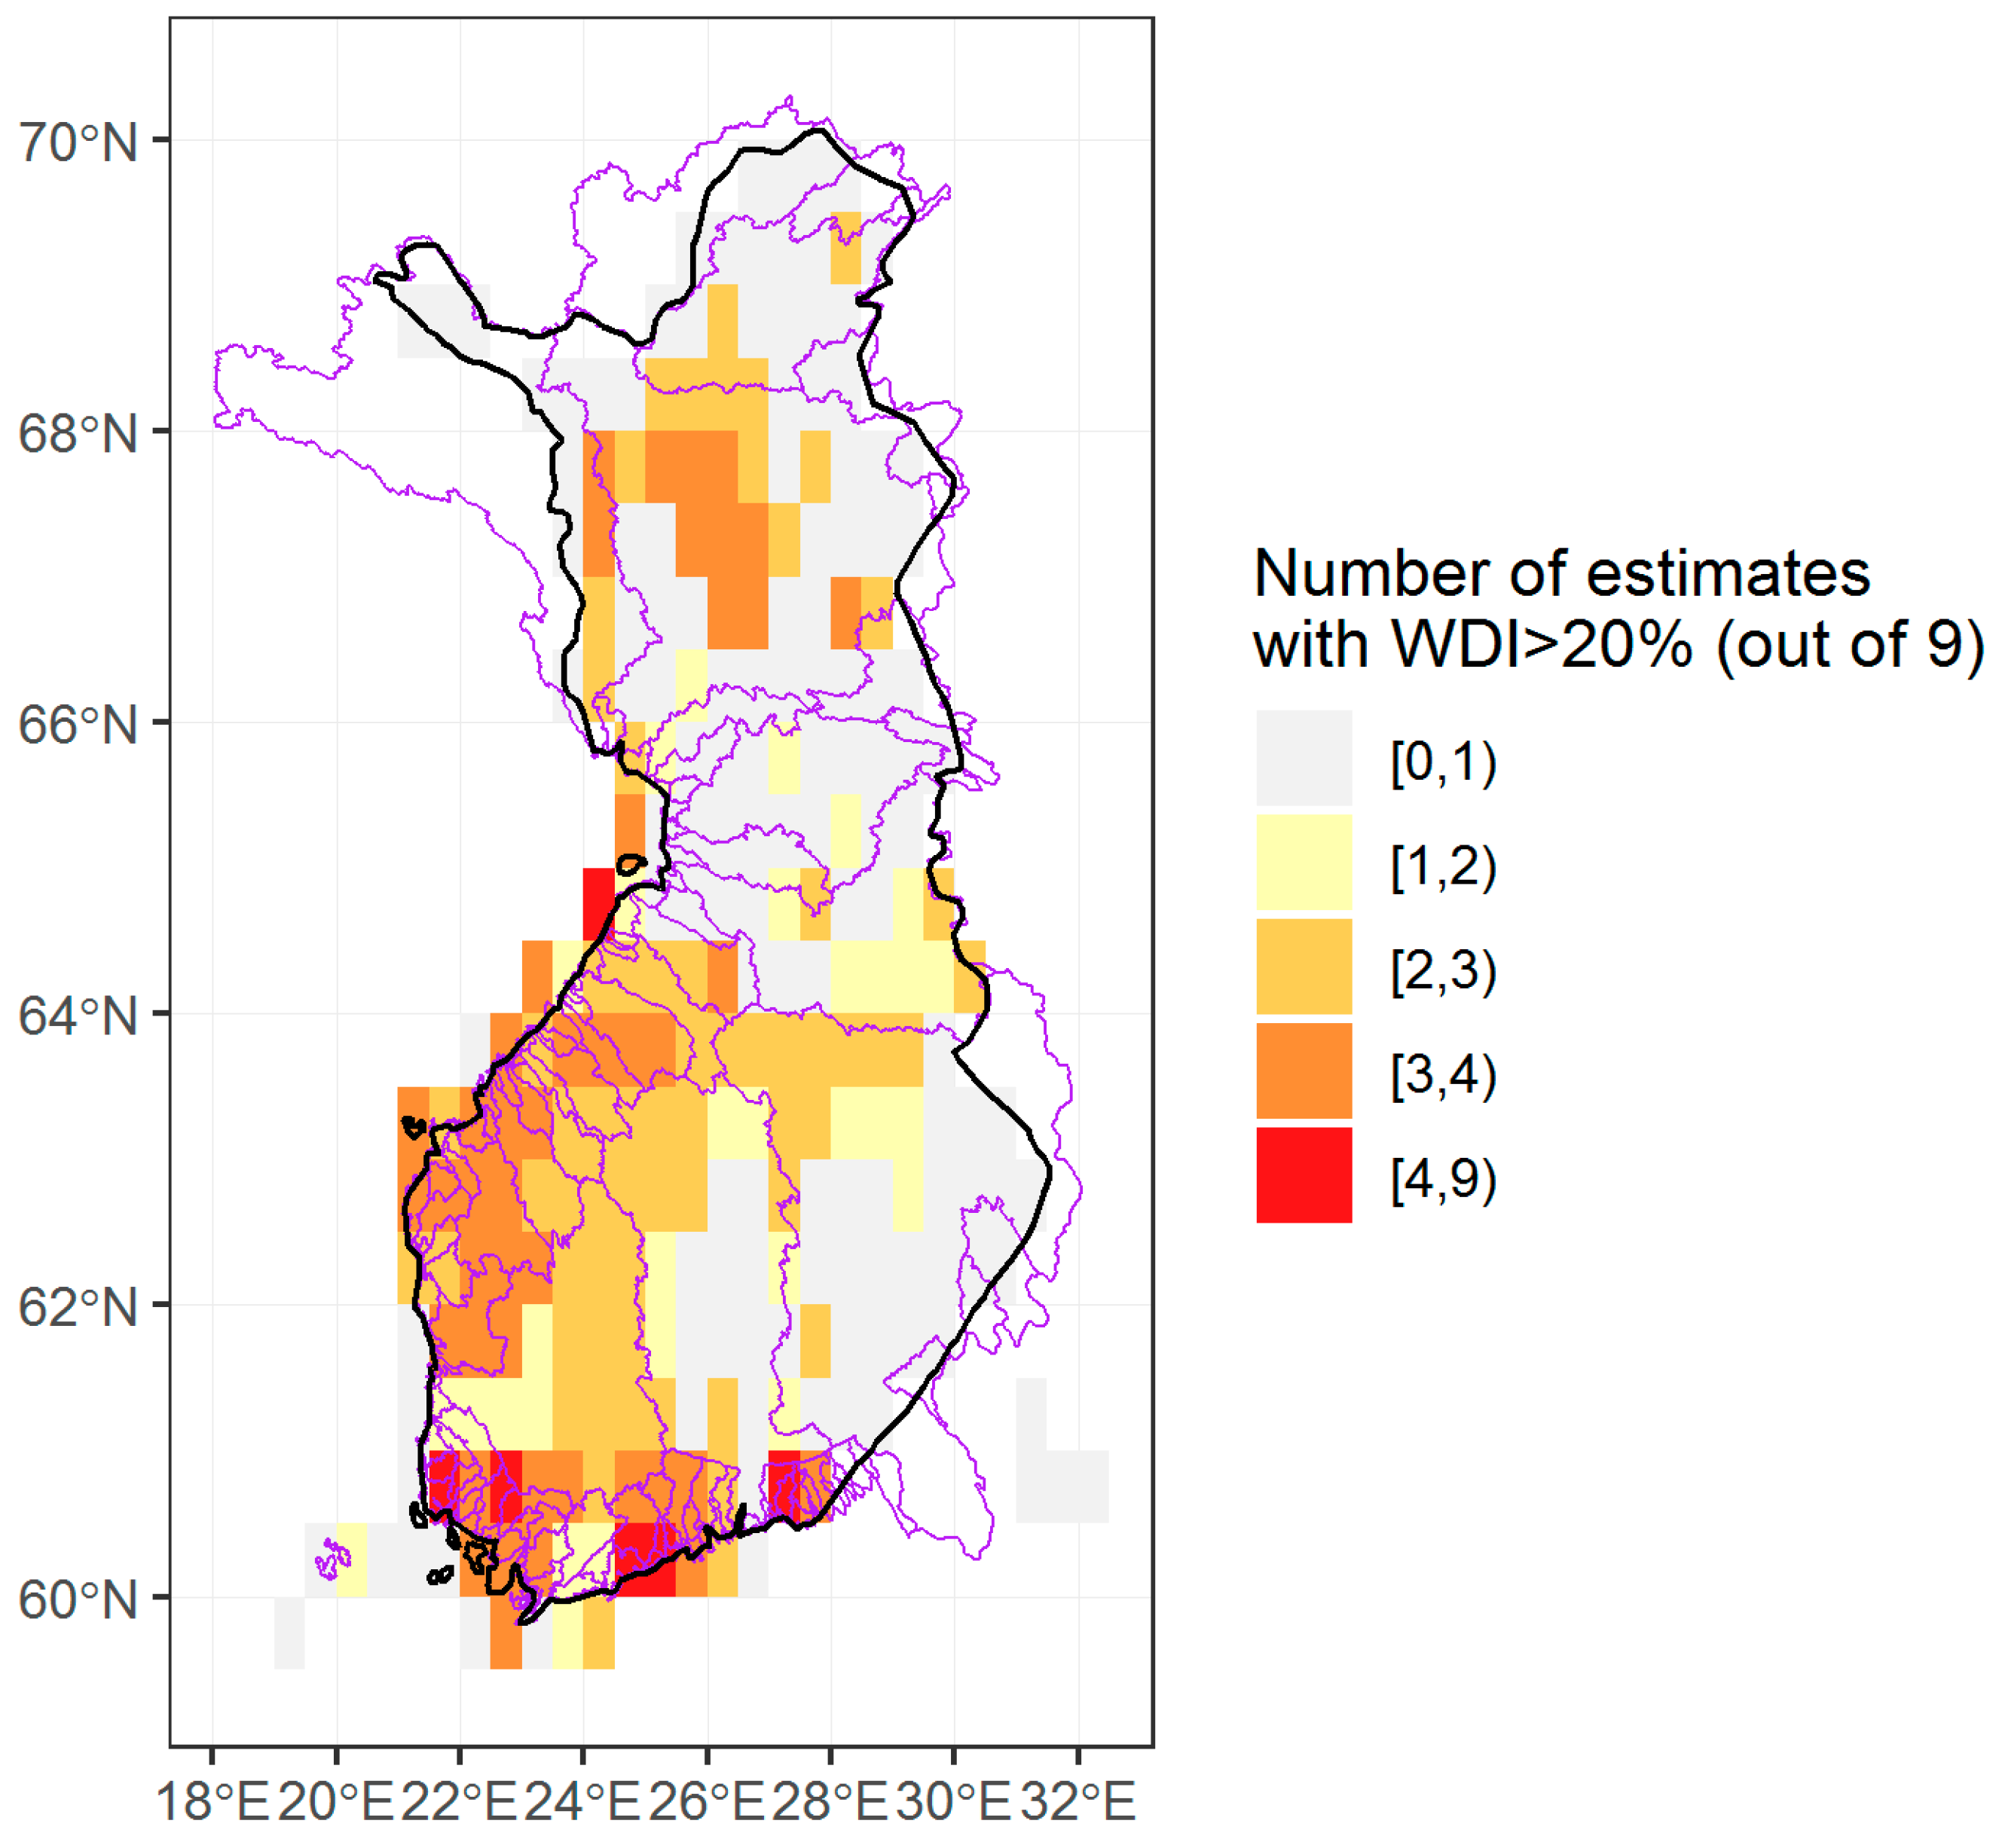
3.2. WDI Results with Global Models

Results using estimates from global models should be seen as a screening tool to identify areas that are potentially depleted rather than being directly comparable to national data. The 30 arc minute resolution is quite coarse, and there is substantial uncertainty across model estimates. Using 3 climate datasets for period 1971–2010 and 3 models, the analysis yields 9 different estimates. The number of estimates with WDI values above 20% is shown in Figure 6. Similarly to Figure 2, the global estimates also highlight southern coastal regions. Some cells are outside the land borders—they should be interpreted as coastal areas, as this is due to the limitations of the coarse raster representation. Water depletion is, however, also suggested in inland areas, especially in the north. This turns out to only be due to a single model (PCR-GLOBWB, see Supplement). The utility of global models is further discussed in Section 4.2.

4. Discussion

The findings of this study have been divided into three parts: context-specific, methodological, and policy-relevant findings. A fourth part then presents the limitations and ways forward.

4.1. Context-Specific Findings: South and Southwest Finland Most Vulnerable to Drought

In this study, drought vulnerability was analyzed by estimating consumptive water use during a severe drought in Finland. The main impacts from severe drought in Finland would come in two ways: through combined impacts from reduced water availability for food security, and through specific impacts for selected water-intensive water users, such as industries and water supply companies. While the analysis indicates that most areas in Finland would have enough water, areas in South and Southwest Finland would have difficulty securing sufficient water availability for all sectors, such that prioritization of sectors would be needed to minimize impacts.
In terms of economic implications, the drought impacts for pulp and paper industry would be particularly critical, as they use remarkable amounts of water and are important for the Finnish economy. However, the pulp and paper factories are generally well protected against drought due to their efficient water use and locations next to large water bodies (partly due to the fact that the timber was historically transported via lakes and rivers). Also, thermo-electric facilities are adjacent to large water bodies, protecting them relatively well from drought.
Drought would have implications also for water supply. After the 2002–2003 drought, some emergency water transfer pipes have been built between supply companies, increasing their resilience and providing alternative options for raw water. This is likely to mitigate some of the water stress predicted in this analysis. Potentially the largest impact for water supply would be through private wells, as many of them would run dry, similarly to the droughts in 2002–2003 [15] and 2018 [71]. Deteriorated water quality would also become a problem for water supply. These issues could be further investigated in the sub-basins identified in this study.

4.2. Methodological Findings: WDI Useful for Drought Analysis, Global Analysis has Limitations

This study indicates that the Water Depletion Index (WDI) is a useful indicator for analyzing the drought vulnerability for the following two reasons. First, WDI clearly states the biophysical fraction of water use from human activities. It is simple, yet precise. Secondly, it can be used with different time-steps and resolutions for drought analyses or water scarcity analyses. It is a good screening tool for sustainable water governance and water resource management.
The WDI also has some limitations that need to be addressed when using WDI and communicating its results. As WDI value does not explicitly account for environmental flows or thresholds and the sustainability of water use is not directly visible from WDI values, some additional information is always needed. For example, definitive identification of impacts would require case-specific rather than generic thresholds. In addition, with a relatively short time scale (a month), the water consumption can exceed the availability during drought, resulting in sub-basins with WDI values over 100%. Such sub-basins are prime candidates for further investigation, as this can occur for a variety of reasons, including if discharge is close to zero (dams are closed), runoff is low (as often happens during drought), or water demand cannot be met and would need to be limited by de facto or regulatory restrictions in consumption.
Interesting context-specific and methodological findings emerge also when comparing the study results with global model analysis. The global analysis seems to highlight the same areas as the local analysis, thus providing corroboration. Such global analysis is useful for providing a general overview and it can highlight areas that are likely to have water stress. Due to its coarse scale, however, it should not be used to rule areas out. At the same time, our studies also indicated some key challenges in the global model results. The considerable differences between the climate models highlight the importance of using multiple global models for screening analyses. Further investigation would be needed to understand why the PCR-GLOBWB model’s estimates differ from the others. If we consider only regions where 4 or more (out of 9) estimates agree, there are in fact fewer regions that appear depleted than reported by the local analysis. While model inaccuracies are likely at play, this is also expected for two other reasons. Firstly, the cell size is larger than the sub-basin size in many coastal basins. This means that water availability is aggregated over larger areas, resulting in lower WDI values. Secondly, the climate datasets used here only start in 1971. The worst-case water availability is, therefore, not as extreme as in 1939–1942.
It should also be noted that global analysis doesn’t consider water transfer schemes. This can be seen in the Helsinki region, which is highlighted in the global model analysis, but not as clearly as in the local statistical analysis. The reason for the difference is the Päijänne tunnel water transfer scheme, which provides all the raw water to the Helsinki metropolitan area from lake Päijänne via a 120 km tunnel. Water transfer schemes are globally common and an important part of water supply, especially during drought. Hence, they should be better incorporated in both global and local water availability analyses. Obtaining data on actual water access and water supply networks is a common problem in global analyses, which has led to issues related to the modifiable areal unit problem [54]. In general, this is dealt with by careful selection of the unit of analysis, e.g., Food Production Unit [72], but this study demonstrates that the ability to adequately capture small basins and associated water transfers is crucial in otherwise water abundant settings.

4.3. Policy-Relevant Findings: Establishing Drought Management Plans

Finland has relatively well-established policies and plans related to water management and climate change adaptation [73], and Finland’s water security is globally at a high level [74]. However, as drought has not conventionally been considered a significant threat in Finland, both climate change adaptation actions and preparedness exercises have focused on floods. There are currently no specific Drought Management Plans (DMPs) in place. The findings of this study suggest that such plans would be useful to improve water security, at least in the most vulnerable areas in South and Southwest Finland. These plans should include, for example, guidance on communications and responsibilities, water use limitations guidelines, co-operative irrigation schemes, preparedness exercises, and other mitigation measures. Good drought mitigation practices can minimize the damage to societies and the environment considerably, e.g., by sustaining minimum flows and water levels with regulation dams. Currently, regulation permits in Finland do not mention droughts and there is usually no guidance for drought-related dam regulation.
The long-term drought mitigation measures would be logical and efficient to implement in the EU Water Framework Directive’s River Basin Management Plans (RBMPs) [13,19]. In RBMPs, the water quality aspects of drought should also be taken into account. The DMPs could be drafted only to areas vulnerable to drought, as was done with Finland’s flood risk management plans [75]. The areas highlighted in this study provide the first step forward when choosing the areas for the DMPs. Short-term mitigation measures, i.e., preparedness plans and water use limitations, could be implemented at the municipal level, where needed. With the RBMPs and the EU’s drought management plan guidance, it would possibly make multinational co-operative drought management easier between EU countries.

4.4. Limitations and Ways Forward

Water scarcity and water stress are multifaceted concepts, and therefore they can be looked at from a variety of viewpoints and analyzed with a number of different approaches [40,41]. This article has focused on a quantitative drought analysis, meaning that we did not look at much broader economic, social, or political aspects related to water scarcity. However, the mitigation measures responding to the drought are equally multifaceted, and would thus require also addressing key economic, social, and political aspects and interests.
A basin level drought analysis can serve practitioners and river basin managers in improving water security and drought resilience, yet more local knowledge and research is required before actions can be taken. For example, interviews and detailed local studies should be made to learn more about the local vulnerabilities and water use practices, as well as their linkages and trends. Additionally, multinational drought management would require more research.
The uncertainties of this water use-to-resource analysis are multiple. For larger global comparison and analysis, the thresholds are understandable, but for smaller cases like Finland, relative thresholds could make more sense when trying to find possible vulnerable areas. In addition, returned waters bear substantial uncertainties, because there are no records of them even in Finland. The WaterGAP3 values were mostly used in this study, but stricter values might be justified for the small time-step (month) and small spatial extent (sub-basin), as Schrerer et al. [36] suggested.
The ability of the hydrological model to simulate the discharges during extreme drought is also uncertain. The observation data from 1939–1942 is rather sparse and may contain biases. Lakes and reservoirs were taken into account in the model calculations, but their role in an actual drought situation may be underestimated. In addition, groundwater storages are included in the model as aggregated average values for the sub-basin. In many places, groundwater storages are crucial in carrying both nature and societies over the drought period [26,76] and efforts to enhance resilience would benefit from better knowledge of them. Some uncertainty also arises from the irrigation model, which is new and needs further validation.

5. Conclusions

Finland, despite being among the countries with the most abundant freshwater resources, has areas that are vulnerable to drought. The most vulnerable areas are in the South and Southwest parts of the country. Drought management and drought resilience are, therefore, important when assessing national and regional water security and its linkages (for example to food security).
The Water Depletion Index (WDI) provides useful and easily interpretable information for decision-makers. It can provide knowledge for private entities, such as industry and farmers, but foremost it is useful to public entities and river basin managers to plan their water resource management actions. The WDI should, however, be used only as a screening tool, given that stress thresholds used are generic, environmental flow requirements and water quality impacts are only implicitly considered, and results are dependent on accurate estimates of water consumption, availability, storage, and transfer. Areas identified as water-depleted are prime candidates for further, more detailed investigation. To complement our national water stress analysis, we carried out similar analysis with global datasets. The current status of global models means that they provide an even coarser screening tool for drought analysis, and their actual value is likely to depend on local conditions. They have been effectively used at the scale of countries or large river basins, but are of limited use for sub-national drought analysis, especially for small basins.
Finland has an advanced water resource management system, and it has created flood risk management plans for every significant flood risk area. The first step in the process was to choose the significant flood risk areas. Our findings indicate that a similar process should be carried out with drought, and this analysis provides a good starting point for identifying the areas requiring Drought Management Plans (DMPs) to enhance their water security. A good place to implement such plans could be the River Basin Management Plans (RBMPs) within the EU Water Framework Directive.

Supplementary Materials

The following are available online at https://www.mdpi.com/2071-1050/11/6/1548/s1, Excel sheet for maximum WDI value for every sub-basin; Shape-file for sub-basins; CSV of files used from ISIMIP project for global analysis; Total water use in 2010 for each individual global model; Worst case monthly WDI calculations for each individual model for period 1971–2010; Model modules of the WSFS model.

Author Contributions

The authors have contributed to the article accordingly: Conceptualization, L.A. and N.V.; methodology, L.A., N.V., and J.H.A.G. (global models); software, L.A., N.V., and J.H.A.G. (global models); formal analysis, L.A., N.V., and J.H.A.G. (global models); investigation, L.A.; resources, L.A., N.V., and J.H.A.G.; data curation, L.A., N.V., and J.H.A.G.; writing—original draft preparation, L.A.; writing—review and editing, all; visualization, L.A. and J.H.A.G.; supervision, M.K., M.M., and O.V.; project administration, L.A. and M.M.; funding acquisition, M.M., M.K., and O.V.

Funding

This research was funded by Strategic Research Council (SRC) through the Winland project (No 303628 + 303623), Maa-ja vesitekniikan tuki ry. through its Majakka project, Academy of Finland funded project WASCO (grant no. 305471), and Emil Aaltonen Foundation funded project “eat-less-water”.

Acknowledgments

The authors would like to thank Matti Kummu, Jyri Mustajoki, and other Winland colleagues for support, and Amy Fallon and Suvi Ahopelto (Aalto University) for proof-reading the manuscript. We acknowledge the assistance of the facilitators at a workshop on scientific writing, arranged by Aalto University, Helsinki, Finland and IWA/YWP Finland in August 2018.

Conflicts of Interest

The authors declare no conflict of interest.

References

  1. Kummu, M.; Guillaume, J.H.A.; de Moel, H.; Eisner, S.; Flörke, M.; Porkka, M.; Siebert, S.; Ward, P.J. The world’s road to water scarcity: Shortage and stress in the 20th century and pathways towards sustainability. Sci. Rep. 2016, 6, 38495. [Google Scholar] [CrossRef]
  2. Cook, C.; Bakker, K. Water security: Debating an emerging paradigm. Glob. Environ. Chang. 2012, 22, 94–102. [Google Scholar] [CrossRef]
  3. Ministry for Foreign Affairs of Finland; Ministry of Agriculture and Forestry; Ministry of the Environment; Ministry of Social Affairs and Health; Ministry of Economic Affairs and Employment. International Water Strategy Finland; Ministry for Foreign Affairs: Helsinki, Finland, 2018.
  4. Zeitoun, M.; Lankford, B.; Krueger, T.; Forsyth, T.; Carter, R.; Hoekstra, A.Y.; Taylor, R.; Varis, O.; Cleaver, F.; Boelens, R.; et al. Reductionist and integrative research approaches to complex water security policy challenges. Glob. Environ. Chang. 2016, 39, 143–154. [Google Scholar] [CrossRef] [Green Version]
  5. Varis, O.; Keskinen, M.; Kummu, M. Four dimensions of water security with a case of the indirect role of water in global food security. Water Secur. 2017, 1, 36–45. [Google Scholar] [CrossRef]
  6. UN-Water. Water Security and the Global Water Agenda: A UN-Water Analytical Brief; UN-Water Analytical Brief; United Nations University—Institute for Water, Environment and Health: Tokyo, Japan, 2013. [Google Scholar]
  7. World Economic Forum. Global Risks 2011, 6th ed.; Council on Foreign Relations: New York, NY, USA, 2011. [Google Scholar]
  8. Bazilian, M.; Rogner, H.; Howells, M.; Hermann, S.; Arent, D.; Gielen, D.; Steduto, P.; Mueller, A.; Komor, P.; Tol, R.S.J.; et al. Considering the energy, water and food nexus: Towards an integrated modelling approach. Energy Policy 2011, 39, 7896–7906. [Google Scholar] [CrossRef]
  9. Hoff, H. Understanding the nexus. In Bonn 2011 Conference, The Water, Energy and Food Security Nexus: Solutions for the Green Economy, Bonn, Germany; Stockholm Environment Institute: Stockholm, Sweden, 2011. [Google Scholar]
  10. Keskinen, M.; Guillaume, J.; Kattelus, M.; Porkka, M.; Räsänen, T.; Varis, O. The Water-Energy-Food Nexus and the Transboundary Context: Insights from Large Asian Rivers. Water 2016, 8, 193. [Google Scholar] [CrossRef]
  11. Guppy, L.; Mehta, P.; Qadir, M. Sustainable development goal 6: Two gaps in the race for indicators. Sustain. Sci. 2019, 14, 501–513. [Google Scholar] [CrossRef]
  12. Hussein, H.; Menga, F.; Greco, F. Monitoring Transboundary Water Cooperation in SDG 6.5.2: How a Critical Hydropolitics Approach Can Spot Inequitable Outcomes. Sustainability 2018, 10, 3640. [Google Scholar] [CrossRef]
  13. Global Water Partnership Central Easter Europe. Guidelines for the preparation of Drought Management Plans. Development and implementation in the Context of the EU Water Framework Directive; Global Water Partnership Central and Eastern Europe: Bratislava, Slovakia, 2015; p. 48. [Google Scholar]
  14. European Commission. Drought Management Plan Report: Including Agricultural, Drought Indicators and Climate Change Aspects; European Commission: Brussels, Belgium, 2008. [Google Scholar]
  15. Silander, J.; Järvinen, E.A. Vuosien 2002–2003 Poikkeuksellisen Kuivuuden Vaikutukset; Suomen Ympäristö 731; Finnish Environment Institute: Helsinki, Finland, 2004.
  16. Jääskeläinen, J.; Veijalainen, N.; Syri, S.; Marttunen, M.; Zakeri, B. Energy security impacts of a severe drought on the future Finnish energy system. J. Environ. Manag. 2018, 217, 542–554. [Google Scholar] [CrossRef]
  17. Spinoni, J.; Vogt, J.V.; Naumann, G.; Barbosa, P.; Dosio, A. Will drought events become more frequent and severe in Europe? Int. J. Climatol. 2018, 38, 1718–1736. [Google Scholar] [CrossRef]
  18. Natural Resources Institute Finland Press Release: Viljasato yhtä pieni kuin 20 vuotta sitten. (In Finnish). Available online: https://www.luke.fi/uutiset/viljasato-yhta-pieni-kuin-20-vuotta-sitten/ (accessed on 20 December 2018).
  19. Tsakiris, G. Proactive Planning Against Droughts. Procedia Eng. 2016, 162, 15–24. [Google Scholar] [CrossRef] [Green Version]
  20. Xu, H.; Wu, M. Water Availability Indices—A Literature Review; Argonne National Lab.: Argonne, IL, USA, 2017. [CrossRef]
  21. Brown, A.; Matlock, M.D. A review of water scarcity indices and methodologies. White Paper 2011, 106, 19. [Google Scholar]
  22. Rijsberman, F.R. Water scarcity: Fact or fiction? Agric. Water Manag. 2006, 80, 5–22. [Google Scholar] [CrossRef] [Green Version]
  23. Wada, Y.; Beek, L.P.H.; van Viviroli, D.; Dürr, H.H.; Weingartner, R.; Bierkens, M.F.P. Global monthly water stress: II. Water demand and severity of water. Water Resour. Res. 2011, 47. [Google Scholar] [CrossRef]
  24. Brauman, K.A.; Richter, B.D.; Postel, S.; Malsy, M.; Flörke, M. Water depletion: An improved metric for incorporating seasonal and dry-year water scarcity into water risk assessments. Elem. Sci. Anth. 2016. [Google Scholar] [CrossRef]
  25. European Environment Agency. Results and Lessons from Implementing the Water Assets Accounts in the EEA Area; European Environment Agency: Copenhagen, Denmark, 2013. [Google Scholar]
  26. Damkjaer, S.; Taylor, R. The measurement of water scarcity: Defining a meaningful indicator. Ambio 2017, 46, 513–531. [Google Scholar] [CrossRef] [Green Version]
  27. Warszawski, L.; Frieler, K.; Huber, V.; Piontek, F.; Serdeczny, O.; Schewe, J. The inter-sectoral impact model intercomparison project (ISI–MIP): Project framework. Proc. Natl. Acad. Sci. USA 2014, 111, 3228–3232. [Google Scholar] [CrossRef]
  28. Smakhtin, V.; Revenga, C.; Döll, P. A Pilot Global Assessment of Environmental Water Requirements and Scarcity. Water Int. 2004, 29, 307–317. [Google Scholar] [CrossRef]
  29. Veijalainen, N.; Dubrovin, T.; Marttunen, M.; Vehviläinen, B. Climate Change Impacts on Water Resources and Lake Regulation in the Vuoksi Watershed in Finland. Water Resour. Manag. 2010, 24, 3437–3459. [Google Scholar] [CrossRef]
  30. Richts, A.; Vrba, J. Groundwater resources and hydroclimatic extremes: Mapping global groundwater vulnerability to floods and droughts. Environ. Earth Sci. 2016, 75, 926. [Google Scholar] [CrossRef]
  31. Pajula, H.; Triipponen, J. Selvitys Suomen Kastelutilanteesta–Esimerkkialueena Varsinais-Suomi; Suomen Ympäristö 629; Finnish Environment Institute: Helsinki, Finland, 2003.
  32. Lai, T.; Salminen, J.; Jäppinen, J.; Koljonen, S.; Mononen, L.; Nieminen, E.; Vihervaara, P.; Oinonen, S. Bridging the gap between ecosystem service indicators and ecosystem accounting in Finland. Ecol. Model. 2018, 377, 51–65. [Google Scholar] [CrossRef]
  33. Mustonen, S. Sovellettu Hydrologia; Vesiyhdistys r.y: Mänttä, Finland, 1986; p. 503. [Google Scholar]
  34. Pirinen, P.; Simola, H.; Aalto, J.; Kaukoranta, J.; Karlsson, P.; Ruuhela, R. Climatological statistics of Finland 1981–2010 Reports 2012:1; Finnish Meteorological Institute: Helsinki, Finland, 2012.
  35. Helminen, V.; Nurmio, K.; Rehunen, A.; Ristimäki, M.; Oinonen, K.; Tiitu, M.; Kotavaara, O.; Antikainen, H.; Rusanen, J. Urban—Rural Classification; Suomen Ympäristökeskuksen Raportteja 25/2014; Suomen Ympäristökeskuksen: Helsinki, Finland, 2014.
  36. Scherer, L.; Venkatesh, A.; Karuppiah, R.; Pfister, S. Large-Scale Hydrological Modeling for Calculating Water Stress Indices: Implications of Improved Spatiotemporal Resolution, Surface-Groundwater Differentiation, and Uncertainty Characterization. Environ. Sci. Technol. 2015, 49, 4971–4979. [Google Scholar] [CrossRef]
  37. Perry, C. Efficient irrigation; inefficient communication; flawed recommendations. Irrig. Drain. 2007, 56, 367–378. [Google Scholar] [CrossRef] [Green Version]
  38. Huttunen, M.; Vehviläinen, B. Hydrological Forecasting and Real Time Monitoring in Finland: The Watershed Simulation and Forecasting System (WSFS); The Finnish Environment Institute: Helsinki, Finland, 2001. [CrossRef]
  39. Vehviläinen, B.; Huttunen, M.; Huttunen, I. Hydrological forecasting and real time monitoring in finland: The watershed simulation and forecasting system (WSFS). In Proceedings of the Achieving Technological Innovation in Flood Forecasting: International conference on innovation, advances and implementation of flood forecasting technology, Tromso, Norway, 17–19 October 2005; Conference papers. p. 100. [Google Scholar]
  40. Mehta, L. The Manufacture of Popular Perceptions of Scarcity: Dams and Water-Related Narratives in Gujarat, India. World Dev. 2001, 29, 2025–2041. [Google Scholar] [CrossRef]
  41. Mehta, L. Water and Human Development. World Dev. 2014, 59, 59–69. [Google Scholar] [CrossRef] [Green Version]
  42. Edwards, G.A.S. Shifting Constructions of Scarcity and the Neoliberalization of Australian Water Governance. Environ. Plan. A 2013, 45, 1873–1890. [Google Scholar] [CrossRef]
  43. Hussein, H. Whose ‘reality’? Discourses and hydropolitics along the Yarmouk River. Contemp. Levant 2017, 2, 103–115. [Google Scholar] [CrossRef]
  44. Mdee, A. Disaggregating Orders of Water Scarcity—The Politics of Nexus in the Wami-Ruvu River Basin, Tanzania. Water Altern. 2017, 10, 100. [Google Scholar]
  45. Hussein, H. Lifting the veil: Unpacking the discourse of water scarcity in Jordan. Environ. Sci. Policy 2018, 89, 385–392. [Google Scholar] [CrossRef]
  46. VisitFinland. Land of a Thousand Lakes. Available online: https://www.visitfinland.com/article/the-water-of-life/ (accessed on 7 March 2019).
  47. Acreman, M.C.; Dunbar, M.J. Defining environmental river flow requirements? A review. Hydrol. Earth Syst. Sci. Discuss. 2004, 8, 861–876. [Google Scholar] [CrossRef]
  48. Sood, A.; Smakhtin, V. Global hydrological models: A review. Hydrol. Sci. J. 2015, 60, 549–565. [Google Scholar] [CrossRef]
  49. Bêche, L.A.; Connors, P.G.; Resh, V.H.; Merenlender, A.M. Resilience of fishes and invertebrates to prolonged drought in two California streams. Ecography 2009, 32, 778–788. [Google Scholar] [CrossRef]
  50. Bond, N.R.; Lake, P.S.; Arthington, A.H. The impacts of drought on freshwater ecosystems: An Australian perspective. Hydrobiologia 2008, 600, 3–16. [Google Scholar] [CrossRef]
  51. Mekonnen, M.M.; Hoekstra, A.Y. Global Anthropogenic Phosphorus Loads to Freshwater and Associated Grey Water Footprints and Water Pollution Levels: A High-Resolution Global Study. Water Resour. Res. 2018, 54, 345–358. [Google Scholar] [CrossRef] [Green Version]
  52. Vienonen, S.; Rintala, J.; Orvomaa, M.; Santala, E.; Maunula, M. Ilmastonmuutoksen Vaikutukset ja Sopeutumistarpeet Vesihuollossa; Suomen ympäristö 24/2012; Finnish Environment Institute: Helsinki, Finland, 2012.
  53. Kampbell, D.H.; An, Y.; Jewell, K.P.; Masoner, J.R. Groundwater quality surrounding Lake Texoma during short-term drought conditions. Environ. Pollut. 2003, 125, 183–191. [Google Scholar] [CrossRef]
  54. Salmivaara, A.; Porkka, M.; Kummu, M.; Keskinen, M.; Guillaume, H.J.; Varis, O. Exploring the Modifiable Areal Unit Problem in Spatial Water Assessments: A Case of Water Shortage in Monsoon Asia. Water 2015, 7, 878. [Google Scholar] [CrossRef]
  55. Ekholm, M. Suomen Vesistöalueet. In Vesi- ja Ympäristöhallinnon Julkaisuja—Sarja A 126; Vesi ja Ympäristöhallitus: Helsinki, Finland, 1993. [Google Scholar]
  56. Hoekstra, A.Y.; Mekonnen, M.; Chapagain, A.; Mathews, R.E.; Richter, B.D. Global monthly water scarcity: Blue water footprints versus blue water availability. PLoS ONE 2012, 7, e32688. [Google Scholar] [CrossRef]
  57. Alcamo, J.; Döll, P.; Henrichs, T.; Kaspar, F.; Lehner, B.; Rösch, T.; Siebert, S. Development and testing of the WaterGAP 2 global model of water use and availability. Hydrol. Sci. J. 2003, 48, 317–337. [Google Scholar] [Green Version]
  58. Sorvala, S.; Puumala, M.; Lehto, M. Käyttöveden Riittävyys ja Laatu Maatalouden Suurissa Tuotantoyksiköissä; MTT: Vihti, Finland, 2006. [Google Scholar]
  59. Natural Resources Institute Finland. Official Statistics of Finland (OSF): Farmland Management and Irrigation 2016. Available online: https://stat.luke.fi/en/farmland-management-and-irrigation (accessed on 19 December 2018).
  60. Rey, D.; Holman, I.P.; Daccache, A.; Morris, J.; Weatherhead, E.K.; Knox, J.W. Modelling and mapping the economic value of supplemental irrigation in a humid climate. Agric. Water Manag. 2016, 173, 13–22. [Google Scholar] [CrossRef] [Green Version]
  61. Huttunen, I.; Huttunen, M.; Piirainen, V.; Korppoo, M.; Lepistö, A.; Räike, A.; Tattari, S.; Vehviläinen, B. A national-scale nutrient loading model for Finnish watersheds—VEMALA. Environ. Model. Assess. 2016, 21, 83–109. [Google Scholar] [CrossRef]
  62. Tahvonen, R.; Kaukoranta, T.; Väisänen, J.; Salo, T. Peltotohtori Neuvoo Viljelyssä; Maaseudun tulevaisuus: Vihti, Finland, 2003. [Google Scholar]
  63. Solley, W.B.; Pierce, R.R.; Perlman, H.A. Estimated Use of Water in the United States in 1995; U.S. Geological Survey Circular 1200; U.S. Department of the Interior and U.S. Geological Survey: Reston, VA, USA, 1998; p. 86. Available online: https://pubs.er.usgs.gov/publication/cir1200 6.6.2018 (accessed on 6 May 2018).
  64. Dieter, C.A.; Maupin, M.A.; Caldwell, R.R.; Harris, M.A.; Ivahnenko, T.I.; Lovelace, J.K.; Barber, N.L.; Linsey, K.S. Estimated Use of Water in the United States in 2015; U.S. Geological Survey Circular 1441; U.S. Department of the Interior and U.S. Geological Survey: Reston, VA, USA, 2018; p. 65. [CrossRef]
  65. Kuusisto, E. The Water Cycle, Hydrological service in Finland 1908–2008; Finnish Environment Institute: Helsinki, Finland, 2008; p. 176.
  66. Veijalainen, N.; Ahopelto, L.; Marttunen, M.; Jääskeläinen, J.; Britschgi, R.; Orvomaa, M.; Belinskij, A.; Keskinen, M. Severe drought in Finland: Modeling effects on water resources and assessing climate change impacts. 2019; in review. [Google Scholar]
  67. Mikkonen, S.; Laine, M.; Mäkelä, H.; Gregow, H.; Tuomenvirta, H.; Lahtinen, M.; Laaksonen, A. Trends in the average temperature in Finland, 1847–2013. Stoch. Environ. Res. Risk Assess. 2015, 29, 1521–1529. [Google Scholar] [CrossRef]
  68. Veijalainen, N.; Lotsari, E.; Alho, P.; Vehviläinen, B.; Käyhkö, J. National scale assessment of climate change impacts on flooding in Finland. J. Hydrol. 2010, 391, 333–350. [Google Scholar] [CrossRef]
  69. Gosling, S.; Müller Schmied, H.; Betts, R.; Chang, J.; Ciais, P.; Dankers, R.; Döll, P.; Eisner, S.; Flörke, M.; Gerten, D.; et al. ISIMIP2a Simulation Data from Water (global) Sector. GFZ Data Services, 2017. [Google Scholar] [CrossRef]
  70. Döll, P.; Lehner, B. Validation of a new global 30-min drainage direction map. J. Hydrol. 2002, 258, 214–231. [Google Scholar] [CrossRef]
  71. Finnish Environment Institute. Press Release (In Finnish): Lounais-, Länsi- ja Keski-Suomessa Pohjaveden Pinnat Alhaalla, Yksittäisissä Kaivoissa vesi voi Kevääseen Mennessä Loppua. Available online: http://www.syke.fi/fi-FI/Ajankohtaista/Lounais_Lansi_ja_KeskiSuomessa_pohjavede%2848557%29 (accessed on 20 December 2018).
  72. Porkka, M.; Guillaume, J.H.A.; Siebert, S.; Schaphoff, S.; Kummu, M. The use of food imports to overcome local limits to growth. Earth’s Future 2017, 5, 393–407. [Google Scholar] [CrossRef] [Green Version]
  73. Ministry of Agriculture and Forestry. Finland’s National Climate Change Adaptation Plan 2022; Ministry of Agriculture and Forestry: Wellington, New Zealand, 2014; p. 42.
  74. Sojamo, S.; Ahopelto, L.; Marttunen, M.; Belinskij, A.; Veijalainen, N.; Keskinen, M. Water security—What does it mean for Finland? Vesitalous 2017, 6, 20–24. (In Finnish) [Google Scholar]
  75. Aaltonen, J.; Parjanne, A.; Huokuna, M. Implementation of EU Floods Directive in Finland—Lessons Learned ans Steps towards Resilient Planning. 2017. Available online: https://www.ymparisto.fi/download/noname/%7BD63A26CB-33EC-4E85-85EC-EA4B3837E93C%7D/132735 (accessed on 13 March 2019).
  76. Tortajada, C.; Kastner, M.J.; Buurman, J.; Biswas, A.K. The California drought: Coping responses and resilience building. Environ. Sci. Policy 2017, 78, 97–113. [Google Scholar] [CrossRef]
Figure 1. Steps of the analysis for (a) WDI (Water Depletion Index) analysis with national statistics and (b) WDI analysis with global models.
Sustainability 11 01548 g001
Figure 2. (a) Average annual evaporation sum in 1951–1980 (mm) (adapted from [33]), (b) average annual uncorrected precipitation sum in 1981–2010 [34], and (c) urban-rural areas [35] of Finland.
Sustainability 11 01548 g002
Figure 3. Percentage of Finnish population living in sub-basins that are above three Water Depletion Index (WDI)-thresholds (20%, 40%, and 75%) during the reference drought event.
Sustainability 11 01548 g003
Figure 4. Maximum monthly WDI values during the reference drought period and locations for largest water withdrawing industries.
Sustainability 11 01548 g004
Figure 5. Cumulative change of the lake storage during the reference drought.
Sustainability 11 01548 g005
Figure 6. Water Depletion according to global models: Number of estimates reporting WDI > 20%, using 3 climate datasets and 3 global models (9 estimates) for the period 1971–2010.
Sustainability 11 01548 g006

