Article

High-Speed Railway and City Tourism in China: A Quasi-Experimental Study on HSR Operation

Business School, Xiangtan University, Xiangtan 411105, China
Sustainability 2019, 11(6), 1512; https://doi.org/10.3390/su11061512
Submission received: 13 February 2019 / Revised: 9 March 2019 / Accepted: 9 March 2019 / Published: 13 March 2019
(This article belongs to the Special Issue High Speed Rail and Tourism)

Abstract

:
This paper aims to provide an examination of the general and heterogeneous allowed treatment effects of high-speed rail (HSR) on tourism in cities in China. Based on the implementation of a generalized difference-in-differences (GDID) model and a dose–response (DR) assessment under a quasi-experimental background, this study found significant evidence of a positive average effect of HSR operation on tourism development for both domestic and international tourism. The event study indicates that the counterfactual method implied in this paper is valid, since the parallel trend assumption is confirmed, and the treatment effect of HSR on city tourism has an upwardly increasing trend over time. The heterogeneity test, which separates large cities from medium-sized and small cities, shows that the effect is quite different for the two city types; the effect is not optimistic for large cities, but it is consistently positive for medium-sized and small cities. As an original contribution, this paper conducts a DR study, allowing heterogeneous treatment effects to be captured when cities have different HSR development statuses. This novel method relaxes the strong assumption that there is only one effect level on average for all cities. The results argue that cities with higher HSR development will enjoy more benefits in terms of arrivals and revenues both from home and abroad; however, there are significant differences for the two city groups, as well as for domestic and international tourism. Thus, the findings can offer important information for policy decision making and serve as a valuable reference for research, especially regarding the conclusion drawn from the heterogeneity effect based on city size and HSR development status.

1. Introduction

High-speed rail (HSR) construction has been one of the most remarkable moves taken by the Chinese government in the past 10 years [1], and the tourism industry, which is strongly tied to transportation infrastructure [2], is absolutely correlated with HSR. Previous studies have shown that HSR is viewed as an important tool for the central government to reshape the spatial economy across regions, and it is closely and unquestionably associated with the local development of China; “HSR hot” (Gao Tie Re) brings major changes to tourism development across Chinese regions [1]. With its high speed, HSR has significantly shortened the travel time between cities and regions; thus, it is believed that the spillover effects of these rail networks will bring certain benefits and advantages for both tourists and the development of the tourism industry [3]. Thus, in general, HSR operations have had a positive effect on the tourism economy; however, whether the increase in the number of tourists can be attributed to HSR operation remains unclear [4], and the precise effect of HSR is a much-debated topic in academic papers. Therefore, an empirical evaluation is urgently needed, and the same is true for China. Accordingly, the major work of this paper is to provide an empirical test of the influence of this specific type of infrastructure, taking the operation of HSR as a quasi-experiment under a generalized difference-in-differences (GDID) model and using panel data on more than 300 Chinese cities from 2003 to 2015.
Previous studies have reported the contribution of HSR to tourism based on samples from France, Spain, Japan, and other countries from different perspectives [5], such as the spatial distribution of tourism, regional tourism development, and tourist behavior. The main results convey two contrasting ideas: (a) HSR has positive effects on tourism, and (b) HSR has negative effects on tourism. We argue that the main shortcoming of these studies is that the results may be biased, because the heterogeneity in their studies is neglected, which might be due to the scarcity of datasets or the econometric methods. Additionally, the intervention effects underlying these defects are still poorly discussed in the case of China. HSR might rank first from the perspective of tourism for China regions and cities today, and its underlying treatment effects are clearly heterogeneous across cities. Regarding the number of visitors received by cities, Albalate et al. noted that HSRs matter for tourism arrivals [4], and are particularly relevant for China, which has the largest HSR network worldwide. In terms of linking cities, with 92 lines/sections in operation and a total operating mileage of nearly 30,000 km as of the end of 2018, HSR has distinctive advantages because of its reliability and efficiency and for extending space in China. Therefore, determining the effect of HSR on tourism is crucial for officials to promote regional tourism development. A large body of studies has explored how tourist arrivals are influenced by factors such as travel price, the exchange rate, and fundamental services [6], and previous studies have reported that transportation infrastructure is one of the most prominent factors. Seetanah et al. believed that HSR could enhance the accessibility of different destinations for tourists [4,7]. However, little attention has been paid to the linkages between HSR transport and tourism in Chinese cities [8]. Existing statements mainly focus on tourist behavior and tourism-associated externalities [9,10]. For example, some authors have investigated tourist behavior following the opening of a new highway [11], while others have explored the impact of tourist demand on public transport services [12]. A few studies focusing on HSR have gradually been developed; according to these, HSR modifies the link between tourists and accessibility [13], and HSR brings more tourists to cities [14]. According to Chen and Haynes, HSR is likely to bring an additional increase in arrivals and tourism revenues for Chinese provinces [15]. Bazin et al. argued that HSR has good performance in forecasting short-stay tourism [16]. In addition, studies have also claimed that the HSR operation could foster tourists’ intention to revisit a specific destination [8], and that HSR plays an important role in affecting tourism choice [17]. Some basic conclusions about HSR and tourism are summarized; nonetheless, little is known about the heterogeneity of the treatment effects of HSR on tourism, especially in the case of China.
Existing accounts have mainly focused on changes in tourism behavior from individual views or on the determination of tourism destination choices. Academic works surveying the treatment effects of HSR on tourism are woefully inadequate in the case of China at the city level, which is precisely the gap that this paper intends to fill. As our major contribution, we estimate the average and the heterogeneous treatment effects of HSR on tourism, treating HSR operation as an exogenous intervention. However, the effects of transportation on tourism may differ across cities of different sizes [13]. To deal with the potentially heterogeneous manifestation of effects across cities, one key component that makes our paper more interesting than existing works is that the city classification of Chinese cities is first introduced to obtain an objective description of the rank and scale of cities. In the list of this classification, cities are clearly separated into large cities and medium-sized or small cities. To obtain a precise estimator with multiple shock time points, we apply a GDID model [18] rather than a standardized difference-in-differences (DID) model with only two periods, such as that in Card and Krueger [19]. As an original contribution, except for the binary dummy variable indicating with or without the HSR intervention, a surprising variable referring to the number of HSR lines/stations is introduced into our model to identify the HSR development level of cities, which is a nonbinary but consecutive integer, and which we call a “dose”. That is, this paper also aims to portray the different ways in which a new and appropriate method, called dose–response (DR) assessment (DR assessment is a way to quantitatively describe the relationship between the intensity of a treatment regimen (the dose) and the likelihood of the effects (the responses). It was first used in medicine and then in economics; the Stata code for DR assessment was written by Giovanni Cerulli from the National Research Council of Italy), is adopted to estimate the heterogeneous effects caused by HSR, since cities may react heterogeneously to observable treatment levels. Originally, this novel approach was mainly used in testing drug reactions in the medicine field; as a methodological innovation for comparison, we apply it to estimate a dose–response function (DRF) of the effects of HSR on tourism. In this way, it relaxes the assumption that all cities in China share the same quantity treatment effect of HSR operation, making the empirical evidence more reliable and realistic, which is another key component that makes our work a seminal study in the comparative literature.
The structure of this paper is organized as follows. Section 2 provides a literature review on the impact of HSR on tourism. Section 3 contains the identification strategy with the quasi-experiment, as well as the way in which we treat HSR development as a dose; then, a simple description of the variables and data sources is presented. In Section 4, we perform the estimations and subsequently discuss the findings. Finally, Section 5 is devoted to our conclusions.

2. Literature Review

Tourism is an important type of economic component, and it is strongly and particularly linked with HSR [20], especially in countries, cities, or regions that hold objective tourism shares in economic development. Studies have been carried out to estimate the influences of HSR on tourism and the economy using datasets from different countries [8,14,17,21,22,23]. Some of them focused on the relationship between different types of transportation, such as rail and air, and found that HSR produces both substitution and complementarity effects on tourism [24,25,26,27], and has a positive overall effect, increasing tourist arrivals. In regard to overall economic development, the results show that HSR has mixed and conditional effects when referring to different countries, regions, and cities, owing to the varied economic externalities resulting from HSR operation [21]. A major study recognizes the critical role played by HSR in the development of the local economy. For example, Gutiérrez et al. [28] found that spatial spillover effects have a large impact on cities along HSR lines, but that they are not necessarily positive. Qin [29] examined the distributional impacts of train speed upgrades in China using a dataset of counties; the study found a negative effect in which Chinese counties suffered from reductions in economic growth, but heterogeneous effects across sectors. Therefore, the tourism economy of cities will change as the overall growth responds to HSR operation.
Regarding the relationship between HSR and tourism, the vast majority of researchers have failed to reach consensus regarding the positive treatment effect, even though many of them support this view. In terms of positive effects, existing research recognizes the critical role played by the HSR network in improving tourism accessibility and increasing tourism demand [13,16,30,31,32] by decreasing the travel time. Campa and López-Lambas [33] provided highly conspicuous and positive empirical evidence of the effects of HSR on Spanish international tourism, and the same effects hold true for China [5,34]. HSR operation has also fueled a boom in the day-trip market. Masson and Petiot [14] tested tourism attractiveness changes using the case of HSR between Perpignan and Barcelona. The results show that HSR enhanced tourism market development, and in particular, increased the number of tourists with regard to shopping, going on holiday, and visiting family and friends. Pagliara and Pietra [8] found that HSR increases the number of international visitors to nearby cities. Gao et al. [24] found that the HSR dose has a positive effect on increasing the number of arrivals, but has no significant effect with regard to tourism revenue growth. In addition, investigating tourism behavior, Bazin et al. [16] found that tourists are highly likely to choose HSR for the sake of avoiding congestion and enjoying comfortable travel. Wang et al. [35] conducted an individual survey of Chinese tourists and found that higher-income and higher-educated people are the main body of tourists, and they showed higher rates of travel when HSR becomes available. Thus, HSR has been a prominent policy tool of transportation that directly and fundamentally affects the degree of regional development and tourism [36,37], making tourist destinations much more convenient and accessible by compressing the travel time.
However, there have also been some negative conclusions regarding the effect of HSR on tourism. Albalate and Fageda [21] found a suggested negative indirect effect through air traffic and a weak direct effect of HSR on tourist outcomes; thus, the net treatment effect is not consistently positive. Albalate et al. [4] carried out a case study of Spanish HSR (Alta Velocidad Española, AVE) using data on 124 municipalities from 2005 to 2012, and found that the treatment effect of AVE is extremely weak under empirical testing. Pagliara and Pietra [8] argued that for European countries, HSR has little impact on international tourism, since tourists mostly travel by air. From the perspective of overnight stays, HSR plays a reduction role in the stay length of tourists [38]. Yin et al. [5] reviewed the studies arguing for a nonpositive impact of HSR on tourism, and found that HSR is less likely to intervene in international tourism. Moreover, HSR has a negative impact on immigrants in Madrid through substitution, subsequently leading to tourism degradation [21].
Why is there opposing evidence? The reason may essentially lie with the city rank gradient, which portrays the size and the status (both economic and political) of cities. As noted by Delaplace [13], city size appears to be a determinant of the effect of HSR on tourism. Considering the core–periphery model [39], and consistent with other analytical studies focusing on the economic effects of HSR, such as Qin [29] and Zheng and Kahn [40], studies have also shown that the agglomeration effect of HSR is central city polarized [24,41,42]. In other words, heterogeneous effects might exist across cities. Masson and Petiot [14] have even tested this kind of impact using European data. Furthermore, Wang et al. [43] found a Matthew effect for large and core cities, and others have argued for a limited promotion effect on international tourism [15,34]. Considering both core and peripheral areas, it has been claimed that Paris has enjoyed a significant centralizing effect from France’s HSR network [13]. Wang et al. [44] showed an increased level of local tourism competition due to HSR in China, and EI-Geneidy et al. [45] suggested that HSR operation might lead to a new spatial inequity in tourism, it could also happen in China.
From a methodological perspective, the literature has documented that the DID model is an accessible and well-defined model for identifying the effects of HSR on tourism; accordingly, this counterfactual analysis model has been widely used [4,21,34]. However, HSR may not be a policy intervention that is exogenous and clearly identical to a two-period model in China, because HSR stations are not opening in the same year. Thus, an identification strategy such as that of Autor [46], who uses the GDID framework, is introduced into our analysis. Furthermore, DR analysis is applied to describe the heterogonous treatment effect of HSR on the tourism of Chinese cities since, intuitively, the economic implications for cities vary by their different conditions and HSR transport infrastructure endowments.

3. Methodology and Data

3.1. Background and Identification Strategy

The goal of this paper is to reveal the treatment effects of HSR on tourism across China cities. Specifically, HSR operation may enhance tourism development, as travel becomes easier. To test the performance of the effects of HSR on cities, the GDID strategy is applied and modified to estimate the potential changes in tourism outcomes before and after HSR operation, which is a quasi-experimental approach. In China, over several rounds of railway acceleration spanning the 1997–2007 period, China’s National Railway Administration began building more advanced and faster HSR networks, with speeds reaching 200 to 350 km/h, to develop the spatial economy across regions. Since the “Medium and Long-term Railway Network Plan” was formulated, there has been an HSR construction boom in China [47]. By the end of 2018, China’s HSR mileage had reached 29,000 km, and nearly 80% of major cities were covered. This network is expected to shorten the time distances between adjacent cites [48], which could substantially make travel more convenient for tourists.
Previous studies argued that the operation of HSR in China could be viewed as a quasi-experiment [29,49] for two main reasons. First, the National Development and Reform Commission and the National Railway Administration determine the construction of HSR lines and stations; local governments (provincial or municipal) do not have this discretionary power [50]. Second, the purpose of HSR networks is to link regional central cities, as a result of which most cities along HSR routes are not treated, owing to their own characteristics [29]. Therefore, HSR can be roughly considered exogenous, and under a quasi-experimental framework, we can then estimate the effects of HSR on tourism using data on Chinese cities.
Although HSR brings benefits with respect to the connections between cities, the treatment effects on cities still need to be tested in an empirical context, especially for cities of varying sizes. Following classic papers, such as that by Moser and Voena [51], the DID method is a counterfactual and appropriate way to identify the average treatment effects for cities with or without the HSR intervention. Traditionally, this method will make sense when we know the performance in both the preintervention state and the postintervention time [19]. However, in our case, there is still some difficulty in valuing the net effect from the improvement of HSR infrastructure, because not all cities experience the HSR treatment at the same time point in China. As a solution, we turn to the GDID model [18,46]. Under this new framework, we then compute the net effect through the interaction term of two dummy variables: a dummy variable indicating the HSR treatment, and a dummy variable indicating the postintervention period, with time and individual fixed effects controlled using a high-degree fixed effect regression command in Stata 15.1. According to Section 2, HSR is generally expected to be an advanced provision of appropriate transportation facilities for regional development and tourism growth.
The estimation equation can be expressed as follows:
t o u r i s m i t = ρ + β × H S R i × P o s t t + X i t B + α i + θ t + ε i t ,
where tourism is the outcome variables of city i at time t. In this paper, we use two categories of outcome variables: (a) the number of domestic tourists and the revenue from domestic tourists, which are denoted by ndt and rdt, respectively, and (b) the number of international tourists and the revenue from international tourists, which are denoted by nit and rit, respectively.
HSR × Post is the double-difference term of the GDID model, where HSR denotes whether city i has at least one HSR line/station in operation or not during our research period, and Post denotes the state before and after the HSR intervention for each year. X is a vector that contains control variables such as the population size (pop), city area (area), economic development level (pgdp), road mileage (road), income level (inc), and living expenses of urban residents (living). We also considered the political factor using a dummy variable to indicate the change in government leaders, which is denoted by DCG. To estimate the effects more precisely, we need to control not only the economic factors mentioned above, but also the attractiveness of a city as a tourism destination, since tourism assets may attract tourists. Accordingly, the number of 5A (AAAAA) scenic spots (5A) and World Heritage Sites (heritage) are included, referring to Gao et al. [24]. In the same vein, to obtain improved estimation results, we include air (the logarithm of air passenger trips) as another control variable to measure alternative connectivity and/or accessibility for both domestic and foreign visitors (I would like to thank the anonymous reviewer for the insightful comments and suggestions here.); B is the corresponding vector of the coefficients. This equation controls the fixed effects at the city and year levels, which are denoted by terms αi and θt, respectively.
For a DID model, especially for a multiple-period panel data situation, there has long been a critical discussion over whether the parallel trend hypothesis is a prerequisite. In other words, the tourism development of cities with HSR should share the same trend over time with cities without HSR; only in this way can we reach an unbiased causality effect from experiencing the intervention of HSR. To provide a robust and visualized check, we show a graphical representation of the time trend and apply an event study model. Accordingly, we generate an event time variable, which is denoted by τ, and indicates the relative time to the initial HSR operation; τ equals 0 for the first year of HSR operation, and τ is negative before HSR operation and positive after HSR operation. For example, if HSR begins operating in city i in 2008, τ equals −2 in 2006, and 2 in 2010. Then, we use the indicator 1{τ = k} to replace the original term Post; 1{τ = k} is equal to one when τ = k, otherwise, it is zero. In this way, an event study graph that plots the dynamic effects of HSR on tourism performance can be derived from the following model:
t o u r i s m i t = ρ + k = m q β k × H S R i × 1 { τ   =   k } + X i t B + α i + θ t + ε i t .
If the cities in the control group and treatment group have similar preintervention trends in terms of tourism or the coefficients before HSR operation are nonsignificant, then the parallel trend assumption is confirmed. More details about the test results are discussed below in Section 4.

3.2. Data and Variables

To estimate the effect of HSR on cities, we compare the tourism performance of cities with and without HSR operation from 2003 to 2015. Therefore, the railway status information of prefecture-level cities is needed, and this paper collected HSR data in two steps. In the first step, we collected the construction and operation information on HSR lines announced by the State Railway Corporation since 2003. In the second step, we counted the number of HSR lines/stations of each city based on information released by China’s National Railway Administration and www.12306.cn, the official railway administration and train ticket website. Then, a dataset including the name and operation time of the cities affected by HSR was constructed. In addition, the HSR development level was also collected for more in-depth purposes, using the number of lines/stations as the proxy for this development level; for each additional line or stop in operation, one will be added to its value.
For the city statistics data, these data are collected from the China Regional Economic Database provided by Easy Professional Superior (EPS). EPS gathers data from the National Bureau of Statistics and provides statistics on more than 400 prefecture-level cities in 31 provinces, in terms of industry, agriculture, education, public health, the overall economy, capital construction, and social security, as well as the tourism term discussed. With such coverage, users can apply these data in their studies and analyses, which, in turn, helps to obtain the dynamics and trend of development. The data of 5A scenic spots and the world heritage sites are collected based on “The List of China National 5a Scenic Spots in 2018” and the “World Heritage tentative list in China in 2018”, both of which reported the year of assessment for each spot or heritage. To control the impact of air service, this paper collected the “Chinese Airport Data and Rankings” from 2003 to 2017.
Furthermore, since we group cities into large cities and medium-sized or small cities, what are the criteria? To obtain objective criteria, we refer to a credible and relatively authoritative report, the “Complete List of the Classification of Chinese Cities in 2017 (including 338 Prefecture-level Cities)”. This report was issued by the Rising Lab of China Business News Weekly (CBNW) and provides a five-level classification of cities in China based on an index algorithm considering five first-level indicators: the business resource agglomeration index, city hub index, city people activity index, lifestyle diversity index, and future plasticity index. More details about the index algorithm can be found in Appendix A. The cities listed in classes 1 and 2 are mostly central cities, provincial capital cities, vice-provincial cities, or cities with a higher development capacity, while the cities listed in the remaining classes are clearly not leading cities in regions, regardless of their economic or social characteristics. Therefore, this report provides us with a more comprehensive criterion to distinguish cities into two groups by regarding the cities in classes 1 and 2 as large cities and the cities in classes 3 to 5 as medium-sized and small cities. Accordingly, the final sample contains 49 large cities and 276 medium-sized or small cities.
Based on the major data sources above, the city-level panel is matched using city names, and Table 1 presents the definitions and descriptive statistics of the various variables. Figure 1 illustrates the difference between the two groups, taking domestic and international tourist arrivals as an example. On the one hand, the average tourism development level of the two groups shows a common trend before HSR operation; on the other hand, there are differences for large cities and medium-sized or small cities in terms of their tourism scales and volatilities. In addition, there seems to be little difference in domestic tourist arrivals for large cities, but there is a significant difference for medium-sized and small cities. Visual inspection suggests that HSR may bring benefits for large cities, but harm medium-sized and small cities. Certainly, this suggestion is based merely on visual inspection, and it is not necessarily accurate; thus, econometric analysis is conducted to provide a detailed discussion.

4. Results and Discussion

4.1. Generalized Difference-in-Differences Estimation
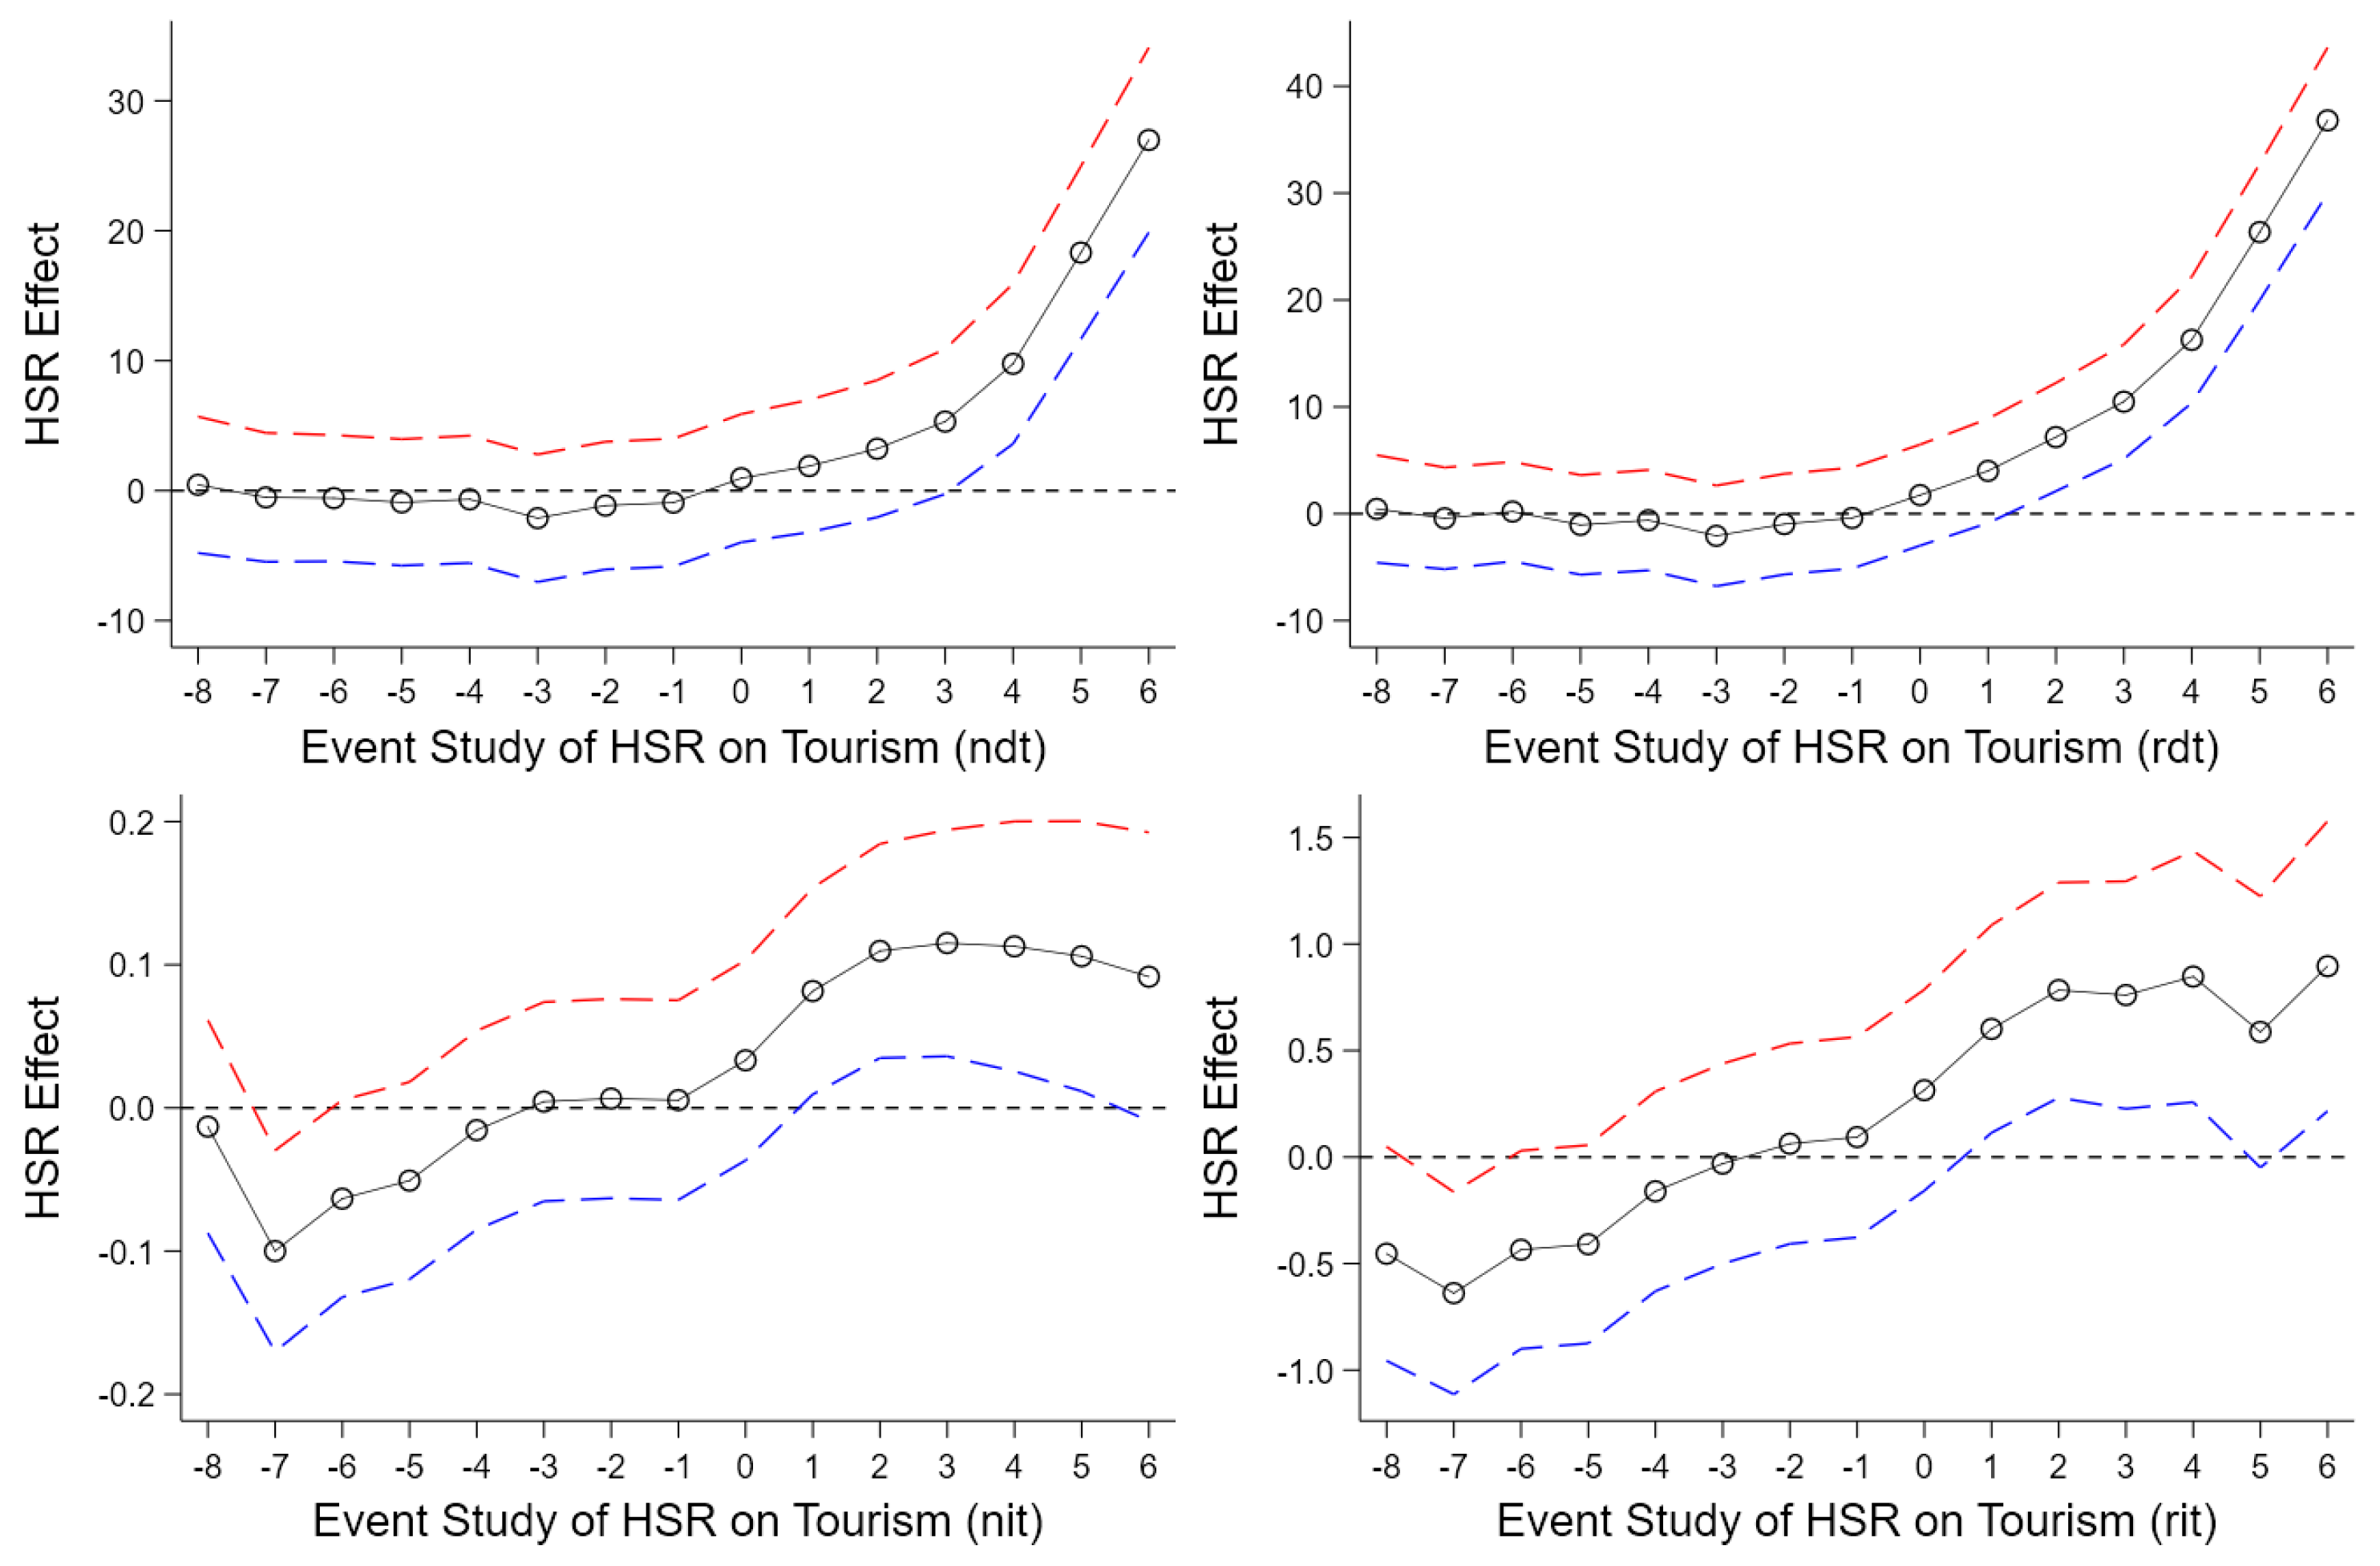
First, we estimated Equation (1) to provide several baseline results by considering four outcome variables: the number of domestic tourists, domestic tourism revenue, the number of international tourists, and international tourism revenue. With the interaction term HSR × Post, Table 2 shows that the treatment effects are significantly positive overall both without and with the control variables overall, and these results are maintained and robust for both domestic and international tourism and for both the number of tourists and tourism revenue. This finding indicates that in general, HSR operation has a remarkably positive effect on city tourism. HSR operation causes domestic tourist arrivals to increase by 3.41 million and international arrivals to increase by 0.05 million; additionally, tourism revenue increased by 2.94 billion and 0.40 billion yuan for domestic and foreign tourism, respectively. This result is consistent with Gao et al. [24], who found that arrivals increased, but the tourism revenue differed. These authors did not think that HSR brought benefits for tourism revenue. However, our result is not contradicted by the mechanisms that have previously been studied; for example, Chen and Haynes [15] argued that HSR will lead to an increase in tourism revenues, owing to its superiority.
For the control variables, there is a sharp decline in the coefficient of HSR × Post after the intervention, which means that the effects of HSR would be overvalued without controls. Among the control variables, population has a significant effect on both tourist arrivals and tourism revenue. The city area seems to have little impact on tourism, with the coefficients of area being nonsignificant. The development level pgdp seems to have little impact on arrivals, but it has a notable impact on revenues: for ndt and nit, the coefficient of pgdp is not significant, but for rdt and rit, it is significant at the levels of 1% and 5%, respectively. That is, for every 10,000 yuan increment in gross domestic product (GDP) per capita, cities will receive 0.74 billion and 0.04 billion yuan from domestic and international tourism, respectively. Road mileage is a meaningful factor that stimulates tourist arrivals and revenues from home rather than abroad, with coefficients that are significant for domestic tourism but nonsignificant for international tourism, which might indicate the existence of short trips. Income level has positive and significant overall effects at the 1% level; a higher income usually means a better city, and will make a city more attractive. On average, every 10,000 yuan increment in income will cause increases in arrivals of 14.21 million and 0.13 million from home and abroad, respectively. However, the coefficients of living consumption expenditure are negative for domestic tourism, but nonsignificant for international tourism. Furthermore, tourism assets such as 5A scenic spots and World Heritage Sites have positive impacts on both tourism arrivals and revenues, but we do not find significant impacts of air passenger trips on tourism when the variables listed in Table 1 are controlled.

4.2. Event Study

The event study will provide estimators representing the trends of the treatment effects of an intervention on time lines. Based on Equation (2), we estimated and plotted the event study coefficients and their 95% confidence intervals within a 15-year time window, as shown in Figure 2. This method is the second way in which we conducted our parallel trend test.
In Figure 2, each graph corresponds to the four tourism outcome variables, i.e., number of domestic tourists (billion persons) (ndt), domestic tourism revenue (billion yuan) (rdt), number of international tourists (billion persons) (nit), and international tourism revenue (billion yuan) (rit), all of which support the validity of the GDID model, since almost all of the coefficients are nonsignificant before τ = 0, which indicates that the parallel trend assumption is confirmed. The plots also suggest that there is a significant increase in the effects on tourism development after HSR operation, which is consistent with the previous estimation. In addition, the effect of HSR on tourism clearly increases over time. Furthermore, we can obverse a slight drop in foreign tourism in recent years, which may have some relationship with changes in the global economy.

4.3. Heterogeneity

As pointed out previously, city size matters in the performance of tourism as affected by HSR. Thus, we group cities into large cities and medium-sized or small cities; then, heterogeneity estimators are calculated for each subsample. The results are presented in Table 3. Columns (1) to (4) show that, using the large city sample, neither domestic nor international tourist arrivals suffer a significant effect from HSR; however, the HSR dose affects international tourism revenue, which indicates that foreign arrivals are likely to spend more money in large cities, and that domestic tourists seem unlikely to visit large cities as a result of HSR. Regarding the effect of HSR operation on tourism for medium-sized and small cities, based on columns (5) to (8), we observe size heterogeneities across cities. Specifically, HSR promotes the number of arrivals both from home and from abroad for medium-sized and small cities by 2.92 million and 0.01 million, respectively, and this effect is significant at the 1% level; additionally, HSR increases domestic tourism revenue, but not international tourism revenue. The compared results indicate that as a result of HSR operation, peripheral cities are more likely to be visited by both residents and foreigners, which is consistent with the case of Spain [8]. Our findings support the work of Albalate et al. [12] partly because the impacts of HSR on larger cities are limited. Moreover, there are some new findings: HSR has heterogamous effects on revenue, and there may be some interlinkages between large cities and medium-sized and small cities, as the choice behavior with regard to the tourism destination changes because of HSR.
However, there may be further heterogeneity due to HSR development itself, which has rarely been discussed; that is, the different statues of HSR in cities should have varied effects on tourism. For example, both Shanghai and Xiangtan have HSR in operation, but the former is a large city with eight lines/stations, whereas the latter is a class 4 small city with only one HSR station. It would be unreasonable to assume that they experience the same effect from HSR. The following section performs a DR analysis to capture these kinds of heterogeneities.

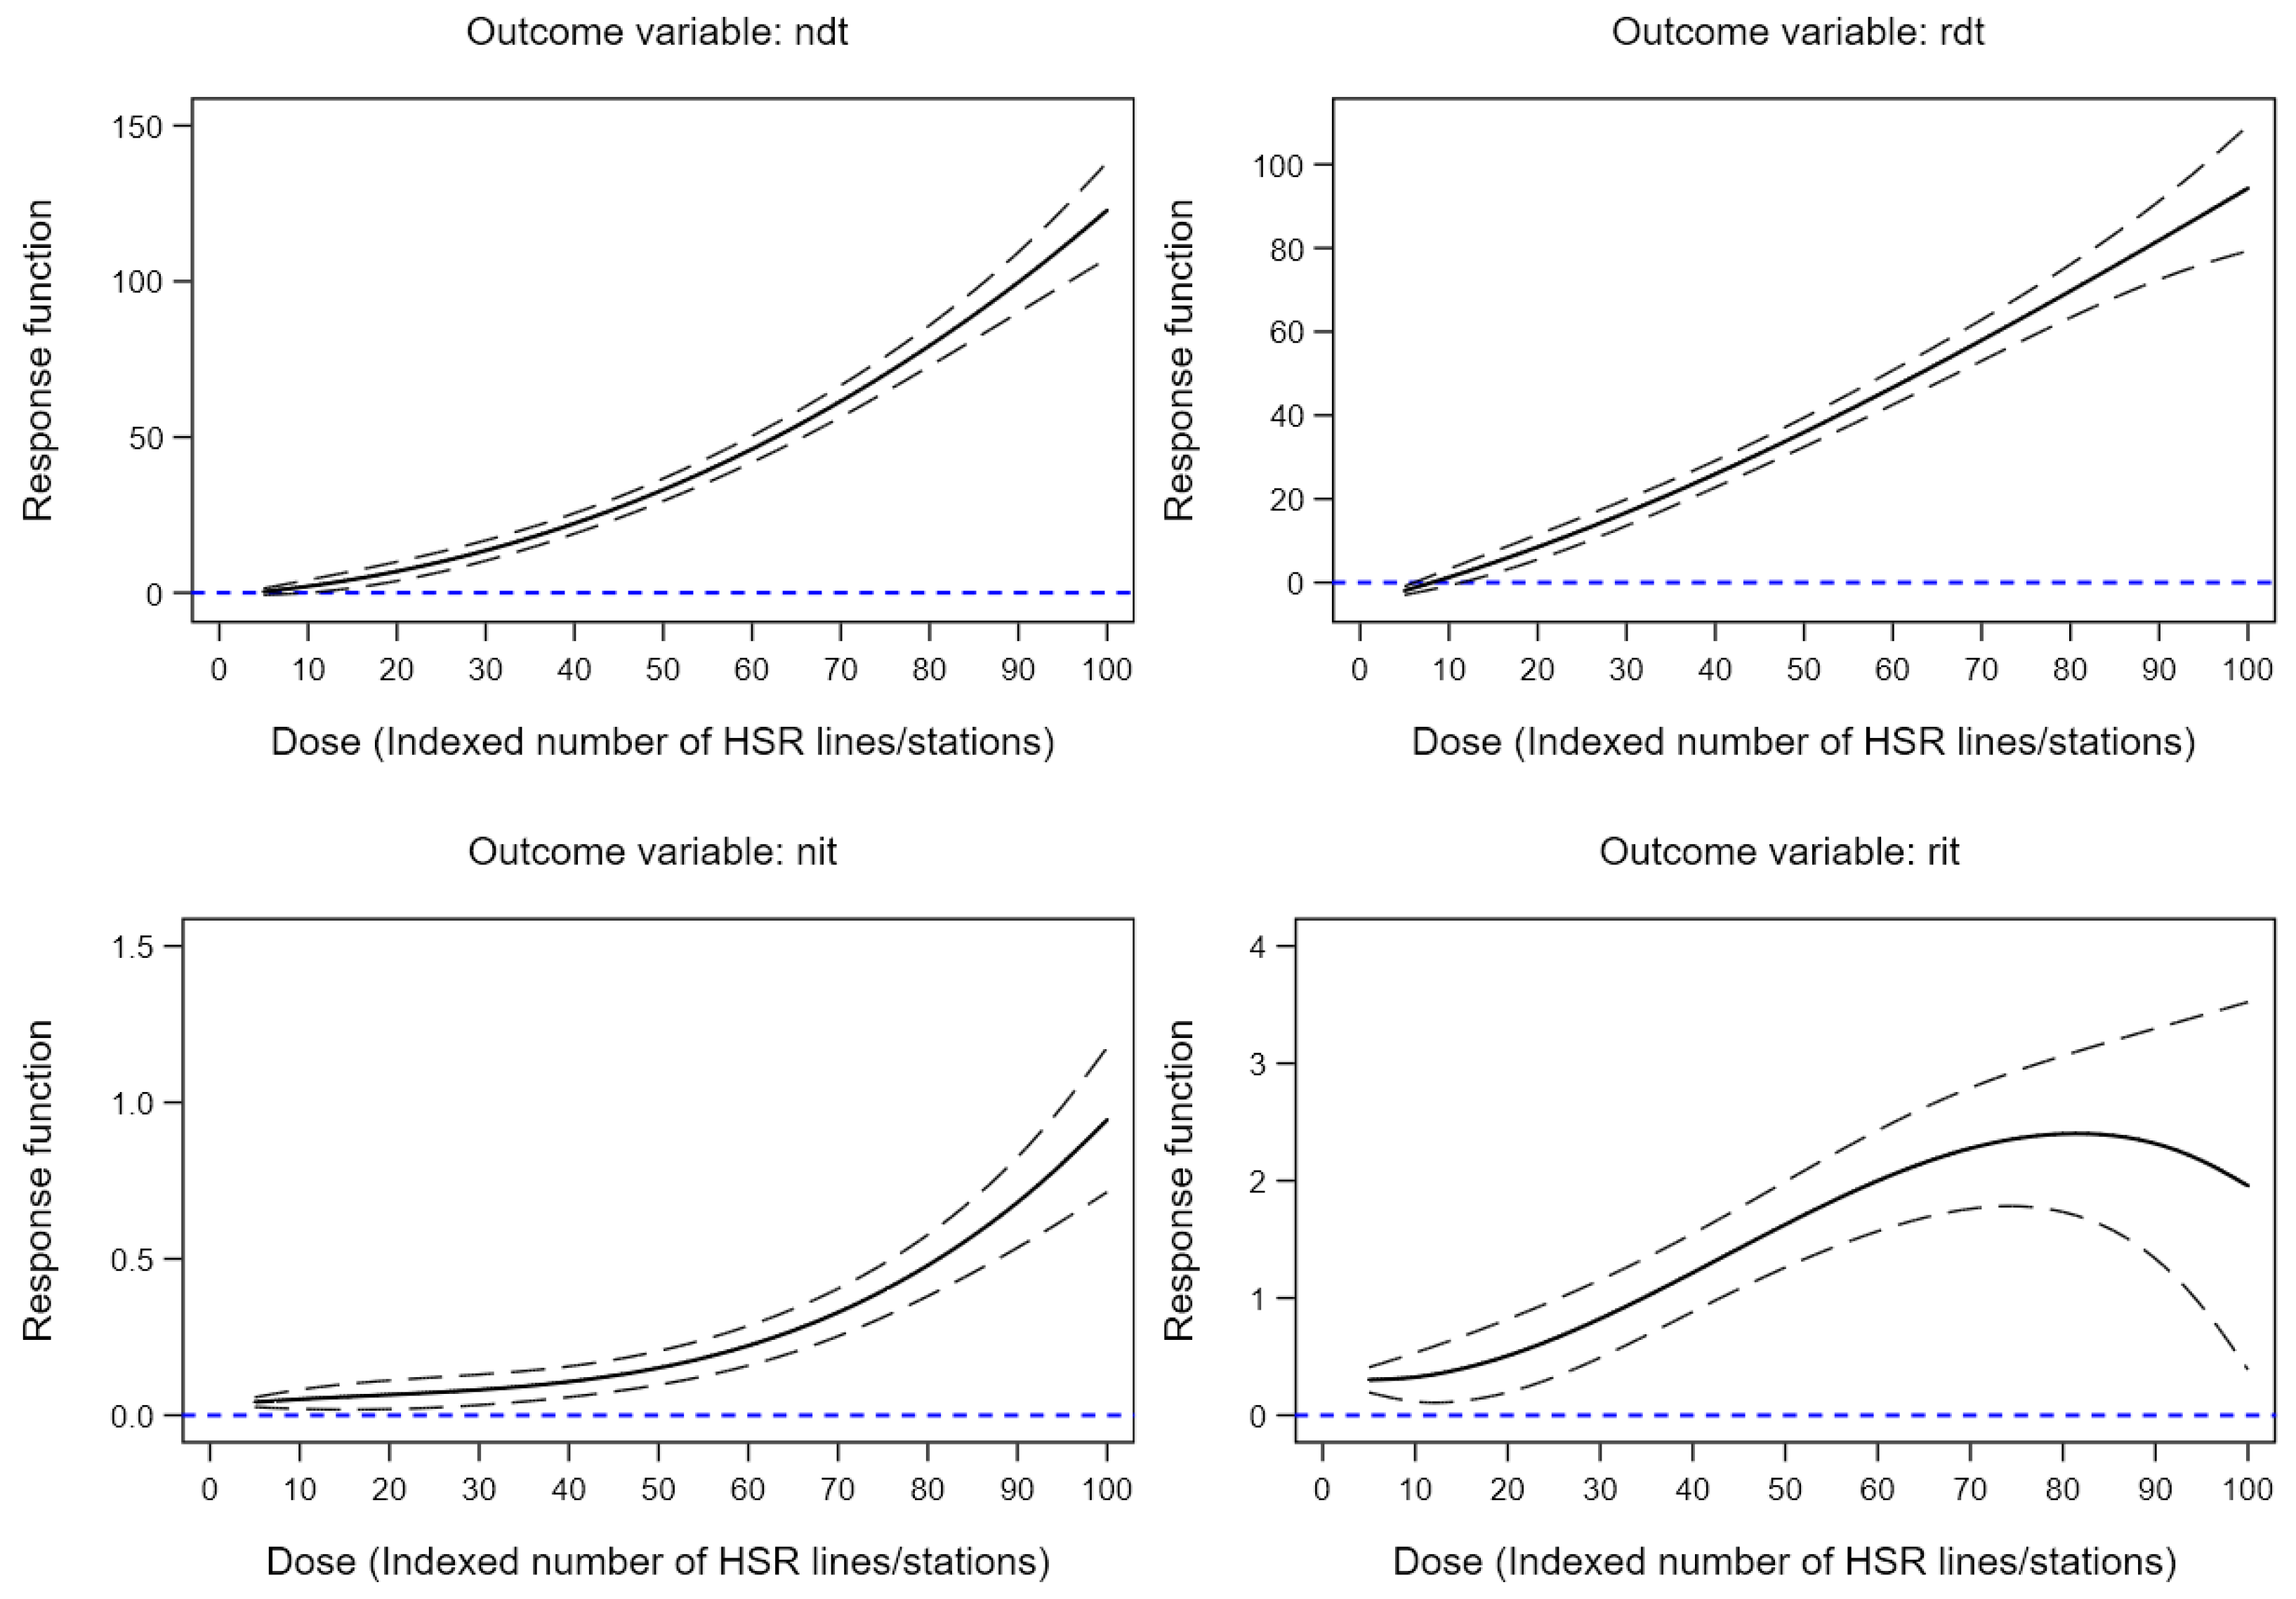
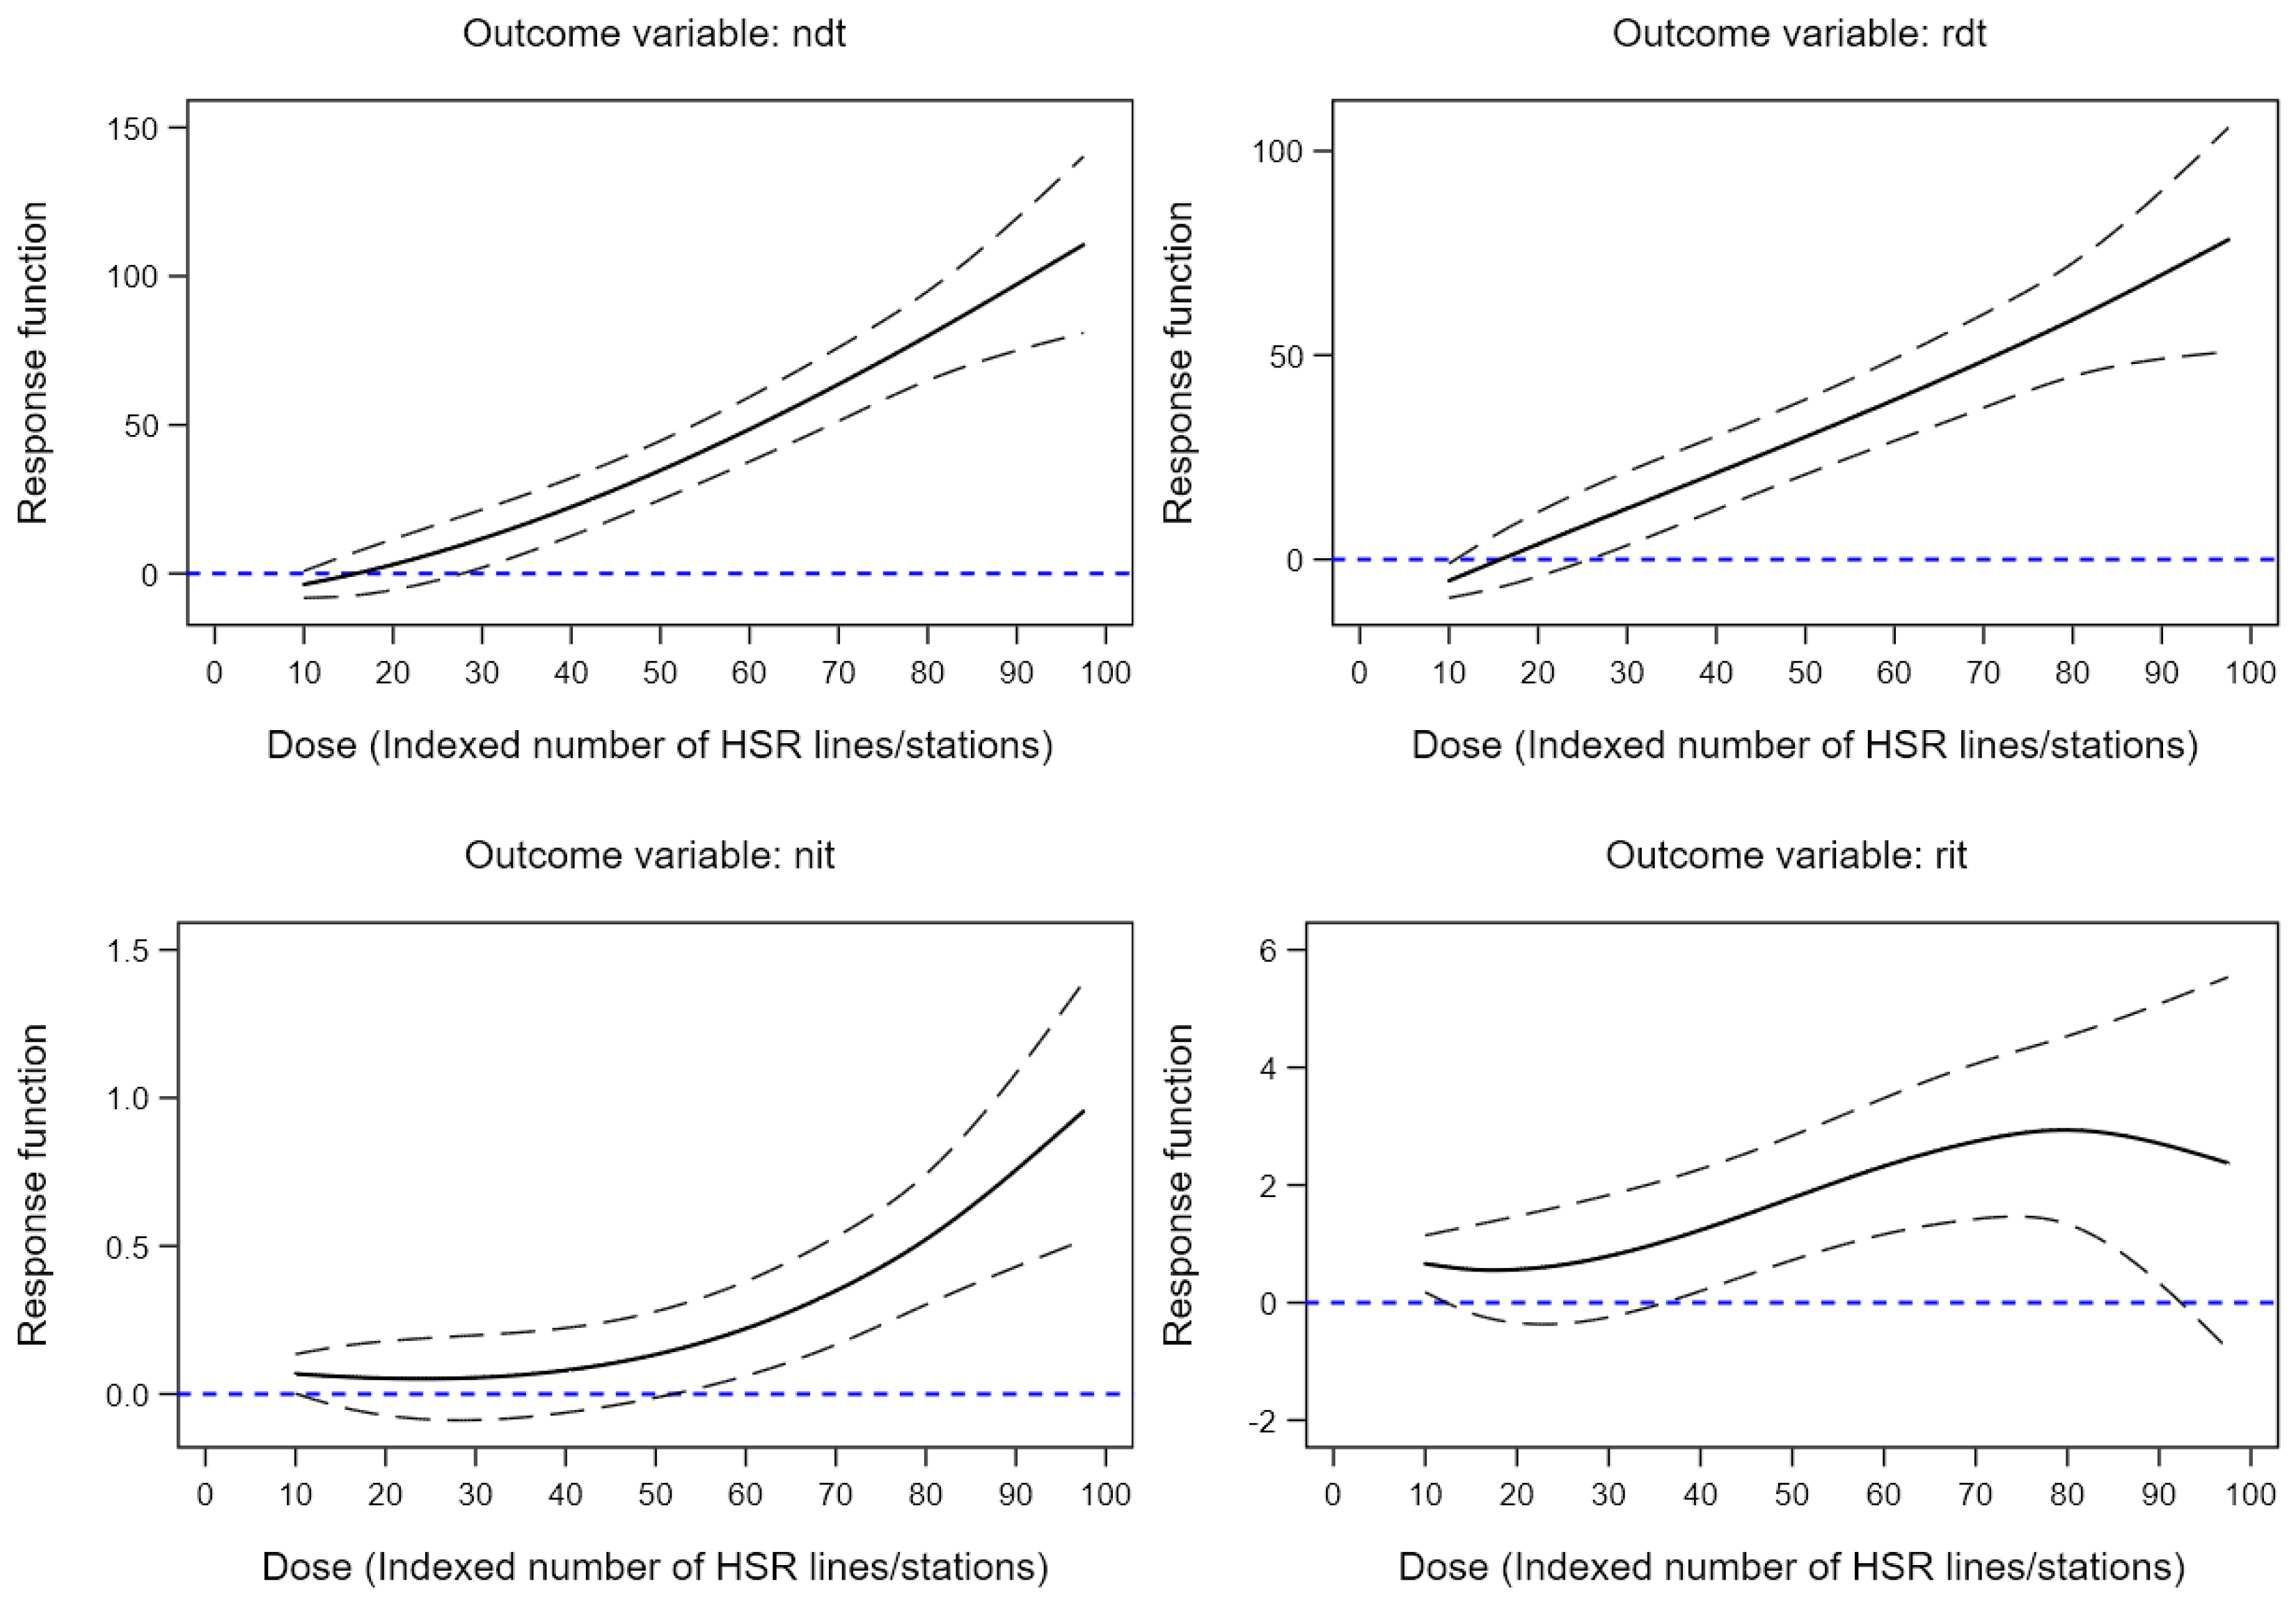
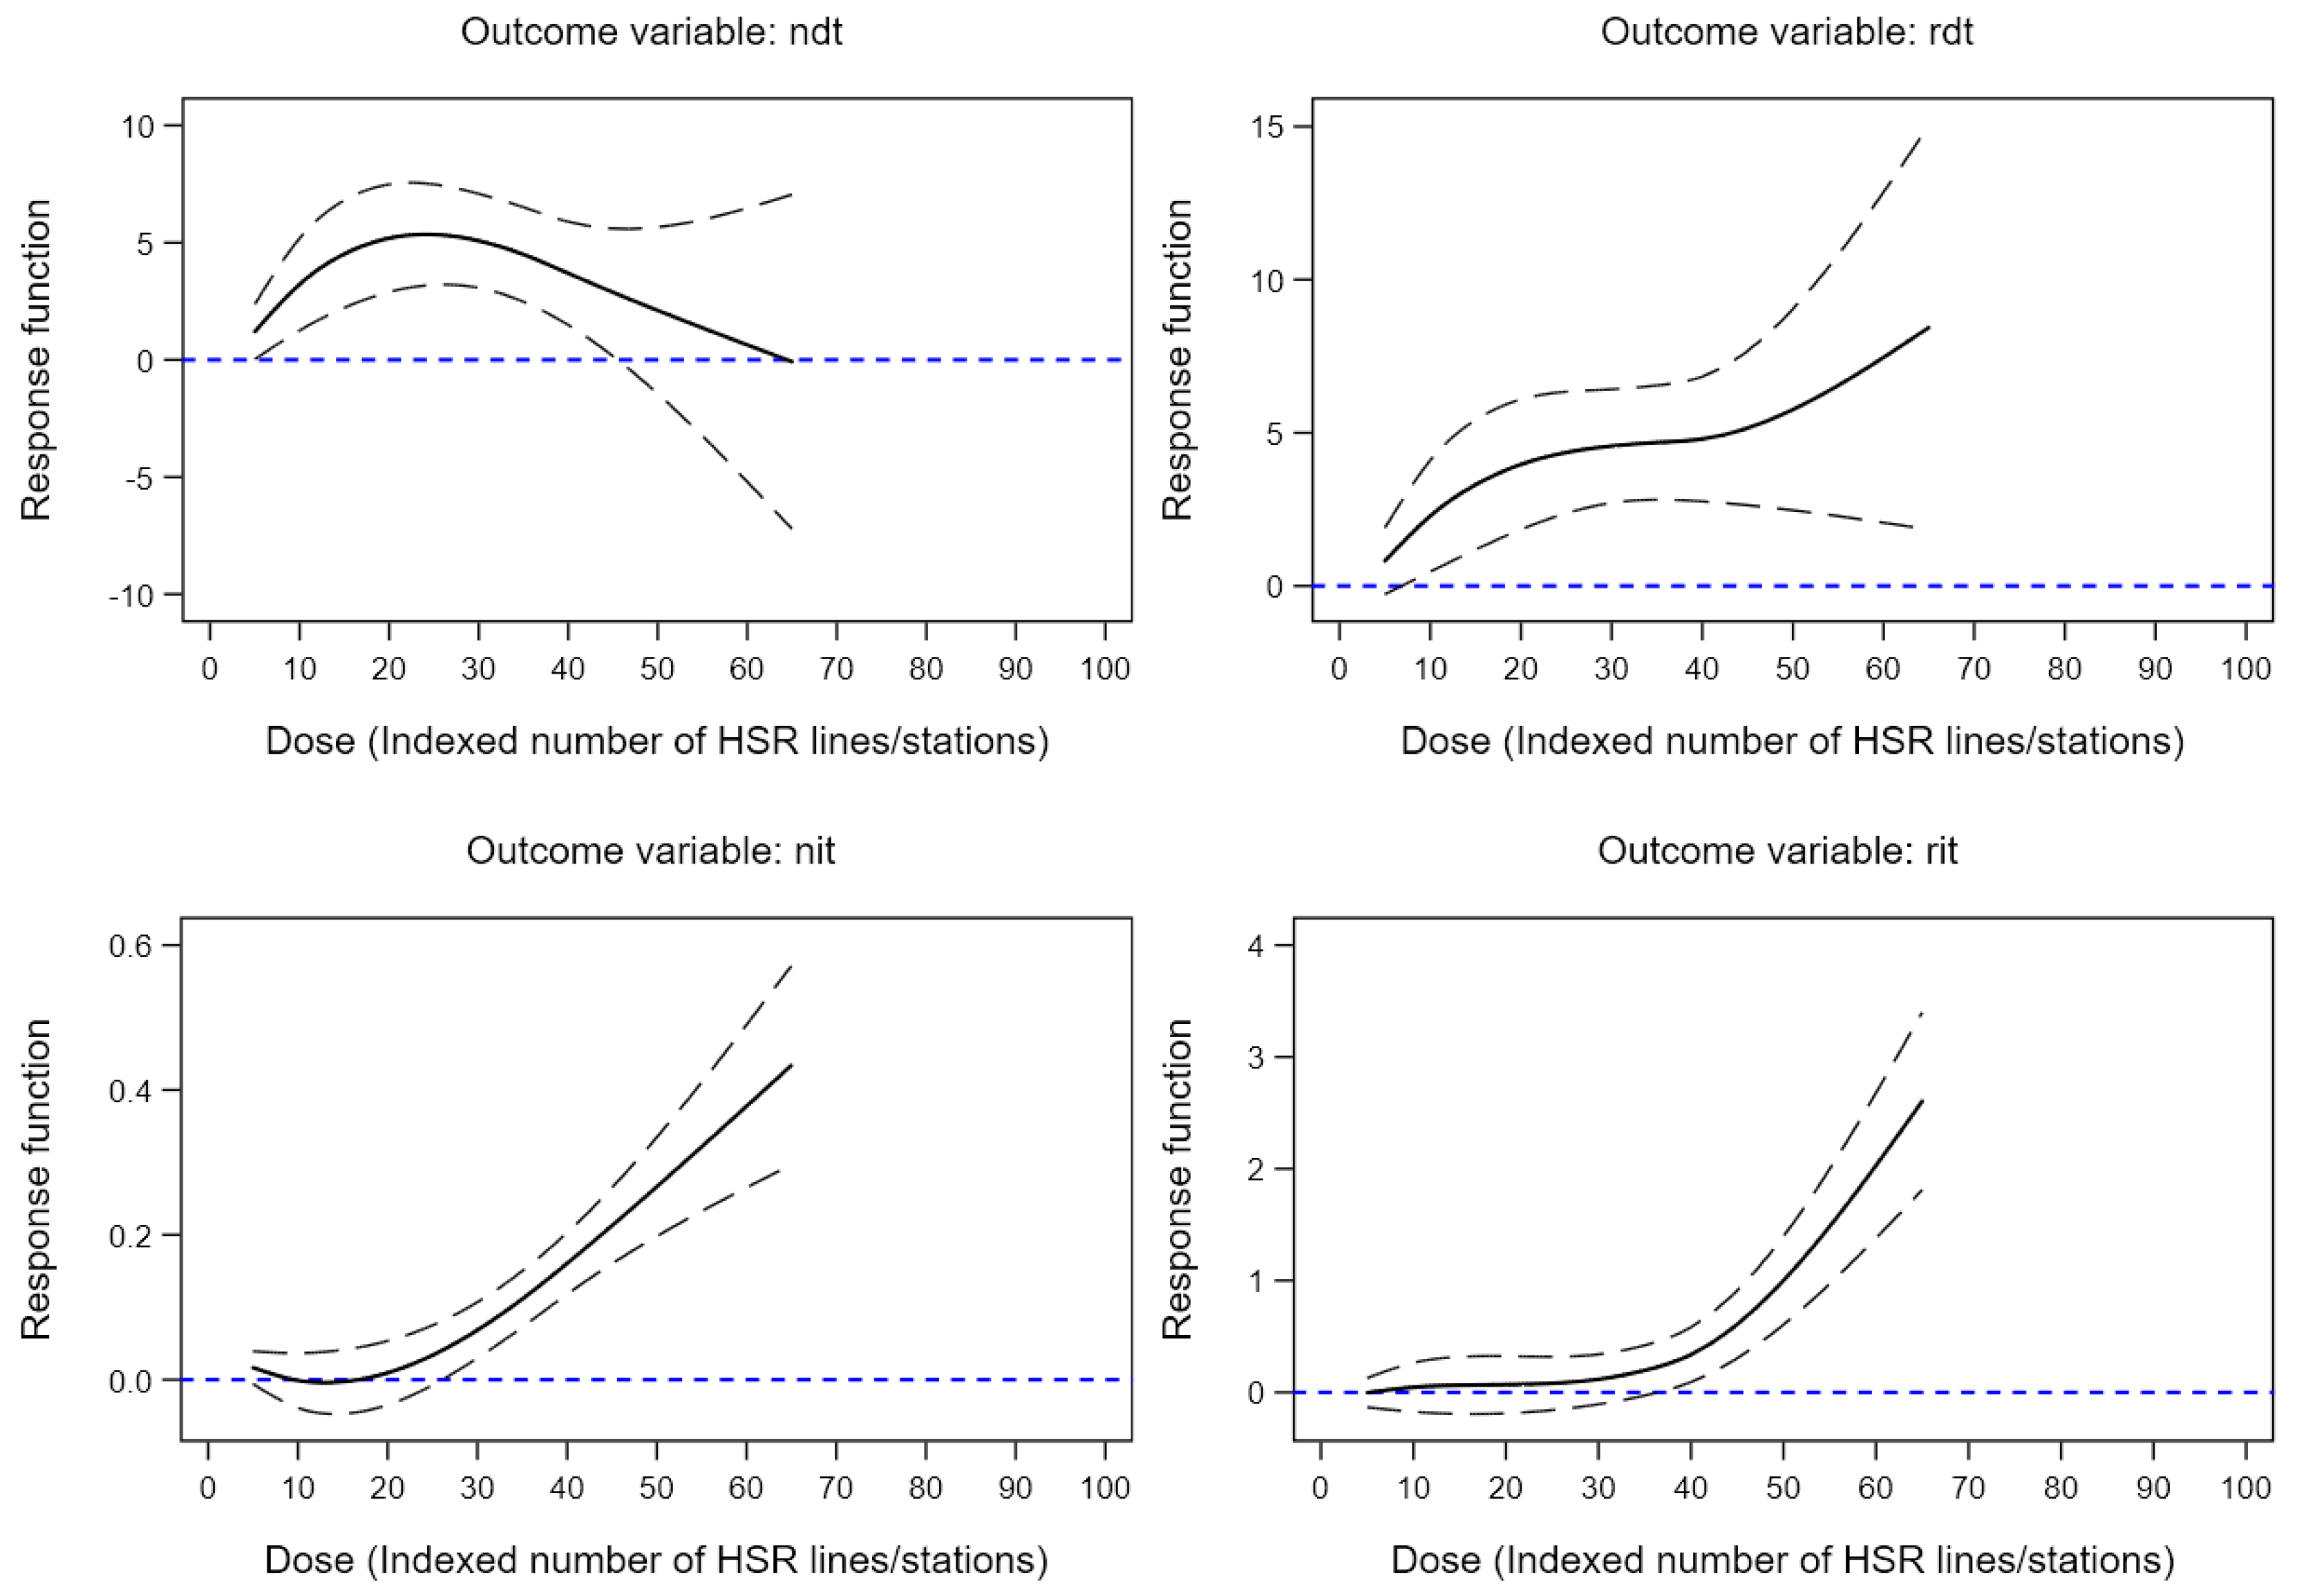
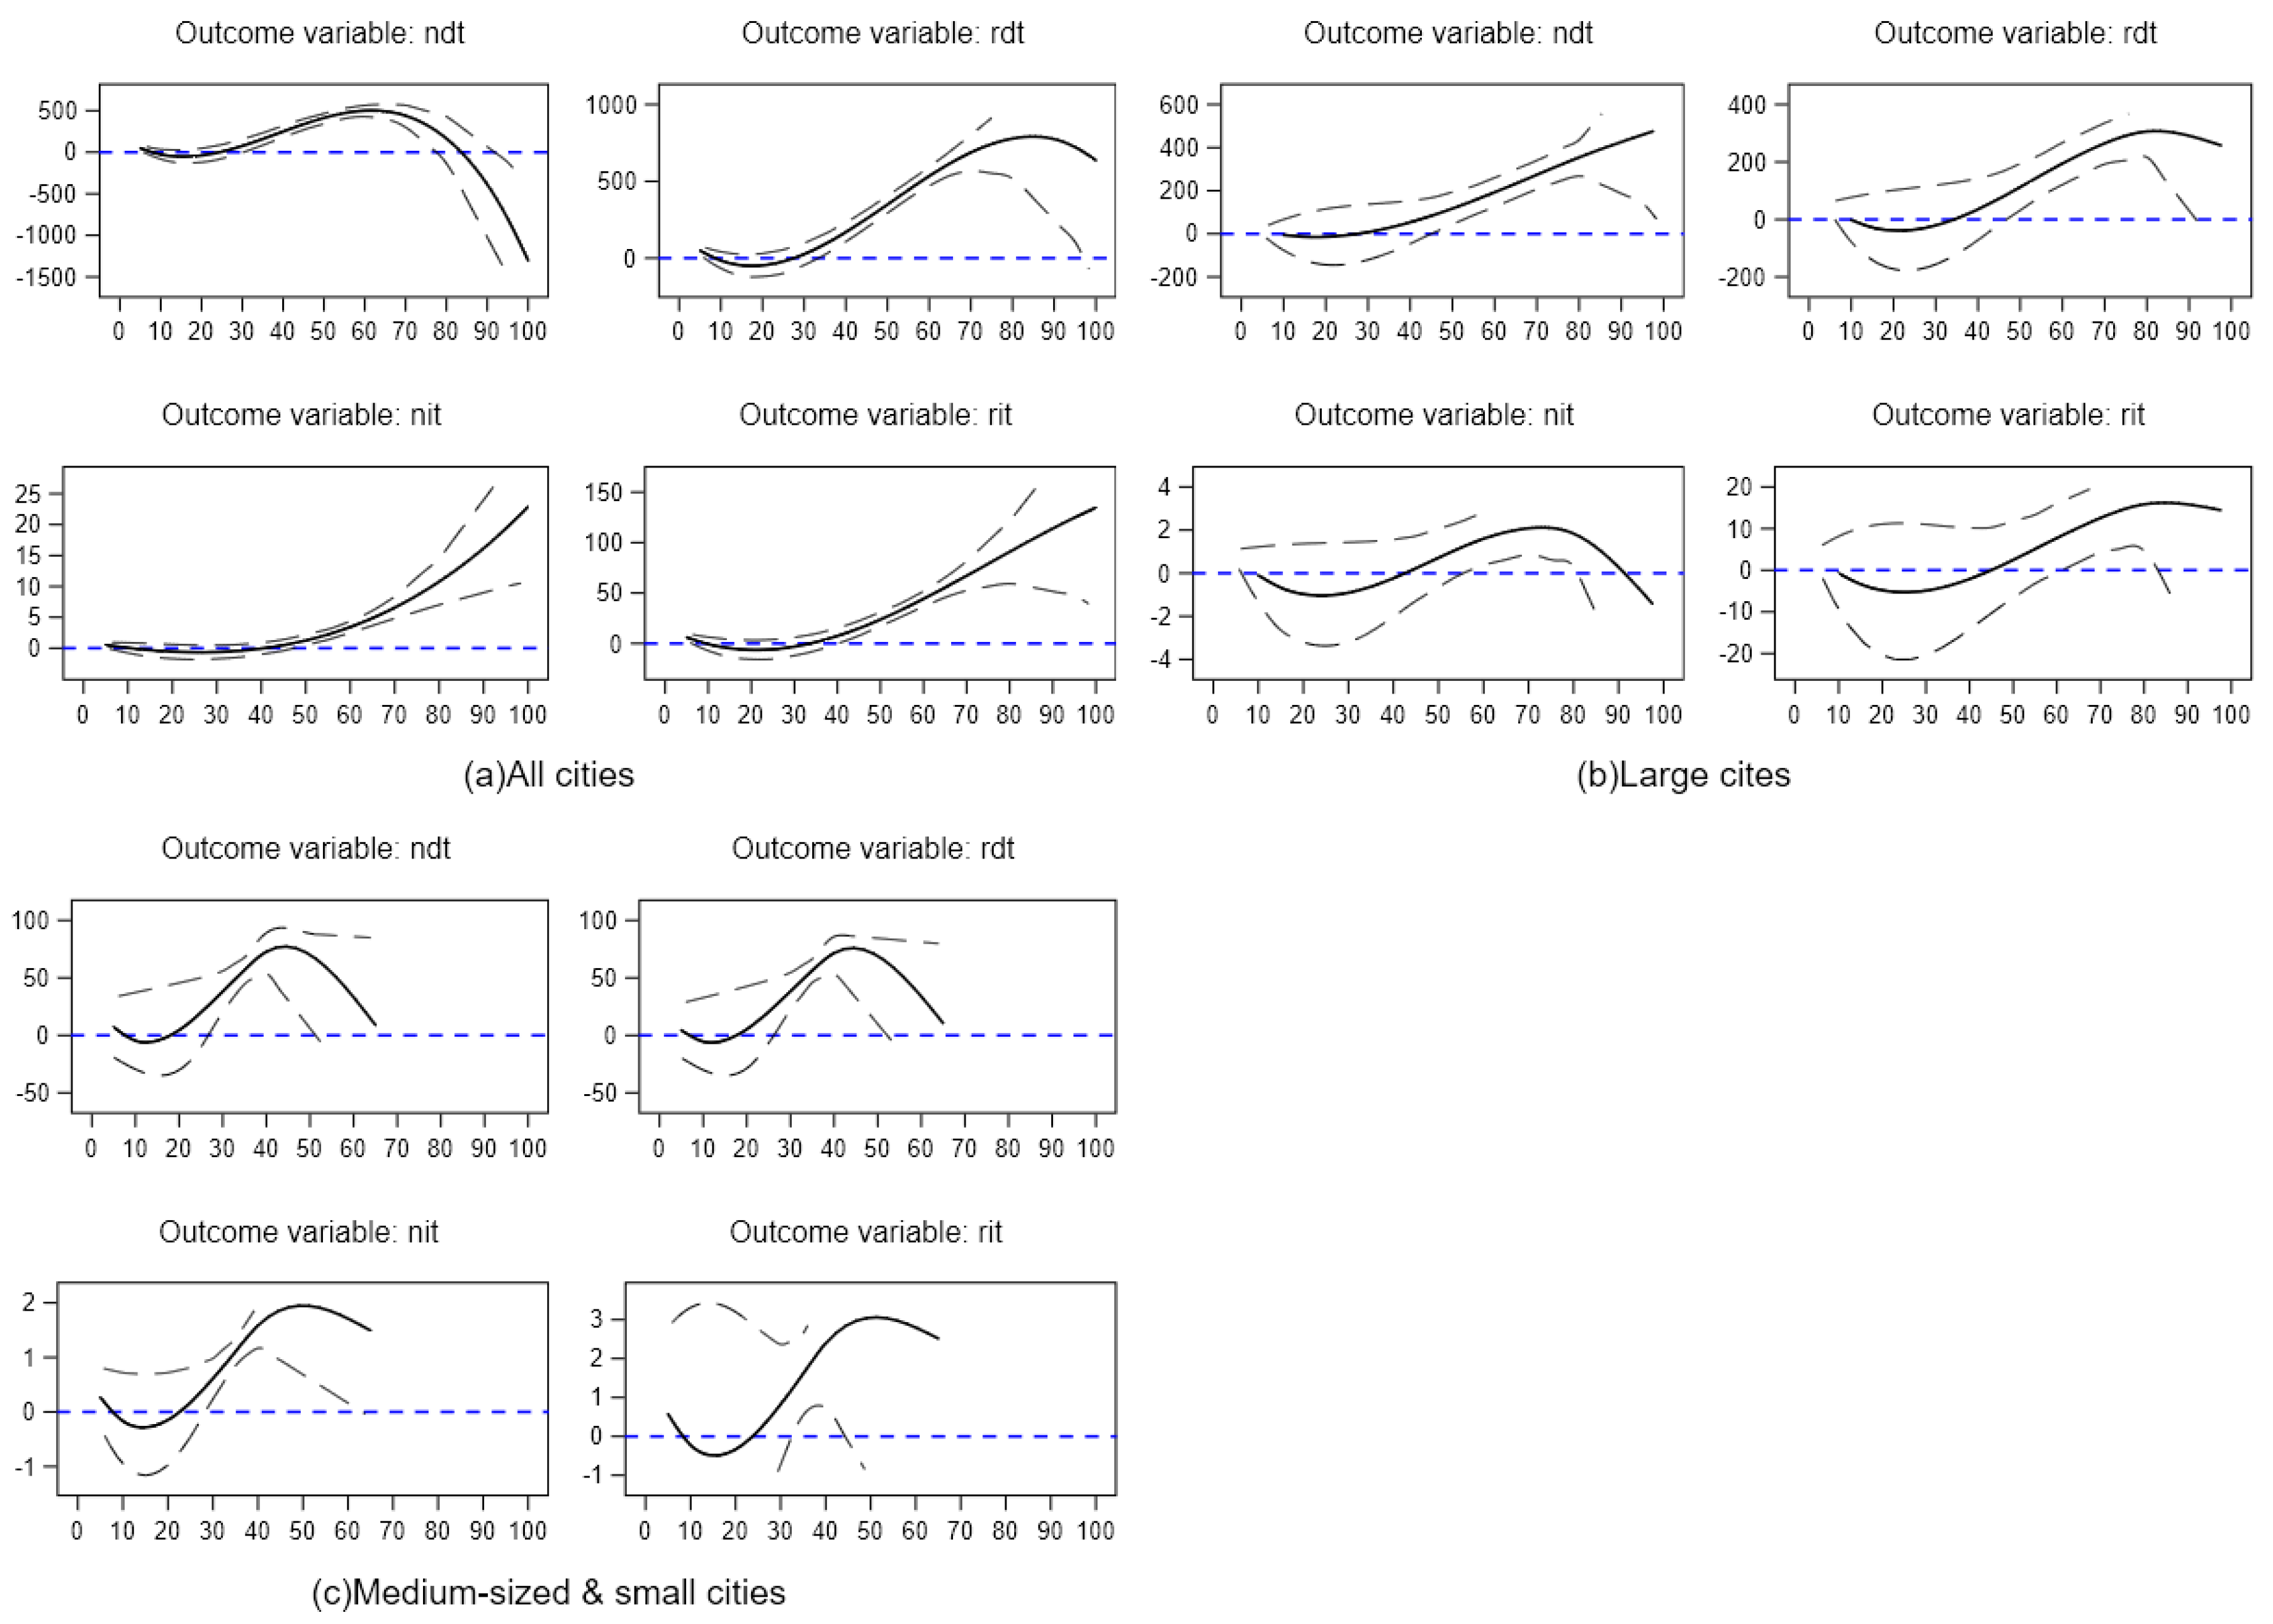
4.4. Dose–Response Assessment

Previous studies commonly consider the existence of an average treatment effect from HSR, but ignore the heterogeneity among treatment levels [48]. Accordingly, we use the number of HSR lines/stations in a certain city as a dose. As with medicine, different doses may have different effects, and we apply a DR method to estimate the DRF of tourism, as affected by HSR.
In detail, the treatment of the DR model is consistent with HSR × Post, and in our context, we take NH as the dose, where NH donates the number of HSR lines/station. Additionally, to better present the DR graphs, the data are processed according to Equation (3) to obtain the indexed dose variables INH. Then, we apply a fixed effect DR assessment in which the polynomial degree is equal to three to identify nonlinear treatment effects. The results will be shown in figures with DRFs and their 95% confidence intervals.
I N H = N H min ( N H ) max ( N H ) min ( N H ) × 100
Considering all cities, we can obtain a clear description of the treatment effects of HSR on tourism, with a more advanced HSR higher-level effect on city tourism taking place, as shown in Figure 3. At a glance, the HSR development dose affects the tourism of cities, but there are differences in scale and patterns. In this paper, we are more concerned with the different levels of performance between large cities and medium-sized or small cities; thus, the implications are discussed in more detail based on grouped DR assessments.
For large cities, Figure 4 shows that the relationship is nearly linearly increasing, and very precisely estimated for higher levels of the dose, referring to the number of domestic tourists and the revenue of domestic tourism (ndt and rdt). Regarding the specific value, the result is a dose higher than the 30th percentile, or in terms of NH, it is approximately more than six lines/stations per city. Only a much higher dose of HSR will make sense for international tourism. The plots for nit and rit show that only when the dose reaches 55 and 40, respectively, will the performance of HSR have a significant effect on international tourism; additionally, the variance will increase when the dose reaches 90, making it nonsignificant for rit. Comparing the results presented in Table 3, we find that if no heterogeneity effect is assumed, then the underlying treatment effects may be ignored. In addition, the pattern of the response function shows that when cities provide a more developed HSR transportation infrastructure, tourism will be more positively affected by HSR operation in general.
In Figure 5, the DR analysis shows that, on the one hand, medium-sized and small cities have less developed HSR infrastructures compared to large cities, and that their maximum INH is approximately 65% that of large cities. On the other hand, with regard to the effect of HSR on tourism, they experience a different pattern, since we find that the response function is clearly nonmonotonic with a cubic polynomial. Numerically, the treatment effects are visually and relatively smaller than those for large cities. For illustration purposes, the response vertical axis scale has a range of [−10, 10] compared to [0, 150] for the outcome ndt, and similar phenomena are consistent for the other three dependent variables. In addition, the trends of the response functions are unique for each group. For ndt, HSR will have a significant and positive effect only when INH takes a dose level under 45, and a lower or higher dose will exert a lower effect or even a nonsignificant effect. For nit, when the dose is higher than 30, there will be a significant and positive effect of HSR on tourism for medium-sized and small cites. This result indicates that even when we find significantly positive evidence on average in Table 3, HSR operation brings benefits only with restrictions on the appropriate level of HSR development. With respect to revenue, the effect will become significant when the dose reaches 10 and 40 for rdt and rit, respectively, but there will be an inflection point for each, after which the treatment effect will be significantly positive and increase with the number of HSR lines/stations. This result means that over a wide range, the tourism of medium-sized and small cities might not enjoy benefits from HSR, since most of these cities have a lower level of HSR development, with an INH mean value equal to only 10.77 compared to 23.75 for large cities in 2013. In other words, small cities have less developed HSR infrastructures; thus, most medium-sized and small cities are actually located on the left side of the DRF.
The DR assessment presents somewhat interesting results in the treatment effect analysis with heterogeneity, because it provides a novel approach to quantifying the impact of HSR operation on city tourism in China. The findings indicate that the HSR operation dose has positive average effects on the tourism of cities, but has underlying heterogeneous treatment effects based on city size and the HSR development level. That is, the tourism development of cities is impacted not only by a binary treatment status of HSR, but also by a continuous exposure to the HSR infrastructure stock. This heterogeneity, which has often been ignored and rarely discussed in previous studies, is a key point investigated in this paper. As discussed by researchers [14,24,43], HSR is central city polarized in economics, and the effects exerted by HSR on tourism are similar and lead to differences based on the infrastructure statues of HSR. This indicates a much more mixed condition for city tourism development, and the potential spillover effects are underlying because we cannot deny that medium-sized and small cities are linked with large cities by the HSR network, meaning that the treatment effects of one group will infect the other group instead of being within-group only.

4.5. Robustness Check with IVs

Although HSR operation can be treated as a quasi-experiment, readers might still worry about the potential endogeneity issue of site location. To deal with this issue, based on knowledge from Faber [37] and Zheng and Kahn [40], this paper further applies a robustness check using instrumental variables (IVs). Two variables are constructed: (a) a dummy variable indicating whether a city is on the backbone lines according to the Medium and Long-term Railway Network Plan 2004, and (b) the differenced number of railway stations for each year. The regression results are reported in Table 4, which shows a conclusion that is robust and consistent with the previous coefficient estimations and that is significant. Figure 6 visualizes the DR assessment with the IVs. We find that the standard error increases partly and that the trend of the response functions is different to some extent, especially for tourism revenues. However, the result is still consistent with our general conclusions, for example, that heterogeneous effects exist, and that an appropriate degree of HSR operation will bring benefits. This result is much more consistent with the results reported in Table 3 and Table 4, indicating a weak linkage between HSR operation and international tourism development. For more information, readers can contact the author.

5. Conclusions

HSR is supposed to promote economic and social development, as well as tourism. However, the treatment effects of HSR on city tourism may be heterogeneous due to city size and the intensity of the HSR infrastructure. The quasi-experiment of HSR operation in China since 2008 provides an ideal case to study the influences of high-speed transportation on city tourism. Furthermore, the DR assessment allows us to explore the treatment effects in greater detail.
Applying a GDID strategy, the following conclusions are drawn. First, on average, HSR operation has significant and positive effects on tourism, regardless of whether it is domestic or international, and both the tourist arrivals and tourism revenue of cities are increased when there is HSR in operation. For example, HSR causes the number of domestic tourists to increase by an average of 3.41 million. Second, we tested the parallel trend assumption of our model using an event study. For each outcome variable, the dynamic effect plots confirmed the validity of our method, and the effect of HSR on tourism increases over time. Third, the treatment effects of HSR are heterogeneous by size; on average, the treatment effects are not optimistic for large cities, but they are generally significant and consistently positive for medium-sized and small cities. Finally, when dealing with the treatment as a dose rather than as a dummy variable that takes the value of zero or one, the DR assessment provides much more detailed information on the treatment effect of HSR on city tourism. The results show that HSR may actually bring benefits for the tourism of large cities owing to their more highly developed HSR infrastructure, with an effect on domestic tourism that is approximately linear to the number of HSR lines/stations. For medium-sized and small cities, the effect is smaller, and the pattern of the response function has a different trend.
One feature of this paper is that we relax the assumption that all cities have the same and average treatment effect by applying grouping estimations and the DR assessment, indicating that the treatment effect is heterogeneous rather than invariant. Our findings have strong policy and research implications. In terms of policy, managers should pay attention to the rank and the endowment of a certain city, since the marginal effects of HSR on city tourism may differ. Additionally, given the DRF of the HSR treatment, to gain long-lasting tourism benefits from HSR operation, governments need to provide more convenient and accessible HSR networks. In terms of academic research, further study should pay more attention to the heterogeneity of treatment effects, such as size, accessibility, location, and tourism service. Moreover, there may be some indirect way by which HSR affects tourism, for example, the regulating effect and the mediating effect. Further research could explore these effects to clarify the mechanisms by which HSR will affect regional or city-level tourism development.

Funding

This research was funded by the National Social Science Fund of China, grant number 17CJL019.

Acknowledgments

I would like to thank the editor of the journal and the anonymous referees for their professional comments and helpful suggestions, which greatly improved the quality of this paper. Moreover, I would like to thank my family, especially my parents and my wife.

Conflicts of Interest

The author declares no conflict of interest.

Appendix A

The classification of cities is based on an index algorithm built by the Rising Lab. Table A1 shows a simple introduction of this index algorithm. The basic information in the third level contains 56 variables, including some traditional variables such as GDP, per capita income, enterprise quantity, and passengers, as well as variables indicating business behaviors calculated with big data from 170 brands and 19 internet companies. When calculated, cities are ranked based on the total index, and are then divided into five classes considering the index value and the performance of the five first-level indexes using the clustering method. Table A2 listed the names of the cities for each class. For more information and the full list of cities, please refer to http://url.cn/5e0NQhN.
Table A1. The index system of classification of Chinese cities.
IndexFirst-Level IndexSecond-Level Index
Total indexBusiness agglomeration index (0.24)Major brand preference index (0.35); Core business index (0.30)
Basic business index (0.21); City size index (0.14)
City hub index (0.18)Transportation accessibility index (0.48); Logistics accessibility index (0.25)
Regional centrality index (0.27)
City people activity index (0.18)Consumer activity index (0.39); Disturbance index (0.31)
Nocturnal activity index (0.30)
Lifestyle diversity index (0.20)Catering diversity index (0.21); Entertainment consumption index (0.22)
Tourism intention index (0.13); Activity index (0.20)
Consumption diversity index (0.24)
Future plasticity index (0.20)Environmental friendliness index (0.09); Entrepreneurship index (0.36)
Talent attractiveness index (0.34); Consumption maturity index (0.21)
Note: The weights information are in parentheses; the weights for the first-level index are calculated by expert scoring, while the weights for the second-level index are calculated by principal component analysis.
Table A2. The List of the Classification of Chinese Cities.
Class 1Class 2Class 3Class 4Class 5
BeijingChangzhouAnshanMaanshanYinchuanAnqingHuangshiSipingAbaEzhouKashenShangluoYushuzangzu
GuangzhouFoshanBengbuMianyangYingkouAnyangJianSuiningAkesuFangchenggangKelamayiShizuishanYunfu
ShanghaiFuzhouBaotouNanchongYueyangBaojiJiamusiTielingAlashanmengGannanKezilesukeerkeziShuangyashanZhangjiajie
ShenzhenGuiyangBaodingNanpingZhanjiangBeihaiJiaozuoTonghuaAletaiGanziLasaShuozhouZhangye
ChengduHaerbinCangzhouNanyangZhangzhouBenxiJinzhouTongliaoAliGuyuanLaibinSongyuanChangzhi
DalianHaikouDaqingNingdeZhaoqingBinzhouJinzhongWeinanAnkangGuanganLaiwuSuihuaZhaotong
DongguanHefeiDandongPanjinZhenjiangChangdeJingdezhenWuzhouAnshunGuangyuanLiangshanSuizhouZhongwei
HangzhouHuizhouDongyingPutianZhoushanChaozhouKaifengXishuangbannaBayanzhuoerGuigangLiaoyuanTachengZiyang
NanjingJinanFushunQiqihaerZhuzhouChenzhouLeshanXianningBayinguolengGuoluoLinzhiTianshuiZigong
NingboJiaxingGanzhouQinhuangdaoZiboChengdeLiaoyangXiangtanBazhongHamiLincangTongchuan
QingdaoJinhuaGuilinQingyuan ChifengLiaochengXinxiangBaichengHaibeiLinxiaTongling
ShenyangKunmingHandanQuzhou ChuzhouLinfenXinyangBaishanHaidongLiupanshuiTongren
SuzhouLanzhouHengyangSanming DaliLiuanXingtaiBaiyinHainanLongnanTulufan
TianjinNanchangHuhehaoteSanya DatongLoudiSuqianBaiseHaixiLuoheWenshan
WuhanNanningHuzhouShantou DeyangLuzhouSuzhouBaoshanHanzhongLvliangWuhai
XianNantongHuaianShangrao DezhouMaomingXuchangBijiediquHetianNaquWulanchabu
ChangshaQuanzhouJilinTaian EerduosiMeishanXuanchengBozhouHechiNujiangWuzhong
ZhengzhouXiamenJiningTaizhou EnshiMeizhouYaanBoertalaHezhouPanzhihuaWuwei
ChongqingShaoxingJiangmenTangshan Fuzhou1MudanjiangYangjiangChangduHebiPingliangXilinguolemeng
ShijiazhuangJieyangWeihai FuxinNeijiangYibinChangjiHegangPingxiangXiangxi
Taizhou1JingzhouWeifang FuyangPingdingshanYichunChaoyangHeihePuyangXinzhou
TaiyuanJiujiangWuhu HeyuanQiandongnanYulin1ChizhouHengshuiPuerXinyu
WenzhouLangfangXining HezeQiannanYulinChongzuoHuaibeiQitaiheXinganmeng
WulumuqiLijiangXianyang HongheQujingYuxiChuxiongHuangnanQianxinanYanan
WuxiLishuiXiangfan HulunbeierRizhaoYunchengDazhouJixiQinzhouYangquan
XuzhouLianyungangXiaogan HuludaoShanweiZaozhuangDaxinganlingJiayuguanQingyangYichun1
YantaiLinyiYanbian HuaihuaShangqiuZhangjiakouDehongJinchangRikazeYili
ChangchunLiuzhouYancheng HuainanShaoguanZhoukouDehongJinchengSanmenxiaYiyang
ZhongshanLongyanYangzhou HuanggangShaoyangZhumadianDiqingJingmenSanshaYingtan
ZhuhaiLuoyangYichang HuangshanShiyanZunyiDingxiJiuquanShannanYongzhou

References

  1. Chen, Z.; Xue, J.; Rose, A.Z.; Haynes, K.E. The impact of high-speed rail investment on economic and environmental change in China: A dynamic CGE analysis. Transp. Res. Part A Policy Pract. 2016, 92, 232–245. [Google Scholar] [CrossRef]
  2. Guirao, B.; Campa, J.L. Should Implications for Tourism Influence the Planning Stage of a New HSR Network? The Experience of Spain. Open Transp. J. 2016, 10, 22–34. [Google Scholar] [CrossRef]
  3. Xu, W.; Zhou, J.; Yang, L.; Li, L. The implications of high-speed rail for Chinese cities: Connectivity and accessibility. Transp. Res. Part A Policy Pract. 2018, 116, 308–326. [Google Scholar]
  4. Albalate, D.; Campos, J.; Jiménez, J.L. Tourism and high speed rail in Spain: Does the AVE increase local visitors? Ann. Tour. Res. 2017, 65, 71–82. [Google Scholar] [CrossRef]
  5. Yin, P.; Pagliara, F.; Wilson, A. How Does High-Speed Rail Affect Tourism? A Case Study of the Capital Region of China. Sustainability 2019, 11, 472. [Google Scholar] [CrossRef]
  6. Cartenì, A.; Pariota, L.; Henke, I. Hedonic value of high-speed rail services: Quantitative analysis of the students’ domestic tourist attractiveness of the main Italian cities. Transp. Res. Part A Policy Pract. 2017, 100, 348–365. [Google Scholar]
  7. Seetanah, B.; Juwaheer, T.; Lamport, M.; Rojid, S.; Sannassee, R.; Subadar, A. Does infrastructure matter in tourism development? Univ. Maurit. Res. J. 2011, 17, 89–108. [Google Scholar] [CrossRef]
  8. Pagliara, F.; La Pietra, A.; Gomez, J.; Vassallo, J.M. High Speed Rail and the tourism market: Evidence from the Madrid case study. Transp. Policy 2015, 37, 187–194. [Google Scholar] [CrossRef] [Green Version]
  9. Aguiló, E.; Palmer, T.; Rosselló, J. Road transport for tourism: Evaluating policy measures from consumer profiles. Tour. Econ. 2012, 18, 281–293. [Google Scholar] [CrossRef]
  10. Martín-Cejas, R.R.; Sánchez, P.P.R. Ecological footprint analysis of road transport related to tourism activity: The case for Lanzarote Island. Tour. Manag. 2010, 31, 98–103. [Google Scholar] [CrossRef]
  11. Jou, R.-C.; Hensher, D.; Su, W.-C. The influence of new road infrastructure on tourism behaviour in Taiwan: The Sun Moon Lake experience. Road Transp. Res. A J. Aust. New Zealand Res. Pract. 2012, 21, 50. [Google Scholar]
  12. Albalate, D.; Bel, G. Tourism and urban public transport: Holding demand pressure under supply constraints. Tour. Manag. 2010, 31, 425–433. [Google Scholar] [CrossRef]
  13. Delaplace, M. TGV, développement local et taille des villes: Une analyse en termes d’innovation de services. Rev. D’économie Régionale Urbaine 2012, 2, 265–290. [Google Scholar] [CrossRef]
  14. Masson, S.; Petiot, R. Can the high speed rail reinforce tourism attractiveness? The case of the high speed rail between Perpignan (France) and Barcelona (Spain). Technovation 2009, 29, 611–617. [Google Scholar] [CrossRef]
  15. Chen, Z.; Haynes, K.E. Tourism Industry and High Speed Rail-Is There a Linkage: Evidence from China’s High Speed Rail Development. SSRN Electron. J. 2012, 14. [Google Scholar] [CrossRef]
  16. Bazin, S.; Beckerich, C.; Delaplace, M. High speed railway, service innovations and urban and business tourisms development. In Economics and Management of Tourism: Trends and Recent Developments; Sarmento, M., Matias, A., Collecçao, M., Eds.; Universidade Luisiada Editora: Lisboa, Portugal, 2011; pp. 115–141. [Google Scholar]
  17. Delaplace, M.; Pagliara, F.; Perrin, J.; Mermet, S. Can High Speed Rail foster the choice of destination for tourism purpose? Procedia-Soc. Behav. Sci. 2014, 111, 166–175. [Google Scholar] [CrossRef]
  18. Wing, C.; Marier, A. Effects of occupational regulations on the cost of dental services: Evidence from dental insurance claims. J. Health Econ. 2014, 34, 131–143. [Google Scholar] [CrossRef]
  19. Card, D.; Krueger Alan, B. Minimum wages and employment: A case study of the fast-food industry in New Jersey and Pennsylvania. Am. Econ. Rev. 1994, 84, 772–793. [Google Scholar]
  20. Guirao, B.; Campa, J.L. The effects of tourism on HSR: Spanish empirical evidence derived from a multi-criteria corridor selection methodology. J. Transp. Geogr. 2015, 47, 37–46. [Google Scholar] [CrossRef]
  21. Albalate, D.; Fageda, X. High speed rail and tourism: Empirical evidence from Spain. Transp. Res. Part A Policy Pract. 2016, 85, 174–185. [Google Scholar] [CrossRef] [Green Version]
  22. Kurihara, T.; Wu, L. The impact of high speed rail on tourism development: A case study of Japan. Open Transp. J. 2016, 10, 35–44. [Google Scholar] [CrossRef]
  23. Wang, D.; Qian, J.; Chen, T.; Zhao, M.; Zhang, Y. Influence of the high-speed rail on the spatial pattern of regional tourism–taken Beijing–Shanghai high-speed rail of China as example. Asia Pac. J. Tour. Res. 2014, 19, 890–912. [Google Scholar] [CrossRef]
  24. Gao, Y.; Su, W.; Wang, K. Does high-speed rail boost tourism growth? New evidence from China. Tour. Manag. 2019, 72, 220–231. [Google Scholar] [CrossRef]
  25. Albalate, D.; Bel, G.; Fageda, X. Competition and cooperation between high-speed rail and air transportation services in Europe. J. Transp. Geogr. 2015, 42, 166–174. [Google Scholar] [CrossRef]
  26. Dobruszkes, F. High-speed rail and air transport competition in Western Europe: A supply-oriented perspective. Transp. Policy 2011, 18, 870–879. [Google Scholar] [CrossRef]
  27. Dobruszkes, F.; Dehon, C.; Givoni, M. Does European high-speed rail affect the current level of air services? An EU-wide analysis. Transp. Res. Part A Policy Pract. 2014, 69, 461–475. [Google Scholar] [CrossRef]
  28. Gutiérrez, J.; Condeço-Melhorado, A.; Martín, J.C. Using accessibility indicators and GIS to assess spatial spillovers of transport infrastructure investment. J. Transp. Geogr. 2010, 18, 141–152. [Google Scholar] [CrossRef]
  29. Qin, Y. ‘No county left behind?’ The distributional impact of high-speed rail upgrades in China. J. Econ. Geogr. 2017, 17, 489–520. [Google Scholar] [CrossRef]
  30. Della Corte, V.; Sciarelli, M.; Cascella, C.; Del Gaudio, G. Customer satisfaction in tourist destination: The case of tourism offer in the city of Naples. J. Invest. Manag. 2015, 4, 39–50. [Google Scholar] [CrossRef]
  31. Delaplace, M.; Bazin, S.; Pagliara, F.; Sposaro, A. High Speed Railway System and the tourism market: Between accessibility, image and coordination tool. In Proceedings of the 54th European Regional Science Association Congress, Saint Petersburg, Russia, 26–29 August 2014. [Google Scholar]
  32. Li, S.; Wang, Z.; Zhong, Z. Gravity model for tourism spatial interaction: Basic form, parameter estimation, and applications. Acta Geogr. Sin. 2012, 67, 526–544. [Google Scholar]
  33. Campa, J.L.; López-Lambas, M.E.; Guirao, B. High speed rail effects on tourism: Spanish empirical evidence derived from China’s modelling experience. J. Transp. Geogr. 2016, 57, 44–54. [Google Scholar] [CrossRef]
  34. Chen, Z.; Haynes, K.E. Chinese Railways in the Era of High-Speed; Emerald Group Publishing Limited: Bingley, UK, 2015. [Google Scholar]
  35. Wang, Y.; Yan, X.; Zhou, Y.; Xue, Q. Influencing mechanism of potential factors on passengers’ long-distance travel mode choices based on structural equation modeling. Sustainability 2017, 9, 1943. [Google Scholar] [CrossRef]
  36. Chen, C.; D’Alfonso, T.; Guo, H.; Jiang, C. Graph theoretical analysis of the Chinese high-speed rail network over time. Res. Transp. Econ. 2018, 72, 3–14. [Google Scholar] [CrossRef]
  37. Faber, B. Trade integration, market size, and industrialization: Evidence from China’s National Trunk Highway System. Rev. Econ. Stud. 2014, 81, 1046–1070. [Google Scholar] [CrossRef]
  38. Chen, C.L. Reshaping Chinese space-economy through high-speed trains: Opportunities and challenges. J. Transp. Geogr. 2012, 22, 312–316. [Google Scholar] [CrossRef]
  39. Fujita, M.; Krugman, P. The new economic geography: Past, present and the future. Pap. Reg. Sci. 2004, 83, 139–164. [Google Scholar] [CrossRef]
  40. Zheng, S.; Kahn, M.E. China’s bullet trains facilitate market integration and mitigate the cost of megacity growth. Proc. Natl. Acad. Sci. USA 2013, 110, 1248–1253. [Google Scholar] [CrossRef] [PubMed]
  41. Diao, M. Does growth follow the rail? The potential impact of high-speed rail on the economic geography of China. Transp. Res. Part A Policy Pract. 2018, 113, 279–290. [Google Scholar] [CrossRef]
  42. Shaw, S.-L.; Fang, Z.; Lu, S.; Tao, R. Impacts of high speed rail on railroad network accessibility in China. J. Transp. Geogr. 2014, 40, 112–122. [Google Scholar] [CrossRef]
  43. Wang, X.; Huang, S.; Zou, T.; Yan, H. Effects of the high speed rail network on China’s regional tourism development. Tour. Manag. Perspect. 2012, 1, 34–38. [Google Scholar] [CrossRef]
  44. Wang, D.; Niu, Y.; Qian, J. Evolution and optimization of China’s urban tourism spatial structure: A high speed rail perspective. Tour. Manag. 2018, 64, 218–232. [Google Scholar] [CrossRef]
  45. EI-Geneidy, A.; Levinson, D.; Diab, E.; Boisjoly, G.; Verbich, D.; Loong, C. The cost of equity: Assessing transit accessibility and social disparity using total travel cost. Transp. Res. Part A Policy Pract. 2016, 91, 302–316. [Google Scholar] [CrossRef]
  46. Autor, D.H. Outsourcing at will: The contribution of unjust dismissal doctrine to the growth of employment outsourcing. J. Labor Econ. 2003, 21, 1–42. [Google Scholar] [CrossRef]
  47. Chen, H.; Sun, D.; Zhu, Z.; Zeng, J. The impact of High-Speed Rail on residents’ travel behavior and household mobility: A case study of the Beijing-Shanghai Line, China. Sustainability 2016, 8, 1187. [Google Scholar] [CrossRef]
  48. Shao, S.; Tian, Z.; Yang, L. High speed rail and urban service industry agglomeration: Evidence from China’s Yangtze River Delta region. J. Transp. Geogr. 2017, 64, 174–183. [Google Scholar] [CrossRef]
  49. Dong, X.; Zheng, S.; Kahn, M.E. The Role of Transportation Speed in Facilitating High Skilled Teamwork. NBER Working Paper. No. 24539. Available online: https://www.nber.org/papers/w24539 (accessed on 3 March 2019).
  50. Zhang, J. High-speed railway construction and county economic development: Research based on satellite light data. China Econ. Q. 2017, 16, 1533–1562. [Google Scholar]
  51. Moser, P.; Voena, A. Compulsory licensing: Evidence from the trading with the enemy act. Am. Econ. Rev. 2012, 102, 396–427. [Google Scholar] [CrossRef]
Figure 1. The average time trend of the tourism development of cities.
Sustainability 11 01512 g001
Figure 2. Event study plots. Note: The gray lines are the coefficients of the event study; the red and the blue dash lines refer to the upper and lower bound of the 95% confidence interval of the coefficients.
Sustainability 11 01512 g002
Figure 3. The dose–response function (DRF) of the HSR effect on tourism.
Sustainability 11 01512 g003
Figure 4. The DRF of the HSR effect on tourism for large cities.
Sustainability 11 01512 g004
Figure 5. The DRF of the HSR effect on tourism for medium-sized and small cities.
Sustainability 11 01512 g005
Figure 6. The DRF of the HSR effect on tourism with IVs.
Sustainability 11 01512 g006
Table 1. Definition and descriptive statistics of the variables. HSR: high-speed rail.
NameDefinitionMeanSDMinMax
ndtNumber of domestic tourists (billion persons)14.7325.980.00459.53
rdtDomestic tourism revenue (billion yuan)13.4828.890.00462.11
nitNumber of international tourists (billion persons)0.150.440.006.66
ritInternational tourism revenue (billion yuan)0.933.360.0043.36
HSRWhether or not an HSR in operation0.270.4401
HSR × PostThe double-difference term of HSR0.160.3701
popCity population (million persons)3.983.010.0834.35
areaAdministrative area of city (10,000 square km)2.274.300.0547.25
pgdpPer capita gross domestic product (10,000 yuan)2.942.550.1420.72
roadRoad mileage of city (10,000 km)1.030.820.0212.71
incPer capita disposable income (10,000 yuan)1.640.810.385.39
livingPer capita living consumption expenditure (10,000 yuan)1.140.540.143.85
5ANumber of 5A scenic spots0.250.650.007.00
heritageNumber of World Heritage Sites0.170.560.006.00
airThe logarithm of air passenger trips (person-time)5.186.550.0018.41
Note: Yuan refers to China yuan (RMB); for variables initially measured in dollars, we converted them to China yuan using the average exchange rates for each year.
Table 2. The effect of HSR on tourism.
(1)(2)(3)(4)(5)(6)(7)(8)
VARIABLESndtndtrdtrdtnitnitritrit
HSR × Post10.94 ***3.41 ***13.94 ***2.94 ***0.08 ***0.05 ***0.66 ***0.40 ***
(0.769)(0.665)(0.808)(0.648)(0.009)(0.009)(0.061)(0.063)
pop 9.42 *** 9.65 *** 0.03 ** 0.43 ***
(0.821) (0.799) (0.012) (0.078)
area −0.30 −0.58 −0.01 −0.01
(0.642) (0.624) (0.009) (0.061)
pgdp 0.26 0.74 *** −0.00 0.04 **
(0.215) (0.210) (0.003) (0.021)
road 8.82 *** 2.73 *** 0.00 −0.04
(0.560) (0.545) (0.008) (0.053)
inc 14.21 *** 21.70 *** 0.13 *** 0.85 ***
(1.343) (1.307) (0.019) (0.128)
living −4.10 *** −3.41 ** 0.03 0.19
(1.380) (1.344) (0.020) (0.131)
DCG 4.90 *** 8.83 *** −0.06 *** −0.34 ***
(0.912) (0.887) (0.013) (0.087)
5A 11.16 *** 14.01 *** 0.06 *** 0.42 ***
(0.422) (0.411) (0.006) (0.040)
heritage 9.16 *** 3.32 *** 0.03 * 0.51 ***
(1.167) (1.135) (0.016) (0.111)
air −0.02 −0.03 −0.00 −0.00
(0.075) (0.073) (0.001) (0.007)
Constant12.97 ***−55.92 ***11.23 ***−65.49 ***0.13 ***−0.20 ***0.82 ***−2.66 ***
(0.231)(3.827)(0.243)(3.725)(0.003)(0.054)(0.018)(0.364)
Observations42124212421242124186418642124212
R-squared0.7810.8630.8040.8950.8950.9030.9170.926
Note: Standard errors are in parentheses; *, **, and *** represent significance at the 10%, 5%, and 1% levels, respectively; both time-fixed and city-fixed effects are controlled.
Table 3. Heterogeneity estimation for large cities and medium-sized or small cities.
(1)(2)(3)(4)(5)(6)(7)(8)
Large CitiesMedium-Sized and Small Cities
VARIABLESndtrdtnitritndtrdtnitrit
HSR × Post−0.21−1.450.070.72 **2.92 ***2.23 ***0.01 **0.05
(3.303)(3.001)(0.045)(0.323)(0.340)(0.315)(0.007)(0.038)
pop9.58 ***10.66 ***0.040.77 ***3.11 ***1.97 ***−0.02 **−0.13 **
(2.843)(2.583)(0.039)(0.278)(0.481)(0.445)(0.009)(0.054)
area−3.15−3.95−0.19−1.040.040.07−0.000.02
(13.114)(11.914)(0.178)(1.281)(0.283)(0.262)(0.005)(0.032)
pgdp−0.881.53−0.000.30 **−0.35 ***0.07−0.01 ***−0.01
(1.258)(1.142)(0.017)(0.123)(0.103)(0.096)(0.002)(0.012)
road11.76 ***1.080.020.033.16 ***1.78 ***−0.00−0.03
(1.982)(1.800)(0.027)(0.194)(0.318)(0.294)(0.006)(0.035)
inc9.5510.57 *0.25 ***0.728.10 ***9.02 ***0.04 ***0.29 ***
(6.414)(5.827)(0.087)(0.626)(0.713)(0.659)(0.014)(0.079)
living−15.72 *8.660.171.78 **−3.33 ***−3.24 ***0.03 **0.12 *
(8.913)(8.097)(0.121)(0.870)(0.647)(0.598)(0.013)(0.072)
DCG2.7511.65 ***−0.04−0.652.22 ***2.16 ***−0.03 ***−0.14 **
(4.839)(4.396)(0.066)(0.473)(0.484)(0.448)(0.009)(0.054)
5A16.35 ***19.34 ***0.010.234.09 ***4.90 ***0.06 ***0.17 ***
(1.532)(1.392)(0.021)(0.150)(0.252)(0.233)(0.005)(0.028)
heritage18.20 ***4.820.090.102.06 ***2.40 ***0.020.64 ***
(5.008)(4.549)(0.068)(0.489)(0.602)(0.556)(0.012)(0.067)
air−1.02 **−1.31 ***−0.02 **−0.050.10 ***0.10 ***−0.00−0.00
(0.500)(0.454)(0.007)(0.049)(0.035)(0.032)(0.001)(0.004)
Constant−28.35−66.00 ***−0.10−5.07 **−14.34 ***−13.95 ***0.060.04
(26.288)(23.882)(0.357)(2.568)(1.985)(1.835)(0.039)(0.221)
Observations6376376376373575357535493575
R-squared0.8680.9130.9170.9340.8330.8230.7090.577
Note: *, **, and *** represent significance at the 10%, 5%, and 1% levels, respectively.
Table 4. Robustness check with IV regression.
(1)(2)(3)(4)
ndtrdtnitrit
The coefficient of HSR × Post for all cites3.25 ***2.78 ***0.05 ***0.38 ***
(0.687)(0.657)(0.009)(0.060)
The coefficient of HSR × Post for large cites−1.00−1.770.07 *0.70 **
(3.434)(3.062)(0.041)(0.305)
The coefficient of HSR × Post for medium-sized and small cites2.80 ***2.13 ***0.01 **0.05
(0.344)(0.319)(0.007)(0.039)
Note: For the sake of simplicity, the control variables and fixed effects are controlled but not reported, and the estimations use a two-stage least squares method with instrumental variables; *, **, and *** represent significance at the 10%, 5%, and 1% levels, respectively.

