Article

Does Corporate Charitable Giving Help Sustain Corporate Performance in China?

1
School of Business and Tourism Management, Yunnan University, Kunming 650091, China
2
Department of Apparel, Events, and Hospitality Management, College of Human Sciences, Iowa State University, Ames, IA 50011-1078, USA
3
School of Hospitality Business Management, Carson College of Business, Washington State University, Pullman, WA 99164-4742, USA
4
Tourism and Social Administration College, Nanjing XiaoZhuang University, Nanjing 211171, China
5
School of Business Administration, Anhui University of Finance and Economics, Bengbu 233030, China
6
College of Tourism and Landscape Architecture, Guilin University of Technology, Guilin 541006, China
7
Department of Tourism Management, School of Geography and Tourism, Research Center of Tourism Development and Planning, Qufu Normal University, Rizhao 276826, China
*
Authors to whom correspondence should be addressed.
Sustainability 2019, 11(5), 1491; https://doi.org/10.3390/su11051491
Submission received: 7 January 2019 / Revised: 5 March 2019 / Accepted: 6 March 2019 / Published: 12 March 2019
(This article belongs to the Section Economic and Business Aspects of Sustainability)

Abstract

:
We examined whether corporate charitable giving (CCG) in China benefits corporate performance (CP) in terms of sales growth (SG), return on asset (ROA), return on equity (ROE), and Tobin’s Q (TQ), and revealed several findings. First, testing shows variation in the impact of CCG on CP. Whereas the ratio of corporate charitable giving (RCCG) to total sales revenue does not significantly enhance SG, ROA, and ROE, it is positively related to TQ. Second, the positive relationship between RCCG and TQ originates from non-state-owned firms (NSOFs) rather than state-owned firms (SOFs). Third, Chinese firms may use CCG as traditional philanthropy to enhance long-term performance instead of strategically using it to generate short-term performance. Lastly, an inverted U-shaped relationship exists between RCCG and TQ, especially for NSOFs.

1. Introduction

As corporate charitable giving (CCG) is considered an essential tactic in managing political and business relationships, some studies have examined whether CCG can help improve corporate performance (CP). Previous studies have been done on the relationship between CCG and CP, indicating that CCG may be positively related to CP [1,2,3,4], negatively connected to CP [2,4,5], or may have no influence on CP at all [6,7,8]. Gao et al. [9] and Lin et al. [10] used event studies to evaluate the relationship between CCG and abnormal corporate returns in China and concluded that CCG is positively related to abnormal corporate returns. Gao et al. [9] also found that, although CCG is positively related to abnormal return within four days of an event, it is negatively related to return on asset (ROA) during the event window. Wang and Qian [11] studied the relationship between CCG and corporate performance in China from 2001 to 2006 and discovered a significantly positive relationship between CCG and ROA but no link between CCG and market-to-book ratio.
The concept of CCG has infiltrated the media, academia, and business alike in China [10,12]. China, today, is the world’s largest transition economy [13] and corporate charitable giving achieved 85.9 billion RMB (accounted for 70.7% of Chinese charitable donations) in 2015 [14], demonstrating that corporate giving plays a crucial role in China’s philanthropic culture. Since 2003, the Chinese government has required publicly listed companies to report on corporate social responsibility (CSR), facilitating the collection of data and prompting researchers to start studying CCG. Researchers have since suggested that Chinese firms that engage in CCG have different motivations for giving than those in western economies [9,10]. Previous studies have pointed out that Chinese firms use CCG to create or maintain political connections [11,15,16,17,18] and that managers may use this benefit [18,19]. Wang and Qian [11] stated that, in China, CCG might help firms obtain social legitimacy and gain political access; Gao et al. [20] reported firms in China experience notable uncertainty concerning government policies, and CCG tends to cultivate good relationships with the government.
The demand for charitable giving is burgeoning in this fast-developing, emerging market as consumers are becoming more conscious of their social commitments [21] and firms experience the benefits through CCG [2,3,14]. Some studies have focused on the impact of CCG on CP in China [9,10,22], but comparatively, little research has focused on the different effects of CCG on CP between state-owned firms (SOFs) and non-state-owned firms (NSOFs). Considering SOFs are prevalent in China [10,13] and, by nature, are connected to the government, the managers of those firms do not have to worry about political access and government protection compared to those of NSOFs [4,10]. NSOFs tend to engage in CCG to build and maintain political connections [13,17,19,23]. Ma and Parish [18] stated that owners of private firms (i.e., limited liability companies in which two or more natural persons invest or that are controlled by a single natural person) were not allowed to join the Communist Party before 2001, so they engaged in CCG in exchange for legal status and political access. Lin et al. [17] found NSOFs that build political connections through CCG more easily gain access to government subsidies, or that the government rewards those firms with future subsidies, allowing them to outperform firms that did not create a connection with the government. NSOFs donated more and earlier than SOFs [10,15].
The present study could serve as a quantitative measurement to determine how CCG potentially influences the CP of SOFs and NSOFs in China. We looked at longitudinal data collected from Chinese publicly listed firms between 2003 and 2016 to provide a comprehensive understanding of the effect of CCG on long-term CP and its differentiation between SOFs and NSOFs in China. We found most studies are event studies investigating the short-term financial impact, whereas longitudinal studies are not limited in scope and were used to display results demonstrating the long-term effects of CCG on financial performance through examining sales growth (SG), ROA, return on equity (ROE), and Tobin’s Q (TQ). Empirical test results from this study should lead to a better understanding of the extent to which CCG impacts on CP are different in China’s SOFs and NSOFs.
The purpose of this study was to explore CCG’s impact on Chinese firm CP through an analysis of empirical data. Three major results were produced from the testing model. First, CCG can improve firms’ long-term CP measures of TQ, but not short-term CP measures of SG, ROA, and ROE. Second, the empirical results reveal that NSOFs initiate the impacts of CCG on CP, which means CCG can significantly enhance the long-term CP of NSOFs, but it cannot enhance long-term CP of SOFs. Finally, the results demonstrate that the positive impacts of CCG on long-term CP will be negative once CCG reaches the optimal point. Third, we found that, compared to western countries, the average portion of CCG to sales (RCCG) is low in China, which may be a possible reason that CCG cannot increase short-term CP. The findings from this study not only shed light on the relationship between CCG and long-term CP among the different ownership firms in China, outlining important managerial implications, but also contribute to the finance research literature by extending Griffin and Mahon’s model to understanding the link between corporate social performance and corporate financial performance in China’s state ownership and corporate governance firms.
The remainder of this paper is divided into five main sections. Section 2 discusses the development of hypotheses. Section 3 describes the data and defines the study variables. Section 4 presents a test model and reports empirical results. Section 5 discusses and provides implications from the results of this study. Finally, Section 6 outlines some plans for future development.

2. Literature Review

Corporate charitable giving is a component of CSR defined as the donation of a portion of a firm’s profits and/or resources to non-profit organizations in support of education, culture, healthcare, or natural disaster relief [1,11,24]. Yu and Choi [25] pointed out that previous studies [26,27,28,29] on the relationship between CSR and CP are inconclusive. Agle et al. [26] and Heinze et al. [27] both determined the relationship between CSR and CP to be positive, whereas Margolis and Walsh [29] noted a negative relationship, and Jin and Drozdenko [28] found no significant relationship between CSR and CP at all.
Since CCG is considered a discretionary dimension of CSR [30], making sense of the relationship between CCG and CP is challenging. Adopted by corporations as an aspect of CSR fulfillment, CCG is a public, academic, and government consideration [1,3,22,31,32]. Friedman’s announcement that “the social responsibility of business is to increase its profit” [31] (p. 122) prompted a fierce debate about whether corporations should engage in philanthropic activity.
According to agency cost theory, CCG may distract managers’ attention from profit maximization and exhaust corporate resources that should be dedicated to shareholders or other lucrative investments, hence damaging a firm’s interests and shareholder value [2,3,24]. In other words, CCG is an additional agency cost that managers use to achieve status, power, security, and prestige [2,33,34]. Conversely, Navarro [3] claimed that CCG should be treated as an ordinary business expense based on profit maximization, and that firms can do well by doing good [35,36]. Based on value enhancement theory, however, CCG can potentially enhance branding and public recognition, attract employees, and grow consumer preference [1,3,4], and researchers argue that CCG may maximize the value of a corporation.
Strategic philanthropy offers a compromise [37]. From the perspective of strategic management, a company’s philanthropic strategy combines competitive maneuvering and business approaches that please customers to compete, as well as to achieve organizational objectives [38]. Strategic philanthropy is defined as corporate giving that benefits the community as well as the firm [32,39,40] by realizing two goals—charity and profitability [8,32]. Sponsorship and cause-related promotion are naturally connected to marketing [39], so they are perceived as strategic philanthropy. Since the returns of CCG are difficult to measure [41,42], CCG may be a viable strategy for improving CP [1,32], or it may have no impact.
Porter and Kramer [32] noted that since corporations are part of society, CCG may enhance the corporate competitive context. CCG can integrate a corporation’s social financial goals as a means to enhance long-term performance. Godfrey [1] assumed that CCG should be a rational decision in which managers should engage, stating that CCG potentially enhances CP in two ways—by generating moral reputation capital that improves stakeholder and community perception of the corporation, thus adding strategic value to firm, and by furnishing insurance protection for firms in bad condition.
If CCG is used to acquire legitimacy or gain support from the government, it may not influence sales, so it is difficult to determine whether CCG directly benefits a firm’s performance. Although Seifert et al. [8] (Figure 1) noted that strategic philanthropy addresses both charity and profitability, it is not definite whether CCG has true strategic value if it does not contribute to CP. They claimed that using traditional philanthropy to donate to causes will affect a corporation’s long-term CP rather than short-term CP, which is influenced by strategic philanthropy.
Previous empirical studies offer mixed findings [3,4,6,7,8,24,36,43,44] about the relationship between CCG and CP, especially when using ROA, ROE, and return on sales (ROS) as the means of measurement. For example, Griffin and Mahon [7] found that CCG is not correlated with CP when measured by ROE, ROS, or ROA. Consistent with this study, Berman et al. [6] determined there is no significant relationship between CCG and CP when measured by ROA, and Seifert et al. [8] revealed a negligible impact of CCG on corporate stock performance. These studies indicated that CCG does not influence short-term CP. Lev et al. [36] argued that CCG from American companies enhances consumers’ satisfaction and is positively related to sale growth, suggesting that CCG may increase future revenue growth. Hategan and Curea-Pitorac [44] provided evidence that CCG positively relates to ROE and TQ in Romania, and Liang and Renneboog [33] suggested that CCG positively influences financial performance and corporate value with its global sampling of firms.
Different from the studies mentioned above, Wang et al. [4] found links between CCG and CP measures of ROA and TQ are an inverse U-shape, indicating ROA and TQ improve as CCG increases and then deteriorate after CCG exceeds its optimal level. Chen and Lin [24] evaluated the hospitality industry in Taiwan and also found an inverted U relationship between CCG and CP measures of ROA, ROE, and TQ. Considering ROA and ROE are indicators of a corporation’s current profitability, and TQ predicts a corporation’s future growth, CCG may actually influence both short- and long-term CP.

3. Development of Hypotheses

Given that the impact that CCG has on CP is different according to geographic location [1,37], Wang et al. [43] studied the link between CCG and CP in the Chinese hospitality industry and found, for hotel firms, the relationship between CCG and SG, ROA, and ROE is an inverted U-shape. Both Chen and Lin [24] and Wang et al. [43] studied the impact of CCG on the CP of the hospitality industry, but the empirical results were inconsistent. With the majority of previous studies on CCG being conducted by researchers from the United States (U.S.) (74%) and the United Kingdom (U.K.) (13%) [45], Wang et al. [43] noted that there is limited research available to address the relationship between CCG and CP in China.
Lin et al. [10] studied how the market reacted to 136 firms’ donation announcements after the Wenchuan earthquake and found a significantly positive relationship between CCG and corporate abnormal return that occurred for seven days. Gao et al. [9] did the same with an applied sample of 221 firms and found that the positive relationship between CCG and abnormal return continued for four days. Wang and Qian [11] further tested the relationship between CCG and CP measured by ROA and market-to-book ratio and concluded CCG is positively related to ROA but showed no significant connection between CCG and market-to-book ratio. Based on the premise that corporations may contribute CCG in an effort to intensify their firms’ brand and consumer recognition, and that this will increase CP via sales growth [1,3,36,37,46], we propose the following hypotheses:
Hypothesis Ia:
CCG is positively related to short-term CP in China.
Hypothesis Ib:
CCG is positively related to long-term CP in China.
Studies have pointed out that, in China, the government plays a crucial role in regulating and sometimes micromanaging the economy [10,18,19,20,47]. Firms in China may build or maintain a connection to the government through CCG, which results in the provision of more assistance from the government than firms who do not engage in CCG [19,23]. Accordingly, previous studies have shown that Chinese firms engage in charitable donations to build or maintain links with the government in order to establish legitimacy or obtain government subsidiaries [15,16,17].
The risks and purpose of SOFs and NSOFs for engaging in CCG are different [48]. SOFs are naturally connected to the government and have easier access to political and financial support including business licenses, subsidiaries, loans from state-owned banks, and sales channels [49,50]. So, the managers of those firms do not worry as much about political access and government protection [4,11]. Compared to SOFs, NSOFs are more willing to donate and to donate more [10,13,17,19,51]. Ma and Parish [18] claimed that, in the 1990s, NSOFs donated to government welfare programs in exchange for political access and legitimacy. NSOFs in China are more likely to donate in order to build or maintain political connections [17], making it easier for NSOFs to obtain legitimacy and critical resources from the government [23,51] and loans from stated-owned banks [19]. Based on these findings, we propose the following hypothesis:
Hypothesis II:
The positive impact of CCG on CP is more significant for NSOFs than for SOFs.
Godfrey [1] pointed out there is an optimal point at which CCG increases CP, and Wang et al. [4] found a curvilinear relationship between CCG and CP. Specifically, both researchers noted that the relationship between CCG and ROA, as well as between CCG and TQ, is an inverted U-shape, which indicates an optimal level that, once surpassed, produces a decrease in ROA and TQ. Chen and Lin [24] studied CCG’s effect on hospitality firm performance in Taiwan and found that CCG influences ROA, ROE, and TQ in an inverted U-shape, suggesting that higher CCG leads to higher ROA, ROE, and TQ. However, once CCG surpasses the optimal point, the effects of CCG on ROA, ROE, and TQ become negative.
Wang et al. [43] tested the link between CCG and CP (measured by sale growth, ROA, ROE, and TQ) in the Chinese hospitality industry; however, they did not find the same conclusion. The Chinese study pointed to an inverted U-shape relationship between CCG and SG, ROA, and ROE in the hotel industry, which suggests CCG can enhance ROA and ROE by increasing SG before CCG reaches the optimal level. Once it surpasses the optimal level, SG, ROA, and ROE will decrease. This study also revealed that CCG does not significantly affect hotel firms’ future growth as measured by TQ.
Since CCG transfers wealth from firms to society [1] and is a kind of cost for firms [3], it is valuable to investigate if an optimal point of the impact of CCG exists on short- and long-term CP in China. Thus, based on Hypothesis I, we propose the following hypothesis:
Hypothesis III:
There is an optimal point of the positive relationship between CCG and CP, and once CCG exceeds the optimal point, the relationship reverses to produce a negative impact.
Given that Wang and Qian [11] tested the relation between CCG and CP in Chinese firms, it is necessary to distinguish our study from theirs. First, they adopted ROA and market-to-book ratio as CP measures, whereas this study applies SG, ROA, and ROE as measures of short-term CP, and TQ as a measure of long-term CP, in order to identify how CCG specifically influences CP. Second, this study relies on longitudinal data from 2835 firms between 2003 and 2016 to test the effect CCG on CP, whereas Wang and Qian [11] used a sample of 1453 firms from 2001 to 2006. During this period, the sample of publicly listed firms nearly doubled, so the longitudinal data provide a more comprehensive understanding of the effect of CCG on CP. Third, we tested the optimal level of CCG. Whereas Wang and Qian’s [11] test showed a significant positive link between CCG and ROA, they did not consider the optimal level of CCG. Considering that CCG is a rational arrangement of corporate resources, it is necessary to determine the optimal point of CCG.

4. Data and Variables

The total value of CCG in China in 2003 was 3.33 billion RMB (Figure 2), and it reached 13.37 billion RMB in 2016, which is an increase of almost 302%. Considering the ratio of CCG to sales (RCCG), RCCG increased from 0.029% to 0.039% from 2004 to 2011, respectively, except in 2008 (0.09%) when the Wenchuan, Sichuan earthquake struck, and in 2010 (0.054%) when the Yushu, Qinghai earthquake hit. Since 2011, RCCG decreased each year, even when a 7.0 earthquake struck Yaan, Sichuan in 2013. In 2016, RCCG was 0.029%, which is the same as in 2003. While the number of donations increased, RCCG declined. This data prompted us to question why the proportion of CCG to sales is decreasing, and how CCG influences firm performance in China. In order to answer these questions, it is necessary to understand the relationship between CCG and CP.

4.1. Data Collection

The sample for this study was composed of all listed firms on the Shenzhen and Shanghai Stock Exchange between 2003 and 2016. The sample consisted of an unbalanced panel with 2835 firms, excluding the finance industry as their accounting standards are different from other industries. After removing abnormal data and unavailable data years, there were approximately 25,487 firm-year observations that contained the independent variable CP measures of SG, ROA, ROE, and TQ, and dependent variable CCG measures of corporate giving in cash/sale growth (RCCG).
The corporate performance data of each year and the measurement of firm ownership were collected from the China Stock Market and Accounting Research (CSMAR) database [52]. We collected CCG in cash information from corporate annual reports through the China Information [53]—the official information-disclosure website for publicly listed firms appointed by the China Securities Regulatory Commission.

4.2. Variables

Consistent with Brammer and Millington [54], Chen and Lin [24], and Lev et al. [36], we adopted the ratio of corporate charitable giving (CCG) to sales revenue (SR) as the independent variable (RCCG):
R C C G t = C C G t / S R t × 100 % .
We use sales growth rate (SG), ROA, ROE, and Tobin’s Q (TQ) to measure firm performance (please note that we have examined the impact of RCCG on stock return, and test results showed that RCCG has no significant effect on stock returns for SOFs and NSOFs). SG represents consumer preference. ROA is a signal of asset use, and ROE is commonly used to measure profitability. TQ is a measure of future growth opportunity.
SG is calculated as:
S G t = ( S R t S R t 1 ) / ( S R t 1 ) × 100 % .
Two common profitability measures, ROA and ROE, are defined as:
R O A t = N I t / T A t
R O E t = N I t / T E t
where NI denotes net income, TA represents total assets, and TE is total equity. We follow Chen and Lin [24] in using TQ to measure future growth opportunity:
T Q t = M V t / R V t
where MV is a firm’s market value, computed as the sum of the market value of common stock plus the book value of preferred stock and debt, and RV is the replacement value of its assets, defined as the book value of total assets [55]. A firm with a larger, long-term growth opportunity is expected have a higher TQ. Note that only RCCG and SG are percentages; ROA, ROE, and TQ are not.
The first control variable is the company’s debt ratio (LEV) and is calculated as total debt divided by total assets. The total debt and total assets are the values at the end of each year. A high LEV implies the company has high principal and interest payments and lacks sufficient cash flow for meeting its debt obligations. Thus, LEV is expected to be negatively related to a firm’s performance.
The second control variable is firm size (SIZE) and is derived from the natural logarithm of the total assets. The variable SIZE is expected to have a positive effect on a firm’s performance because larger firms would have greater market power and greater ability to adjust to economic and social changes in order to perform well [47].
The third control variable is a dummy variable of state-ownership (SOP). Li et al. [16] claimed that 60.43% of firms were controlled by the state in China, and that, compared to SOFs, NSOFs are more likely to build political connections through CCG in order to gain resources controlled by the government. For that reason, we used SOP as a dummy variable. The CSMAR database provides corporate governance structure and assigns a value of 1 to a state-owned company that is ultimately controlled by Chinese governments at all levels and a value of 0 to non-state-owned companies that are controlled by a private entity or a family [10,16,22].
Table 1 summarizes the statistics of the study variables. The mean value of SOP was 0.4875, meaning 48.75% of our sample firms were SOFs (1382 firms) compared to 60.43% in 2013 [16,22]. This shows that, following China’s joint-stock reform, the number of stated-owned firms decreased. From 2003 to 2016, RCCG ranged from 0.00% to 0.98% with a mean of 0.03% and a standard deviation of 0.08%, suggesting that Chinese listed companies spent 0.03% of their sales revenue on CCG. NSOFs had a higher value of RCCG than SOFs. The mean of RCCG for NSOFs (0.04%) was two times that of SOFs (0.02%).
As exhibited in Table 1, SOFs have the same mean values of ROA as NSOFs, though SOFs have higher mean values of ROE, LEV, and firm size, and NSOFs have higher values of TQ and SG. The statistics suggest, in general, that SOFs have a higher debt ratio and larger firm size, whereas NSOFs perform better in sales growth and future growth.

5. Panel Regression Test and Empirical Results

5.1. RCCG Significantly Enhances Long-Term CP Rather than Short-Term CP

To test the effect of RCCG on short- and long-term CP, we applied panel regression based on data from nearly 2835 Chinese companies that were publicly traded between 2003 to 2016. The panel regression specified the time-varying relationship between RCCG and CP variables, provided control for the heterogeneity of individual firms, and reduced the problems associated with multicollinearity and estimation bias [56,57].
In order to evaluate if RCCG can enhance CP, we calculated the following panel regression tests, applying the short-term CP measures of SG, ROA, and ROE to test Hypothesis Ia, and using the long-term CP measure of TQ to test Hypothesis Ib:
C P i , t = β 01 + β 11 R C G G i , t + β 21 L E V i , t + β 31 S I Z E i , t + β 41 S O P i , t + ε i , t
where CPi,t denotes i firm’s short-term performance measures of SG, ROA, and ROE in time t, and long-term performance measure of TQ in time t. Note that when running all panel regression tests, in addition to controlling the year effect, we used the F-test and the Hausman tests [58] to determine whether pooled ordinary least square (OLS), fixed effects, or random effects would be the appropriate estimation method [59].
Based on the F-test, the fixed effects model outperforms the pooled OLS when the null hypothesis indicates that the pooled OLS model is more appropriate than the fixed effects model (F-statistic is greater than F-test critical value). Accordingly, when the fixed effects method is more appropriate than the pooled OLS method, we performed the Hausman test [58] to see if the fixed or random effects method should be used when performing panel regression test. The fixed effects model was selected if the test statistic was significantly larger than the critical value, rejecting the null hypothesis that the random effects model is more appropriate than the fixed effects model.
As shown in Table 2, the coefficients of RCCG and SG (Panel A), ROA (Panel B), and ROE (Panel C) were not statistically significant at the 10% level, but the coefficient of RCCG on TQ (Panel D) was statistically significant at the 10% level, and the explanatory power of RCCG on TQ was 12% according to the adjusted R2. Test results failed to support Hypothesis Ia—that CCG can improve short-term CP—but they do support Hypothesis Ib—that CCG can benefit long-term CP. According to the panel regression results, our findings show partial differences from our expectation that LEV should be negatively related to CP. The result shows LEV positively influenced SG at the 10% level, but was negatively related to ROA and ROE at the 1% level, and was negatively related to TQ without significance. SIZE was positively related to SG, ROA, and ROE at the 1% level but negatively related to TQ at the 1% level, which differs partially from our assertion that firm size should be positively related to CP. The relationships between SOP and SG, and SOP and TQ, were both significantly negative at the 1% level, and the coefficient of SOP and ROA was negative but insignificant.

5.2. Impact of CCG on Long-Term CP is Significant for NSOFs

Table 3 presents the estimation of Equation (6) for SOFs with the panel regressions showing that the variable RCCG was not associated with short-term CP measures of SG (Panel A), ROA (Panel B), or ROE (Panel C), and long-term CP measures the TQ (Panel D) for SOFs. Notably, we found that SIZE was negatively related to SOFs’ TQ. Panel regression results show LEV was negatively related to ROA and TQ at the 1% (0.5%) level, whereas SIZE was positively related to ROA and ROE at the 1% (5%) level but negatively related to TQ at the 1% level. SG had no significant link with ROA, ROE, or TQ.
Table 4 presents the empirical results of NSOFs, and the panel regressions show that RCCG did not significantly influence SG (Panel A) or short-term CP measures ROA (Panel B) and ROE (Panel C). However, Panel D shows the coefficient of RCCG and TQ was significantly positive at the 10% level, and the explanatory power of RCCG on TQ for NSOFs was 73% according to the adjusted R2. Empirical test results show LEV was negatively related to ROA at the 1% level and was positively related to TQ at the 1% level. The positive relationships between SIZE and SG and ROE are significant at the 5% (1%) level, but SIZE was negatively related to TQ at the 1% level. SG had no significant influence on ROA, ROE, or TQ. The results in Table 3 and Table 4 support Hypothesis II—that the impact of CCG on CP is different for SOFs and NSOFs.

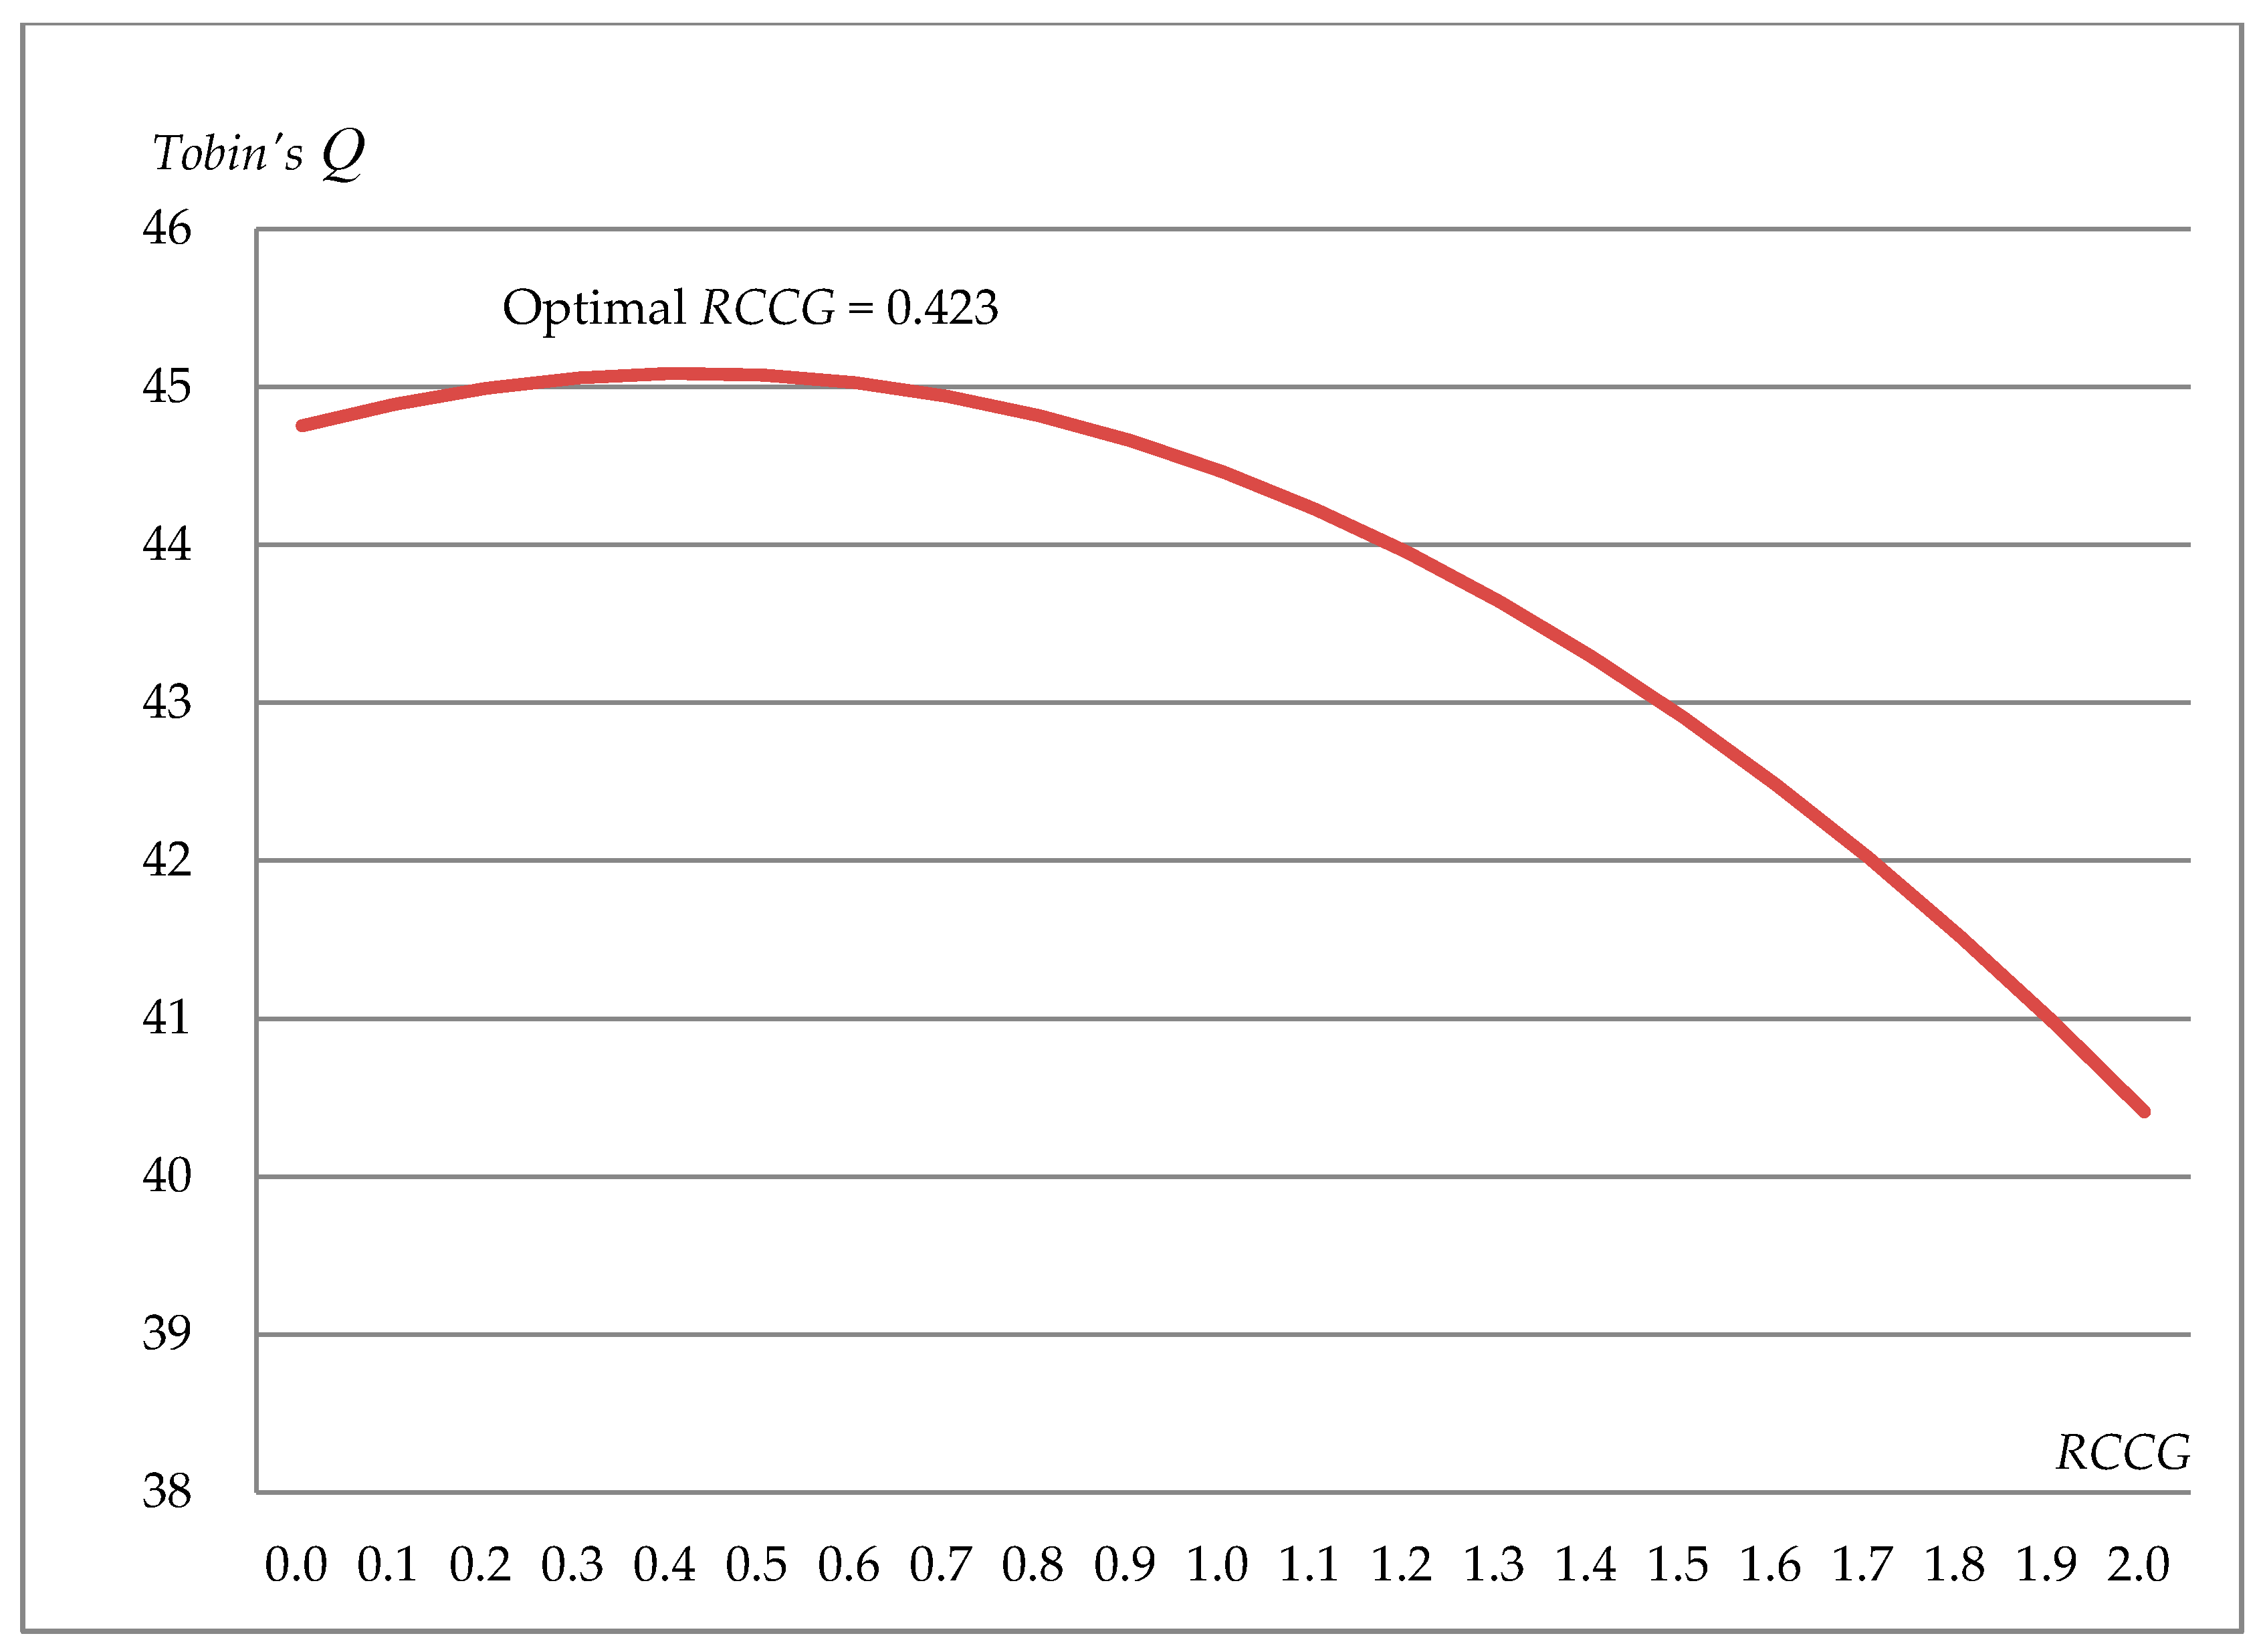
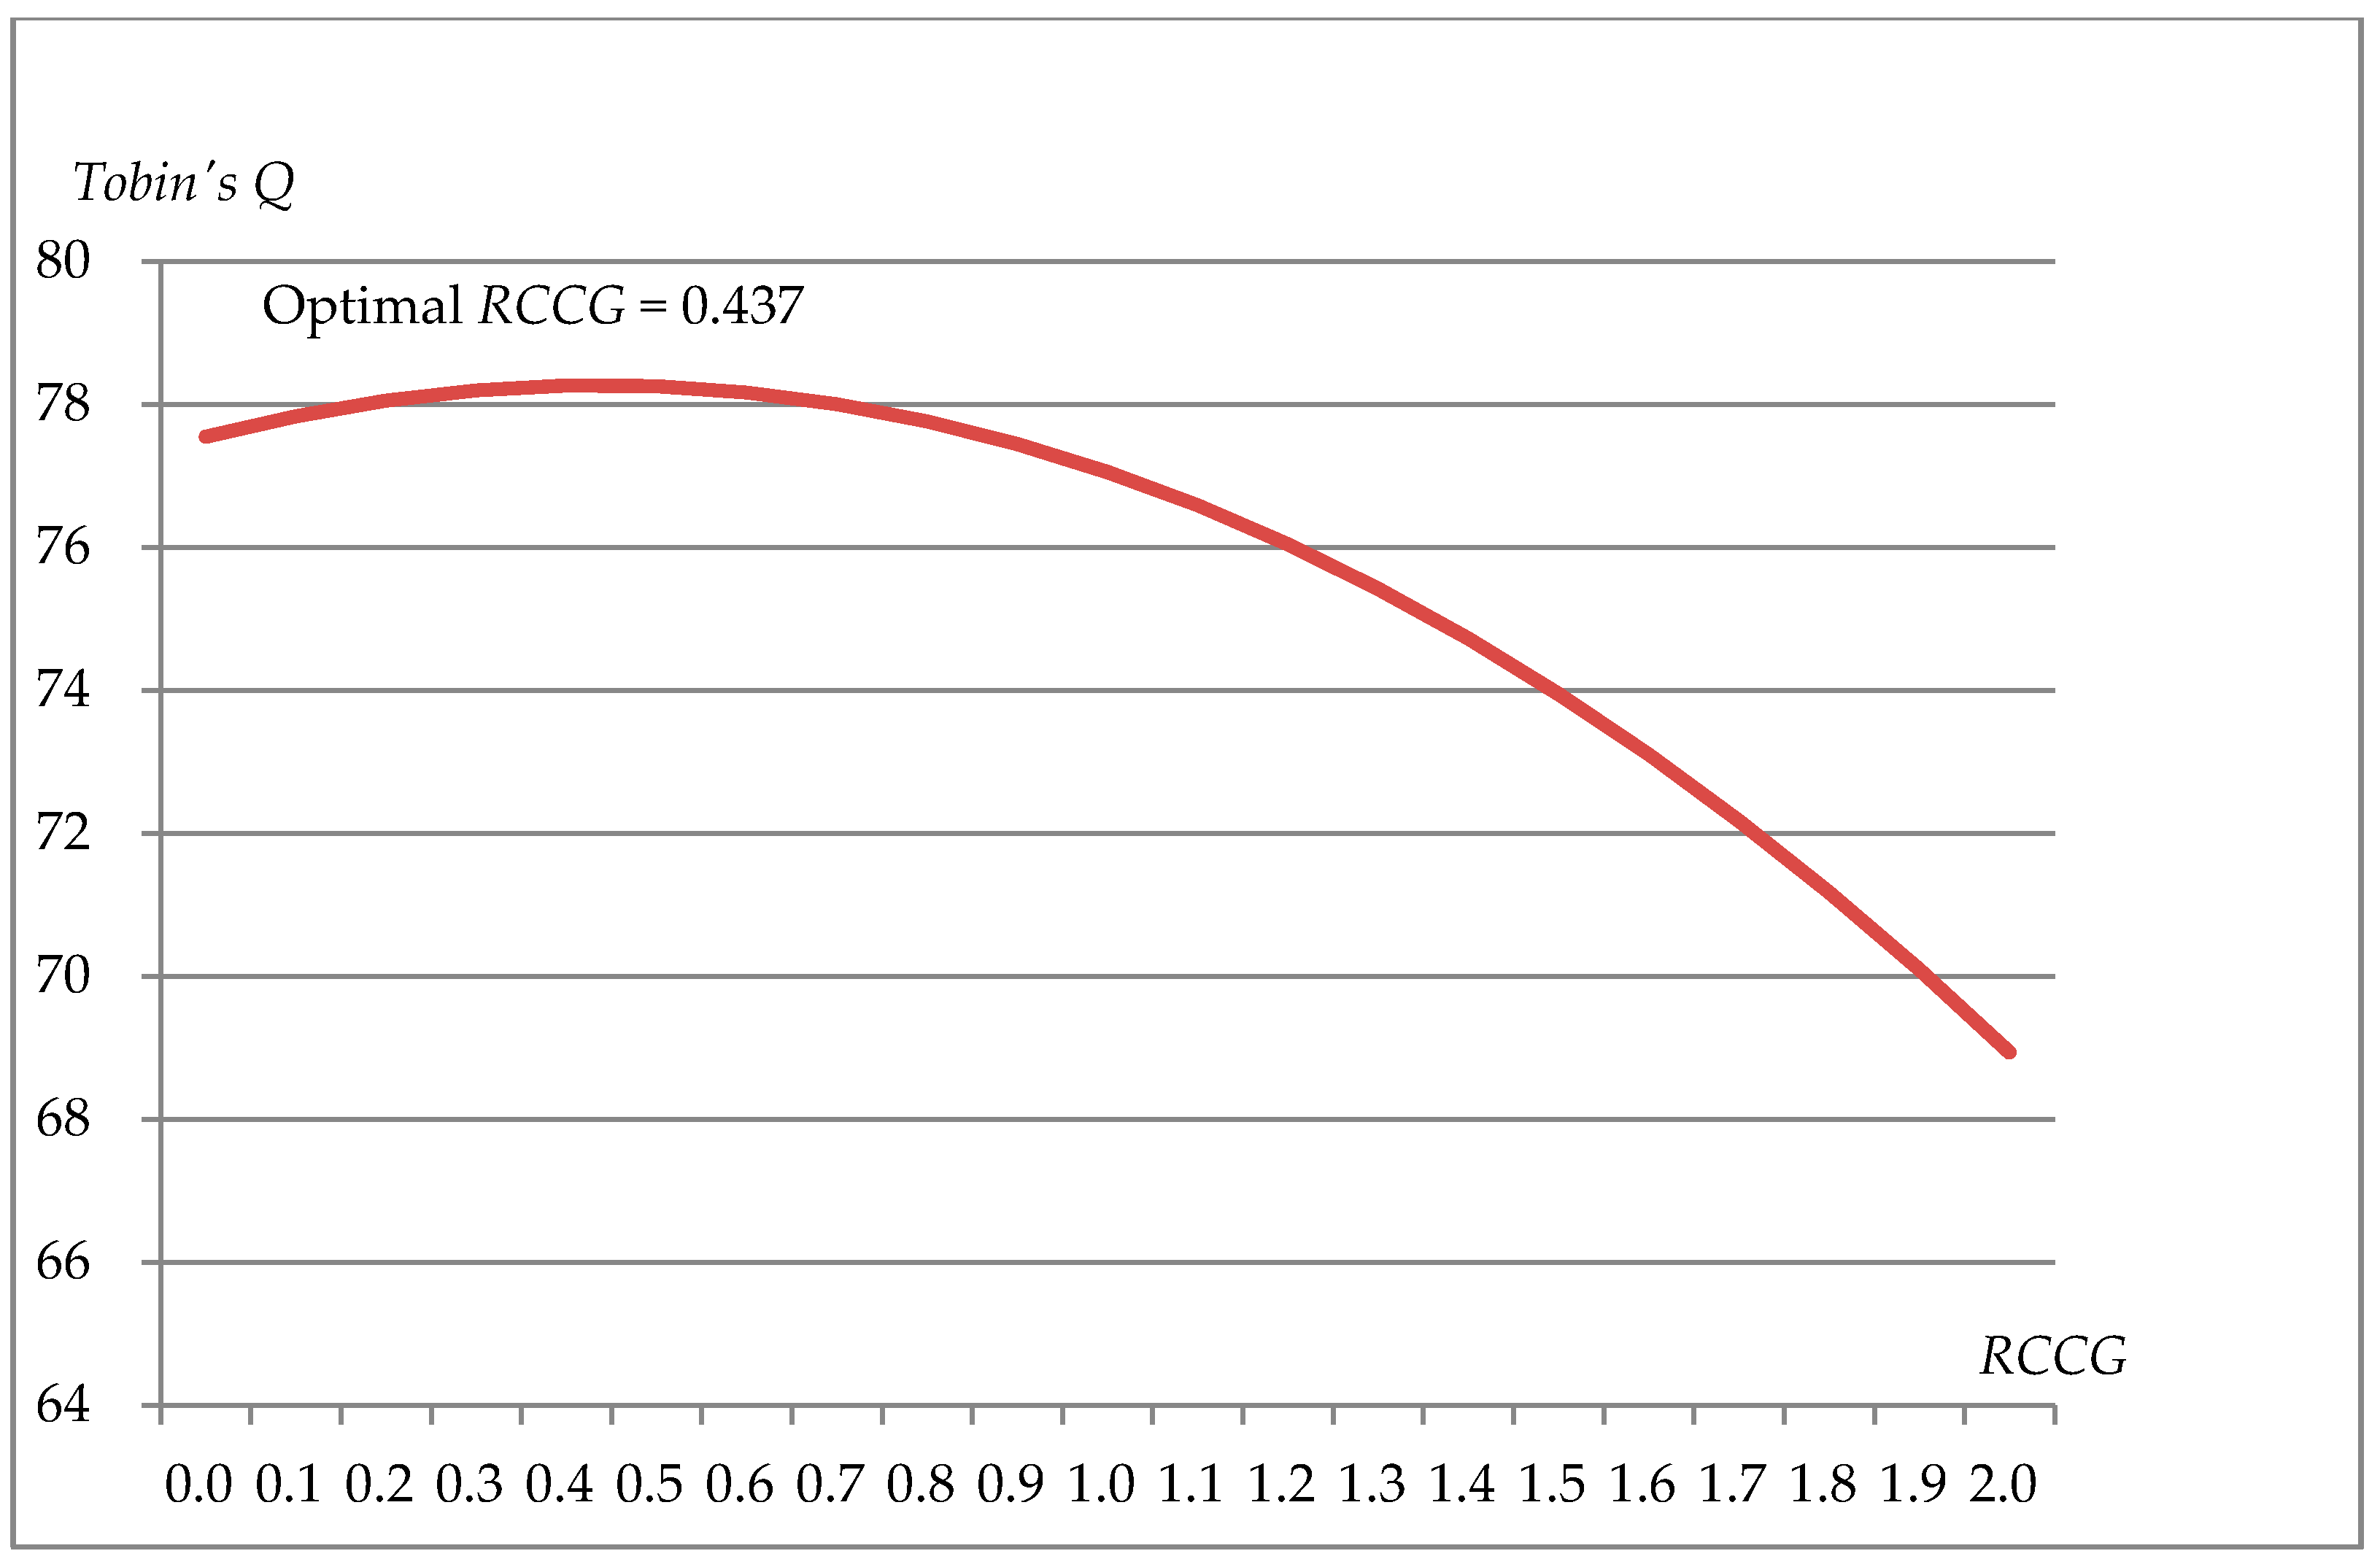
5.3. Optimal Level of RCCG on CP

To test the optimal level of RCCG on sales (i.e., consumer preference) and CP (measured by SG, ROA, ROE, and TQ), we included both the linear and quadratic terms for RCCG in the regression equation and performed the following panel regression tests:
C P i , t = λ 01 + λ 11 R C C G i , t + λ 21 R C C G i , t 2 + λ 31 L E V i , t + λ 41 S I Z E i , t + λ 51 S O P i , t + ε i , t
where CPi,t denotes i firm’s short-term performance in terms of SG, ROA, and ROE at time t, and long-term performance in terms of TQ at time t.
According to the framework given in Equation (7), the optimal level of RCCG on CP exists if γ21 and λ21 are significantly different from zero. There is a U-shaped or an inverted U-shaped effect of RCCG on firm performance if γ11, λ11, γ21, and λ21 are significantly different from zero. For example, if γ11 = 0, λ11 = 0 and γ21 = 0 and γ21 = 0 are rejected, and γ11 < 0 (γ11 > 0), λ11 < 0 (λ11 > 0), and γ21 > 0 (γ21 < 0) and λ21 > 0 (λ21 < 0), there is a (an inverted) U-shaped relationship between RCCG and firm performance. The relationship between RCCG and firm performance is linear instead of curvilinear if γ11 = 0 and λ11 = 0 are rejected and γ21 = 0 and λ21 = 0 are not rejected.
We also used the F-test and the Hausman tests [58] to determine whether OLS, fixed effects, or random effects would be appropriate estimation methods when performing panel regression tests [59]. Panel regression test results of RCCG and RCCG2 on SG, short-term CP, and long-term CP are summarized in Table 5 for all listed firms, Table 6 for SOFs, and Table 7 for NSOFs. As shown in Table 5, Table 6 and Table 7, the effects of RCCG and RCCG2 on SG and short-term performance of ROA and ROE for all listed firms are not statistically significant at the 10% level with low explanatory power (adjusted R2 value). After all listed firms were divided into SOFs (Table 6) and NSOFs (Table 7), the results were consistent with the results from all listed firms, indicating that RCCG and RCCG2 do not significantly affect SG (Panel A) or short-term performance of ROA (Panel B) or ROE (Panel C).
The findings of panel D presented in Table 5 and Table 7 partly support Hypothesis III that there is an optimal level of effect of RCCG on long-term CP measured by TQ. To be more specific, the corresponding coefficients of RCCG and RCCG2 on long-term performance measures of TQ for all listed firms were 1.59 and –1.88, which are statistically significant at the 1% (5%) level with an explanatory power of 47% according to the adjusted R2 (Panel D in Table 5). Table 5 also provides evidence that LEV was negatively associated with the CP measures of ROA, ROE, and TQ. Additionally, SIZE was positively related to the CP measures of ROA and ROE, but negatively related to CP measures of TQ. SOP was negatively related to SG and TQ but had no significant influence on ROA and ROE.
Panel D of Table 7 demonstrates that the corresponding coefficients of RCCG and RCCG2 on long-term performance measures of TQ for NSOFs were 3.33 and –3.82, respectively, which were statistically significant at the 5% (1%) level with the adjusted R2 of 0.73. Table 7 shows that LEV was negatively related to ROA and ROE, but was positively associated with TQ. The relationships between SIZE and SG and ROE were significantly positive, but the relationship between SIZE and TQ was significantly negative.
For the SOFs, Table 6 shows that neither RCCG nor RCCG2 had a significant influence on TQ. RCCG had no impact on CP, regardless of being short-term or long-term. These finding partly support hypothesis II that the effect of CCG on CP is different between SOFs and NSOFs. The results of panel regression presented in Table 6 shows LEV negatively influenced the ROA and TQ of SOFs, and SIZE positively affected ROA and ROE, while being negatively related to TQ.
In order to find the optimal point of RCCG to maximize the TQ value, the optimal point of RCCG on TQ for all listed firms, Equation (8), or just NSOFs, Equation (9), can be calculated using the following estimations:
T Q = 44.75 + 1.59 R C C G 1.88 R C C G 2 0.02 L E V 1.95 S I Z E + 0.00 S G 0.44 S O P
and
T Q = 77.54 + 3.33 R C C G 3.82 R C C G 2 + 2.36 L E V 3.54 S I Z E + 0.00 S G .
To compute the corresponding optimal RCCG level maximizing TQ for all listed firms (6) and NSOFs (7), the study takes the derivative of equations (8) and (9) with respect to RCCG and the equations then become:
0 = 1.59 − 2 × 1.88 × RCCG
and
0 = 3.33 − 2 × 3.82 × RCCG.

6. Discussion and Implications

6.1. Discussion

Current studies about CCG in China generally focus on the motivation for CCG [11,16,17], though a few studies have attempted to evaluate whether CCG may influence CP in China [10,22,34]. This study provides a comprehensive understanding of the relationship between CCG and CP in China. Before the panel regression, we found that Chinese firms donate too little. The average RCCG was 0.03%, with RCCG for NSOFs (0.04%), being two times that of RCCG for SOFs (0.02%). In comparison, British firms donated around 0.2% of their pre-tax profits in the 1980s [60] and American firms donated around 1.3% of their pre-tax profits in 1999 [37]. Compared to corporate donation in those countries, Chinese firms donated less than 0.1% annually between 2003 and 2016, even in years when natural disasters struck (Figure 2). Perhaps, if a clear incentive for CCG is established by showing that it can influence a corporation’s CP, then Chinese business will be more likely to donate. The empirical testing conducted in this study reveals several results that enrich the existing literature about the relationship between CCG and CP.
First, CCG in China does not enhance firms’ short-term CP measures of SG, ROA, and ROE, which may be one reason why a portion of CCG is declining in China which differs from Wang and Qian’s [10] conclusion that CCG can increase the customer satisfaction, thus benefiting ROA. Considering Wang and Qian [11] used data from publicly listed firms between 2001 to 2006, just two years before and after the Chinese government started requiring publicly listed firms to report their CSR in 2003, they may have underestimated the influence of policy in affecting CCG on ROA. In comparison, we adopted longitudinal data from 2003 to 2016, which offer more complete information about the relationship between CCG and CP. Brammer and Millington [54] pointed out that CCG may enhance CP by improving a firm’s reputation and demonstrated that reputation is accumulated through stakeholder judgment, and Godfrey [1] noted that CCG may nurture worker morale which enhances work efficiency and, in turn, improves CP, which benefits CP in the long-term. With this in mind, CCG in China may be more of a reputation generator or efficiency accelerator rather than a form of strategic advertising.
Second, the test results provide evidence that the impact of CCG on CP is different between SOFs and NSOFs, which we expected. In other words, CCG can significantly enhance a corporation’s future growth, which is measured by TQ, for NSOFs, though the opposite is true for SOFs. RCCG does not appear to influence TQ for SOFs, though it produces some improvement in TQ for NSOFs. This means that charitable giving can benefit the long-term CP of NSOFs but does not seem to impact SOFs. Su and He [23] established that NSOFs in China experience more difficulties during operation and that those firms must engage in CCG in order to protect property rights and preserve political connections that generate good performance. Gao et al. [20] claimed that CCG in China may decrease environmental uncertainty. Our study provides empirical evidence to support that CCG is a traditional philanthropy approach that helps NSOFs benefit in the long-term rather than strategic philanthropy that enhances CP in the short-term.
Third, there is an optimal point for the positive effect of CCG on long-term CP. The inverted U-shaped relationship between RCCG and TQ means that TQ only continues to grow with RCCG until it surpasses the optimal point. Then, RCCG is negatively related to TQ. By separating all listed firms into SOFs and NSOFs, our findings suggest that the relationship between RCCG and TQ for NSOFs is an inverted U-shaped with an explanation power as high as 73%, but there is no significant relationship between RCCG and TQ for SOFs.
According to Equation (6), for all Chinese listed firms, the optimal point at which RCCG maximizes TQ is 0.423%. Figure 3 shows the inverted U-shaped relationship between RCCG and TQ. Likewise, Equation (7) shows that the optimal point at which RCCG maximizes TQ for NSOFs is 0.437% (Figure 4).

6.2. Policy Implications

Considering the optimal point of RCCG that maximizes TQ is about 14 times higher (0.423 divided by 0.03) than the sample mean of RCCG (0.03%) for all Chinese firms from 2003 to 2016, and the point of RCCG that maximizes TQ for NSOFs is about 11 times (0.437 divided by 0.04), these conclusions can provide meaningful policy implications.
First, firms may donate more to increase public preference. Compared to donations by American and British firms, Chinese firms donate much less, at just 0.03% of the sales (0.04% for NSOFs, and 0.02% for SOFs). Since the future growth measures of TQ continue to grow before RCCG for all listed firms (NSOFs) reaches 0.423% (0.437), firms in China may want to consider donating more in order to maximize the positive influence of CCG.
Second, because they have access to more resources than NSOFs, SOFs should donate more to support the good of society. Although our empirical results show that CCG does not enhance CP for SOFs, the static table shows that donations by SOFs are half that of NSOFs on average. Given SOFs have natural political connections [49], SOFs are in a position to benefit the community more rather than just building or maintaining political connections.
Third, corporate managers in China would do well to assess the value of CCG in the long-term rather than in just the short-term. Carroll [30] stated that strategic philanthropy should fit the firm’s mission, goals, and objectives, and Godfrey [1] pointed out that CCG is a transfer of wealth. So, managers should be prepared to show how CCG can help their bottom line; otherwise, CCG may be seen as an action that managers use solely to benefit their own interests [2,61,62].

7. Limitations and Future Study Considerations

The main limitations of this study are as follows. First, we were limited by the data and only tested the relationship between the CCG and CP of publicly listed firms in China. Considering the micro-operation environments of publicly listed firms and non-listed firms are different, meaningful future studies should focus on how CCG influences non-listed firm performance. Second, this study shows that CCG may influence long-term performance, but does not identify how CCG benefits long-term performance. Given that long-term performance may be enhanced through higher work efficiency, good firm image, and easier access to resources and/or support, studies will need to stay current by focusing on political motivations for participating in CCG as well as how CCG influences firm image and work efficiency in China.

Author Contributions

Conceptualization, K.W. and M.-H.C.; methodology, M.-H.C.; formal analysis, Y.M., Z.W. and T.W.; data collection, Z.W. and T.W.; writing—original draft preparation, Y.M.; writing—review and editing, C.-H.S.; visualization, C.-H.S.; supervision, K.W. and M.-H.C.

Funding

This research received no external funding.

Conflicts of Interest

The authors declare no conflict of interest.

References

  1. Godfrey, P.C. The relationship between corporate philanthropy and shareholder wealth: A risk management perspective. Acad. Manag. Rev. 2005, 30, 777–798. [Google Scholar] [CrossRef]
  2. Brown, W.; Helland, E.; Smith, K. Corporate philanthropic practices. J. Corp. Financ. 2006, 12, 855–877. [Google Scholar] [CrossRef] [Green Version]
  3. Navarro, P. Why do corporations give to charity? J. Bus. 1988, 61, 65–93. [Google Scholar] [CrossRef]
  4. Wang, H.; Choi, J.; Li, J. Too little or too much? Untangling the relationship between corporate philanthropy and firm financial performance. Organ Sci. 2008, 19, 143–159. [Google Scholar] [CrossRef]
  5. Barnett, M.L. Stakeholder influence capacity and the variability of financial returns to corporate social responsibility. Acad. Manag. Rev. 2007, 32, 794–816. [Google Scholar] [CrossRef]
  6. Berman, S.L.; Wicks, A.C.; Kotha, S.K.; Jones, T.M. Does stakeholder orientation matter? The relationship between stakeholder management models and firm financial performance. Acad. Manag. J. 1999, 42, 488–506. [Google Scholar]
  7. Griffin, J.J.; Mahon, J.F. The corporate social performance and corporate financial performance debate twenty-five years of incomparable research. Bus. Soc. 1997, 36, 5–31. [Google Scholar] [CrossRef]
  8. Seifert, B.; Morris, S.A.; Bartkus, B.R. Having, giving, and getting: Slack resources, corporate philanthropy, and firm financial performance. Bus. Soc. 2004, 43, 135–161. [Google Scholar] [CrossRef]
  9. Gao, F.; Faff, R.; Navissi, F. Corporate philanthropy: Insights from the 2008 Wenchuan earthquake in China. Pac.-Basin Financ. J. 2012, 20, 363–377. [Google Scholar] [CrossRef]
  10. Lin, S.; Wang, J.; Yao, S.; Chen, J. Market reactions and corporate philanthropy: A case study of the Wenchuan earthquake in China. J. Contemp. China 2012, 21, 299–315. [Google Scholar]
  11. Wang, H.; Qian, C. Corporate philanthropy and CFP: The roles of stakeholder response and political access. Acad. Manag. J. 2011, 54, 1159–1181. [Google Scholar] [CrossRef]
  12. Sina News. Available online: http://gongyi.sina.com.cn/gyzx/2011-05-10/095826233.html (accessed on 10 May 2011).
  13. Zhang, R.; Rezaee, Z.; Zhu, J. Corporate philanthropic disaster response and ownership type: Evidence from Chinese firms’ response to the Sichuan earthquake. J. Bus. Ethics 2009, 91, 51–63. [Google Scholar] [CrossRef]
  14. Yang, T. Annual Report on China’s Philanthropy Development; Social Sciences Academic Press: Beijing, China, 2017; p. 17. ISBN 978-7-5201-0923-9. [Google Scholar]
  15. Gao, Y. Philanthropic disaster relief giving as a response to institutional pressure: Evidence from China. J. Bus. Res. 2011, 64, 1377–1382. [Google Scholar] [CrossRef]
  16. Li, S.; Song, X.; Wu, H. Political connection, ownership structure, and corporate philanthropy in China: A strategic-political perspective. J. Bus. Ethics 2015, 129, 399–411. [Google Scholar] [CrossRef]
  17. Lin, K.J.; Tan, J.; Zhao, L.; Karim, K. In the name of charity: Political connections and strategic corporate social responsibility in a transition economy. J. Corp. Financ. 2015, 32, 327–346. [Google Scholar] [CrossRef]
  18. Ma, D.L.; Parish, W.L. Tocquevillian moments: Charitable contributions by Chinese private entrepreneurs. Soc. Forces 2006, 85, 943–964. [Google Scholar] [CrossRef]
  19. Long, C.; Yang, J. What explains Chinese private entrepreneurs’ charitable behaviors?—A story of dynamic reciprocal relationship between firms and the government. China Econ. Rev. 2016, 40, 1–16. [Google Scholar] [CrossRef]
  20. Gao, Y.; Lin, L.Y.; Yang, H. What’s the value in it? Corporate giving under uncertainty. Asia Pac. J. Manag. 2017, 34, 215–240. [Google Scholar] [CrossRef]
  21. Wang, Z. Corporate Governance, Policies and Public Listing: The case of Chinese State-owned Enterprises. In Corporate Governance and CSR: A Focus on Emerging Markets; Boubaker, S., Nguyen, D.K., Eds.; World Scientific Publishing: Singapore, 2014; p. 63. ISBN 978-9-8145-2037-9. [Google Scholar]
  22. Zhang, M.; Xie, L.; Xu, H. Corporate philanthropy and stock price crash risk: Evidence from China. J. Bus. Ethics 2016, 139, 595–617. [Google Scholar] [CrossRef]
  23. Su, J.; He, J. Does giving lead to getting? Evidence from Chinese private enterprises. J. Bus. Ethics 2010, 93, 73–90. [Google Scholar] [CrossRef]
  24. Chen, M.H.; Lin, C.P. The impact of corporate charitable giving on hospitality firm performance: Doing well by doing good? Int. J. Hosp. Manag. 2015, 47, 25–34. [Google Scholar] [CrossRef]
  25. Yu, Y.; Choi, Y. Corporate social responsibility and firm performance through the mediating effect of organizational trust in Chinese firms. Chin. Manag. Stud. 2014, 8, 577–592. [Google Scholar] [CrossRef]
  26. Agle, B.R.; Mitchell, R.K.; Sonnenfeld, J.A. Who matters to CEOs? An investigation of stakeholder attributes and salience, corporate performance, and CEO values. Acad. Manag. J. 1999, 42, 507–525. [Google Scholar]
  27. Heinze, D.; Sibary, S.; Sikula, A. Relations among corporate social responsibility, financial soundness, and investment value in 22 manufacturing industry groups. Ethics Behav. 1999, 9, 331–347. [Google Scholar] [CrossRef]
  28. Jin, K.R.; Drozdenko, R.G. Relationships among perceived organizational core values, corporate social responsibility, ethics, and organizational performance outcomes: An empirical study of information technology professionals. J. Bus. Ethics 2010, 92, 341–359. [Google Scholar] [CrossRef]
  29. Margolis, J.D.; Walsh, J. People and Profits? The Search for a Link between a Company’s Social and Financial Performance; Lawrence Erlbaum Associates: Mahwah, NJ, USA, 2001. [Google Scholar]
  30. Carroll, A.B. Corporate social performance measurement: A commentary on methods for evaluating an elusive construct. Res. Corp. Soc. Perform. Policy 1991, 12, 385–401. [Google Scholar]
  31. Friedman, M. The social responsibility of business is to increase its profits. New York Times Magazine, 13 September 1970; 122–126. [Google Scholar]
  32. Porter, M.E.; Kramer, M.R. The competitive advantage of corporate philanthropy. Harv. Bus. Rev. 2002, 80, 5–16. [Google Scholar]
  33. Liang, H.; Renneboog, L. Corporate donations and shareholder value. Oxf. Rev. Econ. Policy 2017, 33, 278–316. [Google Scholar] [CrossRef]
  34. Williamson, O. The Economics of Discretionary Behavior: Managerial Objectives in a Theory of the Firm; (Ford Foundation Doctoral Dissertation Series; Prentice Hall: Upper Saddle River, NJ, USA, 1964. [Google Scholar]
  35. Campbell, L.; Gulas, C.S.; Gruca, T.S. Corporate giving behaviour and decision-maker social consciousness. J. Bus. Ethics 1999, 19, 375–383. [Google Scholar] [CrossRef]
  36. Lev, B.; Petrovits, C.; Radhakrishnan, S. Is doing good good for you? How corporate charitable contributions enhance revenue growth. Strat. Mgmt. J. 2010, 31, 182–200. [Google Scholar] [CrossRef]
  37. Seifert, B.; Morris, S.A.; Bartkus, B.R. Comparing big givers and small givers: Financial correlates of corporate philanthropy. J. Bus. Ethics 2003, 45, 195–211. [Google Scholar] [CrossRef]
  38. Thompson, A.A.; Strickland, A.J. Strategic Management: Concepts and Cases, 13th ed.; Mcgraw-Hill: New York, NY, USA, 2003. [Google Scholar]
  39. Saiia, D.H.; Carroll, A.B.; Buchholtz, A.K. Philanthropy as strategy when corporate charity “begins at home”. Bus. Soc. 2003, 42, 169–201. [Google Scholar] [CrossRef]
  40. Post, J.E.; Waddock, S.A. Strategic philanthropy and partnerships for economic progress, philanthropy and economic development. In Philanthropy and Economic Development; America, R.F., Ed.; Greenwood Press: Westport, CT, USA, 1995; pp. 167–191. [Google Scholar]
  41. Lewin, D.; Sabater, J.M. Corporate Philanthropy and Business Performance. In Corporate Philanthropy at the Crossroads; Burlingame, D.F., Young, D.R., Eds.; Indiana University Press: Bloomington, IN, USA, 1996; pp. 105–112. [Google Scholar]
  42. Weeden, C. Corporate Social Investing; Berrett-Koehler Press: San Francisco, CA, USA, 1998. [Google Scholar]
  43. Wang, K.; Chen, M.H.; Lin, C.P.; Gillard, E. The impact of tourism firm’s philanthropy decision on its business objective. Tour. Econ. 2018, 24, 503–509. [Google Scholar] [CrossRef]
  44. Hategan, C.-D.; Curea-Pitorac, R.-I. Testing the correlations between corporate giving, performance and company value. Sustainability 2017, 9, 1210. [Google Scholar] [CrossRef]
  45. Gautier, A.; Pache, A. Research on corporate philanthropy: A review and assess. J. Bus. Ethics 2015, 126, 343–369. [Google Scholar] [CrossRef]
  46. Chen, M.H.; Lin, C.P.; Tian, L.; Yang, Y. A theoretical link between corporate giving and hospitality firm performance. Int. J. Hosp. Manag. 2017, 66, 130–134. [Google Scholar] [CrossRef]
  47. Chen, M.H. The economy, tourism growth and corporate performance in the Taiwanese hotel industry. Tour. Manag. 2010, 31, 665–675. [Google Scholar] [CrossRef]
  48. Lu, C.; Zhao, X.; Dai, J. Corporate social responsibility and insider trading: Evidence from China. Sustainability 2018, 10, 3163. [Google Scholar] [CrossRef]
  49. Ye, K.; Zhang, R. Do lenders value corporate social responsibility? Evidence from China. J. Bus. Ethics 2011, 104, 197–206. [Google Scholar] [CrossRef]
  50. Zhang, M.; Ma, L.; Su, J.; Zhang, W. Do suppliers applaud corporate social performance? J. Bus. Ethics 2014, 121, 543–557. [Google Scholar] [CrossRef]
  51. Chen, Z.; Cao, Y. Chinese private corporate philanthropy: Social responsibility, legitimacy strategy, and the role of political capital. Chin. Sociol. Rev. 2016, 48, 108–136. [Google Scholar] [CrossRef]
  52. China Stock Market & Accounting Research Database. Available online: http://us.gtadata.com/Login/Index?versionswitch=&control= (accessed on 27 January 2017).
  53. China Information. Available online: http://www.cninfo.com.cn/ (accessed on 1 August 2017).
  54. Brammer, S.; Millington, A. Does it pay to be different? An analysis of the relationship between corporate social and financial performance. Strat. Mgmt. J. 2008, 29, 1325–1343. [Google Scholar] [CrossRef]
  55. Chung, K.H.; Pruitt, S.W. A simple approximation of Tobin’s q. Financ. Manag. 1994, 23, 70–74. [Google Scholar] [CrossRef]
  56. Baltagi, B.H. Econometric Analysis of Panel Data, 3rd ed.; John Wiley & Sons, Ltd.: West Sussex, UK, 2005. [Google Scholar]
  57. Hsiao, C. Analysis of Panel Data; Cambridge University Press: Cambridge, UK, 1986. [Google Scholar]
  58. Hausman, A. Specification tests in econometrics. Econometrica 1978, 46, 1251–1271. [Google Scholar] [CrossRef]
  59. Dimitrios, A. Applied Econometrics: A Modern Approach Using EViews and Microfit; Palgrave Macmillan: Basingstoke, UK, 2005. [Google Scholar]
  60. Campbell, D.; Moore, G.; Metzger, M. Corporate philanthropy in the UK 1985–2000: Some empirical findings. J. Bus. Ethics 2002, 39, 29–41. [Google Scholar] [CrossRef]
  61. Chen, J.; Wang, D.; Tong, J.; Zhang, F. Corporate philanthropy and tunneling: Evidence from China. J. Bus. Ethics 2018, 150, 135–157. [Google Scholar] [CrossRef]
  62. Balotti, R.F.; Hanks, J.J., Jr. Giving at the office: A reappraisal of charitable contributions by corporations. Bus. Lawyer 1999, 54, 956–996. [Google Scholar]
Figure 1. The relationship between corporate charitable giving (CCG) and corporate performance (CP) [8].
Sustainability 11 01491 g001
Figure 2. The total value of CCG and RCCG in China 2003–2016.
Sustainability 11 01491 g002
Figure 3. The inverted U-shaped relationship between RCCG and Tobin’s Q (TQ): All listed SOFs and NSOFs.
Sustainability 11 01491 g003
Figure 4. The inverted U-shaped relationship between RCCG and TQ: NSOFs.
Sustainability 11 01491 g004
Table 1. Descriptive statistics of study variables.
All listed
SOFs and NSOFs
N = 22,652
RCCGROAROETQSGSIZELEVSOP
Minimum0.00−48.32−167.110.01−1.0516.520.010
Maximum0.984.8437.1491.58461.0328.5196.961
Mean0.030.030.032.160.5021.710.540.4875
Std. Dev.0.080.481.782.912.631.331.600.50
SOFs
N = 11,043
RCCGROAROETQSGSIZELEV
Minimum0.00−6.78−72.150.01−1.0516.760.01
Maximum0.944.8437.1476.09190.2128.518.61
Mean0.020.020.031.600.3022.100.53
Std. Dev.0.060.111.201.982.931.380.29
NSOFs
N = 11,609
RCCGROAROETQSGSIZELEV
Minimum0.00−48.32−167.110.06−1.0016.520.01
Maximum0.982.6426.0691.58461.0327.4596.96
Mean0.040.020.022.740.6321.460.48
Std. Dev.0.100.522.263.4610.551.101.35
Notes: N is the number of firm-year observations. Only RCCG and sales growth (SG) are percentages among all variables.
Table 2. Panel regression test results of RCCG on all listed state-owned firms’ (SOFs) and non-state-owned firms’ (NSOFs) performance.
Panel A: SGCoefficientt–statisticp–valueAdjusted R2Panel B: ROACoefficientt–statisticp–valueAdjusted R2
(Pooled OLS)(Pooled OLS)
Constant–1.91–1.820.07**0.00Constant–0.19–3.680.00***0.16
RCCG–0.86–1.140.26 RCCG0.020.610.55
LEV0.151.660.10* LEV–0.19–67.660.00***
SIZE0.122.560.01*** SIZE0.016.030.00***
SOP–0.55–4.290.00*** SG0.001.420.15
SOP–0.01–0.870.38
Panel C: ROECoefficientt–StatisticProb.Adjusted R2Panel D: TQCoefficientt–StatisticProb.Adjusted R2
(Pooled OLS)(Fixed effects)
Constant–0.56–2.750.01***0.00Constant44.7368.520.00***0.12
RCCG0.161.090.28 RCCG0.572.540.01***
LEV–0.02–2.070.04** LEV–0.02–0.650.52
SIZE0.032.910.00*** SIZE–1.94–64.890.00***
SG0.000.550.58 SG0.002.250.02**
SOP0.00–0.150.88 SOP–0.44–5.240.00***
Notes: * Significant at the 10% level. ** Significant at the 5% level. *** Significant at the 1% level.
Table 3. Panel regression test results of RCCG on SOFs’ performance.
Panel A: SGCoefficientt–StatisticProb.Adjusted R2Panel B: ROACoefficientt–StatisticProb.Adjusted R2
(Pooled OLS)(Fixed Effects)
Constant–0.67–0.730.460.00Constant–1.02–6.150.00***0.40
RCCG–0.32–0.350.72 RCCG–0.08–1.210.23
LEV0.241.370.17 LEV–1.37–79.190.00***
SIZE0.040.980.33 SIZE0.0810.710.00***
SG0.00–0.290.77
Panel C: ROECoefficientt–StatisticProb.Adjusted R2Panel D: TQCoefficientt–StatisticProb.Adjusted R2
(Pooled OLS)(Fixed Effects)
Constant–0.36–1.680.09*0.00Constant30.1048.220.00***0.54
RCCG0.120.560.57 RCCG0.291.190.24
LEV–0.05–1.210.23 LEV–0.17–2.170.03**
SIZE0.021.980.05** SIZE–1.29–45.410.00***
SG0.000.180.86 SG0.000.870.38
Notes: * Significant at the 10% level. ** Significant at the 5% level. *** Significant at the 1% level.
Table 4. Panel regression test results of RCCG on NSOFs’ performance.
Panel A: SGCoefficientt-StatisticProb.Adjusted R2Panel B: ROACoefficientt-StatisticProb.Adjusted R2
(Pooled OLS)(Pooled OLS)
Constant−3.98−1.880.06**0.00Constant0.040.400.690.21
RCCG−1.20−1.040.30 RCCG0.030.550.58
LEV0.000.210.83 LEV−0.17−55.980.00***
SIZE0.222.280.02** SIZE0.000.840.40
SG0.001.270.20
Panel C: ROECoefficientt-StatisticProb.Adjusted R2Panel D: TQCoefficientt-StatisticProb.Adjusted R2
(Pooled OLS)(Fixed Effects)
Constant−0.99−2.540.01***0.00Constant77.4834.090.00***0.73
RCCG0.180.860.39 RCCG1.131.700.09*
LEV0.000.880.38 LEV2.36364.310.00***
SIZE0.052.590.01*** SIZE−3.53−33.350.00***
SG0.000.440.66 SG0.000.810.42
Notes: * Significant at the 10% level. ** Significant at the 5% level. *** Significant at the 1% level.
Table 5. Panel regression test results of RCCG and RCCG2 on all listed SOFs and NSOFs’ performance.
Panel A: SGCoefficientt–StatisticProb.Adjusted R2Panel B: ROACoefficientt–StatisticProb.Adjusted R2
(Pooled OLS)(Pooled OLS)
Constant–1.67–1.600.110.00Constant–0.19–3.680.00***0.16
RCCG–2.26–1.410.16 RCCG0.040.500.62
RCCG22.720.960.34 RCCG2–0.03–0.240.81
LEV0.040.900.37 LEV–0.19–67.630.00***
SIZE0.122.410.02** SIZE0.016.020.00***
SOP–0.55–4.290.00*** SG0.001.420.15
SOP–0.01–0.850.39
Panel C: ROECoefficientt–StatisticProb.Adjusted R2Panel D: TQCoefficientt–StatisticProb.Adjusted R2
(Pooled OLS)(Fixed effects)
Constant–0.56–2.750.01***0.00Constant44.7568.560.00***0.47
RCCG0.290.940.35 RCCG1.593.340.00 ***
RCCG2–0.26–0.480.63 RCCG2–1.88–2.430.02**
LEV–0.02–2.060.04** LEV–0.02–0.610.54
SIZE0.032.890.00*** SIZE–1.95–64.940.00***
SG0.000.550.58 SG0.002.220.03**
SOP0.00–0.110.91 SOP–0.44–5.230.00***
Notes: * Significant at the 10% level. ** Significant at the 5% level. *** Significant at the 1% level.
Table 6. Panel regression test results of RCCG and RCCG2 on all listed SOFs’ performance.
Panel A: SGCoefficientt-StatisticProb.Adjusted R2Panel B: ROACoefficientt-StatisticProb.Adjusted R2
(Pooled OLS)(Fixed effects)
Constant−0.65−0.710.480.00Constant−1.02−6.150.00***0.40
RCCG−1.55−0.850.40 RCCG−0.19−1.440.15
RCCG22.790.780.44 RCCG20.230.960.34
LEV0.241.360.18 LEV−1.37−79.190.00***
SIZE0.040.980.33 SIZE0.0810.720.00***
SG0.000.150.88
Panel C: ROECoefficientt-StatisticProb.Adjusted R2Panel D: TQCoefficientt-StatisticProb.Adjusted R2
(Pooled OLS)(Fixed effects)
Constant−0.36−1.690.09*0.00Constant30.1148.230.00***0.54
RCCG0.180.420.67 RCCG0.891.870.06*
RCCG2−0.14−0.160.87 RCCG2−1.26−1.470.14
LEV−0.05−1.210.23 LEV−0.16−2.140.03**
SIZE0.021.980.05** SIZE−1.29−45.430.00***
SG0.000.180.86 SG0.000.880.38
Notes: * Significant at the 10% level. ** Significant at the 5% level. *** Significant at the 1% level.
Table 7. Panel regression test results of RCCG and RCCG2 on all listed NSOFs’ performance
Panel A: SGCoefficientt–StatisticProb.Adjusted R2Panel B: ROACoefficientt–StatisticProb.Adjusted R2
(Pooled OLS)(Pooled OLS)
Constant–4.05–1.910.06*0.00Constant0.040.410.680.21
RCCG–3.03–1.200.23 RCCG0.040.340.73
RCCG23.460.810.42 RCCG2–0.02–0.110.92
LEV0.000.210.84 LEV–0.17–55.960.00***
SIZE0.232.330.02** SIZE0.000.830.41
SG0.001.270.20
Panel C: ROECoefficientt–StatisticProb.Adjusted R2Panel D: TQCoefficientt–StatisticProb.Adjusted R2
(Pooled OLS)(Fixed effects)
Constant–0.98–2.520.01***0.00Constant77.5434.120.00***0.73
RCCG0.350.760.45 RCCG3.332.230.03**
RCCG2–0.32–0.410.68 RCCG2–3.82–1.650.10*
LEV0.000.890.38 LEV2.36364.340.00***
SIZE0.052.560.01*** SIZE–3.54–33.390.00***
SG0.000.450.66 SG0.000.770.44
Notes: * Significant at the 10% level. ** Significant at the 5% level. *** Significant at the 1% level.

