Article

On the Environmental and Social Sustainability of Technological Innovations in Urban Bus Transport: The EU Case

by
Cristina López
1,*,
Rocío Ruíz-Benítez
1 and
Carmen Vargas-Machuca
2
1
Department of Management & Marketing, Universidad Pablo de Olavide, Carretera de Utrera, Km.1, 41013 Seville, Spain
2
Faculty of Business, Universidad Pablo de Olavide, Carretera de Utrera, Km.1, 41013 Seville, Spain
*
Author to whom correspondence should be addressed.
Sustainability 2019, 11(5), 1413; https://doi.org/10.3390/su11051413
Submission received: 21 December 2018 / Revised: 27 February 2019 / Accepted: 2 March 2019 / Published: 7 March 2019

Abstract

:
Logistics in urban areas are currently suffering a radical transformation due to increasing population concentration and the massive use of cars as the preferred transport mode. These issues have resulted in higher pollution levels in urban environments and traffic congestion, impacting the world globally. Facilitating the use of sustainable transport modes is widely regarded as a necessity to cope with these adverse effects on citizens’ life quality. Hence, some regions, such as the European Union, are encouraging bus transport firms to make their business models more environmentally and socially sustainable. The aim of this research is thus to explore how technological innovations adopted by urban bus companies can improve cities’ sustainability. With this in mind, a combined Importance Performance Analysis (IPA)–Analytic Hierarchy Process (AHP) method was applied. In this way, their environmental and social sustainability effects were separately represented through hierarchical structures. Subsequently, the importance and performance ratings of technological innovations in each sustainability dimension were estimated, and thus two IPA grids were generated. These grids support managers in the establishment of more effective action plans to improve logistics sustainability in cities. The findings also provide guidance to governments on the technological innovations that should be promoted in future urban mobility plans.

1. Introduction

The majority of urban areas are currently suffering congestion that will only worsen with time. The world population living in urban areas has increased from 33% in the 60s to 55% in 2017 (according to the UN). Additionally, this percentage is estimated to rise to 68% by 2050. This situation is even more accentuated in the European Union, where the percentage of the population living in urban areas is 74% (2018), with countries such as Belgium, Denmark, France, Norway, and Spain having over 80% of their population living in urban areas. This increasing trend is expected to continue in European countries in years to come, reaching a peak of around 82% of urban population in 2050 [1]. This situation generates chronic congestion problems in transportation activities throughout European cities that result in long delay periods for daily journeys. This situation is even worse due to the high percentage of private passenger cars used daily to cover short distances (83.1% in 2015 according to Eurostat). Dependence on passenger cars is up to 90% in some European countries such as Portugal, Norway, and Lithuania.
Moreover, the transportation sector represents almost a quarter of Europe’s greenhouse gas emissions and is the main cause of air pollution in cities. However, this sector has not showed a declining tendency in emissions like other sectors; on the contrary, emissions have increased over 20% in the last 20 years [2]. Road transport in particular accounted for more than 70% of all greenhouse gas emissions from transport in 2014.
A final aspect that also plays an important role is the scarcity of urban space due to both the increase in the urban population and the massive use of passenger cars. Therefore, the current situation calls for seeking new urban mobility programs that merge passengers’ expectations and needs with operators’ economic requirements and environmental restrictions.
A necessary element for the development and success of urban mobility programs is the existence of environmentally and socially friendly modes of transport, such as bus and rail. In addition to the existence of sustainable means of transport, another necessary element is the population’s will to use these sustainable transportation modes. In this sense, some studies have investigated the different policies that should be implemented and the conditions under which people will change their behavior to a more sustainable one [3,4,5] The European Union (EU) has promoted several projects in order to develop a new generation of buses that will serve this purpose. Although several projects have focused on the development of new technologies and policies for more environmentally friendly buses, in practice, few of those innovations have been carried out, due mainly to economic reasons [6]. Undoubtedly, economic conditions mark the decision of implementing those technological innovations in the public transportation system [7]. In fact, in 2019, following the information given by some of the European electric bus manufacturers, such as MAN or Irizar, the price of electric buses is 2.5 times the price of combustion-engine buses. However, the electric bus lifetime cost (including maintenance costs) is expected to equal the conventionally powered bus lifetime cost by 2023 [8]. Additionally, the European Commission became aware that technology needs to serve not only to reduce the environmental impact of this means of transportation but also to increase its attractiveness, thus impacting the mode of transport’s social sustainability. Social aspects of public transportation systems have been addressed in several works in terms of their accessibility [9,10] and the existing social needs [11]. The convenience and success of some of those technological innovations, such as electric vehicles, have been previously studied in the literature [12,13]. This work aims to complement previous studies by evaluating the sustainability effects that the technological innovations fostered by the EU have on the public transport system.
For that purpose, a list of technological innovations that are currently implemented in the urban transportation sector and that have been promoted by the European Commission as a result of different research projects have been identified. Furthermore, the impacts of these technological innovations on the environmental and social sustainability dimensions are studied in an isolated way, identifying the intensity of those impacts and establishing a hierarchy in each sustainability dimension of the relative impact of each of these technological innovations. Since companies cannot aim at improving all possible sustainability effects at the same time under significant constraints (time, economic, legal, technological, etc.), the results will highlight the technological innovations that may work best to achieve improvements in each dimension. This will help managers to optimize their efforts to increase sustainability and policy makers and governments to better allocate their resources in terms of research funding.
This paper is structured as follows. In the following section, definitions for sustainable urban mobility programs are described and the existing literature on the sustainability effects of transportation policies is analyzed. Section 3 describes the methodology and research procedure in order to assess the main objective of this work. Section 4 presents the results obtained in terms of environmental and social sustainability and, finally, the last section sets out the most relevant conclusions and limitations of the study.

2. Literature Review

2.1. Sustainable Urban Mobility

The EU, due to the current situation of continuous mobility congestion in the cities, is especially interested in developing sustainable urban mobility programs in order to palliate the cities’ situation. To do so, the European Commission has developed the concept of a sustainable urban mobility plan with the goal of improving the accessibility of urban areas and providing high-quality and sustainable mobility and transport to, through, and within the urban area [14]. Specifically, the EU Transport Council has defined a sustainable transport system as a system that:
  • allows the basic access and development needs of society to be met safely and in a manner consistent with human and ecosystem health, and promotes equity within and between successive generations.
  • is affordable, operates fairly and efficiently, offers a choice of transport mode, and supports a competitive economy, as well as balanced regional development.
  • limits emissions and waste within the planet’s ability to absorb them, uses renewable resources at or below their rates of generation and uses non-renewable resources at or below the rates of development of renewable substitutes while minimizing the impact on the use of land and the generation of noise.
Moreover, there is a need to develop adequate indicators to measure how sustainable the implemented urban mobility programs are. In this sense, earlier studies have already developed different indicators to evaluate the sustainability of transportation networks and urban mobility programs in several European countries [15,16]. Benjelloun et al. [17] present a classification of city logistics projects according to 72 items, collecting some environmental and social measures in both the business model and technology functions. Perboli et al. [18] go a step further, providing a three-dimension taxonomy to categorize Smart City Projects, in which transportation appears as one of the eight major fields of activity.
The different transportation modes play a relevant role in order to increase the effectiveness of urban mobility plans. In fact, a recent study made with EU data reveals that the most effective mode of transport will depend on the traffic congestion (peak or off-peak) situations. Pomylaka [19] studies different modes of urban transportation –passenger car, motorcycle, and bus and rail in peak and off-peak situations, finding that the most effective mode of transport in terms of capacity, cost, and environmental performance in peak periods is public transport. Therefore, there is a clear need for developing transportation policies that encourage the population to use the public transportation system. In order to do that, a good public and sustainable transportation system should first be put in place. Second, governments ought to incentivize people to use the public transportation system and therefore should develop the right transportation policies. Mugion et al. [3] investigate how to induce the population to use sustainable means of transport, noting that public urban transport quality has a direct effect on the intention to use public transport more and private passenger cars less. Therefore, local governments should focus on developing good quality sustainable urban transportation systems in order to incentivize their use.
In the search for more sustainable means of transportation, the EU has funded several research projects that aim to develop a new generation of buses which are more environmentally friendly and more convenient for passengers. However, even though the technology has evolved to find new engines designed to save fuel and enhance electric vehicles, these are still scarce in practice due mainly to economic reasons [6,7,20]. For that reason, some countries, such as Sweden, are developing research programs to actively establish roadmaps that encompass creative ways to achieve a sustainable transport system based on electric vehicles [21,22,23]. In the same line, Belgium is creating simulation platforms in order to develop the new technological innovations and facilitate the adoption of these technologies by the transportation operators [12]. Ajanovic and Haas [13] investigate the factors that could bring about the adoption of cleaner technologies, such as electric vehicles, in urban areas. Even though electric vehicles have proven to reduce the environmental impact with respect to regular means of transport, there is still concern regarding their electricity generation and its environmental impact.
Our study complements previous studies since it evaluates the economic and social effects that each of the technological innovations fostered in the EU have in practice.

2.2. Assessment of Transportation Policies regarding Sustainability

In order to limit the negative environmental impact of transportation activities, local and national governments are putting several initiatives and policies in place. Evaluating such policies is key to assessing sustainability improvement. Sayyadi and Awasthi [24] evaluate some of the more common regulatory policies set up by governments in order to establish which ones are more desirable to increase sustainability. They propose a method that allows for quantitatively estimating and evaluating system performance, and analyze the behavior in response to regulatory policies, helping in sustainable transportation planning. Noto [25] also develops a methodology for urban transportation planning that increases sustainability and is based on performance management and system dynamics modeling.
Several authors have evaluated current urban transportation strategies all over the world. De Andrade Guerra et al. [26] compare the results of adopting different strategies for urban mobility in achieving more sustainable cities in Newcastle (UK) and Florianopolis (Brazil) and analyze different indicators for sustainable cities. Büyüközkan et al. [27] evaluate the sustainability of urban transport alternatives, including different public bus technologies in the city of Istanbul, finding the most appropriate alternatives in order to increase sustainability. They come up with a tailored solution for the city of Istanbul, in both the short and long term, noting that the future technologies that ought to be applied in order to improve sustainability are hybrid electric vehicles, but that further advances should be made in order to develop the technology. Feikie et al. [28] investigate how to achieve more sustainable road transportation systems in South Africa. Their findings reveal that effectively integrating information and communication technologies in socio-economic activities will improve road transportation sustainability. An effective use of information and communication technologies will reduce the need for travel and traffic volume, and will enable appropriate route planning, reducing traffic congestion, traffic collisions, and travel distance and time. Fontoura et al. [29] study the influence of different policies in urban transport, focusing on environmental, economic, and traffic variables in the city of Sao Paulo. They observe that the way in which the policy is implemented will help to reduce the existing negative externalities that may appear in the urban transport system. Bandeira et al. [30] present a decision-making approach that helps managers and policy-makers to evaluate and select sustainable configurations for urban freight transportation that is applied in the city of Rio de Janeiro, Brazil.
Developing countries, especially in Asia, have even more aggravated environmental problems due to the great scale and speed of urbanization. With the objective of improving city sustainability, Hatefi [31] develops a combined methodology in order to help in the strategic planning of the urban transportation system. These strategies are then evaluated based on sustainable development indicators and a priority list is generated, helping city planners to implement good transportation practices. This study is centered on the city of Shahrkord in Iran. Also in this country but in a different city (Isfahan), Haghsheras et al. [32] evaluate the transportation policies in terms of sustainability and identify which policy is the most important in order to improve city sustainability. Zailani et al. [33] study the drivers for the adoption of green technology innovations and find a positive relationship between environmental effects and the implementation of green technology innovations. Our research complements this one by evaluating the technological innovations in a different context and by also considering the social effects. Finally, Hosseinlou and Kabiri [34] investigate which variables have a greater impact on different transportation models in order to develop new policies focused on those variables. They investigate the Tehran Metropolitan Area, which has a complex transportation network and complex users, concluding that users’ behavior is the most significant parameter due to the lack of a public transportation network and its level of comfort.
Therefore, urban transportation systems should be tailor-designed for each particular country, or even city. The literature previously presented offers multiple technological innovations that can be implemented in order to help governments to design these systems. Notwithstanding, new efforts should be addressed to provide a big picture of the technological innovations implemented in the bus transport sector. This article will aim at filling this gap by means of bringing together those innovations implemented in the EU during the last years. Additionally, there is a high behavioral component in the real effectiveness of such systems, and therefore decision makers should be aware of not only the right public transportation systems, but also the social policies that will induce more sustainable behavior among the population. In order to support this labor, this article also provides an adapted Importance Performance Analysis–Analytic Hierarchy Process (IPA–AHP) method to evaluate the sustainability effects of those technological innovations on both the environmental and social dimensions. This is described in Section 3. The findings will thus contribute to defining specific strategies for effectively managing each technological innovation.

3. Data and Methods

3.1. Research Design

The aim of this research is to study the technological innovations adopted by different European companies engaged in urban bus transport in order to increase their cities’ sustainability. The focus of our research is on the European bus transportation sector, due to the patent concern of the EU in reducing greenhouse emissions and improving city logistics from both environmental and social perspectives [35,36]. These concerns have been reflected in the growing policy and funding actions to encourage bus firms to adopt a more sustainable business model. This, in turn, is expected to result in improved quality of life for people, communities, governments, and companies. In this respect, it is worth noting that urban bus firms have deployed pioneering contributions in the field of sustainable developments on city logistics within the EU [37,38,39].
Focusing our attention on early methodological solutions adopted in this context, several quantitative approaches have already been used to assess impacts on environmental sustainability dimensions. Cost–Benefits Analysis (CBA) provides a quantitative way of determining whether a system is environmentally sustainable based on a comparison of cost and benefits rules [40]. Novel CBA models are even incorporating the equity and social dimension into this analysis [41]. The Life Cycle Assessment (LCA) approach evaluates the magnitude of a system’s impacts by means of quantifying its inputs (resources consumed) and its outputs related with environmental emissions through its entire life cycle [42]. Regarding economic feasibility, Life Cycle Costing (LCC) allows the estimation of all the costs a system incurred until its removal [43,44]. The Life-cycle sustainability assessment (LCSA) approach goes a step further beyond integrating the analysis of LCA and LCC, together with the analysis of social life-cycle assessment (SLCA) [45,46]. The triple bottom line of sustainable thinking is thus covered in a single method.
The above-mentioned approaches are not exempt of challenges, such as those resulting from cost and benefits calculations due to lack of knowledge and natural variability in CBA [47]. The lack of awareness of LCC has been also pointed out [48] by professionals, causing a poorly understood representation of the findings in LCSA [45], among others. In order to complement the existing quantitative approaches, we propose a hybridized mechanism that integrates Analytic Hierarchy Process (AHP) and Importance-Performance Analysis (IPA). The former extracts experts’ knowledge using a ratio scale (verbal measure) to compare the importance of pairs of elements which psychologists state help experts to express their opinion in an easier and more accurate way [49]. The second method guides decision makers in simply defining effective strategies and their corresponding action priorities. Their results are finally represented in a visual and easily understood visual grid for academics and professionals.
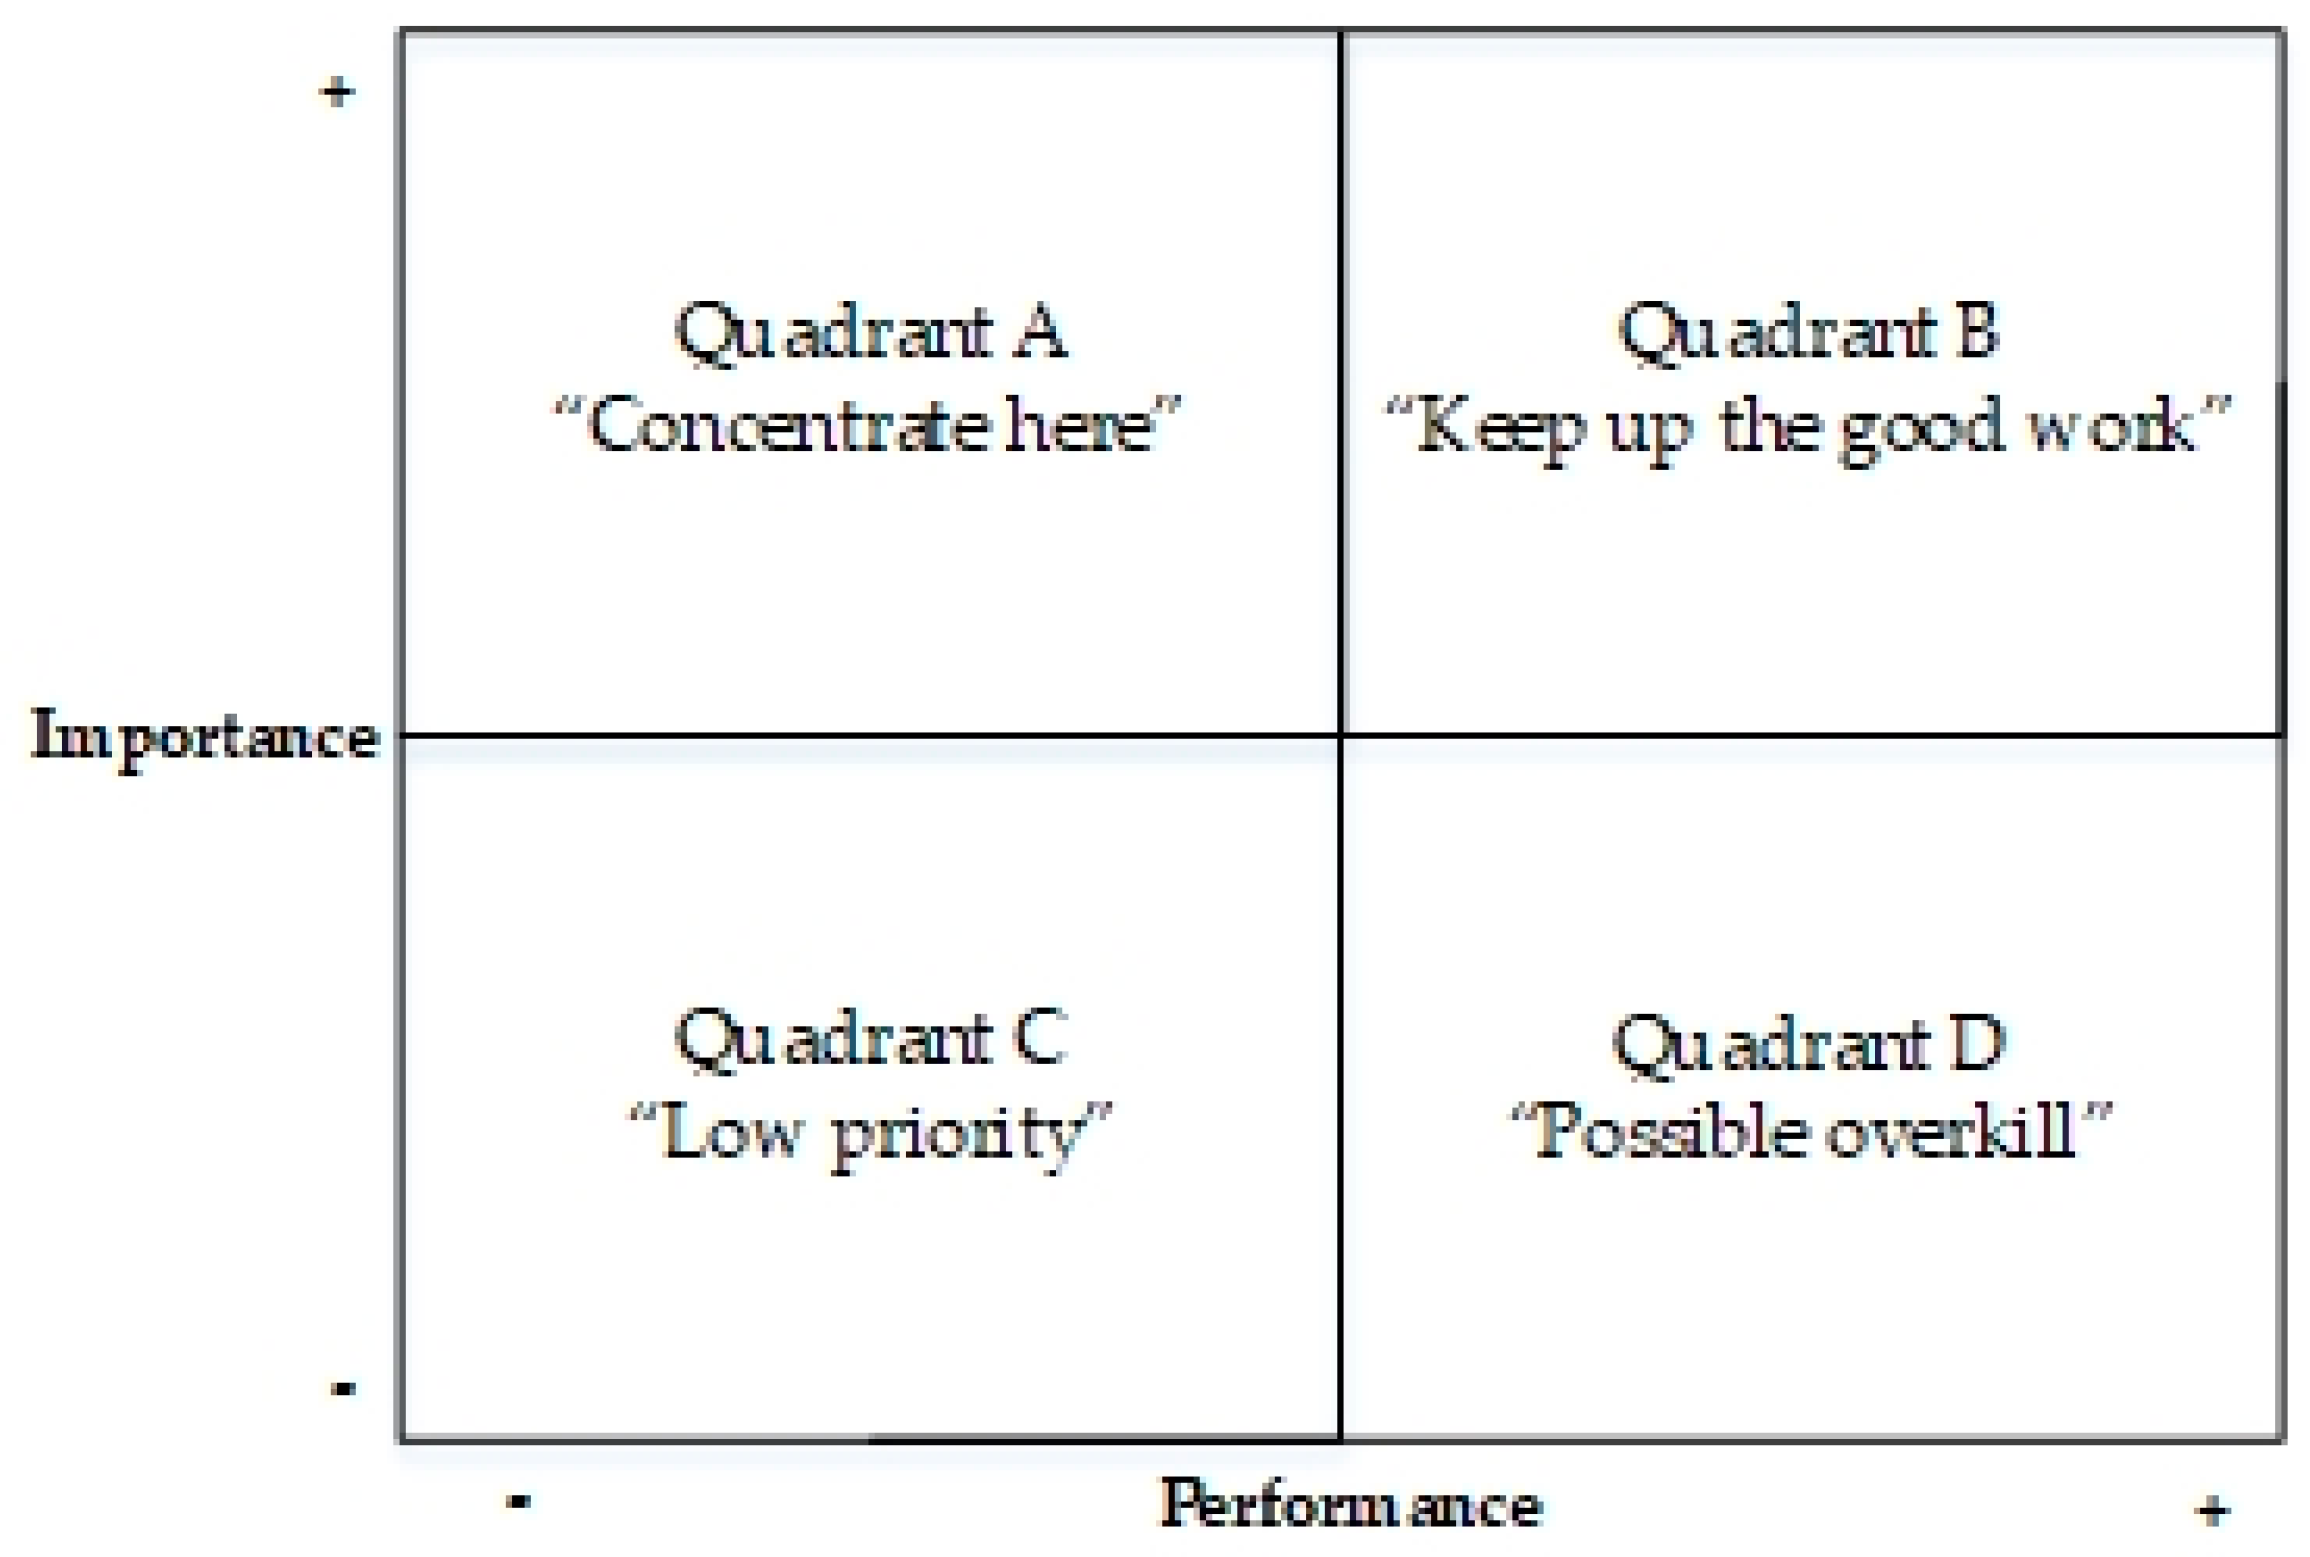
IPA was initially introduced by Reference [
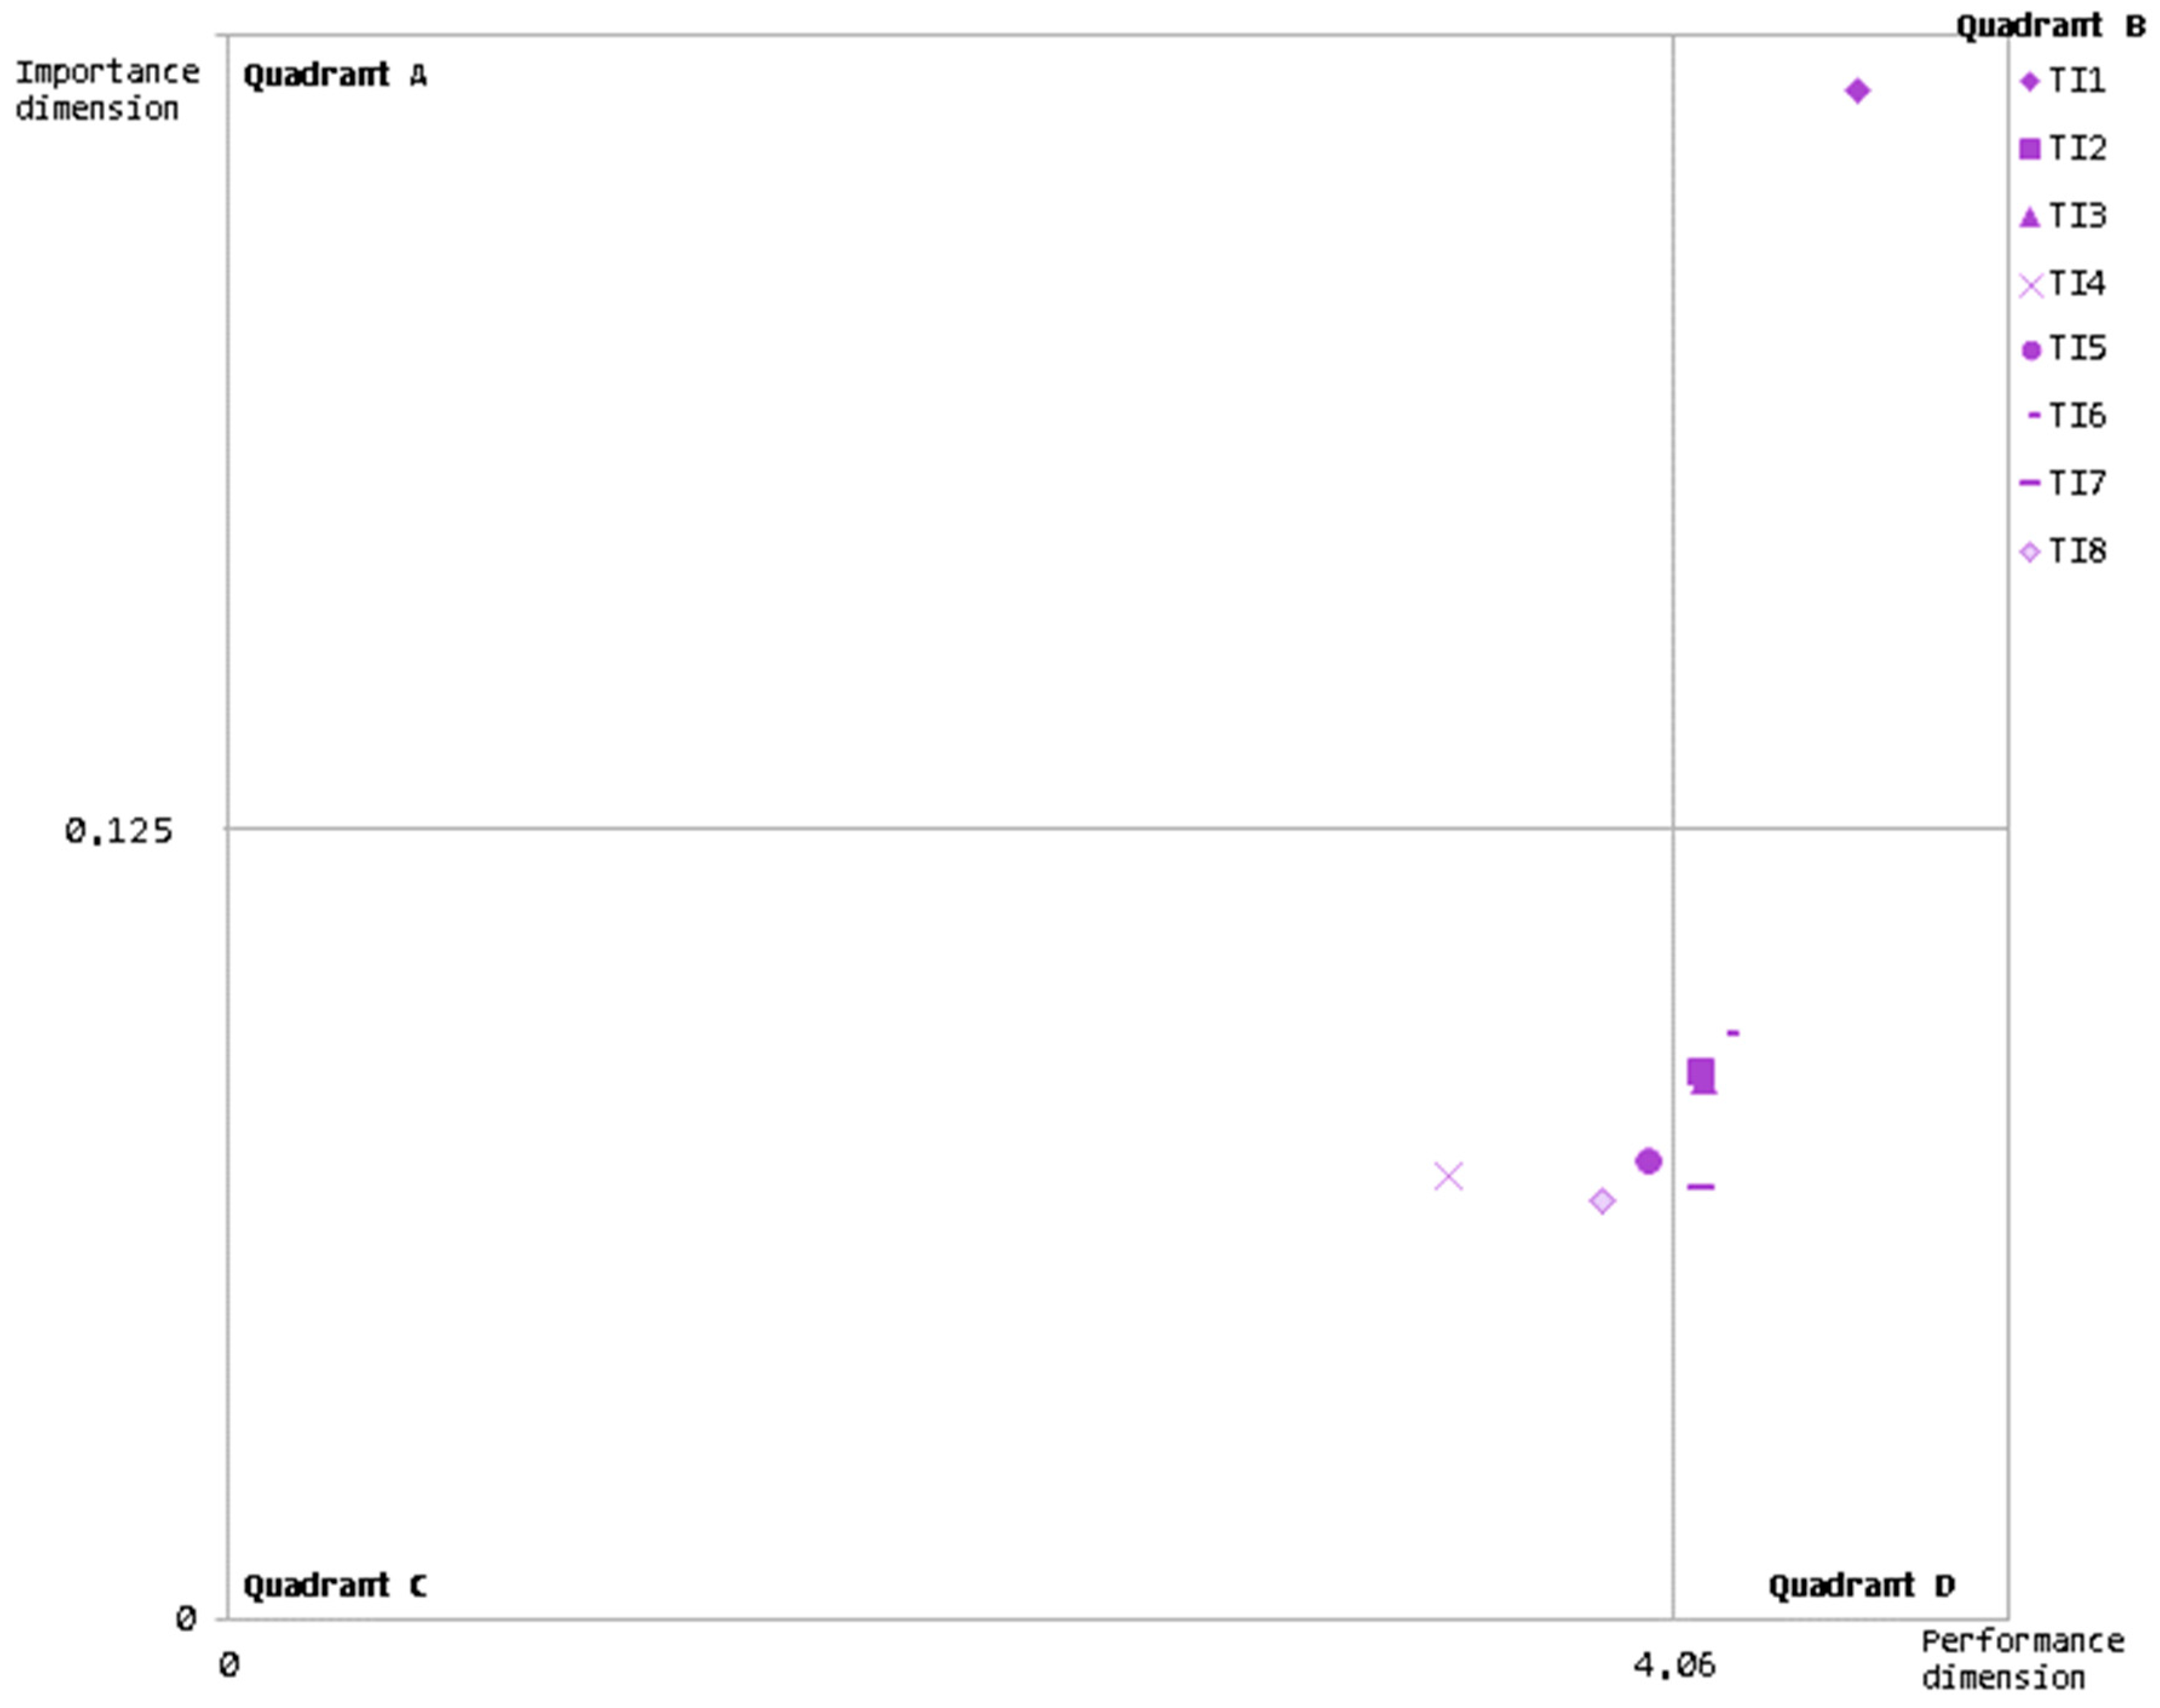
50] for supporting the development of effective marketing strategies in the automobile service sector. Then, this technique allowed the individual measurement of a set of descriptive attributes of customers’ satisfaction in accordance with their corresponding perceived importance and performance. The ratings obtained were plotted in a two-dimensional importance–performance grid (Figure 1), so that four strategies could be established from each of the four grid areas. Because of its multiple advantages derived from its simplicity, effectiveness, utility, and easy execution [51,52,53], IPA has been widely spread to a great variety of literature fields. Focusing our attention on the sustainability field, several studies have been recently developed with this technique. Various studies [50,51] examine how tourism initiatives enable sustainable developments in the residents’ experience. Atzori et al. [54] explore clients’ perceptions on green practices applied in the food services sector. Eldho et al. [55] compare the importance and performance of economic, social, and green sustainability practices in dyadic relationships at three supply chain levels: upstream, downstream, and the overall. On the other side of the coin, other research [56] determines which lean, green, and resilient practices are critical to improve sustainability in the aerospace manufacturing supply chain. These studies highlight that the IPA method has been successfully applied with similar purposes.
Notwithstanding, it must be also pointed out that the IPA method itself is not exempt of weaknesses [57,58]. Oliver [59] already stated that one of these concerns lies in the way in which performance and importance ratings are estimated. According to Reference [60], the problem does not lie in the scale of performance perceptions but rather in importance perceptions. Previous studies have successfully overcome this issue by adding comparability to the scales through coupling IPA with AHP [61,62,63]. This technique begins structuring a complex problem in a hierarchy composed of the aim of the decision, criteria, and alternatives. Lower-level elements are then compared in pairs (pairwise comparisons) with regard to the higher-element level to generate an alternative ranking. Table 1 depicts Saaty’s nine-point scale, widely applied to make pairwise comparison.
AHP reinforces the IPA approach in the present study in several aspects. On the one hand, AHP allows the measuring of the importance of specific technological innovations by means of multiple attributes. Thus, the effects of adopted technological innovations by bus transport firms will be accurately measured based on concrete social and green sustainability effects. For this purpose, as suggested in Reference [65], direct pairwise comparisons between sustainability effects will be carried out to determine the importance of each technological innovations from the city’s sustainability point of view. On the other hand, AHP allows checking the consistency of expert judgements by calculating a consistency ratio (CR). Expert judgements will be considered inconsistent if they do not meet both transitivity property and preferences’ proportionality property. The first implies that if element i is more important than element j and element j is more important than element z , then element i will be more important than element z . The second points out if element i is three times more important than element j and element j is twice as important than element z , then element x will be six times more important than element z . When judgements prove to be inconsistent, they have to be reviewed and the experts interviewed again [66]. Thus, the construction of the IPA grid will be also reinforced. The next subsection explains step-by-step how the combined IPA–AHP method has been applied in the present study. It includes the procedure to mathematically calculate the CR described in Step 4 (Section 3.2.4).

3.2. Research Procedure

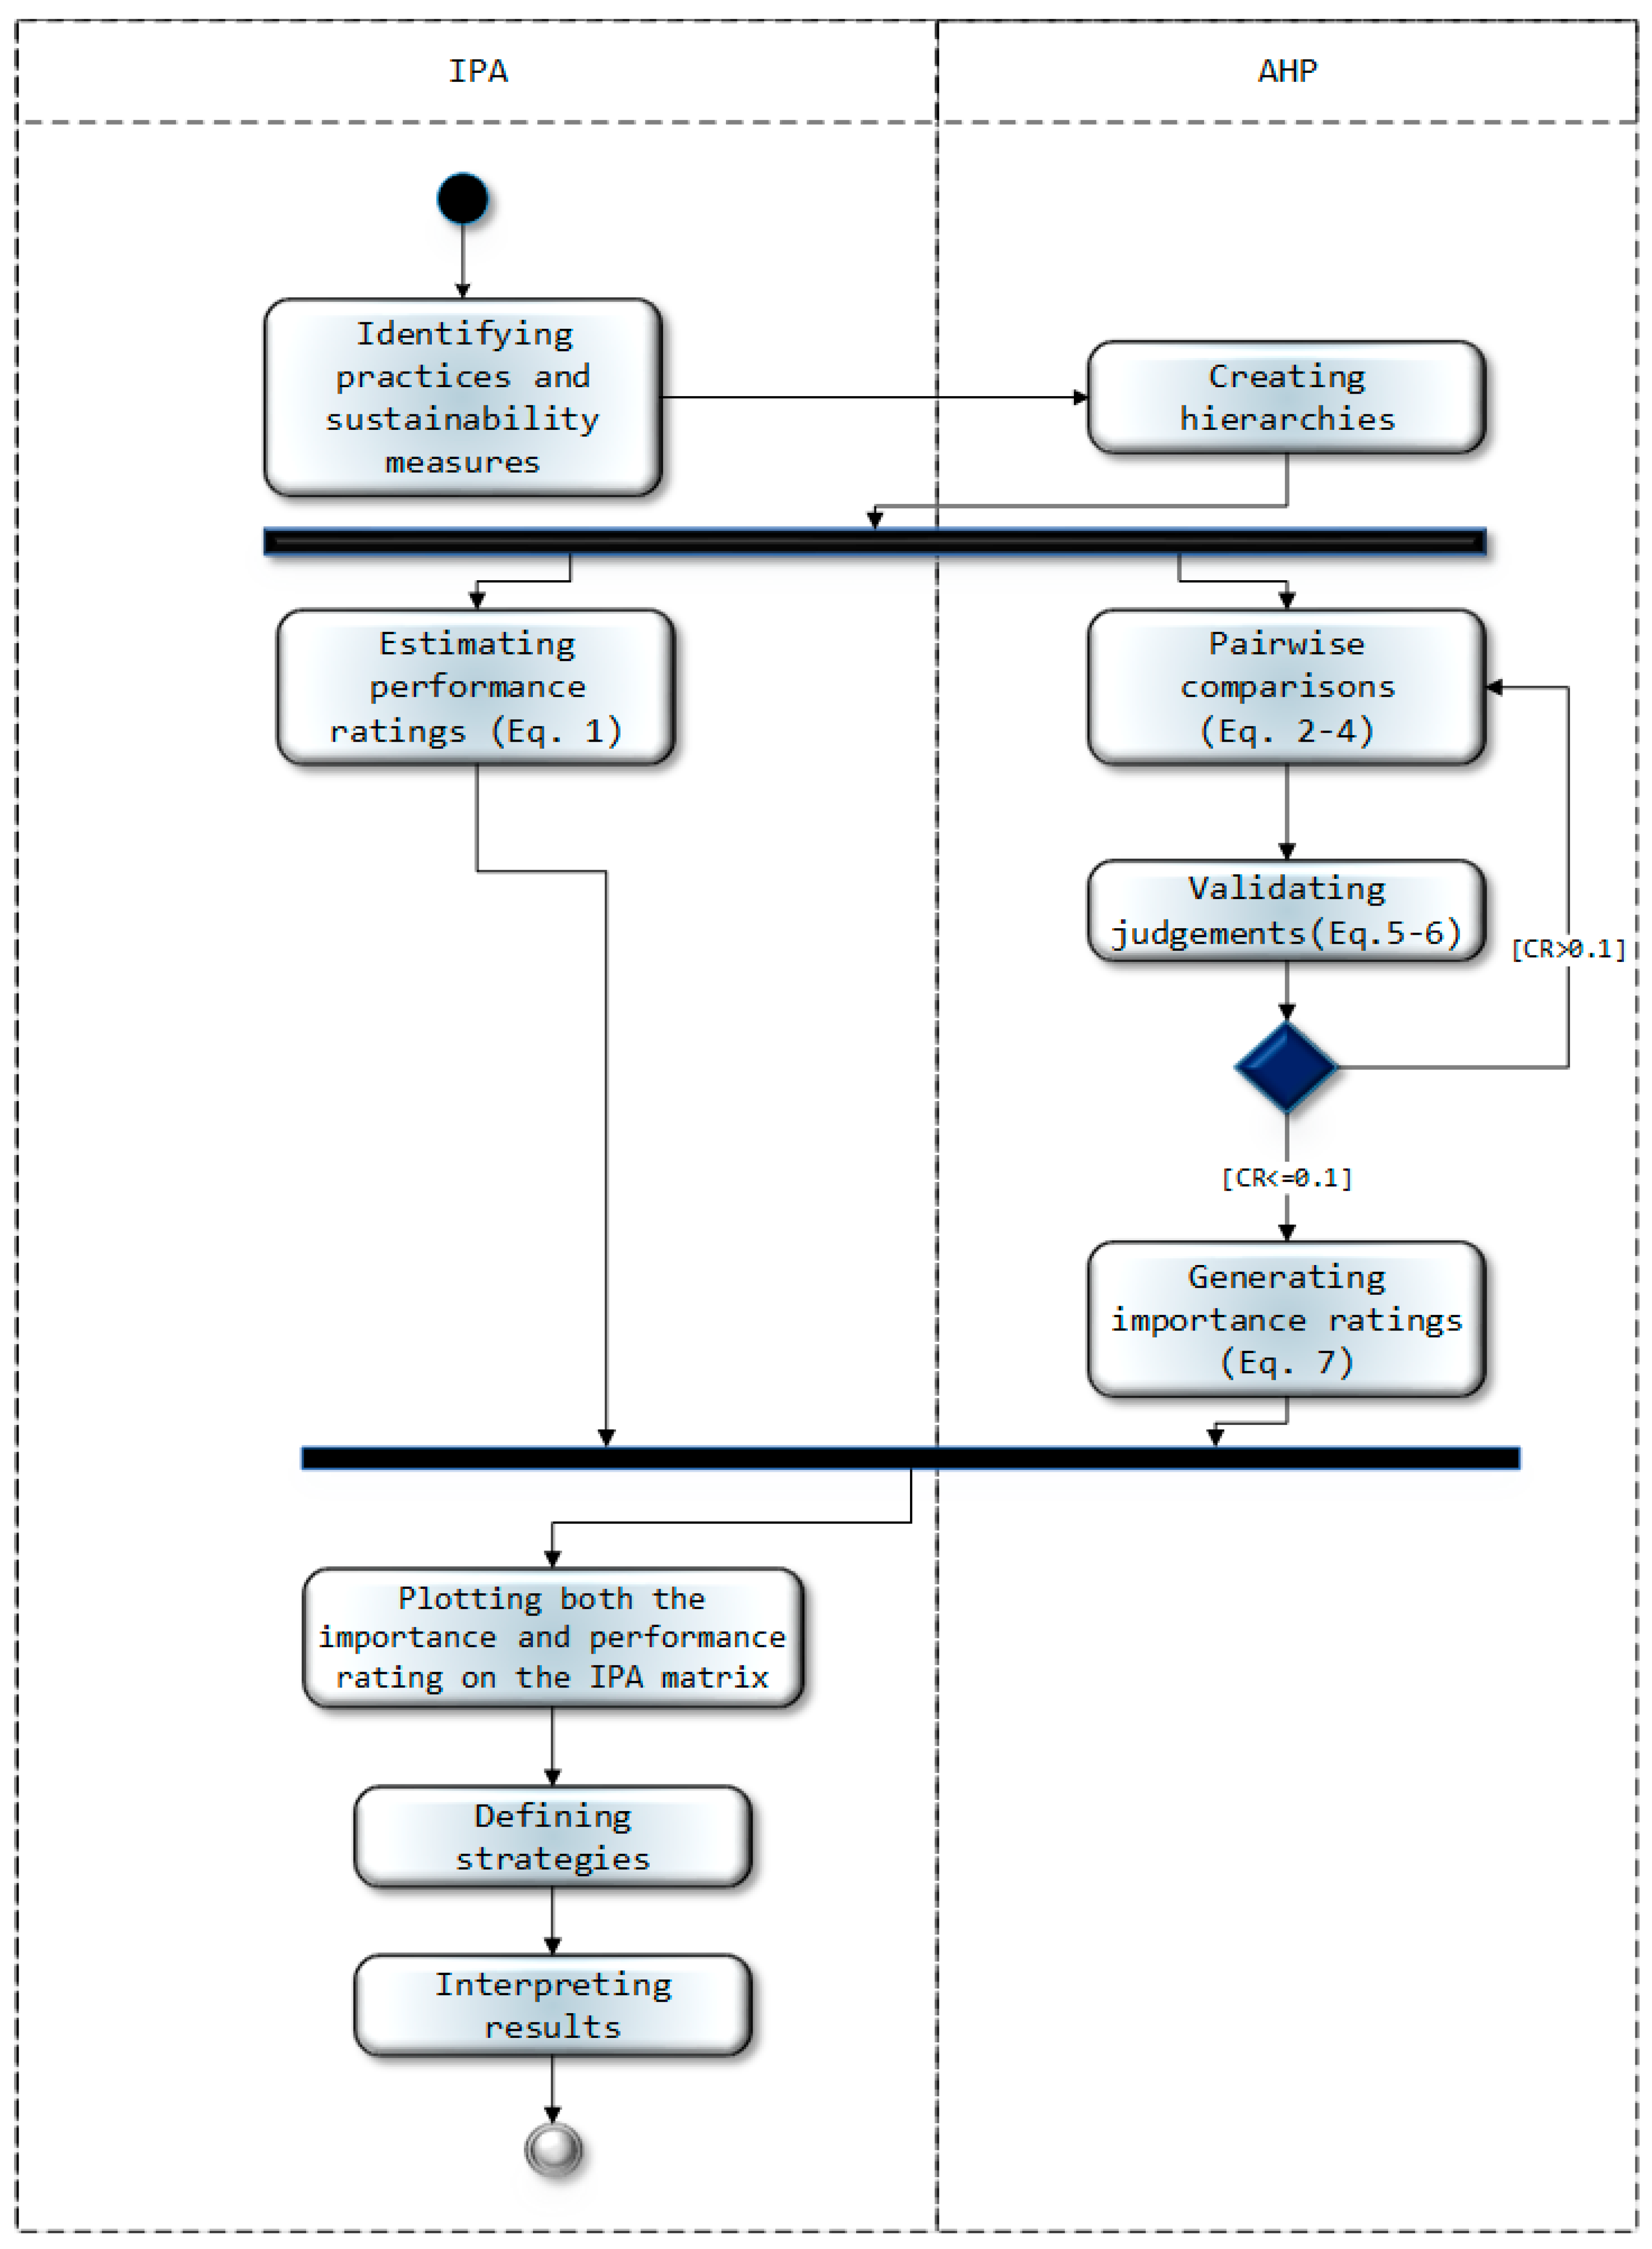
The procedure presented here is a combination of the IPA and AHP methods. This will help to gain a better understanding on how further business models may make city logistics more sustainable. That hybridization was used in the past in different sustainability studies with very interesting results, as we explained before. However, each generic step must perfectly fit the study requirements. Figure 2 provides an overview of the IPA–AHP approach applied in this research. This is divided into five steps, which are described as follows.

3.2.1. STEP 1: Identifying Technological Innovations and Their Sustainability Effects in the European Urban Bus Transport Sector

The research began by exploring how urban bus firms in the EU have adjusted their business models to make city logistics more sustainable. With this purpose in mind, two elements were identified.
Firstly, those technological innovations which have been undertaken by European companies of urban bus transport need to be identified. Some researchers [33] describe them as any practice that represents the adoption of a novel technology related with data acquisition, information, warehousing, or transportation in logistic companies. With a view to identifying these technological innovations, multiple sources of secondary data were consulted from the European Commission, firms of urban bus transport, and other related organisms. Many public reports, studies, programs, and projects were found reported on the website. By means of conducting a comprehensive content analysis [67], these documents were revised in depth so as to clearly identify what technological innovations have been developed over the past years. These technological innovations and their descriptions were coded and included in a database, together with the relevant information about the companies and the European projects that have respectively adopted and funded them. The criterion for inclusion in the database was for each technological innovation to be at least promoted by innovative projects related to public transport and energy saving. Table 2 depicts the list technological innovations identified in the research.
Second, those social and environmental sustainability effects that have been improved thanks to the technological innovations implemented need to be identified. For that purpose, four senior academicians were consulted. They were selected according to their recognized knowledge in logistics sustainability and business models. Individual face-to-face interviews were conducted. First, the list of the technological innovations identified in the first stage was explained to the academicians. They identified the specific social and environmental sustainability effects in city logistics that may be affected by those technological innovations and the technological innovations that may lead to improvements in each of the effects. Thus, a specific model per academician was extracted. Once all the interviews were finished, only matching elements were added in one unique final model. Moreover, all connections were corroborated through data collected in the previous content analysis. Table 3 depicts the final list of environmental and social sustainability effects and the technological innovations impacting each one.

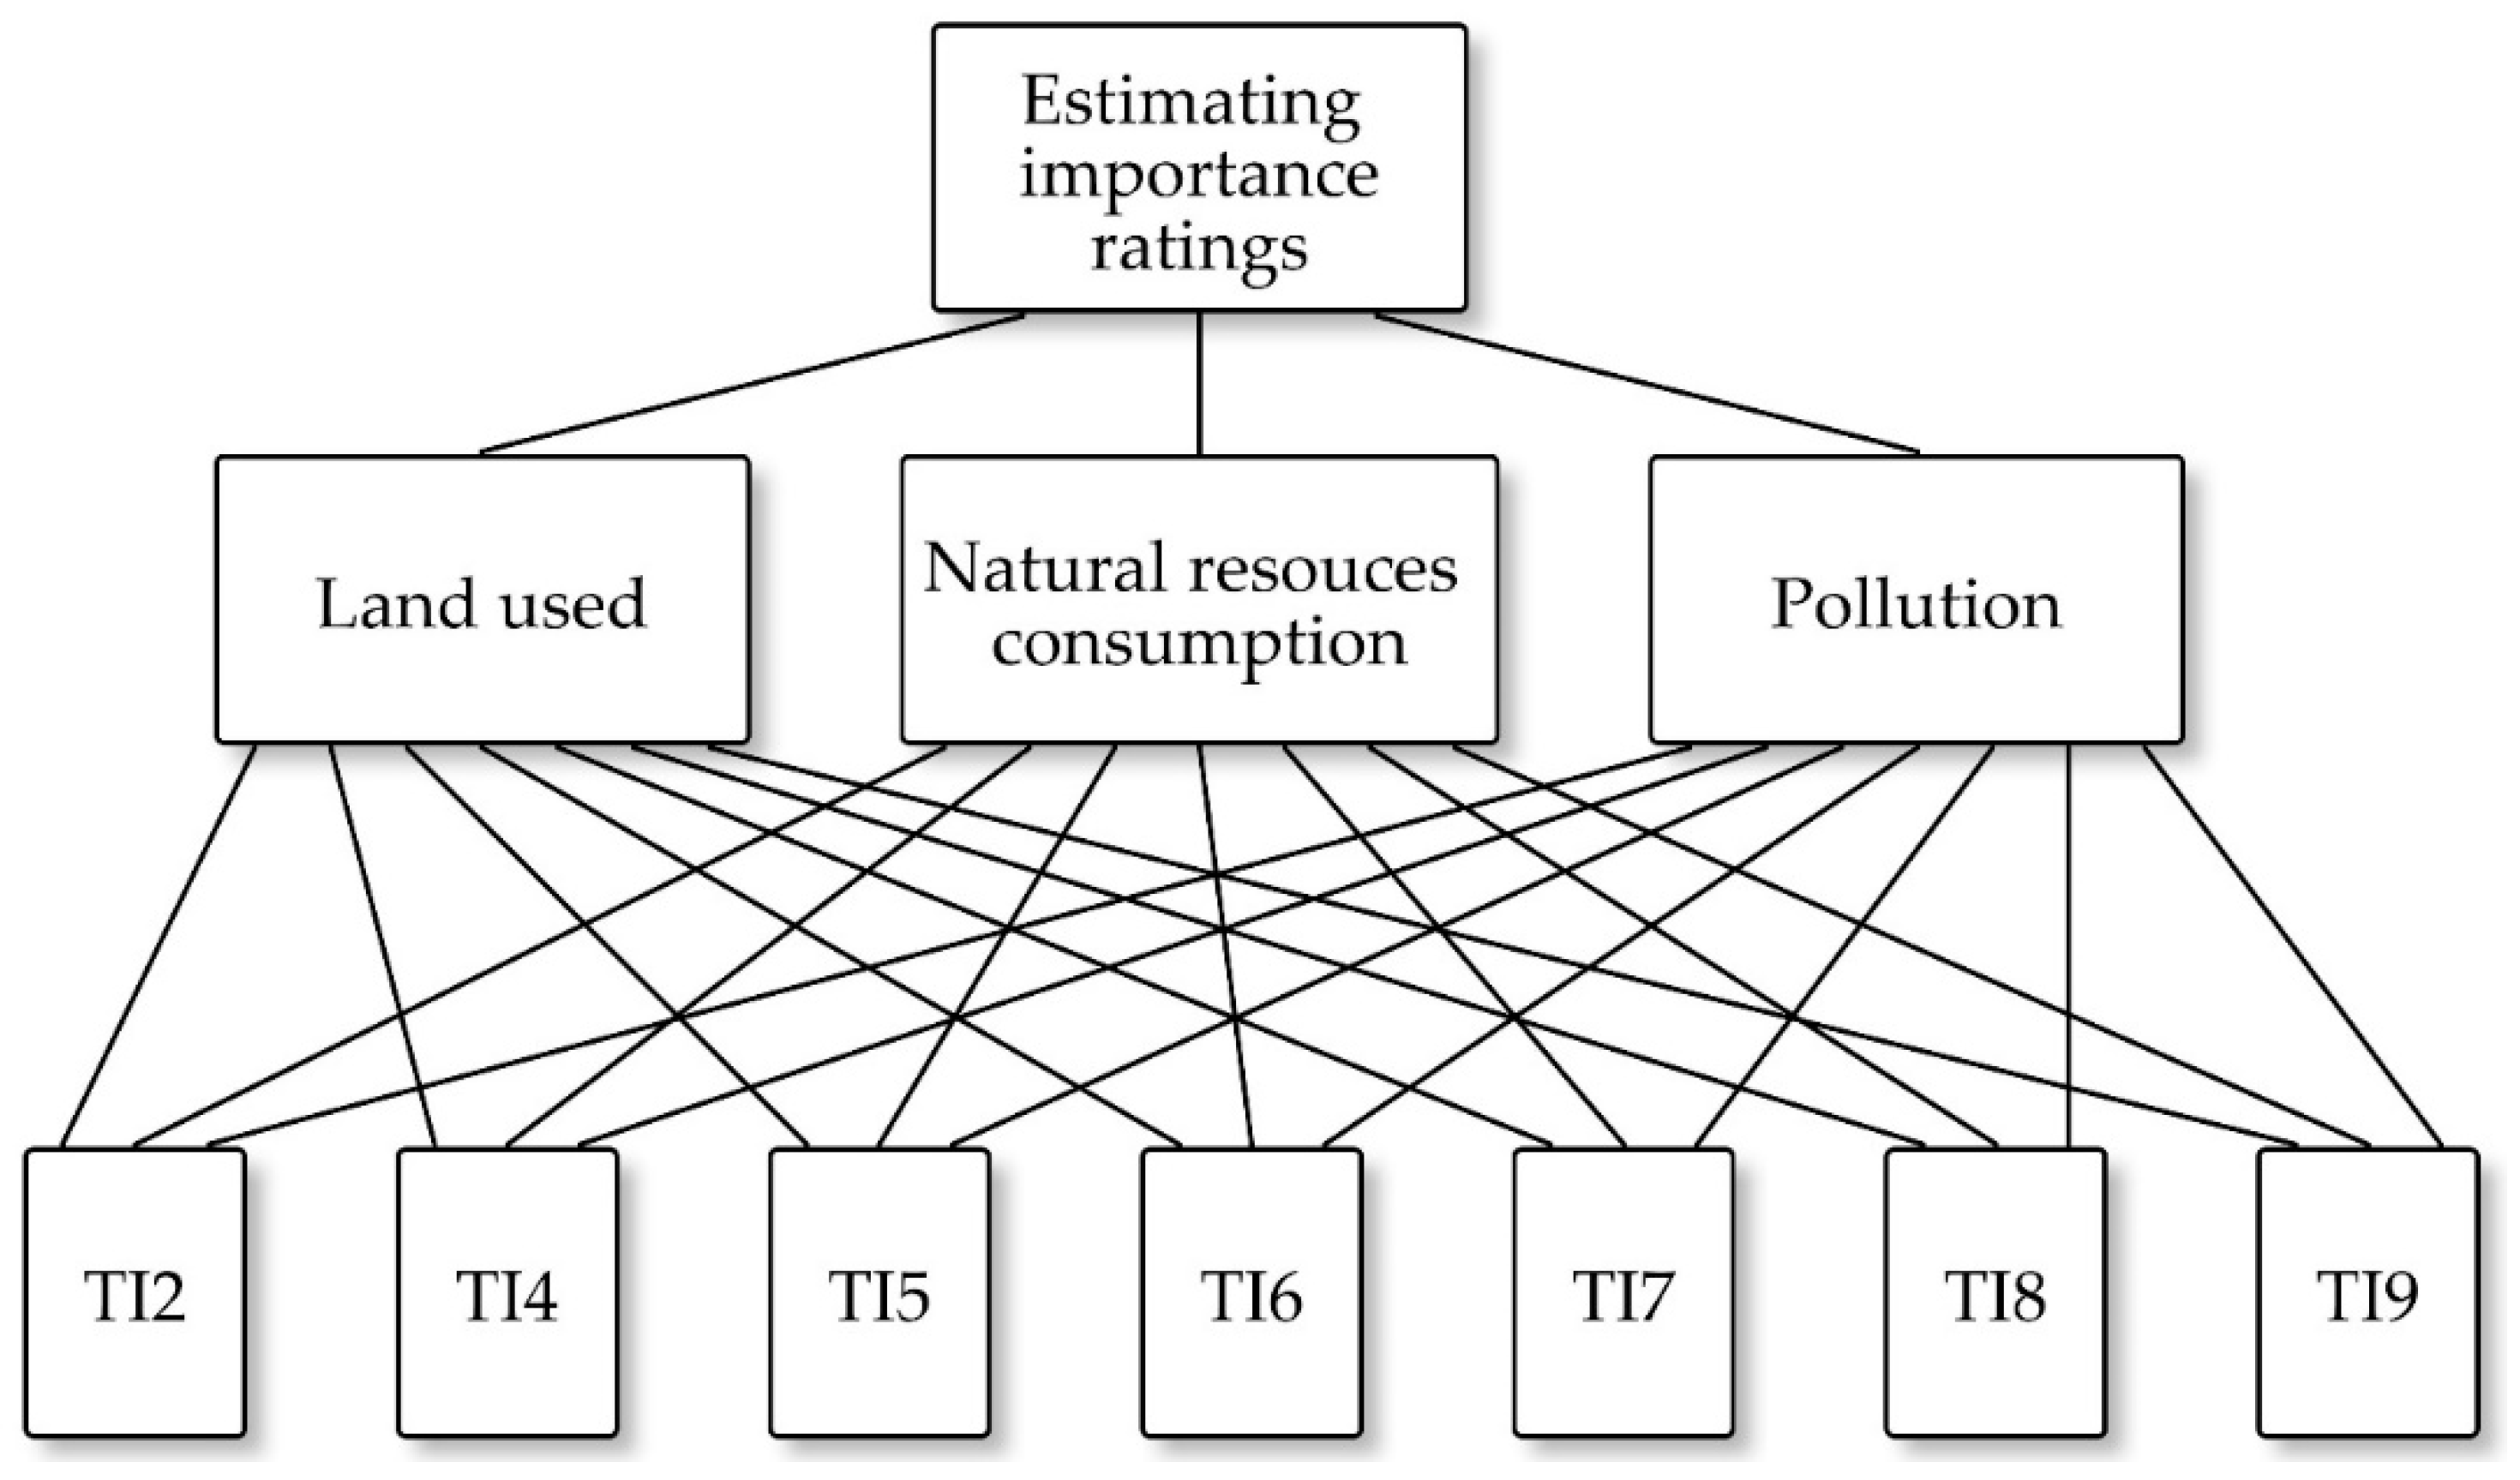
3.2.2. STEP 2: Creating Hierarchies in Environmental and Social Dimensions

Since the classical AHP method was used in Reference [49] to estimate importance ratings, a hierarchical structure needs to be developed. This represents complex decision problems through the identification of the goal, criteria, sub-criteria, and available alternatives. To do so, the effects of the technological innovations identified on the sustainability dimensions (Table 3) were taken into account. This research required creating two hierarchies, one per sustainability dimension under study. Each entire hierarchy is represented in three levels, as illustrated in Figure 3 and Figure 4. In the top level, we place the aim of the decision problem. The elements in the second levels are the sustainability effects considered in the environmental and social dimensions, respectively. The bottom level contains those technology innovations that may lead to any improvement in each sustainability dimension. Each line shows, with regards to a higher element, a lower element compared to the rest of the elements in the same level. Since we applied AHP to estimate a global importance score of each technological innovation in the environmental sustainability (Figure 3) and the social sustainability (Figure 4), all technological innovations were linked with every sustainability effect. Otherwise, a relative importance score of each technological innovation would have been generated per each sustainability effect with which it is linked and, therefore, the hybridization of IPA and AHP would not have been possible in our study.

3.2.3. STEP 3: Generating Performance Ratings of Technological Innovations

With the goal of generating performance ratings, a panel of 14 Spanish experts on urban transport was created. They were informed about the purpose of the research, its confidential nature, and their right to decline participation. In order to guarantee the results’ validity, the participants should pertain to a wide variety of positions and backgrounds [68]. They were selected for having a minimum experience of 4 years in the bus transportation field, and all of them were still in direct and daily contact with the field. Table 4 summarizes the experts’ profiles. Fourteen participants is also considered a good panel size to provide reliable findings, as suggested by the literature [69,70,71]. In order to minimize the group-thinking effects in research findings, no methodology was used to reach expert consensus. Formal or informal communication among the participants was not possible due to the experts not knowing at any moment who participated in the research. Nor was it allowed for the experts to receive answer reports and thus change their own opinion based on this feedback.
The experts’ panel was consulted during March and April of 2017. The data were gathered using a structured online questionnaire. This was individually emailed to the participant experts. The questionnaire began with a brief description of the research goal as well as detailed instructions to answer each part. The first part exclusively included questions on the experts’ profile (professional experience, current position, and academic studies). The second and third parts requested information on the importance and performance perceived of each technological innovation in accordance with the hierarchical structure of the environmental and social sustainability dimensions (Figure 3 and Figure 4), respectively. Concerning the performance rating, we added a question per technological innovation included in the respective hierarchy. In each question, the experts had to measure the perceived performance in environmental sustainability and social sustainability in the second and third parts, respectively. In this way, a symmetrical 5-point Likert scale was used (1 = insignificant, 2 = low performance, 3 = moderate performance, 4 = high performance, 5 = very high performance). Once all the questionnaires were received, performance ratings of technological innovations ( T I i ) were generated by applying Equation (1) [50].
P i = i = 1 n T I i j N
where T I i j represents the performance score that expert j assigned to technological innovation i and N represents the number of participants.

3.2.4. STEP 4: Estimating the Importance Ratings of Technological Innovations

The questionnaire also included, in the second and third parts, specific questions to estimate the importance ratings of each technological innovation. The experts were asked about the importance of each element with respect to each of the others at each level of the hierarchy. Their judgements were gathered using the nine-point scale presented in Table 1. The pairwise n x n matrix A may be directly built using Equations (2) and (3):
A = ( a i j ) ,   i , j = 1 , , n
A = ( 1 a 12 a 1 n 1 / a 12 1 1 a i j a j i = 1 / a i j 1 1 / a 1 n 1   )
where,
  • a i j is how much element i is more important than element j .
  • n is the number of elements compared in the ith level.
Each entry in the main diagonal is always equal to 1, since a i i indicates the importance of element i compared to itself. If a i j = 1 , the importance of elements i and j is the same. If a i j > 1 , the importance of element i is considered higher than the importance of element j . If a i j < 1 , the importance of element i is considered lower than that of element j . Matrix A   is therefore reciprocal, and the number of pairwise comparisons required (NPC) is computed using Equation (4).
N P C = ( n 2 n ) / 2
Subsequently, the consistency of the experts’ judgements must be checked using the principal eigenvalue ( λ m a x ). This allows estimating C R (5) and the consistency index ( C I ) (6) [72]:
C R = C I / R I
C I = ( λ m a x n ) / ( n 1 )
where R I is the random consistency index [64]. If C R > 0.1 , the judgements provided by the experts are not considered consistent. The implication of this is that the pairwise comparison must be verified and repeated by the experts. If C R 0.1 , then the experts’ judgements are considered consistent and the vector of importance rating ( ω ) can be already generated by applying (7). In this study, the calculations were made by expert choice software. The C R values were 0.04 and 0.03 for the environmental and the social sustainability dimensions, respectively. It is important to point out that unless CR = 0, the expert judgements are not considered to be completely consistent [73]. The CR values reached in our research highlight that the expert judgements did not present a total level of agreement although they were below the limit value and therefore pairwise comparison did not have to be repeated,
A ω = λ m a x ω

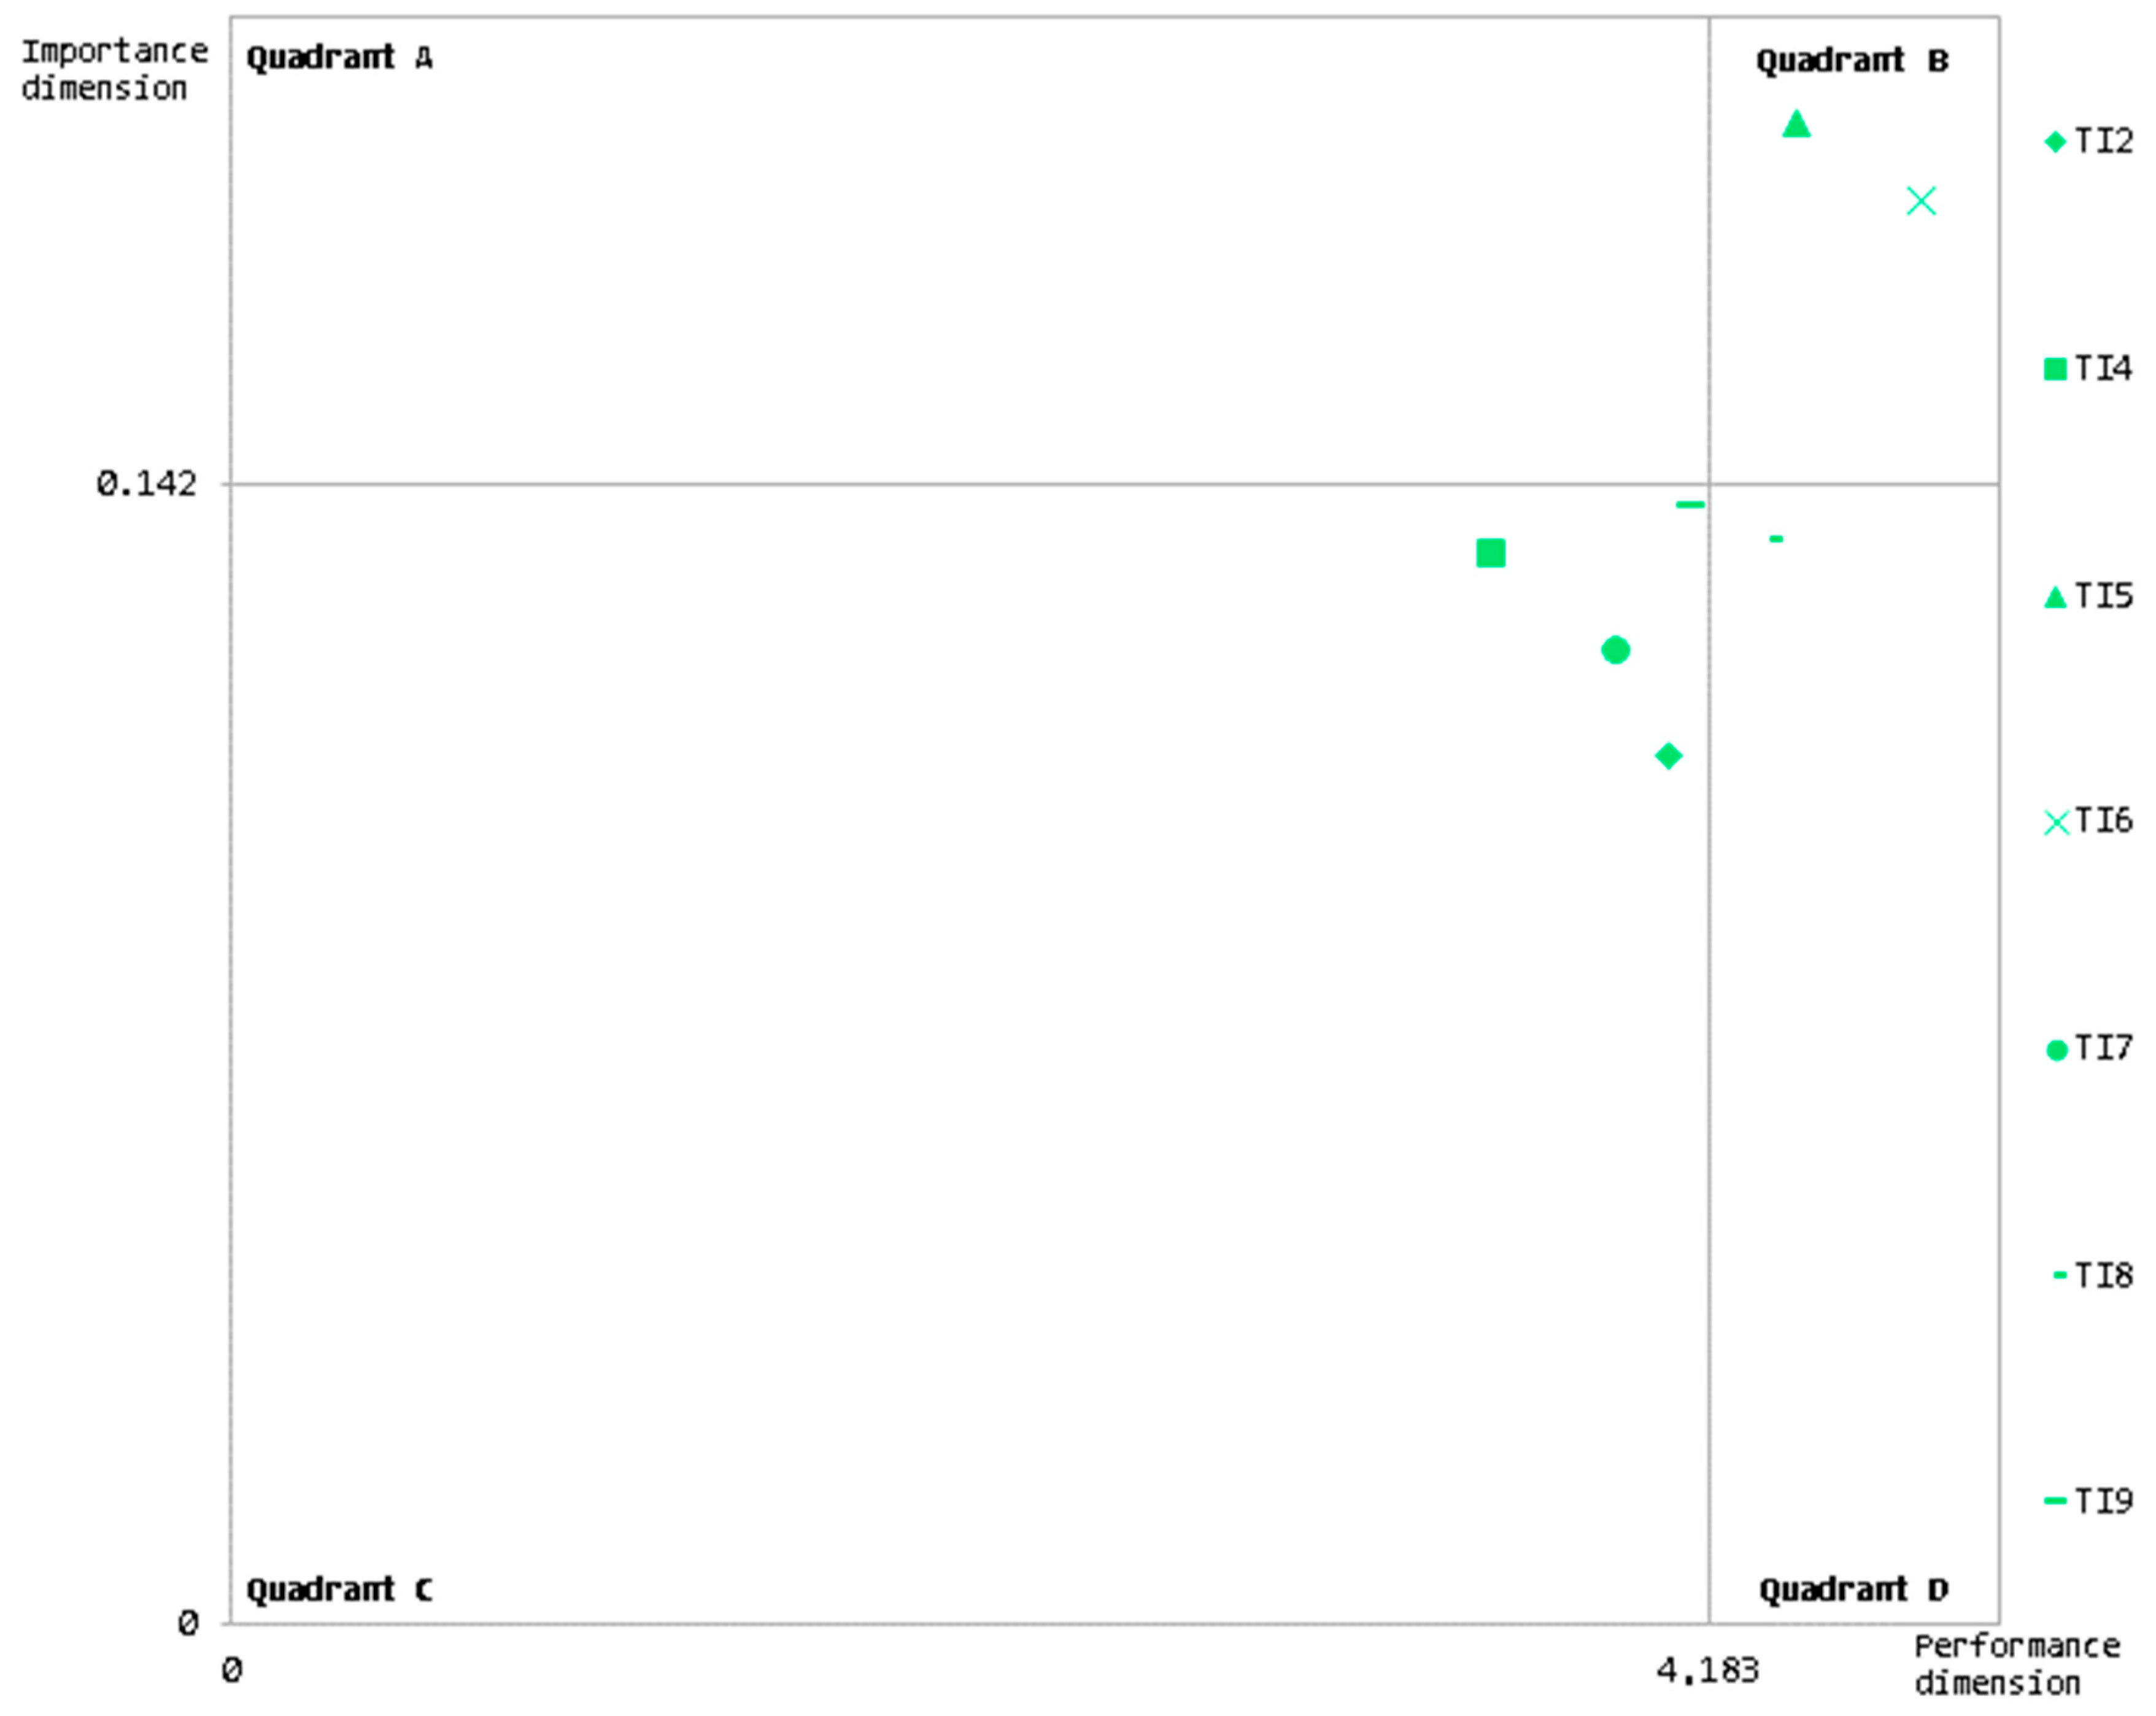
3.2.5. STEP 5: Generating Importance Performance Analysis (IPA) Matrices

Once the importance and performance ratings had been obtained, the IPA matrix was generated. On the one hand, the importance rating of each technological innovations was plotted in the Y-axis and the performance rating of each technological innovations was plotted in the X-axis as coordinates (x,y) in a graph. On the other hand, the grand mean of importance ratings (the cutting point of the Y-axis) and the grand mean of performance ratings (the cutting point of the X-axis) were represented [74]. Thus, the graph was converted into a two-dimensional grid with a division into four quadrants with the following meaning:
Quadrant A (Concentrate here). Technological innovations plotted in this quadrant present a high level of importance and a low level of performance. Hence, this quadrant is known as the preferential improvement area. Even though these technological innovations enable improvements in either the social or environmental sustainability of city logistics, scarce efforts and resources have been allocated for their implementation. Managers ought to prioritize the development of these technological innovations.
Quadrant B (Keep up the good work). Technological innovations represented in this quadrant show a high level of importance and a high level of performance. The managers of urban bus transport firms should maintain current efforts and resources allocated to them, because these technological innovations have proven to improve sustainability in city logistics.
Quadrant C (low priority). Technological innovations represented in this quadrant show a low level of importance and a low level of performance. These do not require an assignment of additional resources and efforts since those technological innovations do not provide enough improvements in either the social or environmental sustainability of city logistics.
Quadrant D (possible overkill). Technological innovations plotted in this quadrant present a low level of importance and a high level of performance. Urban bus transport companies have addressed excessive efforts and resources to developing these technological innovations when they do not provide enough improvements in the sustainability of city logistics. Therefore, managers should cut down on the resources and efforts for these technological innovation developments.

4. Results

One of the specific strengths of coupling IPA with AHP lies in the fact that the technological innovations are measured considering multiple and weighted effects of environmental and social sustainability. Table 5 displays a summary of local weights assigned to sustainability effects. It can be observed that pollution presents the highest value in the environmental dimensions. Indeed, its local weight (0.466) was from 0.12 to 2.95 times greater than that for other environmental sustainability effects. Natural resource consumption reached a local weight of 0.377, in second place, which makes these effects attain 84.3% of the total weight in the environmental dimension. This fact should be translated into a stronger commitment to improving these effects from urban bus transport companies, governments and society in general. Even though the land used achieved the lowest value, with a local weight of 0.158, all entities should take it into account in their future decisions as it bears some significance. Environmental sustainability in city logistics would thus be able to be enhanced more effectively.
Concerning social sustainability effects, their local weights were very close between each other. Accessibility reached the highest local weight of 0.422. This score was from 1.22 to 1.83 times greater than the other social sustainability effects. Services for the community and to facilitate the use of bus transport were ranked in the second and third place, with a local weight of 0.346 and 0.231, respectively. The results therefore reveal that achieving a better accessibility to urban bus transport should be pursued to improve social sustainability. The rest of the sustainability effects ought to be considered by decision makers with a slightly lower importance level.

4.1. Effects of Technological Innovations on Environmental Sustainability

In order to explore the effects of the technological innovations implemented by urban bus firms on the environmental sustainability, a specific IPA grid is generated by applying the steps indicated in Section 3.2. The importance ratings (Y-axis) and performance ratings (Y-axis) obtained are shown in Table 6. These points comprise the specific coordinates (x,y) of each technological innovation in the IPA grid. In addition, the cutting points of the Y-axis and X-axis were 0.142 and 4.183, respectively. The IPA grid obtained in the environmental dimension is given in Figure 5.
Quadrant A is considered as the preferential improvement area, since it includes each technological innovation s which has a high level of importance and a low level of performance. In this research, no technological innovation was classified in this quadrant. This indicates that none of the developed technological innovations should be encouraged to a greater extent than the action plans currently state.
Quadrant B includes 2 out of 7 technological innovations developed by urban bus companies. The findings reveal that both TI5 (Electric buses) and TI6 (Emission-free buses) are considered highly important for the improvement of the environmental sustainability of cities. These technological innovations may reduce the natural resource consumption and pollution in cities. At the same time, TI5 and TI6 attained a higher performance level by those European firms which had already implemented them. These companies ought therefore to continue extending and renewing their fleets with electric and emission-free buses. Furthermore, those organizations which have not yet implemented these technological innovations should prioritize them so as to make their business models more environmentally sustainable.
Quadrant C brings together the highest number of technological innovations implemented in the European urban bus transport sector. These are TI2 (Stations that integrated intermodality), TI4 (Machine for traveller information), TI7 (Quiet buses), and TI9 (Fast charge electric station), which represent 57.14% of the total. These four initiatives showed a low importance level to improve the environmental sustainability in cities. The results also reveal that companies which have already implemented TI2, TI4, P7, and TI9 reached a low performance level from the environmental perspective. Consequently, it is recommended not to plan and invest further resources and efforts in developing those technological innovations. In the same line, those organizations that have not yet developed these technological innovations should not incorporate them into their business models.
Quadrant D only contains one technological innovation out of the 7 under study. TI8 (Hydrogen-powered buses) showed a low importance level in enhancing environmental sustainability in city logistics. In spite of this, the technological innovation presented a high performance level. This is due to organizations having carried out excessive efforts and invested resources in implementing TI8 from the environmental perspective. Hence, managers ought to reduce the efforts and resources invested in this technological innovation. For those firms that have not yet extended and renewed their fleets with hydrogen-powered buses, they should not prioritize this.

4.2. Effects of Technological Innovations on Social Sustainability

In addition to the IPA grid for environmental sustainability in city logistics, another IPA grid was built to specifically explore the effects of technological innovations on social sustainability. Table 7 depicts the importance ratings (Y-axis) and performance ratings (Y-axis) of all the technological innovations. These coordinates determine in which position of the IPA grid each technological innovation should be plotted. Moreover, the cutting points of the Y-axis and the X-axis were 0.125 and 4.06 respectively. Figure 6 illustrates the specific IPA grid for the social dimension.
As in the IPA grid for the environmental sustainability, Quadrant A does not include any technological innovation. This area classifies those technological innovations that present a high importance level and a low performance level. Therefore, if companies seek to make their business models more socially sustainable, they ought to prioritize technological innovations included in Quadrant A in their action plans. However, since no technological innovations in this quadrant were included, one could infer that there is a further need for developing new socially sustainable innovations in the sector.
Quadrant B solely incorporates one technological innovation of all the ones developed by urban bus companies. TI1 (fully accessible buses) obtained a high importance level to enhance social sustainability. Indeed, this technological innovation might directly make the use of bus transport and its accessibility easier. TI1 also achieved a high performance level by those European firms which had already implemented it. For this reason, it is suggested that these organizations maintain concrete actions in their business model to continue making their fleet fully accessible. Moreover, TI1 should be a priority action for those companies that have not developed it yet.
Quadrant C contains 3 out of 8 technological innovations analyzed in the social sustainability dimension. TI4 (Machine for traveller information), TI5 (Electric buses), and TI8 (Hydrogen-powered buses) attained both low importance and performance levels from the social sustainability perspective. This implies that these technological innovations provide little or no improvement in the social sustainability of city logistics. Hence, managers of urban bus transport firms should not allocate further efforts and resources to developing TI4, TI5, and TI8.
Quadrant D brings together the highest number of technological innovations included in the social dimension. TI2 (Stations that integrated intermodality), TI3 (Application with information), TI6 (Emission-free buses), and TI7 (Quiet buses) also obtained a low importance level for improving social sustainability, although they attained a high performance level. This highlights the fact that firms that have already implemented these technological innovations should cut down resources and efforts in their future action plans. With regard to those companies that have not yet developed these technological innovations, the recommendation is to not focus their efforts on them.

5. Discussion and Conclusions

The whole globe is facing a situation of overcrowded cities and this is only getting more accentuated with time. There is an urgent need to increase cities’ sustainability and not only at the environmental level. One of the main activities that is currently aggravating this situation is the transportation sector. Urban transportation worsens cities’ environmental and social sustainability. In order to overcome these problems, several countries all over the world have started to implement new policies and technological innovations in urban mobility systems. In particular, the EU has financed several research projects with the aim of improving urban transportation systems. Some of those projects were focused on the improvement of the bus mobility mode and have developed the technology to generate more environmentally and socially friendly buses. Measuring how effective those developed technological innovations are in the improvement of sustainability is critical, as bus transportation companies normally face economic restrictions and need to choose which innovations to implement in their business models.
In order to identify which technological innovations are the most successful ones to increase both environmental and social sustainability, a methodology that combines IPA and AHP is implemented. Previous studies have widely used quantitative methods such as CBA, LCC, LCA, and LSCA to assess system impacts on sustainability dimensions. The proposed IPA–AHP method is able to contribute by complementing those techniques that face problems when a qualitative way of extracting expert knowledge is required. More specifically, the proposed method might be employed when estimations of cost and benefit items present a high level of uncertainty due to, for instance, a lack of availability or reliability of data sources. A strength derived from employing IPA–AHP in the evaluation of the technological innovations in the bus sector lies in the final representation of results in easily interpreted visual matrices by stakeholders (i.e., managers, politicians, bus users, etc.), not requiring prior knowledge. The findings thus effectively guide decision makers in implementing strategies in a more integrated way. Furthermore, the complementarity of AHP with quantitative methods has been shown in the sustainability field. Zheng et al [46] applied a combined framework of LCSA and the AHP–VIKOR system to integrate economic, environmental, and social sustainability dimensions in the selection of pavement alternatives. Reza et al. [75] developed a more robust assessment of a sustainable flooring system by integrating LCA with AHP. This allowed the estimation of the triple bottom line criteria in an aggregated sustainability index. Looking to the future, it would be possible to analyze the performance derived from hybridizing those quantitative techniques with the proposed IPA–AHP method to support decision making in other sustainability problems.
Focusing our attention on the results of the IPA–AHP application, some contributions to the theoretical literature can be drawn. The findings show that in order to increase environmental sustainability, the technological innovations that achieve a greater impact are electric buses and emission-free buses. Therefore, those strategies are the ones that should be prioritized in order to achieve a greater performance in the environmental dimension. This result enforces previous studies [27] that also call for further technological advances in electric vehicles and other emerging technologies in order to decrease the overall environmental impact. However, the economic viability of implementing such technologies is still hindering its dissemination [7,13] and thus further efforts should be made in order to facilitate its implementation in public transportation systems. In parallel, in order to increase social sustainability, fully accessible buses are the technological innovation that will achieve a greater performance in the social dimension and therefore should be prioritized as well. This result enforces the conclusions by Hosseinlou and Kabiri [34] that find that the level of comfort for public transportation users is key to promoting sustainability behavior among the population. Thus, one of the technological innovations that can be implemented in order to increase the comfort level is to make fully accessible buses. Additionally, this method also identifies the technological innovations that show a great performance rating, but the relative importance in improving each of the sustainability dimensions is limited. This is the case with hydrogen-powered buses for the case of the environmental dimension and stations that integrated intermodality, application with information, emission-free buses, and quiet buses for the case of the social dimension. As a consequence, managers working in urban bus transport firms should not allocate further efforts and resources to develop those technological innovations.
These results guide managers in order to choose the technological innovations that should be followed in their companies in order to obtain a better sustainability performance. Furthermore, the results also help policy-makers and governments in order to induce and incentivize companies to implement the right technological innovations to improve sustainability in their cities through urban mobility plans. The findings also reveal what the research projects are that ought to be funded and where the research efforts should be made.
The present research has not been developed without limitations, particularly when focusing our attention only on the European sector of bus transport. There exists an important divergence between EU cities regarding their transport sustainability considerations. Hence, the unit of analysis has been those projects developed within the EU to improve environmental and social sustainability in cities through the implementation of technological innovations. It should thus be noted that the findings reached in the research do not imply that the technological innovations studied have been implemented in the entire EU, and therefore sustainability improvements have been achieved in every city across the EU.
A possible extension that would enrich this study would be to carry out a similar one in less developed countries and compare the results. The findings will presumably lead to demanding different actions and the prioritization of technological innovations. It might even considerably increase the number of technological innovations included in the preferential improvement area. In addition, perceptions of different actors (users, companies, local authorities, etc.) involved in sustainability in city logistics ought also to be contemplated in order to generate a much richer and generalizable model.
At the methodological level, in the case of new and closely related sustainability effects having to be incorporated, it would be advisable to replace AHP with Analytic Network Process (ANP) in the proposed approach. Moreover, the proposed IPA–AHP method can be tailored in future studies to integrate both environmental and social sustainability dimensions. This will require defining a new four-level hierarchy where the dimensions are included, bringing together their corresponding sustainability effects.

Author Contributions

Methodology design C.L.; Data collection and content analysis, C.V.-M.; Writing—review and editing, R.R.-B. and C.L.; software and visualization, C.L.; English proofreading, R.R.-B. All authors read and approved the final manuscript.

Funding

This project is supported by the Ministry of Industry, Economy and Competitivity of the Spanish Government (Grant ECO2016- 78493-R with FEDER funds).

Conflicts of Interest

The authors declare no conflict of interest.

References

  1. UN. 68% of the World Population Projected to Live in Urban Areas by 2050. Available online: https://www.un.org/development/desa/en/news/population/2018-revision-of-world-urbanization-prospects.html (accessed on 21 December 2018).
  2. European Commission Transport Emissions. Available online: https://ec.europa.eu/clima/policies/transport_en (accessed on 19 December 2018).
  3. Mugion, R.G.; Toni, M.; Raharjo, H.; Di Pietro, L.; Sebathu, S.P. Does the service quality of urban public transport enhance sustainable mobility? J. Clean. Prod. 2018, 174, 1566–1587. [Google Scholar] [CrossRef]
  4. Batur, İ.; Koç, M. Travel Demand Management (TDM) case study for social behavioral change towards sustainable urban transportation in Istanbul. Cities 2017, 69, 20–35. [Google Scholar] [CrossRef]
  5. Chen, S.-Y. True sustainable development of green technology: The influencers and risked moderation of sustainable motivational behavior. Sustain. Dev. 2018, 1–15. [Google Scholar] [CrossRef]
  6. Corazza, M.V.; Guida, U.; Musso, A.; Tozzi, M. A European vision for more environmentally friendly buses. Transp. Res. Part D Transp. Environ. 2016, 45, 48–63. [Google Scholar] [CrossRef]
  7. Krawiec, S.; Karoń, G.; Janecki, R.; Sierpiński, G.; Krawiec, K.; Markusik, S. Economic Conditions to Introduce the Battery Drive to Busses in the Urban Public Transport. Transp. Res. Procedia 2016, 14, 2630–2639. [Google Scholar] [CrossRef] [Green Version]
  8. Anonymous Volkswagen MAN’s $583,000 Electric Urban Bus to Test Cities’ Spending Plans. Available online: https://www.livemint.com/Industry/vdosSwOHkrP9OUDYluf5RJ/Volkswagen-MANs-583000-electric-urban-bus-to-test-cities.html (accessed on 27 February 2019).
  9. Foth, N.; Manaugh, K.; El-Geneidy, A.M. Towards equitable transit: Examining transit accessibility and social need in Toronto, Canada, 1996–2006. J. Transp. Geogr. 2013, 29, 1–10. [Google Scholar] [CrossRef]
  10. Ruiz, M.; Seguí Pons, J.M.; Mateu Lladó, J.; Martínez Reynés, M.R. Evaluación de la equidad del servicio de transporte público: El caso de Palma de Mallorca. Estud. Geográficos 2017, 77, 619. [Google Scholar] [CrossRef] [Green Version]
  11. Currie, G. Quantifying spatial gaps in public transport supply based on social needs. J. Transp. Geogr. 2010, 18, 31–41. [Google Scholar] [CrossRef]
  12. Heyvaert, S.; Coosemans, T.; Van Mierlo, J.; Macharis, C. Living lab electric vehicles flanders (Belgium): The influence of testing an EV on the general appreciation of electric mobility. In Proceedings of the 2013 World Electric Vehicle Symposium and Exhibition (EVS27), Barcelona, Spain, 17–20 November 2013; Volume 98, pp. 1–7. [Google Scholar]
  13. Ajanovic, A.; Haas, R. Dissemination of electric vehicles in urban areas: Major factors for success. Energy 2016, 115, 1451–1458. [Google Scholar] [CrossRef]
  14. European Commission. A Concept for Sustainable Urban Mobility Plans; European Commission: Brussels, Belgium, 2013. [Google Scholar]
  15. Kolak, O.I.; Feyzioglu, O. Comparing European Countries Transport Networks with a Sustainability Perspective. In Proceedings of the Proceedings of the World Congress on Engineering adn Computer Science, San Francisco, CA, USA, 21–23 October 2015; Volume II. [Google Scholar]
  16. Sdoukopoulos, A.; Pitsiava-Latinopoulou, M. Assessing Urban Mobility Sustainability Through a System of Indicators: The Case of Greek Cities. WIT Trans. Ecol. Environ. 2017, 226, 617–631. [Google Scholar]
  17. Benjelloun, A.; Crainic, T.G.; Bigras, Y. Towards a taxonomy of City Logistics projects. Procedia Soc. Behav. Sci. 2010, 2, 6217–6228. [Google Scholar] [CrossRef] [Green Version]
  18. Perboli, G.; De Marco, A.; Perfetti, F.; Marone, M. A new taxonomy of smart city projects. Transp. Res. Procedia 2014, 3, 470–478. [Google Scholar] [CrossRef]
  19. Pomykala, A. Effectiveness of urban transport modes. MATEC Web Conf. 2018, 180, 03003. [Google Scholar] [CrossRef]
  20. Corazza, M.V.; Guida, U.; Musso, A.; Tozzi, M. A new generation of buses to support more sustainable urban transport policies: A path towards “greener” awareness among bus stakeholders in Europe. Res. Transp. Econ. 2016, 55, 20–29. [Google Scholar] [CrossRef]
  21. Robèrt, K.-H.; Borén, S.; Ny, H.; Broman, G. A strategic approach to sustainable transport system development—Part 1: Attempting a generic community planning process model. J. Clean. Prod. 2017, 140, 53–61. [Google Scholar] [CrossRef]
  22. Borén, S.; Nurhadi, L.; Ny, H.; Robèrt, K.-H.; Broman, G.; Trygg, L. A strategic approach to sustainable transport system development—Part 2: The case of a vision for electric vehicle systems in southeast Sweden. J. Clean. Prod. 2017, 140, 62–71. [Google Scholar] [CrossRef]
  23. Ny, H.; Borén, S.; Nurhadi, L.; Schulte, J.; Robèrt, K.-H.; Broman, G. On Track for 2030: Roadmap for a Fast Transition to Sustainable Personal Transport; Blekinge Institute of Technology: Karlskrona, Sweden, 2018. [Google Scholar]
  24. Sayyadi, R.; Awasthi, A. A system dynamics based simulation model to evaluate regulatory policies for sustainable transportation planning. Int. J. Model. Simul. 2017, 37, 25–35. [Google Scholar] [CrossRef]
  25. Noto, G. Combining system dynamics and performance management to support sustainable Urban transportation planning. J. Urban Reg. Anal. 2017, 9, 51–71. [Google Scholar]
  26. de Andrade Guerra, J.B.S.O.; Pereira Ribeiro, J.M.; Fernandez, F.; Bailey, C.; Barbosa, S.B.; da Silva Neiva, S. The adoption of strategies for sustainable cities: A comparative study between Newcastle and Florianópolis focused on urban mobility. J. Clean. Prod. 2016, 113, 681–694. [Google Scholar] [CrossRef]
  27. Büyüközkan, G.; Feyzioğlu, O.; Göçer, F. Selection of sustainable urban transportation alternatives using an integrated intuitionistic fuzzy Choquet integral approach. Transp. Res. Part D Transp. Environ. 2018, 58, 186–207. [Google Scholar] [CrossRef]
  28. Feikie, X.; Das, D.; Mostafa, M. Integrating Information and Communication Technology As a Solution To Sustainable Road Transportation in South Africa. In Proceedings of the 36th Southern African Transport Conference (SATC), Pretoria, South Africa, 10–13 July 2017; pp. 556–568. [Google Scholar]
  29. Fontoura, W.B.; Chaves, G.D.L.D.; Ribeiro, G.M. The Brazilian urban mobility policy: The impact in São Paulo transport system using system dynamics. Transp. Policy 2019, 73, 51–61. [Google Scholar] [CrossRef]
  30. Bandeira, R.A.M.; D’Agosto, M.A.; Ribeiro, S.K.; Bandeira, A.P.F.; Goes, G.V. A fuzzy multi-criteria model for evaluating sustainable urban freight transportation operations. J. Clean. Prod. 2018, 184, 727–739. [Google Scholar] [CrossRef]
  31. Hatefi, S.M. Strategic planning of urban transportation system based on sustainable development dimensions using an integrated SWOT and fuzzy COPRAS approach. Glob. J. Environ. Sci. Manag. 2018, 4, 99–112. [Google Scholar]
  32. Haghshenas, H.; Vaziri, M.; Gholamialam, A. Evaluation of sustainable policy in urban transportation using system dynamics and world cities data: A case study in Isfahan. Cities 2015, 45, 104–115. [Google Scholar] [CrossRef]
  33. Zailani, S.; Iranmanesh, M.; Nikbin, D.; Jumadi, H.B. Determinants and environmental outcome of green technology innovation adoption in the transportation industry in Malaysia. Asian J. Technol. Innov. 2014, 22, 286–301. [Google Scholar] [CrossRef]
  34. Hosseinlou, M.H.; Kabiri, S. Long-Term Air Pollution Responses to Transportation Policies in the Tehran Metropolitan Area. Arch. Civ. Eng. 2016, 62, 51–72. [Google Scholar] [CrossRef] [Green Version]
  35. CEC. Sustainable Urban Development in the European Union: A framework for Action; COM (98) 605 Final; CEC: Brussles, Belgium, 1998. [Google Scholar]
  36. Weber, U.; Buchwald, F. European Union Environmental Legislation. Existing and Proposed Legislation and the Potential Impact on Public Transport; UITP: Brussles, Belgium, 2009. [Google Scholar]
  37. Evans, N.; Clement, S.; Wimmer, F.; Chesterton, V. Clean Buses—Experiences with Fuel and Technology Options; Clean Fleets project consortium: Brussles, Belgium, 2014. [Google Scholar]
  38. O’Neill, K.; Rudden, P. Environmental Best Practice & Benchmarking Report; RPS: Dublin, Ireland, 2013. [Google Scholar]
  39. Bruge, P.; Guida, U.; Goralczyk, M.V.D.B. ZeEUS eBus Report. An Overview of Electric Buses in Europe; UITP: Brussels, Belgium, 2016. [Google Scholar]
  40. Xepapadeas, A. Ios Environmental Sustainability and Economic Development: Cost Benefit Analysis for Working Paper Series. Work. Pap. Ser. 2014, 14–13, 1–13. [Google Scholar]
  41. van Wee, G. Transport and Ethics: Ethics and the Evaluation of Transport Policies and Projects; Edward Elgar Publishing: Cheltenham, UK, 2011; ISBN 978-1-8498-0964-1. [Google Scholar]
  42. ISO. Environmental Management—Life Cycle Assessment—Principles and Framework (ISO 14040); ISO: Geneva, Switzerland, 2006; Volume ISO 14040. [Google Scholar]
  43. De Giacomo, M.R.; Testa, F.; Iraldo, F.; Formentini, M. Does Green Public Procurement lead to Life Cycle Costing (LCC) adoption? J. Purch. Supply Manag. 2018, 1–10. [Google Scholar] [CrossRef]
  44. Kara, S.; Li, W.; Sadjiva, N. Life Cycle Cost Analysis of Electrical Vehicles in Australia. Procedia CIRP 2017, 61, 767–772. [Google Scholar] [CrossRef]
  45. Finkbeiner, M.; Schau, E.M.; Lehmann, A.; Traverso, M. Towards life cycle sustainability assessment. Sustainability 2010, 2, 3309–3322. [Google Scholar] [CrossRef]
  46. Zheng, X.; Easa, S.M.; Yang, Z.; Ji, T.; Jiang, Z. Life-Cycle Sustainability Assessment of Pavement Maintenance Alternatives: Methodology and Case Study. J. Clean. Prod. 2018, 213, 659–672. [Google Scholar] [CrossRef]
  47. Söderqvist, T.; Brinkhoff, P.; Norberg, T.; Rosén, L.; Back, P.E.; Norrman, J. Cost-benefit analysis as a part of sustainability assessment ofremediation alternatives for contaminated land. J. Environ. Manag. 2015, 157, 267–278. [Google Scholar] [CrossRef] [PubMed]
  48. Higham, A.; Fortune, C.; James, H. Life cycle costing: Evaluating its use in UK practice. Struct. Surv. 2015, 33, 73–87. [Google Scholar] [CrossRef]
  49. Ishizaka, A.; Labib, A. Review of the main developments in the analytic hierarchy process. Expert Syst. Appl. 2011, 38, 14336–14345. [Google Scholar] [CrossRef]
  50. Martilla, J.A.; James, J.C. Importance-Performance Analysis. J. Mark. 1977, 41, 77–79. [Google Scholar] [CrossRef]
  51. Hansen, E.; Bush, R.J. Understanding Customer Quality Requirements Model and Application. Ind. Mark. Manag. 1999, 28, 119–130. [Google Scholar] [CrossRef]
  52. Abalo, J.; Varela, J.; Manzano, V. Importance values for Importance-Performance Analysis: A formula for spreading out values derived from preference rankings. J. Bus. Res. 2007, 60, 115–121. [Google Scholar] [CrossRef]
  53. López, C.; Salmeron, J.L. Risks Response Strategies for Supporting Practitioners Decision-Making in Software Projects. Procedia Technol. 2012, 5, 437–444. [Google Scholar] [CrossRef]
  54. Atzori, R.; Shapoval, V.; Murphy, K.S. Measuring Generation Y consumers’ perceptions of green practices at Starbucks: An IPA analysis. J. Foodserv. Bus. Res. 2018, 21, 1–21. [Google Scholar] [CrossRef]
  55. Eldho Babu, D.; Kaur, A.; Rajendran, C. Sustainability practices in tourism supply chain: Importance performance analysis. Benchmarking Int. J. 2018, 25, 1148–1170. [Google Scholar] [CrossRef]
  56. Ruiz-Benitez, R.; López, C.; Real, J.C. Environmental benefits of lean, green and resilient supply chain management: The case of the aerospace sector. J. Clean. Prod. 2017, 167, 850–862. [Google Scholar] [CrossRef]
  57. Azzopardi, E.; Nash, R. A critical evaluation of importance-performance analysis. Tour. Manag. 2013, 35, 222–233. [Google Scholar] [CrossRef]
  58. Feng, M.; Mangan, J.; Wong, C.; Xu, M.; Lalwani, C. Investigating the different approaches to importance–Performance analysis. Serv. Ind. J. 2014, 34, 1021–1041. [Google Scholar] [CrossRef]
  59. Oliver, R.L. Satisfaction: A Behavioral Perspective on the Consumer, 2nd ed.; Taylor & Francis: New York, NY, USA, 2010; ISBN 9780765617705. [Google Scholar]
  60. Oh, H. Revisiting importance—Performance analysis. Tour. Manag. 2001, 22, 617–627. [Google Scholar] [CrossRef]
  61. Hsu, W.-K.K.; Yu, H.-F.; Huang, S.-H.S. Evaluating the service requirements of dedicated container terminals: A revised IPA model with fuzzy AHP. Marit. Policy Manag. 2015, 42, 789–805. [Google Scholar] [CrossRef]
  62. Ganguly, K.; Rai, S.S. Evaluating the key performance indicators for supply chain information system implementation using IPA model. Benchmarking Int. J. 2018, 25, 1844–1863. [Google Scholar] [CrossRef]
  63. Kim, J.-R.; Jeon, E.-C.; Cho, S.; Kim, H. The Promotion of Environmental Management in the South Korean Health Sector—Case Study. Sustainability 2018, 10, 2081. [Google Scholar] [CrossRef]
  64. Saaty, T. The Analytical Hierarchy Process, Planning, Priority; RWS Publications: Pittshurgh, PA, USA, 1980. [Google Scholar]
  65. Saaty, T.L. How to make a decision: The analytic Hierarchy Process. Eur. J. Oper. Res. 1990, 48, 9–26. [Google Scholar] [CrossRef]
  66. Zahedi, F. The Analytic Hierarchy Process—A Survey of the Method and its Applications. Interfaces 1986, 16, 96–108. [Google Scholar] [CrossRef]
  67. Ali, I.; Nagalingam, S.; Gurd, B. The Management of Operations Building resilience in SMEs of perishable product supply chains: Enablers, barriers and risks. Prod. Plan. Control 2017, 7287, 1–15. [Google Scholar]
  68. Lummus, R.R.; Vokurka, R.J.; Duclos, L.K. Delphi study on supply chain flexibility. Int. J. Prod. Res. 2005, 43, 2687–2708. [Google Scholar] [CrossRef]
  69. Chung, C.C.; Chao, L.C.; Lou, S.J. The establishment of a green supplier selection and guidance mechanism with the ANP and IPA. Sustainability 2016, 8, 259. [Google Scholar] [CrossRef]
  70. Qazi, A.; Dickson, A.; Quigley, J.; Gaudenzi, B. Supply chain risk network management: A Bayesian belief network and expected utility based approach for managing supply chain risks. Int. J. Prod. Econ. 2018, 196, 24–42. [Google Scholar] [CrossRef]
  71. Ruiz-Benítez, R.; López, C.; Real, J.C. The lean and resilient management of the supply chain and its impact on performance. Int. J. Prod. Econ. 2018, 203, 190–202. [Google Scholar] [CrossRef]
  72. López, C.; Ishizaka, A. A scenario-based modeling method for controlling ECM performance. Expert Syst. Appl. 2018, 97, 253–265. [Google Scholar] [CrossRef]
  73. Chang, Y.; Yang, Y.; Dong, S. Sustainability evaluation of high-speed railway (HSR) construction projects based on unascertained measure and analytic hierarchy process. Sustainability 2018, 10, 408. [Google Scholar] [CrossRef]
  74. To, W.M.; Lam, K.H.; Lai, T.M. Importance-performance ratings for environmental practices among Hong Kong professional-level employees. J. Clean. Prod. 2015, 108, 699–706. [Google Scholar] [CrossRef]
  75. Reza, B.; Sadiq, R.; Hewage, K. Sustainability assessment of flooring systems in the city of Tehran: An AHP-based life cycle analysis. Constr. Build. Mater. 2011, 25, 2053–2066. [Google Scholar] [CrossRef]
Figure 1. Two-dimensional Importance Performance Analysis (IPA) grid adapted from Reference [50].
Sustainability 11 01413 g001
Figure 2. Step-by-step procedure.
Sustainability 11 01413 g002
Figure 3. Hierarchical structure of the environmental sustainability dimension.
Sustainability 11 01413 g003
Figure 4. Hierarchical structure of the social sustainability dimension.
Sustainability 11 01413 g004
Figure 5. Importance Performance Analysis (IPA) grid to improve environmental sustainability.
Sustainability 11 01413 g005
Figure 6. Importance Performance Analysis (IPA) grid to improve social sustainability.
Sustainability 11 01413 g006
Table 1. Saaty’s nine-point scale (adapted from Reference [64]).
Numerical ValueMeaning
1Equally important
3Moderately important
5Strongly important
7Extremely important
9Very extremely important
2, 4. 6, 8Intermediate judgements
Table 2. List of technological innovations in the transportation sector.
CodeTechnological Innovation (TI)DescriptionSource
TI1Fully accessible busesThe installation of specific mechanisms and or devices to make urban buses more accessible for the elderly, the disabled, tourists and children.CATS Project Horizon 2020
TI2Stations that integrated intermodalityDesign and station building that integrate all aspects of intermodality (infrastructure, localization, comfort, effectiveness and communication between cities). These incorporate an integrated network management enabling stations to support sustainable urban mobility.CATS Project Horizon 2020
TI3Application with informationWeb-based application on traveler information with open access serve and use in connection with multiple devices (PC, smartphone, etc.). Innovative public services can thus be offered to customers.TIDE Project Horizon 2020
TI4Machine for traveler informationThe installation of a user-friendly human machine interface (HMI) to give travelers information in real time.TIDE Project Horizon 2020
TI5Electric busesDeployment of clean buses powered by electricity.ELIPTIC Project Horizon 2020
TI6Emission-free busesDeployment of buses with integrated mechanism and/or devices (i.e., catalyzer) to emit zero greenhouse emissions.ZEEUS Project Horizon 2020
TI7Quiet busesDeployment of buses that run quiet operations.ZEEUS Project Horizon 2020
TI8Hydrogen-powered busesDeployment of clean buses that use hydrogen fuel cells as their power source.ÖBB (Austrian Postbus)
TI9Fast charging electric stationInstallation of fast charging stations for electric and hybrid buses Opbrid
Table 3. List of environmental and social sustainability effects.
Sustainability EffectsDimensionTI1TI2TI3TI4TI5TI6TI7TI8TI9
Land usedEnvironmental X X
PollutionEnvironmental X
Natural resources consumptionEnvironmental X XXXXXX
Services for communitySocialXX X X
AccessibilitySocialX XXXX
Facilitate the use of bus transportSocialXXXX
Table 4. Experts’ profiles.
Years of ExperiencePositionAcademic Studies
4–6 years7CEO2PhD1
7–9 years4Production and technology manager1University degree3
10 or more3Quality manager1Diploma of higher education5
Assistant4Engineer’s Degree1
Analyst4Non-university studies2
Technician2Not mentioned2
Table 5. Local weights of sustainability effects.
Sustainability EffectsDimensionLocal Weights
Land usedEnvironmental0.158
PollutionEnvironmental0.466
Natural resources consumptionEnvironmental0.377
Services for communitySocial0.346
AccessibilitySocial0.422
Facilitate the use of bus transportSocial0.231
Table 6. Findings of Importance Performance Analysis–Analytic Hierarchy Process (IPA-AHP) method in the environmental dimension.
Technological InnovationImportance RatingsPerformance RatingsQuadrant
TI20.1084.071C
TI40.1333.571C
TI50.1874.428B
TI60.1774.785B
TI70.1213.928C
TI80.1354.357D
TI90.1394.142C
Table 7. Findings of the Importance Performance Analysis–Analytic Hierarchy Process (IPA-AHP) method in the social dimension.
Technological InnovationImportance RatingsPerformance RatingsQuadrant
TI10.3094.571B
TI20.114.142D
TI30.1094.142D
TI40.093.428C
TI50.0924C
TI60.1184.214D
TI70.0874.142D
TI80.0853.857C

