1. Introduction
When it comes to the development of human societies, it is generally believed that its progress has been affected by biological, physical, and climatological systems. For this reason and as a consequence of these systems it is thought that the land cover has changed too [
1]. Basically, due to the fact that human beings have transformed the land by seeking essential materials so as to get their livelihood, moreover, this process has been developed for thousands of years [
2].
Precisely, if the alteration of the terrestrial surface is considered to be essentially caused by anthropogenic activities, and taking into account the fact that the terrestrial cover is related to the biophysical state of the surface of the Earth and its immediate subsoil, the concept “use of the earth “can be understood as the way in which space is being occupied by human society and the use that is made of the land by the local human population [
3,
4].
As for the study of the dynamics of land use change, satellite data has been shown to provide a complete and useful record for the analysis of land uses on the terrestrial cover, since they collect a wealth of data—considering the temporary sections or moments analyzed. Likewise, the obtaining of cartography on land use implies the creation of a close link between the physical environment that is analyzed and the socioeconomic characteristics of the analyzed societies that carry out or have made specific use of the land. For this reason, the measurements made on the use and coverage of the soil must follow a uniform classification system, to facilitate interpretation and achieve comparative analysis [
4]. To this end, data sets have been created with certain characteristics that offer mostly an observation by the global satellite of the Earth [
5].
All of them are a great source of information, but Global Land Cover 2000 (GLC2000) stands out among the available products since it has different mapping based on several standards that have global or continental land cover [
5]. Likewise, PELCOM (Pan-European Land Use and Land Cover Monitoring) also stands out for having images with a resolution of 1 km and for having images from 1996 [
6].
In this regard, highlights the inventory of Corine Land Cover (CLC or ‘Corine’), as it is one of the most common databases used by organizations in Europe. It is special monitoring of land uses changes in Europe have been carried out in a standardized manner. Contextually, the so-called inventory CLC has been created from satellite standardized images. Also, note that CLC is co-financed by the Member States of the European Union, the European Environment Agency (EEA) deals with its processing.
Certainly, this database has become a central element for the integration of the information system of the EEA, because the processing took into account several land use coverages, consisting of the guidelines of the System of Environmental and Economic Accounts (SEEA)—for “land and ecosystem” [
6]. As a consequence, within the project where it is developed known as CORINE, this database is considered with coverage of use in the European Union (EU) as very relevant, since it allows to reach a reliable knowledge of the changes produced in the coverage of the soil throughout Europe [
7].
Obtaining the CLC has been different between the different countries involved in the project. On the one hand, there are countries located in the northern territory of Europe such as Germany, Austria, Finland, Ireland, Iceland, Norway, the United Kingdom, and Switzerland, which since 2006 have obtained the CLC through techniques for generating national maps of their territories. They had more detail. On the other hand, the rest of the countries have generated the CLC from the photointerpretation of satellite images, the latter being the most common form in obtaining the CLC [
8].
Also, from the CLC, more detailed cartography has been obtained in countries such as Slovakia, Hungary or Poland [
8,
9,
10,
11,
12], giving a high value to this database. In fact, in these countries maps have been obtained with a minimum of map unit (MMU) from 4, at scale 1:50,000, also having a legend adapted to the specific geographical characteristics of the territory, thus achieving more intuitive and easily understandable cartography [
8]. Also, corroborating the validity of the techniques used, they have been used for periods prior to 1990, which is when the production of the CLC begins [
7].
Nonetheless, it is necessary to point out that countries such as Germany or Ireland have produced the CLC using different techniques, modifying their methodology in the production of the cartography that represents the use of the land of CORINE, varying the form of interpretation of the photographs [
8]. In a similar way, it happened in the Netherlands, since the government decided to produce the CLC independently [
13,
14].
Nevertheless, from the administrative and technical perspective, the potential of CORINE land use maps is unquestionable, since it is a highly relevant tool for the analysis of land uses. This fact is reflected in the INSPIRE 2007-2-EC directive [
10], where the CLC is shown as one of the sets where technical and semantic standardization has been achieved, constituting one of the most harmonized European datasets [
15,
16,
17].
This harmonization is put in value considering that there is tremendous heterogeneity in the maps considered representative of the land cover since they are obtained by means of different underlying methods and patterns [
18]. In fact, each of these maps can be the result of a different approach adopted to achieve the needs of a specific audience that will use this cartography. Therefore, on some occasions for different methodologies in the process of obtaining cartography, it is extremely difficult to separate land use changes [
17]. However, the objective of exploring the environmental, cultural, political and socioeconomic factors of a territory, causes that the sets of data on land use become crucial since these sets of factors affected by land use can influence decisively in making decisions about land use [
19,
20,
21].
Precisely, these tools that allow to relate different factors to the use of the territory, become of great pre-eminence in the design of the territories, since they acquire a tremendous relevance for decision-making, sometimes being considered as fundamental tools for planning of the territory, through the definition of policies for the management of natural resources [
22,
23,
24]. Because, for efficient management of natural resources, it is considered essential not only what is the use of the land, but also what is the distribution of the use made of the land, in order to carry out efficient management of natural resources [
4]. In fact, several initiatives have flourished with the aim of studying the coverage and uses of land, its patterns, and even its dynamics, based fundamentally on the need for knowledge and information on the state of the surface and occupation of our planet [
5,
6].
In this regard, analyzing and evaluating the distribution of land uses in Poland in the years 1990, 2000, and 2012 is the objective of this study. This study will explore territorial dynamics based on trends and barriers. In this way, it will be possible to determine the opportunities for sustainable growth and development, while identifying and analyzing the changes produced in land use.
2. Material and methods
Contextually, the study was based, mostly, on Corine Land Cover (CLC)—which is a vector map with a scale of 1:100,000, a minimum cartographic unit (MCU) of 25 ha. Therefore, it will be mapping homogeneous landscape patterns. Also, the nomenclature is a 3-level hierarchical classification system and has 44 classes (
Table 1). In addition, a set of general rules were selected in order to deal with areas smaller than 25 ha.
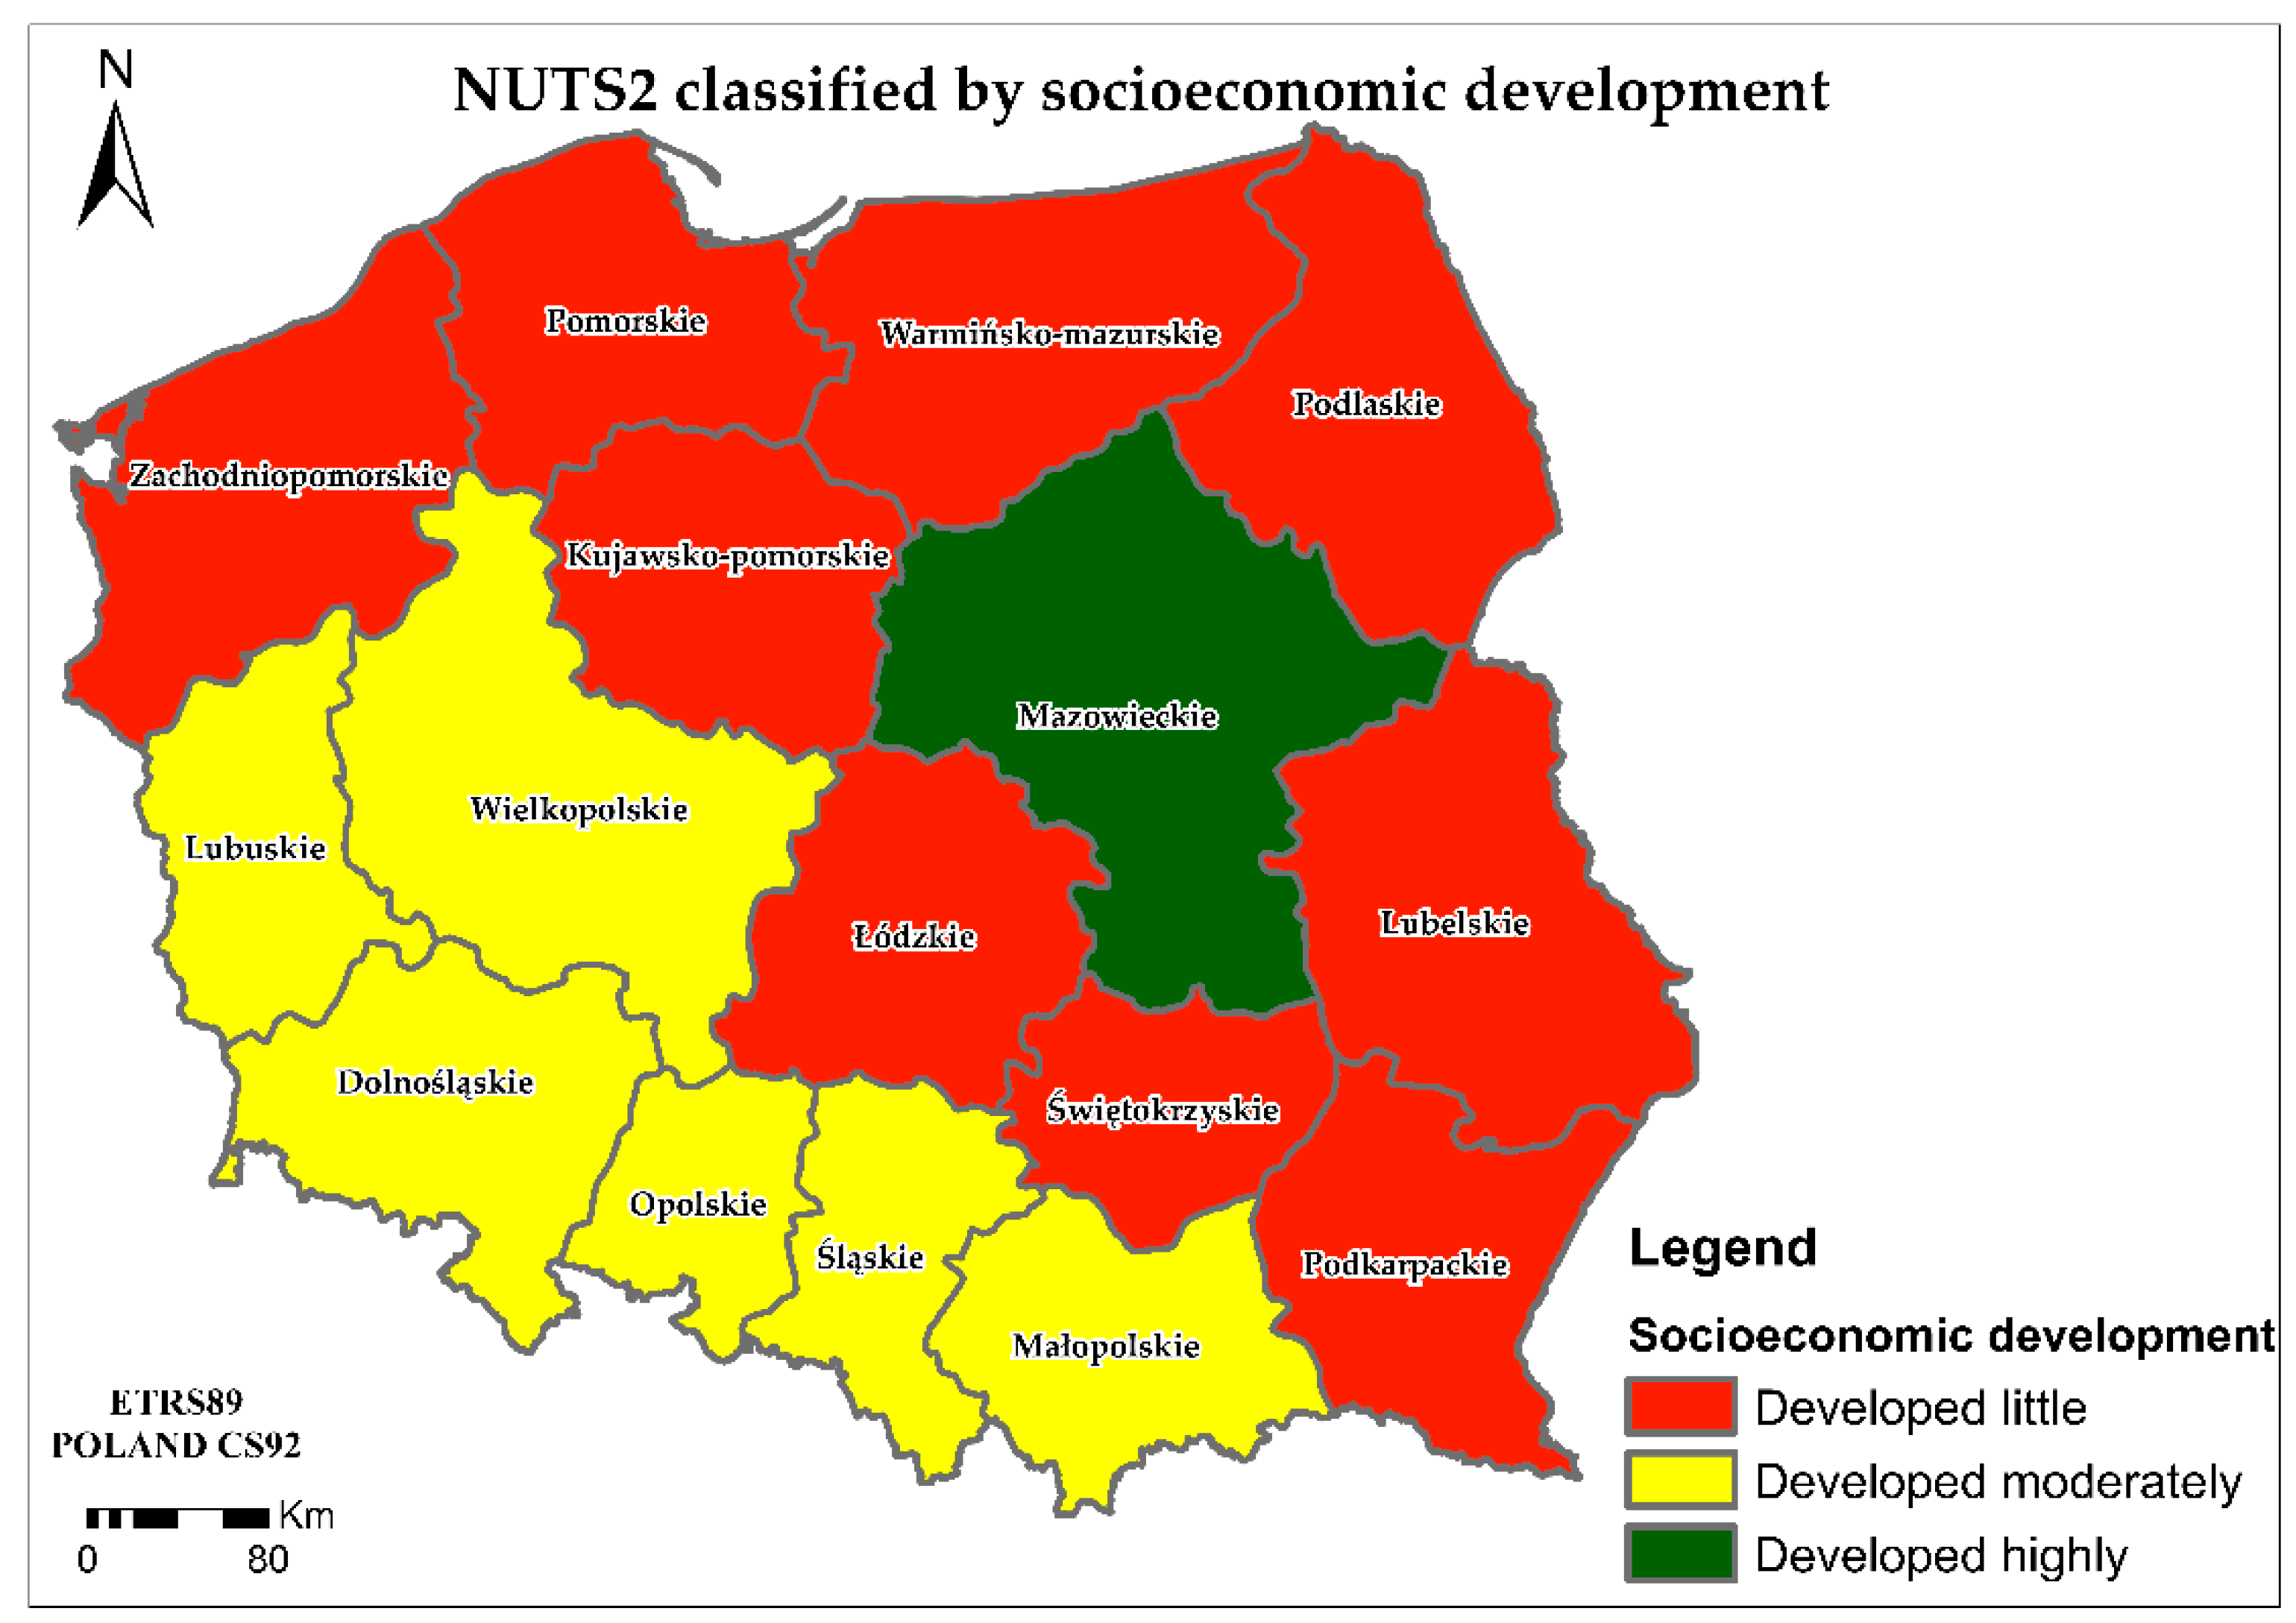
Furthermore, it was necessary to obtain the administrative divisions of the NUTS 2 (Nomenclature of Territorial Units for Statistics) pertaining to Poland. In fact, the information supplied by the European Environment Agency [
25] enabled us to obtain the delimitation of the 16 voivodeships in the country (
Figure 1).
Subsequently, it was necessary to gather information on the socio-economic features concerning these NUTS 2. In this sense, information on 19 variables was found (
Table 2).
Initially, it was discussed whether the variables to be used followed a normal distribution—conducted with the use of the Shapiro–Wilk test as the number of the NUTS 2 to be analyzed was sixteen. The results showed that variables such as: unemployment rate (Task Force Survey), gross domestic product (GDP) at current market prices by NUTS 2, share in national GDP, Euro per inhabitant and purchasing power standard (PPS) per inhabitant, did not follow a standard distribution. The level of significance was less than 0.05. Therefore, a normalization of the variables was conducted so that all of them would have a similar weight in the socio-economic classification of the 16 voivodeships.
Again, the Shapiro–Wilk test was repeated which confirmed that all the analyzed variables have been normalized since the significance amounted to p > 0.05.
Moreover, when the information from our data sample was collected, a large number of variables was taken into account. However, there may be a high correlation between the variables used. For this reason, the multivariate method called Principal Component Analysis (PCA) was used, which aimed to transform a set of original variables into a new set of variables called principal components. In this regard, the main components were characterized as being uncorrelated with each other and could be ordered according to the information they have incorporated. In this way, as a measure of the amount of information incorporated in a component, its variance was used. Thus, the greater the variance, the greater the amount of information that was incorporated.
Particularly after carrying out the PCA, it was verified that using 4 components, 82.031% of the original variance was collected. Therefore, the dimension to four components was decided to be reduced, losing as little information as possible (
Table 3).
Next, a strategy to classify the 16 voivodeships into groups according to their degree of socioeconomic development was developed. For this reason, the multivariate technique called cluster analysis was used, since its main purpose is to group objects forming clusters of objects with a high degree of internal homogeneity and external heterogeneity. In addition, groups are not known a priori in this type of technique.
In this regard, the selection of variables was performed considering only those, that were relevant for the classification and the PCA had been previously conducted. The other reason is that the cluster analysis is very sensitive to the presence of atypical components.
Once the atypical components were detected, the similarity between them was measured by means of the proximity matrix using squared Euclidean distances (
Table 4 and
Table 5).
In this way, the measure of correspondence or similarity between the components that were intended to be grouped was determined.
Likewise, with regard to obtaining the clusters, the hierarchical procedure and the algorithm of the furthest neighbor were used. In this way, the fusion coefficients showed us that the process could be stopped when there were 3 clusters. Thus, 3 clusters of voivodeships in Poland were obtained, grouped according to their socioeconomic development.
Subsequently, taking into account the descriptive statistics of each of the obtained groups, such as the arithmetic mean of the variables originally analyzed, it could be determined which of them displayed the highest, average, and lowest socioeconomic development.
Once the three clusters obtained have been characterized, taking into account land use in Poland through the use of Corine Land Cover, the number of hectares devoted to the different land uses in the three obtained socio-economic development classes was determined. To achieve this, ArcGIS 10.5. was used, analyzing the layer that delimits voivodeships and land uses. This analysis procedure was carried out for the years 1990, 2000, and 2012. In this way, it was be possible to obtain a perspective of how land use varied during the years under analysis. Moreover, it enabled to observe how the amount of land allocated to a certain use can influence the socioeconomic development of the three groups of voivodeships identified.
In order to simplify and enable a graphic understanding of the used methodology, the following scheme has been carried out (
Figure 2).
3. Results
The results come from the analysis of the land use (changes) for Poland in the years of 1990, 2000, and 2012. The results are exposed by means of maps, graphs, and tables. This way of presenting the results allows us to extract the most relevant information and to characterize the evolution of land use based on the uses determined by the CLC. The information is organized as presented in
Figure 3,
Figure 4 and
Figure 5 (regarding the following years: 1900, 2000, and 2012, respectively) and the
Table 6,
Table 7,
Table 8,
Table 9,
Table 10 and
Table 11—in percentage.
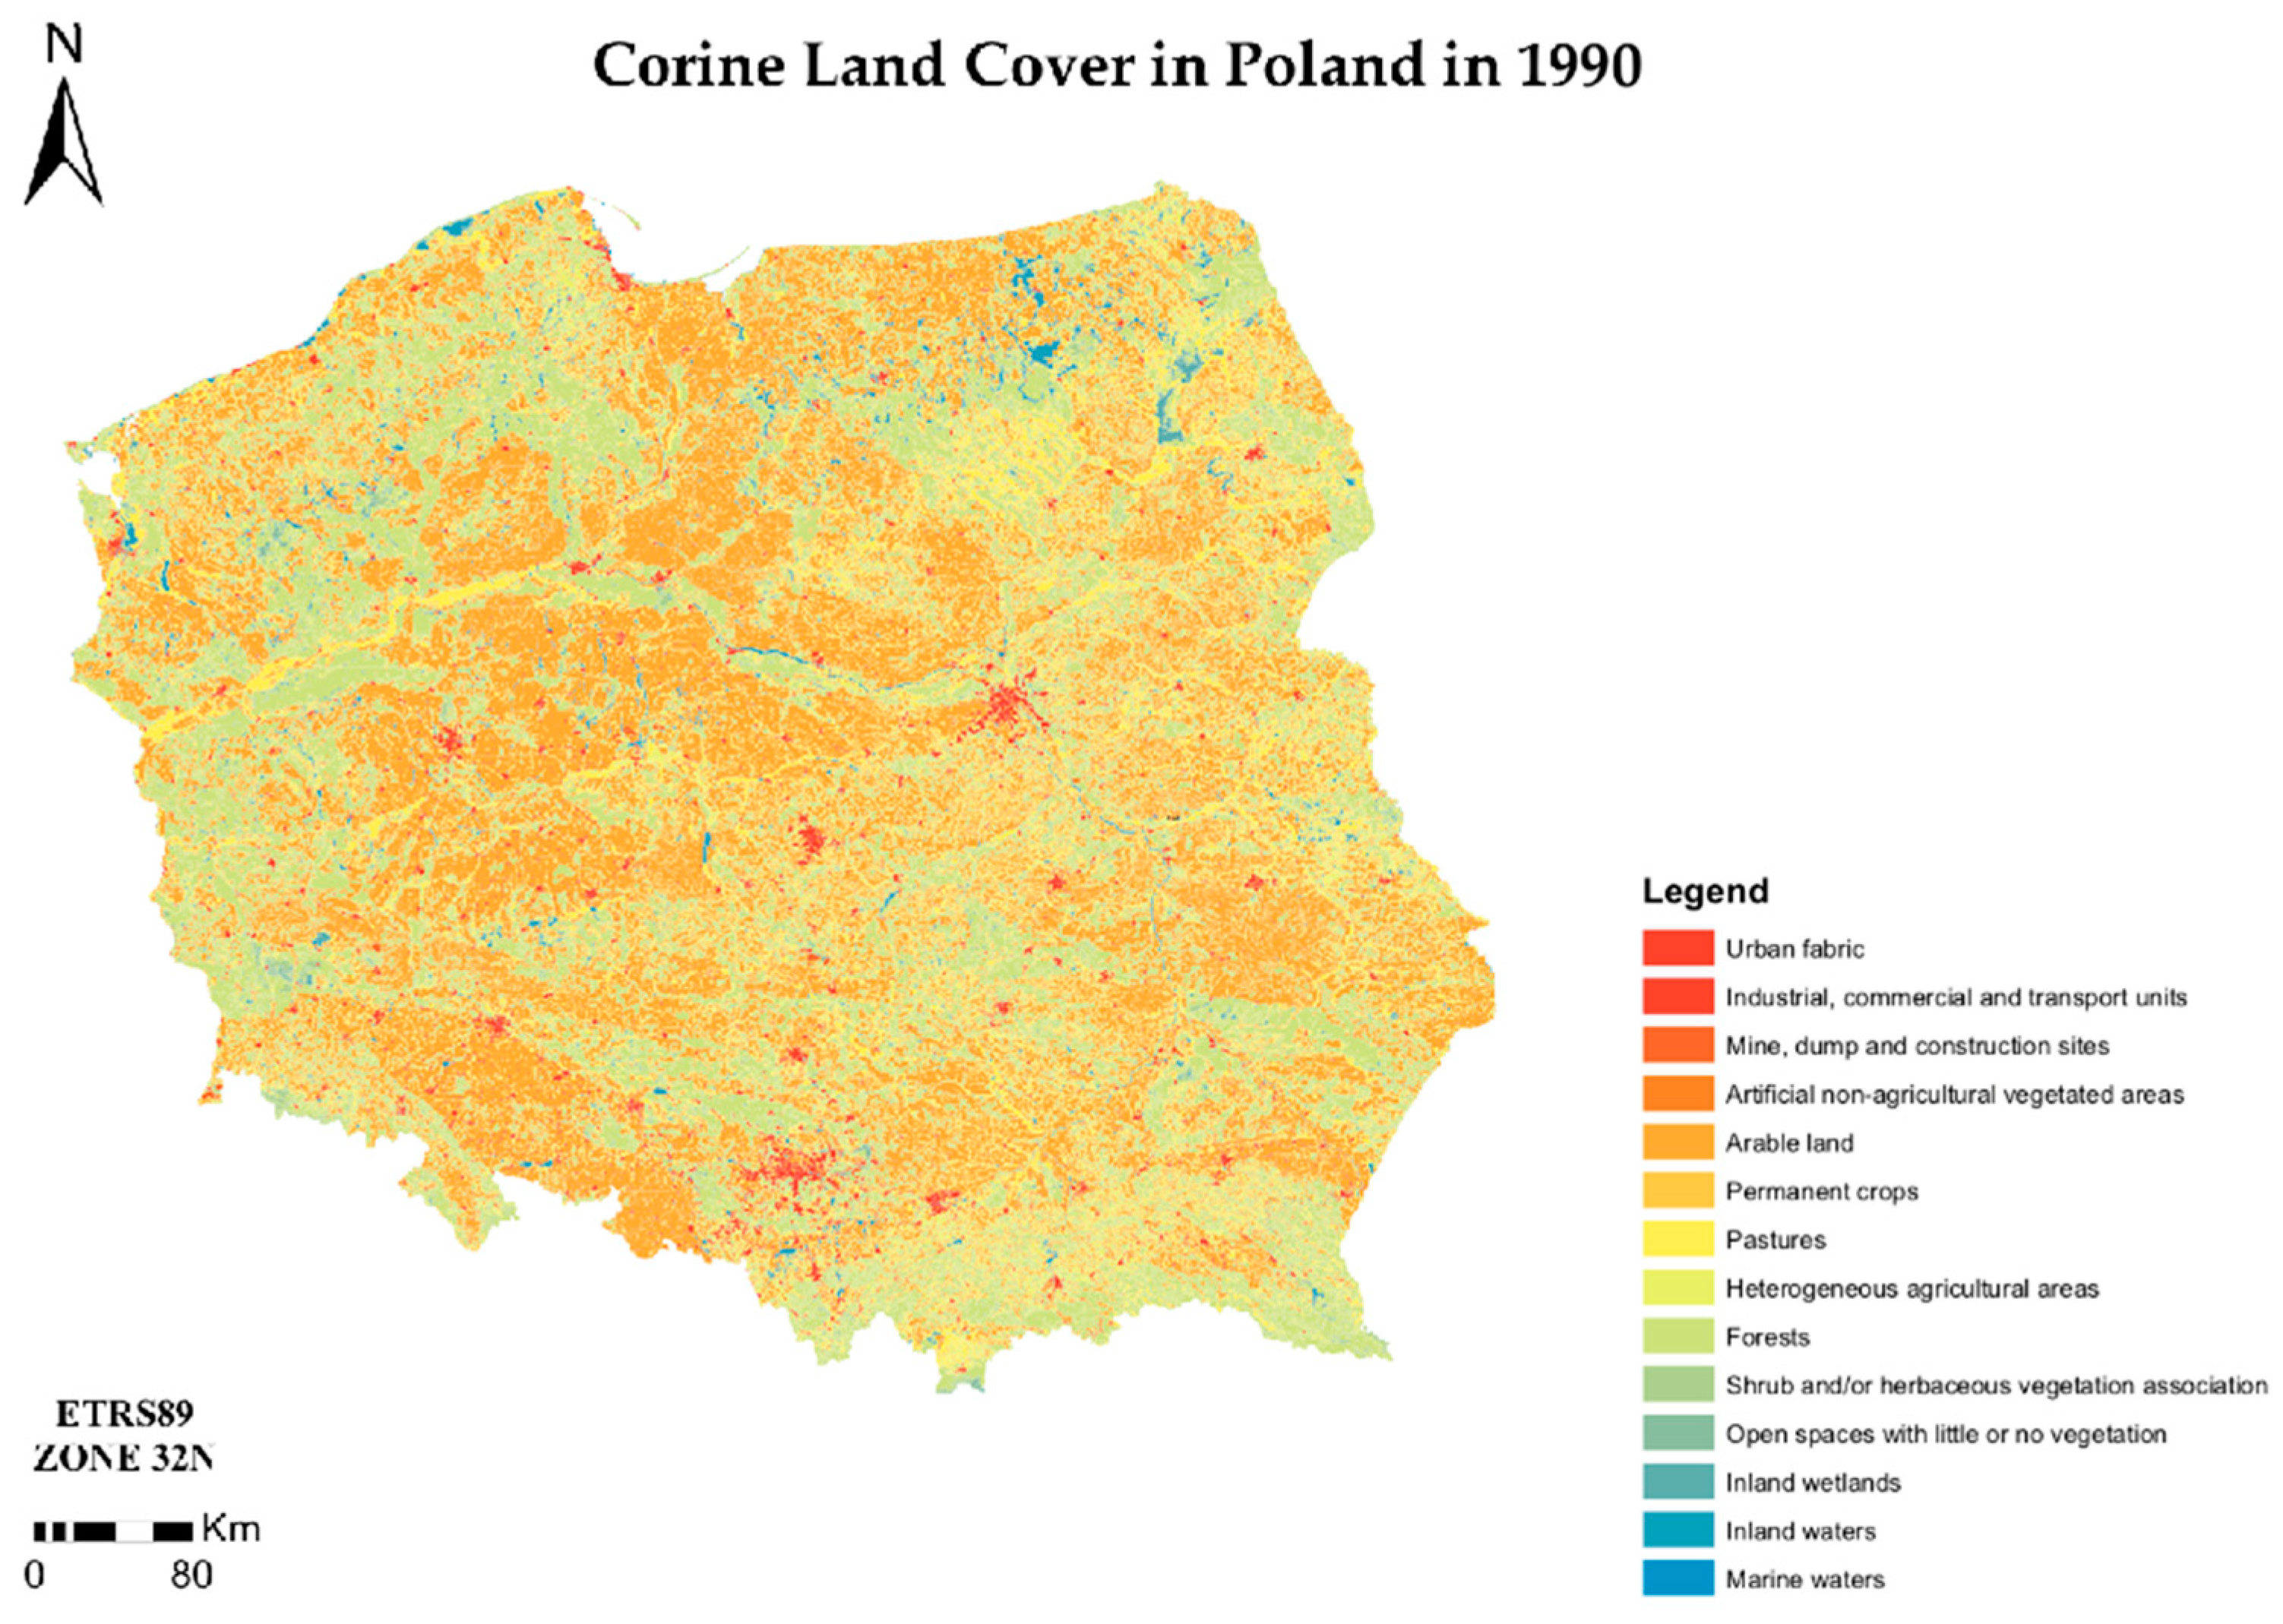
Through the analysis of
Figure 3, it is possible to easily identify the greatest predominance of agricultural areas with scarce urban agglomeration. Also, their associated artificial surfaces are well-defined, mostly in the centre and south of the country.
There are also several areas of forest and semi-natural areas, mainly in borderland or peripheral areas, which can be easily explained by the associated mountainous elements in those areas. These elements are used all over the globe as morphological or natural barriers establishing the borderline. Wetlands and water bodies are well defined, and they can be identified all over the territory with higher predominance towards the north of Polish territory.
Through the analysis of
Figure 4, and comparing it with
Figure 3, not much has changed at a first sight. Nevertheless, it is possible to observe the increase in the urban agglomerations and consequently in their associated artificial surfaces, and the development of new nuclei.
In fact, the agricultural areas were the most predominant all over Poland back in 2000. Nevertheless, a decreasing trend is visible—in comparison with 1990—once the artificial surfaces have occupied some agricultural areas.
Also, the forest and semi-natural areas have changed. They increased in comparison with 1990. On the other hand, the area of wetlands and water bodies was basically maintained to the values from 1990.
When analyzing
Figure 5 and comparing it with
Figure 3 and
Figure 4, it is possible to confirm the tendency, i.e., the increase in the urban agglomerations and their associated artificial surfaces, the development of new nuclei, the increase in forest and semi-natural areas.
Also, agricultural areas are the most predominant all over Poland, there is still a downward trend visible—in comparison with 1990 and 2000. Similarly, wetlands and water bodies maintained the same area in 1990 and 2000.
Therefore, each one of the CLC levels will be detailed and discussed.
The behavior of the artificial surfaces is visible in data presented in
Table 6. By far the highest values have been found on the land use 112 (discontinuous urban fabric), which has also increased over the years (where the tendency is located). The second most representative land use, considering artificial surfaces, is for the uses 121, 142, and 141 (industrial or commercial units; sport and leisure facilities, and green urban areas), which present high values within land uses.
Through the analysis of
Table 7, it is possible to verify the behavior of the agricultural areas; the highest values have been clearly found in one single land use, the 211—non-irrigated arable land—which decreased over the years. The second most representative land use, considering agricultural areas, is for the use 231 (pastures); followed by the land uses 242, and 243 (complex cultivation patterns; land principally occupied by agriculture, with significant areas of natural vegetation).
Table 8 shows the behavior of forest and semi-natural areas; with the highest values found in one land use, namely 312—coniferous forest—which has increased over the years. The second most representative land use, forest and semi-natural areas, is for the use 313 (mixed forest); followed by the land use 324 (transitional woodland-shrub).
Regarding wetlands (
Table 9), the highest values refer to the land use 411, namely inland marshes, which has shown a small decrease over the years. Furthermore, the water bodies surfaces are presented (
Table 10).
Finally, the land use regarding water bodies has increased over the last decades.
Furthermore, it is possible to verify that in most of the cases there is some kind of ‘stability’ in the land use. However, the land use 211 (agricultural areas—non-irrigated arable land) should be highlighted here, which has been significantly decreasing over the last decades, and consequently the land use 312 (coniferous forest) and 112 (discontinuous urban fabric) have increased. However, those decreases and increases are not so high in comparison with other territories e.g., the Iberian territories, most of the south European territories or even the neighboring countries such as Germany, Slovakia, or the Czech Republic [
8]. All the above areas have undergone much more changes in their land uses over the years. Thus, this graph is much more stable although some relevant changes have also occurred.
Changes over the last decades according to the level 1, 2, 3, 4, and 5 (artificial surfaces; agricultural areas; forests and semi-natural areas; wetlands, and water bodies) are presented in
Table 11. By far, the most representative level is the second one (agricultural areas), followed by forest and semi-natural areas (3), which has increased over the last years in Polish territory, following the same tendency is the land use 1 (artificial surfaces).
Advanced Statistical Analysis
The three clusters obtained allow grouping of the voivodeships into three classes i.e., 1,2,3. In this regard, the
Table 12 shows the grouped voivodeships which are results of the calculation procedure.
Likewise, once the voivodeships have been classified, they can be characterized based on descriptive statistics, as the arithmetic mean of the 19 original variables, as can been seen in
Table 13.
In this way, it can be identified that the most developed class from the socioeconomic perspective is class 1, followed by class 2 and finally class 3 (
Figure 6 and
Figure 7). Interestingly, from the most developed class 1, through the class 2 of medium development until reaching the less developed class 3 the number of voivodeships is increasing. Even class 1 is composed of only 1 voivodeship.
4. Discussion
From the results, it can be affirmed that in Mazowieckie, there is a great consensus of socio-economic development. Even if we look territorially at the position of each of the voivodeships (
Figure 1), it can be seen that this voivodeship is surrounded by others, which are in the most disadvantaged class (class 3). Therefore, Mazowieckie absorbs the socio-economic resources of the nearest voivodeships, through an effect of magnetism and the influx of people from less-developed voidopships to Mazowieckie.
Class 1 (
Table 12), is characterized as the most populated one since the population variable is superior to the other two classes. Also, this class is also the most densely populated, since it is only composed of only one voivodeship and in the other classes, there are more voivodeships with greater territorial extension. From the economic perspective (
Table 13), this class also stands out as being the one with the highest purchasing power, and where there are fewer economically dependent people in the same household her and the lowest number of unemployed people. These aspects cannot be omitted. As far as consumption is concerned, the population in this class stands out as the largest consumer of electricity and gas (
Table 13). Therefore, the population of class 1 seems to be very dependent on these two types of energy. Likewise, they are also the biggest consumers of water. Although, it is only slightly above the residents in the other two classes. From the educational point of view, it also stands out as the most educated population, as indicated by the variables associated with this thematic aspect (
Table 13). The variables were obtained by referring this population to educational coverage in the pre-school stage and taking into account the number of people between 25–64 years who are receiving training.
With regard to class 2, the values of the variables analyzed between classes 1 and 3 are presented in
Table 13. However, this is not always the case, as one might expect, since the training of people between 25–64 years old is the lowest of all classes. Therefore, it can be affirmed that in this class the population is acquiring less training, even less than the most disadvantaged class classified from the socioeconomic perspective. Also, the number of unemployed people in this class is less than in the other two. Also, from the consumer perspective, this class stands out due to consuming slightly less water than the other two classes. In general, taking into account the above variables, the people living in this class are people who devote greater effort to the performance of professional tasks, without taking into account that in the future they may be more disadvantaged due to receiving less training compared to the residents of the other two classes.
With regard to class 3 (
Table 13), which is the most disadvantaged from the socioeconomic perspective, it should be noted that although the values of the variable dependency ratio are approximately equal, it stands out as the superior value found in class 3. Similarly, it can also be stated that the population in this class is the one with the most social benefits per household. Therefore, the population in this class is characterized as being the most dependent and the most subsidized. From the educational point of view, it is noticeable that the variable associated with pre-school educational coverage is the lowest of all classes (
Table 13). However, the one associated with life-long learning of persons aged 25–64, is higher in class 3 than in class 2. This indicates that the population of class 3 is acquiring more training than class 2.
From the economic perspective, as could be expected, class 3 (
Table 13) is the most disadvantaged. Also, it should be pointed out that from the consumer’s point of view this class stands out as being the largest consumers of meat and vegetables. Therefore, this population, without having the same economic resources as the other two, can have access to a diet whose nutrition is of equal adequacy to the one which can be obtained by the population of the other two classes with more economic resources. Subsequently, the number of land uses obtained from Corine Land Cover for the years: 1990, 2000, and 2012 was analyzed, taking into account each of the socio-economic development classes.
Besides, according to the land uses, surface changes on Polish territory over the years in class 1 correspond to 11.258% of the national soil, there is a smaller variety of land uses. In this way, a more intensive and productive use of the soil is obtained. This trend is reversed as the classes are less socio-economically developed. Thus, it is shown that a greater variety of land use is associated with the less socioeconomic development of the territory. Taking into account that class 2 occupies 31.424% and class 3 occupies 57.319%, it can be determined that more than half of the land is allocated to activities that are not beneficial from the socioeconomic perspective. Moreover, only a little more than one-tenth of the soil attracts the most developed land use activities.
Regarding the variety of land uses, it can also be observed that from 1990 to 2012 in class 1 the number of uses is reduced, leading to a specialization of land uses. This effect also occurs in class 2, but not in class 3, where the number of land uses in 2012 is higher than in 2000. The three
Figure 3,
Figure 4 and
Figure 5 show us that the greatest amount of land use always corresponds to a non-irrigated arable land. Obviously, this land use is not productive. In fact, its quantity is greater than the degree of socio-economic development of the class considered is lower. Therefore, this soil to a large extent determines the socio-economic development of the territory in Poland.
Taking into account the lower values in
Figure 2,
Figure 3 and
Figure 4, it can be seen that in the analyzed years they always correspond to the land uses 111,122, 123, 124, 131, 132, 133, 141, 142, 222, 321, 322, 331, 332, 333, 334, 411, 412, 511, 521, and 523. Therefore, there is a great variety of land uses, but they are not significant for the socioeconomic development of the country. One could think about the possibility of transforming these land uses into others that would be more influential in the socioeconomic development of the country.
Also, it can be observed that there are no great variations in
Figure 6 and
Figure 7 with respect to the amount of a certain land use. However, interestingly, for all the classes analyzed, there is the same pattern of variation in land uses throughout the years under analysis. The
Figure 3,
Figure 4 and
Figure 5 show that there are slight variations in the use of 112 (discontinuous urban fabric) progressively increasing from 1990 to 2012 and showing the urban expansion that has occurred over these years. They also show the increase in the use of land over the years for uses 312 (coniferous forest) and 324 (transitional woodland shrub), showing a preservation of forests to the detriment of other areas, possibly non-irrigate arable land.
In this regard, there is a different trend showing a decrease in land use 211 (non-irrigated arable land), 242 (complex cultivation) and 243 (land principally occupied by agriculture, with significant areas of natural vegetation). Therefore, there is a tendency to increase agricultural land use.
In view of the above, it can be stated that the evolution of land uses in Poland has followed the same territorial pattern in terms of land use modification, independently of the socioeconomic development of each region. However, the increase or decrease in land uses that have varied can determine the socio-economic development of the different Polish territories.
The above case of Poland allowed us to observe the changes of many different factors and indicators, which could be analyzed in the process of territorial management. Obviously, the development is understood as the improvement in the efficiency of the territorial system functioning, increase in equal access to goods and services, and improvement in the quality of the natural environment of a specific place or territory [
25]. Therefore, the analysis of changes that take place in the territory is the first step to manage territorial development effectively. In the context of modern public management, the development in the territorial dimension forces the necessity of greater emphasis on using the development potential of the regions [
26]. Development initiatives should lead to desired changes in a given territory. First, however, it is necessary to identify the changes directions and trends to answer the important questions regarding the development priorities [
27]. There is no single recipe regarding effective territorial management. Before choosing a management model it is necessary to specify:
- (i)
What problems these areas can solve, using methods and instruments in the field of development management, and which require the creation of new administrative units to improve this management?
- (ii)
What competences and the resulting management tools should be at the disposal of the new power structure, if such arises?
It is very important for the public politics and strategies to foresee certain phenomena, changes that should be managed in the future. Identification of these processes is not possible without constant observation of changes that take place in a given territory.
The conditions for the development of territorial units are diverse and this should be the determinant of creating development activities. Development phenomena and processes are assigned to a specific territory regardless of whether their driving force is endogenous or exogenous. The specified territory bears the costs and it is the beneficiary of these phenomena and processes.
All public policies have, to a lesser or greater extent, an impact on the territory. In development policies, territory is an area that includes the involvement of administrative authorities that operate within the limits of their legal authority. This leads to a fragmentation of responsibility for development in territorial terms, which does not respect administrative boundaries. The external effects of development or emerging systems of functional connections affect and include various administrative units. In Poland, both the government administration and local government units of three levels (voivodeship, district, and commune) are responsible for territorial management. It is not simple to harmonize their actions and find a compromise in which direction the area should develop. Therefore, objective results of observing changes taking place in a given territory may provide arguments for the best solutions. Public politics and strategies have no power to define all conditions of territorial development, because some aspects depend on different other entities, such as enterprises and nongovernmental organizations [
28].
It should be emphasized that the internationalization of development processes affects the level of freedom regarding the location of various organizations and increases the possibilities of selecting the most favorable places for them to undertake activity. In such a situation, despite the possible diversion of their interests, the regions are integrated by a joint venture that benefits all its participants. And finally, the regions’ socio-economical position depends on many organizations and their activities.
The phenomenon of cooperation and competition of entities as well as regions has a significant impact on the development in territorial terms from the perspective of the possibility of managing this development [
29]. The concept of competitiveness is present in the strategies and plans for the development of cities, regions and territorial systems of various scales. It has become part of the paradigm of modern development and as such is the premise for formulating strategies and development plans.
Spatial diversities at the level of development, administrative divisions and the presence of the paradigm of competitiveness in the policies of authorities are issues of a different nature. Nevertheless, they are all equally important from the point of view of the territorial dimension of development. Introduction to the practice of managing the development of the territorial dimension becomes a challenge that requires an innovative approach to management, including innovation in the institutions responsible for programming and planning. Relations in the system, authority–competence–territory, need to be redefined, taking into account several factors including the multiplicity of entities involved in governance, the need to share power and competences, and the requirement of cooperation between different levels of administration and management [
30]. The transfer of newly defined relations into the practice of territorial development management depends on the quality of the decentralization of the country and related factors such as social capital, the level of trust and culture of cooperation between public authorities and with other private and social partners.
Territorial governance consists in formulating and implementing public policies, programs, and development projects that relate to a specific place or territory. These include policies related to spatial development of the area. Territorial governance manifests itself in integrating sectoral policies, coordinating the activities of various actors from many levels, improving multi-level governance, mobilizing and involving stakeholders, adapting policies to changing conditions of development, including in particular changes in the spatial context. The issue directly related to the effectiveness of territorial governance is the division of competences between various levels of authority, and in particular—the location of tasks in the field of spatial planning. The planning authority of the basic level administration units in many countries is the reason for conflicts and the lack of coordination of activities aimed at development. It is difficult and time-consuming to reach a consensus about development directions and methods of achieving development goals within the existing institutional structures. The number of actors and the diversity of objectives pursued by them, as well as the intensity of management require coordinating management actions in order to make the territorial system functional [
31]. In Poland the key the document regulating all these issues is ‘Concept of Spatial Development of the Country 2030’ [
32], which is an example of public policy, implemented in order to eliminate the effects of a disordered spatial management system in Poland.
5. Conclusions
Through the present study it is possible to understand the impact of the land use changes and their dynamics on the specific territory of Poland, especially when it comes to its impact on public management. Also, throughout the analyses of the land use change patterns, along with empirical knowledge of the territory, directions for a sustainable development have been described. It is possible to verify how Polish territory is gradually changing its land uses from agricultural to artificial surfaces. Moreover, the increase in forest and semi-natural areas takes place simultaneously—revealing an interesting tendency in the territorial conservation.
Local government policy, development strategies and preferences of the rapidly growing middle class are the factors which have the greatest influence on changes in land cover, including urban expansion. The quality of spatial planning, including spatial development plans and public transport development programs ensuring the availability of specific areas for residential or industrial development, generally depend on the local authorities. The direction of these changes in Poland are also given by government programs, e.g., ‘Housing for the Young’, which stimulate real estate development investments. On the other hand, consumer preferences regarding moving from the city to the country are also associated with ensuring the presence of forests and recreational areas in their environment. The financial aspect is also significant. By reclassifying arable land into land used for development and then selling it, local self-governments receive additional revenues. Therefore, spatial planning can be considered an important aspect of public management.
The results obtained were compared with the study findings prepared by Polish scientists [
33]. They confirmed the trends identified in the paper regarding changes in the forms of land use, especially in the field of residential development. In the central region (Mazowieckie voivodship and the Łódź voivodship), arable land and forests dominate in the overall land cover structure. Between 1990–2006, the highest increase was recorded, among others urbanized zones, which arose at the expense of mixed crops. In turn, new sets of woody and shrub vegetation, new industrial, commercial and communication zones appeared mainly on arable land. In the south-western region (Lower Silesian voivodship and Opolskie voivodship), the greatest number of crops, meadows and pastures disappeared, whereas the greatest number of urban buildings, forests and tree and shrub vegetation appeared. In the southern region (Silesian Voivodship and Lesser Poland Voivodship) the largest areas are occupied by arable land and forests.
Furthermore, there are mixed cultivation areas, meadows and pastures, i.e., rural areas and only then residential areas. This region is characterized by extremely dynamic spatial changes, which mainly concern housing development. It shrunk in favor of other forms of land cover including among others afforestation. The analysis prepared for the northern region (Pomorskie, Kuyavian-Pomeranian, and Warmian-Masurian voivodships) indicates that land cover is mainly arable land, forests, mixed crops, meadows and pastures. The share of urban development, industrial, commercial and communication areas is scarce. In turn, the north-west region (Zachodniopomorskie voivodship, Wielkopolskie voivodship, and Lubuskie voivodship) still has a high share in land cover index, mainly consisting of meadows, pastures, forests, and arable lands. However, the percentage share of the most urbanized area is systematically growing. Both the north and north-west regions are characterized by a twofold increase in urbanized areas.
Apart from that, it is possible to verify that the changes over land uses in Poland in the last two decades did not follow the tendency of the neighboring countries of Poland, such as Germany, Slovakia, and the Czech Republic, were the land use changes were not so smooth but much more radical. In fact, the results and tendencies obtained in Poland are much closer to countries like Slovenia, Malta, Cyprus, Hungary, Ireland, Bulgaria, Belgium, or France [
8,
34].
In fact, the land uses can be understood as the footprints of our strategies and policies carried out over a territory, where the past can be assessed, the present understood and the future envisioned [
34,
35]. In Polish conditions, it can be stated that spatial planning does not fulfill its role, especially when the local spatial development plans cover only 28 per cent of the country’s area, often including areas with limited investment opportunities. Firstly, planning regulations require areas of urban agglomerations, agricultural areas, and meadows. Taking into account the development indicators within the next 150–210 years, it is clear that land designated for development is of greater importance than the so-called demographic absorptiveness, i.e., the number of inhabitants who can settle down there. This means that space, capital, and the natural environment have been wasted. An exceptionally large area was built in Poland despite the threat of floods or landslides. There is also no land reserves for public supra-local investments, e.g., for transport purposes [
36,
37,
38,
39,
40,
41]. The described problems could be even partially solved thanks to the implementation of the ‘Concept of Spatial Development of the Country 2030′ [
32], which is an example of public policy, implemented in order to eliminate the effects of a disordered spatial management system in Poland.
Limitations and Future Research Directions
Although this research expands our understanding of the relationship between land use changes and socioeconomic impacts on territorial management worthwhile prospects of future research remain.
Besides, this typology of study could easily be transferred to other locations (countries). Nevertheless, the recommended strategies to achieve a most sustainable environment cannot be used in another case studies without a previous deeply analysis of the results cause a suit do not fit them all. In fact, every region/country has its own growth dynamics and patterns. Thus, it is possible to reply the study but not the same strategies; “different outcomes, different approaches”.
Furthermore, the authors believe that a possible update for the study is to include new variables—i.e., cultural, political-strategic, or the environmental—or to analyze the land uses on a border context.
Contextually, and considering the relevance of the issue, further studies/researches and close monitoring of the shifts over land uses are crucial to enrich this subject.


