Abstract
This study quantifies the energy, environmental, economic, and resource co-benefits and risks of greenhouse gas (GHG) emissions abatement for China’s passenger vehicle fleet. A bottom-up model is established, which can address energy, environmental, economic and resource impacts from the passenger vehicle fleet within one unified framework. The results indicate that for passenger vehicles, the target of GHG emissions abatement generally synergizes with the targets of petroleum security enhancement, urban air quality improvement, and transport cost reduction but conflicts with the targets of rare metal conservation and transport well-being improvement. When the co-benefits and risks are taken into consideration, the design of the GHG emissions abatement scheme becomes more complicated. It is critical to adopt an overall optimization approach so that major co-benefits and risks can be considered and assessed. Such an approach can help prepare more appropriate GHG emission abatement policies.
1. Introduction
The Paris Agreement targets to control the temperature increase at the global level to below 2 °C above pre-industrial levels [1]. Climate change mitigation has become the top agenda for the international community. Under such a circumstance, a wide range of policies designed for greenhouse gas (GHG) emissions abatement have been or will be implemented worldwide [2]. Although aiming at mitigating GHG emissions, these policies may induce new energy, environmental, economic and resource impacts, as Figure 1 illustrates.
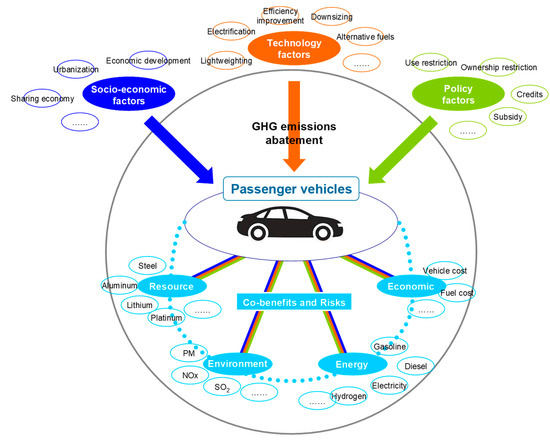
Figure 1.
The energy, environmental, economic and resource impacts induced by GHG emissions abatement.
For example, in the transport sector, the reduction of GHG emissions can be achieved by the optimization of the energy structure, which means that the dependence on oil will generally be alleviated. However, the dependence on electricity, hydrogen and other alternative fuels will increase. Most GHG emissions mitigation measures can bring the co-benefits of reducing tailpipe emissions, such as NOx, PM, CO, HC, etc. In particular, battery electric vehicles (BEVs) and fuel cell vehicles (FCVs) can achieve zero tailpipe emissions, which is essential for improving air quality in urban areas. Vehicle light-weighting is critical in terms of reducing transport GHG emissions because the fuel consumption rate is closely related to vehicle weight. Unfortunately, the deployment of light-weighting technologies can result in a significant demand increase for lightweight materials, such as aluminum, magnesium, and carbon fiber.
Electric vehicles (EVs) have been widely recognized as one opportunity for GHG emissions reduction in the transport sector. EVs rely heavily on the use of lithium-ion batteries, which increases the demand for rare metals such as lithium, cobalt, and nickel. Furthermore, the development of next generation FCVs might generate a great need of platinum, one essential element in the fuel cell catalyst. In addition, several measures designed for transport structure optimization may help reduce GHG emissions by facilitating residents to move from high-carbon transport modes to low-carbon transport modes. A typical example is the switch from private cars to public transit or even non-motorized transport modes. However, these actions may lead to loss of comfort, safety concerns, increased commuting time and the loss of other forms of transport well-being. In addition, the deployment of low-emission technologies may lead to higher vehicle manufacturing costs. Since these effects may synergize or conflict with other socio-economic goals, it is critical to estimate them so that more appropriate mitigation policies can be prepared.
Academically, previous studies have intensively examined the effectiveness of various GHG emissions abatement policies. Some studies extended the research scope by including few co-benefits and risks such as air quality improvement [3,4], human health [5,6], and resource depletion [7,8], etc. These studies investigated how different climate policies may lead to different co-benefits and risks. However, few studies examined the related energy, environmental, economic and resource impacts within one unified framework. To fill this gap, by using China’s passenger vehicle fleet as an example, this study aims to assess GHG emissions and associated energy, environmental, economic and resource impacts under multiple policy and technology development scenarios. We expect that this study can help answer how energy, environmental, economic and resource impacts interact with the mitigation of GHG emissions, how climate policies in the transport sector affect the achievement of other socio-economic goals, and how to identify feasible pathways for achieving multiple goals.
2. Methods and Data
2.1. Model Framework
This study was based on the transport energy system model developed by the China Automotive Energy Research Center (CAERC) of Tsinghua University. This model is a technology-rich, country-resolution bottom-up approach model, which is used to simulate the energy, environmental, economic and resource impacts from the global passenger vehicle fleet. The model was supported and calibrated by a series of previous peer-reviewed studies conducted by the authors [9,10,11,12,13,14]. Figure 2 presents this model’s framework.
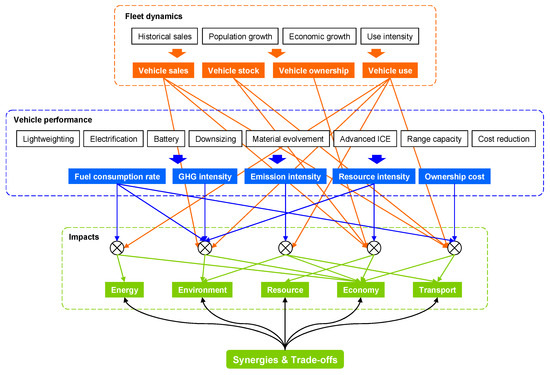
Figure 2.
The model framework.
This model consists of three major modules. The fleet dynamics module estimates vehicle sales, vehicle stock, vehicle ownership, and vehicle use by using the inputs of historical sales, population growth, economic growth, and use intensity. The vehicle performance module estimates the average fuel consumption rate, GHG emissions intensity, tailpipe emissions intensity, resource intensity and ownership cost by using a wide range of vehicle property inputs, including vehicle light-weighting, electrification, battery technology evolvement, vehicle downsizing, vehicle material evolvement, advanced internal combustion engines, range capacity, and manufacturing technology improvement, etc. The impacts module combines the outputs from the fleet dynamics module and the vehicle performance module to assess overall energy, environmental, economic and resource impacts.
Regarding the system boundary, passenger vehicles are defined as vehicles used for passenger transport with nine seats or fewer. The temporal boundary of this study is 2000–2100 to reflect past trajectory, as well as near-term, mid-term and long-term future projections. The spatial boundary only covers the China mainland due to data availability considerations.
2.2. Calculation Flows
The major calculation flows in the model are described by Equations (1)–(11):
where, is the fuel consumption of type r fuel in year i (MJ); is the GHG emissions from fuel use in year i (ton); is the amount of type r emission in year i (ton); is the demand for type r resource in year i (ton); is the residual value of type r resource in year i (ton); is the stock of type r resource in year i (ton); is the cost of fuel use in year i ($); is the cost of vehicle manufacturing in year i ($); is the cost of vehicle maintenance in year i ($); is the cost of vehicle residual value in year i ($); is the total cost in year i ($); is the fuel consumption rate of type r fuel of type p year-j-sold vehicles in year i (MJ/vehicle-km); is the life cycle GHG emissions intensity of type r fuel in year i (ton/MJ); is the emission intensity of type r emission of type p year-j-sold vehicles in year i (ton/vehicle-km); is the resource intensity of type r resource of type p year-j-sold vehicles (ton/vehicle); is the price of type r fuel in year i ($/MJ); is the manufacturing cost of type p year-j-sold vehicles ($/vehicle); is the maintenance cost of type p year-j-sold vehicles ($/vehicle-km); is the residual value of type p year-j-sold vehicles ($/vehicle); is the fleet utilization of type p year-j-sold vehicles in year i (vehicle-km); is the original fleet size of type p year-j-sold vehicles (vehicle); is the scrapped fleet of type p year-j-sold vehicles in year i (vehicle); is the remaining fleet of type p year-j-sold vehicles in year i (vehicle).
2.3. Data and Assumptions
The model database was established by compiling a wide range of data sources, including related statistical yearbooks [15,16], industry bulletins, and technical reports [17,18], etc. For the future projection, the major assumptions were determined by referring to authoritative reports [19], experts’ opinions, etc. The major data are presented in Figure 3, Figure 4, Figure 5, Figure 6 and Figure 7. GHG emissions generated in the manufacturing stage only accounted for a small part of the vehicle whole life cycle [20,21]. Thus, only costs from the manufacturing stage were included, not GHG emissions. The residual value used in this study was based on a 20% residual rate.
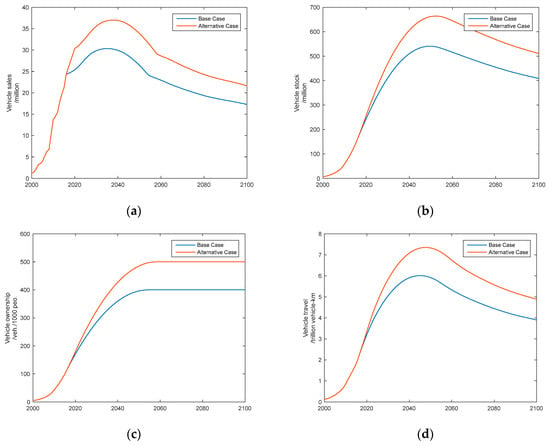
Figure 3.
Assumptions for vehicle sales and associated indicators. (a) Vehicle sales; (b) vehicle stock; (c) vehicle ownership; (d) vehicle use.
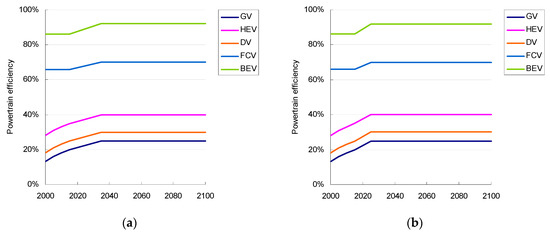
Figure 4.
Assumptions for energy-efficient technology deployment. (a) Base case; (b) alternative case.
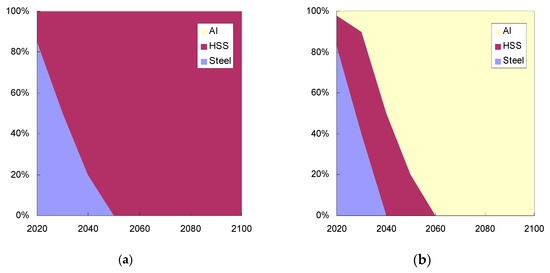
Figure 5.
Assumptions for light-weighting technology deployment (share of vehicle body material). (a) Base case; (b) alternative case.
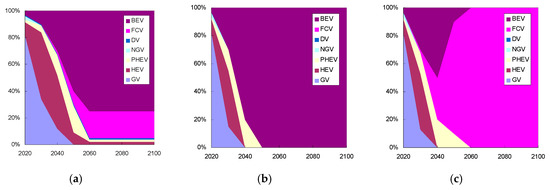
Figure 6.
Assumptions for advanced vehicle deployment. (a) Base case; (b) alternative case 1; (c) alternative case.
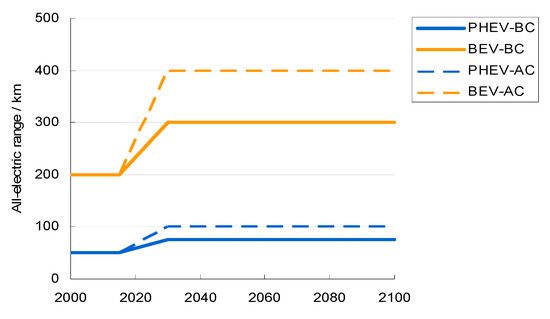
Figure 7.
Assumptions for electric vehicle (EV) all-electric range.
Scenario analysis was employed to assess different impacts under different policies and technology possibilities. A total of six scenarios were established, including a scenario one business-as-usual (SC1, BAU) scenario and five alternative scenarios. The BAU scenario reflected the case that policy implementation and technology improvement would continue their current trends. The five alternative scenarios reflected the cases that vehicle ownership would saturate at higher levels than under the BAU scenario (SC2, HVO), powertrain energy-saving technologies would be deployed more aggressively than under the BAU scenario (SC3, PEI), vehicle light-weighting technologies would be deployed more aggressively than under the BAU scenario (SC4, VLW), EVs would be deployed more aggressively than under the BAU scenario (SC5, EVP), and FCVs would be deployed more aggressively than under the BAU scenario (SC6, FCP), respectively. When the technical economy of FCVs surpasses EVs, FCVs may grab a bigger share of the market. The details of the scenario assumptions are described in Table 1.

Table 1.
The comparison of scenario assumptions.
3. Results
3.1. Future Trends
Figure 8 presents the model outputs; twenty-four representative energy, environmental, economic and resource indicators of China’s passenger vehicle fleet. For each sub-figure, multiple lines were plotted reflecting the trajectories under different scenarios, with the BAU scenario highlighted in bold green. The maximum differences among scenarios at the time points of 2050 and 2100 are highlighted with blue bars. For most indicators, a certain range of possibilities exist in future estimations. The trajectory shape, peak time, or even the basic trend could change under different scenarios.
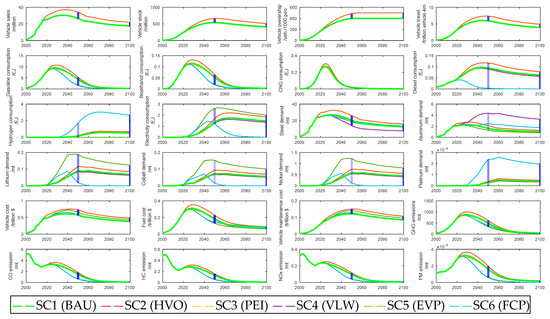
Figure 8.
The energy, environmental, economic and resource impacts from China’s passenger vehicle fleet 2000–2100.
Transport indicators: Vehicle sales, vehicle stocks, vehicle ownership levels and vehicle travel quantities were examined. There is still considerable potential for further vehicle sales growth. Under the assumptions of vehicle ownership saturation levels of 400 vehicles/1000 people and 500 vehicles/1000 people, the corresponding vehicle sales peak around 2035 at the levels of 30.4 million and 37.0 million, respectively. The corresponding vehicle stocks peak around 2050 at the levels of 540.7 million and 664.0 million, respectively. In the long term, due to the assumed decline in population, both vehicle sales and vehicle stocks are expected to decline gradually.
GHG emissions: GHG emissions are expected to continue to increase in the next decade, peak by approximately 2030 and decrease after that. Net zero GHG emissions can be expected in the long term. At the same time, significant differences were found among scenarios. Depending on different scenario assumptions, 2050 GHG emissions ranged from 336 mt CO2e (SC5, EVP) to 611 mt CO2e (SC2, HVO), implying a −23.8% to 38.5% change compared to the 2015 level (441 mt CO2e). Under the BAU scenario, the 2050 level (500 mt CO2e) was 13.3% higher than the 2015 level.
Energy indicators: Gasoline, bioethanol, Compressed Natural Gas (CNG), diesel, hydrogen, and electricity consumption were examined. Gasoline will continue to play the dominating role as passenger vehicle fuel in the coming decades. The peak consumption for gasoline will appear by approximately 2030. Under the BAU scenario, peak consumption is 93.6% higher than the 2015 level. At the same time, a significant shift from gasoline consumption to electricity and hydrogen consumption will take place. The relative importance of electricity and hydrogen as vehicle fuels will be determined by the on-going competition between EVs and FCVs. Under SC5 (EVP) and SC6 (FCP), in which EV and FCV market penetrations are assumed to be higher than the BAU scenario, the consumption of electricity and hydrogen will peak at the levels of 2.7 EJ and 3.0 EJ, respectively. The roles for bioethanol, CNG, and diesel as passenger vehicle fuels are expected to be quite limited.
Resource indicators: Steel, aluminum, lithium, cobalt, nickel, and platinum demand were examined. The basic trends for all resource demand were similar: Further growth in the near term, saturation by 2030–2050, followed by a gradual decline afterwards. Steel will continue to be the dominating supporting resource for vehicle manufacturing. Aluminum demand will experience a major surge under SC4 (VLW), in which aluminum-intensive vehicle light-weighting technology is assumed to be aggressively deployed. Lithium, cobalt, and nickel demand were largely determined by the degree of EV deployment. Platinum demand under SC6 (FCP) was substantially higher than the other scenarios, due to the assumed mass penetration of FCVs.
Economic indicators: Vehicle manufacturing costs, fuel costs, and maintenance costs were examined. Vehicle manufacturing costs were the major part of overall transport costs. The growth pattern of total vehicle manufacturing cost is quite similar to that of vehicle sales. Total vehicle manufacturing cost will continue to increase in the near term, peak around 2040, and decline slowly after that. The assumptions of higher vehicle ownership or aggressive advanced vehicle deployment increased total vehicle manufacturing cost significantly. Fuel cost growth generally followed the growth pattern of fuel consumption, which will increase significantly in the near term, peak around 2030, and decline significantly after that. Maintenance cost generally followed the total vehicle manufacturing cost growth pattern.
Tailpipe emission indicators: Tailpipe CO, HC, NOx, and PM emissions were examined. Historically, most tailpipe emissions dropped significantly due to the enforcement of vehicle tailpipe emission regulations. However, a notable increasing trend can be expected in the near term due to fast-increasing vehicle stocks and the relatively limited potential of emissions reduction from conventional vehicles. In the long term, ultra low tailpipe emissions can be expected owing to the mass deployment of EVs and FCVs.
3.2. Co-Benefits and Risks
To assess the co-benefits and risks induced by GHG emissions mitigation, the six scenarios were compared using the accumulation of all indicators, as shown in Figure 9. The 2000–2100 accumulation of all indicators were first calculated for each scenario, and then compared to the BAU scenario so that the relative percentage changes could be found.
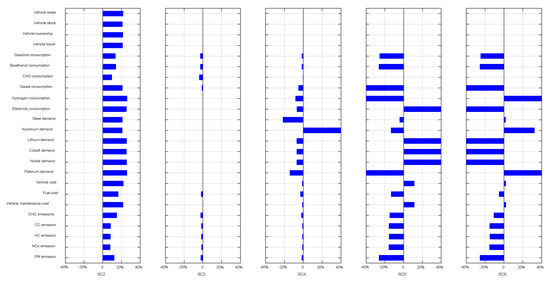
Figure 9.
Relative changes of indicators compared with the scenario one business-as-usual (SC1, BAU) scenario.
It was found that one measure may lead to both positive impacts and negative impacts on different indicator dimensions. Saturating vehicle ownership at higher levels, as demonstrated by SC2, increased all transport activity-related indicators, including vehicle sales, vehicle stock and vehicle travel. This implied the realization of higher transport well-being. The other side of the story is that not only GHG emissions but also the demand for energy and resources, the total costs, and tailpipe emissions all increased significantly. In this case, the trade-off between transport well-being and energy, resource and environmental impacts should be fully considered.
In SC3, more aggressive deployment of powertrain energy-saving technologies brought the benefits of lower GHG emissions, as well as lower energy demand and tailpipe emissions. The undesired result was the increase in total vehicle manufacturing cost (although not significant), because the deployment of powertrain energy-saving technologies typically increased the powertrain cost. In SC4, with more aggressive deployment of vehicle light-weighting technologies, the demand for aluminum increased substantially due to the assumed substitution of steel for aluminum in vehicle bodies. GHG emissions, energy consumption and tailpipe emissions decreased considerably due to the reduction of the fuel consumption rate induced by vehicle light-weighting. Vehicle light-weighting also brought the benefit of lower rare metal demand because of the reduction in battery capacity and fuel cell engine power required.
SC5, representing the impact of more aggressive deployment of EVs, exhibited the most complicated trade-offs among the indicators. From the energy perspective, EV deployment reduced gasoline consumption (and thus petroleum consumption) substantially, however, it increased electricity consumption substantially at the same time. This also implied a significant decline in total fuel cost. From the resource perspective, EV deployment drove enormous demand for rare metals of lithium, cobalt and nickel. This also implied a significant increase in total vehicle manufacturing cost. From the environmental perspective, total GHG emissions and tailpipe emissions were effectively mitigated. If all the impacts were put under the GHG emissions mitigation framework, reductions in gasoline demand, fuel cost and tailpipe emissions would be co-benefits of GHG emissions mitigation; in contrast, increases in vehicle manufacturing cost, electricity demand and rare metal demand were the risks of GHG emissions mitigation. The situation under SC6 was relatively similar to that of SC5. The major trade-off was that FCV deployment created huge demand for platinum, which is a potential resource bottleneck for China.
4. Discussions
As demonstrated by this study and many relevant studies, it is clear that there is great potential for GHG emissions mitigation in the transport sector. However, such potential will not be achieved without appropriate policy support. Each measure designed for GHG emissions mitigation could bring numerous energy, environmental, economic and resource impacts, either in promoting or preventing the realization of other socio-economic targets. When considering these constraints, the design of the GHG emissions abatement scheme becomes more complicated. Specifically, for the transport sector, the target of GHG emissions mitigation should combine with other targets, such as petroleum security enhancement, urban air quality improvement, transport cost reduction, and avoiding conflicts with the targets of rare metal conservation, and transport well-being improvement.
According to the impact pattern, the mitigation measures can be divided into three categories. First, there are behavior-changing measures. These measures target to reduce GHG emissions through changing human behaviors such as discouraging people from owning and using vehicles, and having people switch from buying big cars to smaller ones. These measures can reduce energy, environmental, economic and resource impacts since the overall requirements for transport quantity and quality will decrease. However, these benefits can only be achieved at the expense of sacrificing transport well-being. Secondly, there is the deployment of new technologies. These measures reduce GHG emissions through introducing more innovative technologies into the market, such as promoting market penetration of high-efficiency vehicles and EVs. These measures typically improve energy and environmental performance at the expense of higher transport costs and resource demand. Thirdly, there is technology innovation. Technology innovation refers not only to the improvement of existing technologies but also to the invention of new technologies. For example, lithium-ion batteries, as the essential component determining the performance and cost of EVs, have experienced significant technology innovations over the past decade, resulting in reduced battery weight and cost, while at the same time increasing battery life. However, technology innovation will not easily occur and will require significant policy reform and financial support.
Under such a circumstance, a systemic view that can address many concerns together should be adopted. The combination of different measures should ensure the realization of anticipated GHG emissions mitigation, and at the same time reduce other energy, environmental, economic and resource impacts. To realize such a paradigm, it is necessary to adopt an overall optimization approach. In this regard, a cost-benefit analysis should be conducted so that co-benefits can be achieved within the lowest overall social cost. Meanwhile, the automotive industry is highly related to many other fields, such as raw material production, and the electric-power industry, etc. All these factors can impact the emissions, energy and resource consumption of vehicles. It is necessary to discuss the significance of potential interaction between different impact categories. Such studies should be conducted in future research.
Author Contributions
H.H., F.L. and X.S. designed the whole study, conducted data collection, modeling, results analysis and wrote the original draft paper; Z.L. and F.Z. revised and edited the paper.
Funding
This study is sponsored by the National Natural Science Foundation of China (71774100, 71690241, 71403142, 71810107001), and the Young Elite Scientists Sponsorship Program by CAST (YESS20160140).
Conflicts of Interest
The authors declare no conflicts of interest.
References
- Rogelj, J.; den Elzen, M.; Höhne, N.; Fransen, T.; Fekete, H.; Winkler, H.; Schaeffer, R.; Sha, F.; Riahi, K.; Meinshausen, M. Paris Agreement climate proposals need a boost to keep warming well below 2 °C. Nature 2016, 534, 631–639. [Google Scholar] [CrossRef] [PubMed]
- IPCC. Climate Change 2014: Mitigation of Climate Change; Intergovernmental Panel on Climate Change: Geneva, Switzerland; Cambridge University Press: Cambridge, UK, 2014. [Google Scholar]
- Dong, H.; Dai, H.; Dong, L.; Fujita, T.; Geng, Y.; Klimont, Z.; Inoue, T.; Bunya, S.; Fujii, M.; Masui, T. Pursuing air pollutant co-benefits of CO2 mitigation in China: A provincial leveled analysis. Appl. Energy 2015, 144, 165–174. [Google Scholar] [CrossRef]
- Thompson, T.M.; Rausch, S.; Saari, R.K.; Selin, N.E. A systems approach to evaluating the air quality co-benefits of US carbon policies. Nat. Clim. Chang. 2014, 4, 917–923. [Google Scholar] [CrossRef]
- West, J.J.; Smith, S.J.; Silva, R.A.; Naik, V.; Zhang, Y.; Adelman, Z.; Fry, M.M.; Anenberg, S.; Horowitz, L.W.; Lamarque, J.-F. Co-benefits of mitigating global greenhouse gas emissions for future air quality and human health. Nat. Clim. Chang. 2013, 3, 885–889. [Google Scholar] [CrossRef] [PubMed]
- Xie, Y.; Dai, H.; Dong, H.; Hanaoka, T.; Masui, T. Economic Impacts from PM2.5 Pollution-Related Health Effects in China: A Provincial-Level Analysis. Environ. Sci. Technol. 2016, 50, 4836–4843. [Google Scholar] [CrossRef] [PubMed]
- Habib, K.; Wenzel, H. Exploring rare earths supply constraints for the emerging clean energy technologies and the role of recycling. J. Clean. Prod. 2014, 84, 348–359. [Google Scholar] [CrossRef]
- Simon, B.; Ziemann, S.; Weil, M. Potential metal requirement of active materials in lithium-ion battery cells of electric vehicles and its impact on reserves: Focus on Europe. Resour. Conserv. Recycl. 2015, 104(Part A), 300–310. [Google Scholar] [CrossRef]
- Hao, H.; Geng, Y.; Li, W.; Guo, B. Energy consumption and GHG emissions from China’s freight transport sector: Scenarios through 2050. Energy Policy 2015, 85, 94–101. [Google Scholar] [CrossRef]
- Hao, H.; Geng, Y.; Sarkis, J. Carbon footprint of global passenger cars: Scenarios through 2050. Energy 2016, 101, 121–131. [Google Scholar] [CrossRef]
- Hao, H.; Geng, Y.; Wang, H.; Ouyang, M. Regional disparity of urban passenger transport associated GHG (greenhouse gas) emissions in China: A review. Energy 2014, 68, 783–793. [Google Scholar] [CrossRef]
- Hao, H.; Liu, Z.; Zhao, F.; Li, W.; Hang, W. Scenario analysis of energy consumption and greenhouse gas emissions from China’s passenger vehicles. Energy 2015, 91, 151–159. [Google Scholar] [CrossRef]
- Hao, H.; Wang, H.; Ouyang, M. Fuel conservation and GHG (Greenhouse gas) emissions mitigation scenarios for China’s passenger vehicle fleet. Energy 2011, 36, 6520–6528. [Google Scholar] [CrossRef]
- Hao, H.; Wang, H.; Ouyang, M. Fuel consumption and life cycle GHG emissions by China’s on-road trucks: Future trends through 2050 and evaluation of mitigation measures. Energy Policy 2012, 43, 244–251. [Google Scholar] [CrossRef]
- CAAM. China Automotive Industry Yearbook 2016; China Association of Automobile Manufacturers: Beijing, China, 2017. [Google Scholar]
- NBS. China Statistical Yearbook 2016; National Bureau of Statistics: Beijing, China, 2017.
- iCET. China Passenger Vehicle Fuel Consumption Development Annual Report 2016; Innovation Center for Energy and Transportation: Beijing, China, 2017. [Google Scholar]
- MIIT. Database for Automobile Fuel Consumption of China; Ministry of Industry and Information Technology: Beijing, China, 2017.
- SAE-China. Technology Roadmap for Energy-Saving and New Energy Vehicles; Chinese Society of Automotive Engineers: Beijing, China, 2016. [Google Scholar]
- Hao, H.; Cheng, X.; Liu, Z.; Zhao, F. Electric vehicles for greenhouse gas reduction in China: A cost-effectiveness analysis. Transp. Res. Part D Transp. Environ. 2017, 56, 68–84. [Google Scholar] [CrossRef]
- Hao, H.; Qiao, Q.; Liu, Z.; Zhao, F.; Chen, Y. Comparing the life cycle greenhouse gas emissions from vehicle production in China and the USA: Implications for targeting the reduction opportunities. Clean Technol. Environ. Policy 2017, 19, 1509–1522. [Google Scholar] [CrossRef]
© 2019 by the authors. Licensee MDPI, Basel, Switzerland. This article is an open access article distributed under the terms and conditions of the Creative Commons Attribution (CC BY) license (http://creativecommons.org/licenses/by/4.0/).