Article

Temporal and Spatial Characteristics and Early Warning Analysis of Economic Polarization Evolution: A Case Study of Jiangsu Province in China

1
School of Geography, Geomatics & Planning, Jiangsu Normal University, Xuzhou 221116, China
2
Center for Urbanization Studies, Jiangsu Normal University, Xuzhou 221116, China
*
Author to whom correspondence should be addressed.
Sustainability 2019, 11(5), 1339; https://doi.org/10.3390/su11051339
Submission received: 5 January 2019 / Revised: 26 February 2019 / Accepted: 28 February 2019 / Published: 4 March 2019
(This article belongs to the Special Issue Economic Geography and Sustainable Urban Sprawl)

Abstract

:
Economic polarization is a special manifestation of economic disparity which intensifies the gap between the rich and the poor in a region and brings about a series of social problems. Though more and more scholars are studying the phenomenon of economic polarization, there are few studies on polarization level division and early warning analysis in the existing literature. The main purpose of this paper is to propose a standard for rationally dividing the level of economic polarization. This paper firstly analyzes the current situation of economic polarization by using the economic data of 54 counties and cities in Jiangsu Province from 2000 to 2016 and secondly predicts the economic polarization level of Jiangsu Province from 2017 to 2015 through the grey model. We find that, according to the classification criteria of polarization levels, the phenomenon of economic polarization in Jiangsu Province is both not as serious as expected and at a moderate level of alertness. The results of this study can provide important reference value for the coordinated development of Jiangsu Province.

1. Introduction

In the process of regional development, a difference in regional economic development is an extremely common phenomenon. Whether in developed or developing countries, there will always be unbalanced development of regional economies and different degrees of difference for many reasons such as the influence of natural and historical factors, institutional factors, and cultural factors. From the perspective of world economic organizations, there are obvious differences between countries, such as the countries in the European Community. Additionally, there are differences between developed and underdeveloped regions in a country, such as the southern and northern parts of the United States, the eastern and western parts of Germany, the southeastern and northern parts of the United Kingdom, and the eastern and western parts of China; regarding a region within a country, there will also be serious regional development imbalances. Therefore, regional economic development differences are a universal and international matter.
Economic polarization as a special manifestation of economic differences has always been a hot issue in several related fields. Beginning in the 1990s with the continuous exploration of the connotations of economic polarization [1,2], the exploration of relevant theories has been enriched and has mainly focused on the direction and quantity of polarization development. The first one is the “single polarization theory”; that is, things change in a single direction, turn to the high end, or turn to the low end. Representative theories include the growth pole theory, gradient transfer theory, regional development inverted “U” shape hypothesis, unbalanced growth theory, circle structure theory, point axis development theory, and central radiation theory, but, because economic development is in a dynamic non-equilibrium, the application scope of single polarization theory is limited. The second is the “multipolarization theory,” such as the cyclical cumulative causal theory, central–peripheral theory, cluster economic theory, and network development theory. These theories argue that economic polarization is not only moving in a single direction but that multiple things may be occurring simultaneously, such as development towards the high-end and the low-end, thus forming distinct bipolar and multipolar phenomena. Therefore, the method of the quantitative analysis of the regional economic polarization level has gradually become a research focus.
In 1994, Esteban and Rey proposed the famous “Esteban–Ray Index” from the basic concept of polarization [3]. In the same year, Wolfson M. C proposed the “Wolfson Index” to measure the polarization of income and wealth distribution based on the Lorenz curve [4]. In 1998, Wang Y Q and Tsui K Y, based on the polarization measurement method proposed by Wolfson M. C, used a two-order axiom to derive a new class of polarization index, the “Tsui–Wang Index” [5]. In 1999, Zhang X and Kanbur R used the decomposable property of generalized entropy to propose the “K–Z Index” [6]. In 2002, Rodriguez and Salas proposed an extended Wolfson bi-polarization measure [7]. Based on these theories and methods, many scholars have begun to empirically analyze the economic polarization of different countries and regions.
First of all, regional economic polarization process and trends have become the preferred direction of research. The range of areas studied varies in size from study to study, with relevant research from large organizations such as world organizations [8], countries [9,10], and regions [11], to small groups such as urban agglomerations [12,13], economic regions [14,15], provinces, and cities [16,17]. Due to the different social perspectives observed by scholars, the evaluation indicators used are also different, mainly focusing on economic indicators and social indicators, among which economic indicators mainly include GDP per capita [18,19], fiscal revenue [20], per capita, industrial output value [21], and industrial development [9]. Regarding social indicators, scholars have focused on studying many aspects; for instance, the polarization phenomenon in the salary level of some industries [22,23], employment rate [24], and wage income level [10,25].
Secondly, because the disciplines have different understandings of economic polarization, economists are more concerned with the phenomenon of economic polarization and the discussion of research methods. Due to the spatial location characteristics of geography, the spatial pattern of regional economic polarization from a geographical perspective is unique. Some scholars have made an analysis of the spatial structure of regional economic polarization from the relevant theories of core-edge and growth poles [26,27], but such qualitative analyses do not have corresponding data support and verification, so more and more scholars have begun to try to perform spatial polarization analysis from a quantitative perspective. Besides that, model methods such as spatial autocorrelation [28,29], the urban energy level model [30], gravity model [31], and social geography [32] are increasingly used in the evolution of economic polarization spatial structures.
Finally, due to the rapid expansion of the level of economic polarization, the gap between the rich and the poor has widened, leading to a series of intricate social problems such as class confrontation, racial discrimination, and political struggles. Therefore, more and more scholars have begun to explore the mechanism of the cause of the two-level regional economic differentiation. Specifically, the main causes of regional economic polarization are as follows: The globalized economy and specialized information flow [33]; openness and urban scale [34]; industrial transfer [35,36]; regional spatial reconstruction [37]; transformation of urban functional structure, foreign direct investment, technology introduction, and foreign population [38]; regional development strategy, rural industrialization, and foreign direct investment [16]; traffic conditions, political and economic status, local financial resources, industrial agglomeration [39]; and factors such as the economic base and industrial structure transformation ability [40].
Based on the existing literature, we find that the research on the theory and methods of economic polarization is outstanding, and scholars quantitatively describe the polarization of regional economies from different social perspectives, as well as the genetic mechanism behind this and the deeper society. Political influence can be explored in many ways.
The study of regional economic polarization has caused the social problems that this economic phenomenon may bring to be more visible, and so some scholars have tried to conduct predictive analyses of polarization [41,42]. However, there is no unified standard for the level of economic polarization, and it is impossible to clearly distinguish the extremes and dangers of polarization; this has led to the government’s inability to intervene in a timely manner during the operation of the market economy. Thus, the early warning and control of economic polarization is very important. This study proposes a standard for rationally dividing the level of economic polarization and judges the alert level of Jiangsu’s regional economic polarization, using the grey model to predict the warning level of future economic polarization and development trends in the region.
The outline of this work is as follows: The next section focuses on research areas and methods. The third and fourth sections, respectively, discuss the temporal and spatial characteristics and early warning analysis of the polarization of economic polarization in Jiangsu Province. Finally, conclusions are presented in the last section.

2. Study Area and Research Methods
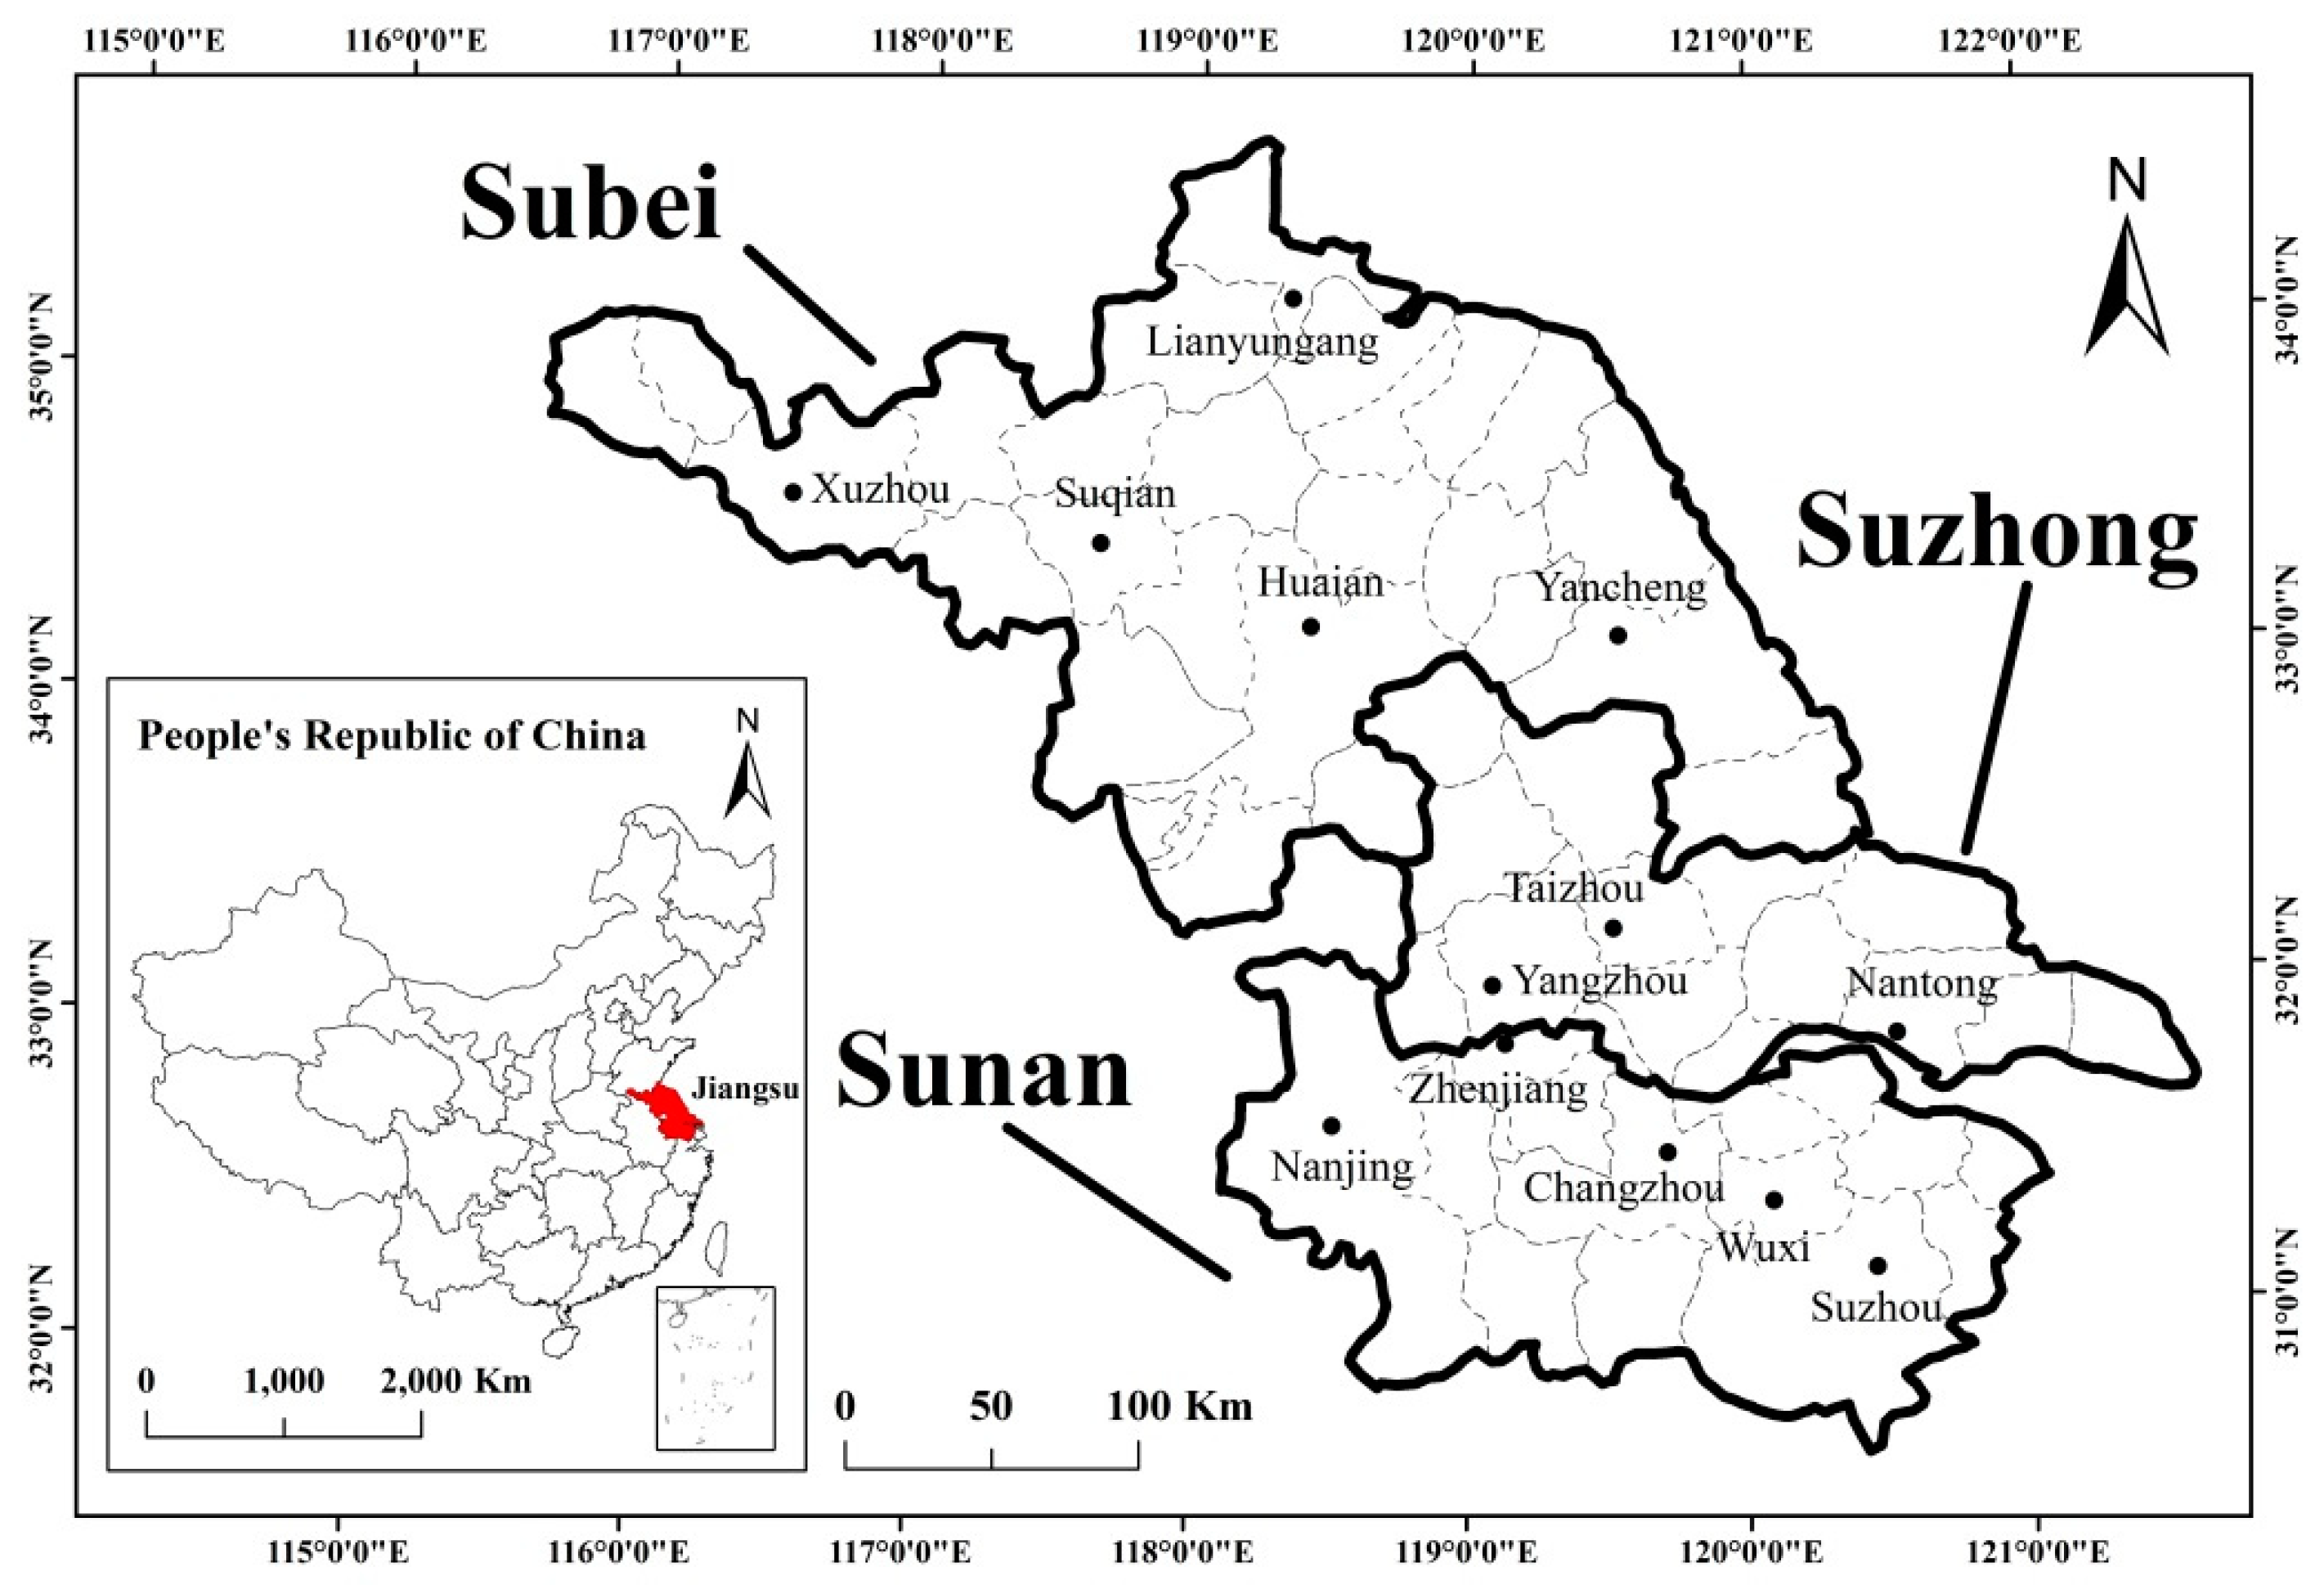
2.1. Study Area

According to the differences in natural characteristics and the economic development level, Jiangsu Province is divided into three sub-regions: The southern area (Sunan) includes Nanjing (provincial capital), Zhenjiang, Changzhou, Wuxi, and Suzhou; the middle area (Suzhong) includes Nantong, Taizhou, and Yangzhou; and the northern area (Subei) includes Xuzhou, Lianyungang, Suqian, Huai’an, and Yancheng [43] (Figure 1). There is a large regional disparity among the sub-regions, in which Sunan has traditionally been the most developed, followed by Suzhong and Subei.
Jiangsu Province is the ideal location to study economic polarization in provincial China for the following reasons. Since the reform and opening-up, Jiangsu has been one of the fastest growing and most dynamic provinces in China [44]. Its annual growth rate of major indicators for the national economy is faster than the national average. At the same time, however, the differences in Sunan, Suzhong, and Subei in Jiangsu Province are expanding, and the economic polarization is becoming more and more significant. The gradient between the northern and southern parts of Jiangsu Province is expanding. The regional gap, the gap between the rich and the poor, and the gap between urban and rural areas are widening, and there are certain hidden dangers in the stable development of the social economy [45]. The per capita GDP ratio in Sunan, Suzhong, and Subei in 2016 is 2.23:1.55:1, the industrial-to-industrial ratio is 2.71:0.92:1, the total ratio of retail sales of social consumer goods is 2.36:0.73:1, the total ratio of imports and exports reaches 15.89:1.87:1, and the balance of deposits of financial institutions is 4.36:1.17:1. The continuous expansion of regional economic development and the increasing polarization of the economy have become an important factors in restricting the further development of the province’s economy and society in Jiangsu Province; this restriction is not conducive to the stability, health, and coordinated development of the province’s economy and society, and it poses a major threat to Jiangsu’s leading economic position in the country. The region’s leading economic status poses a major threat. Considering this background, the study into the status quo and evolution of regional economic polarization in Jiangsu Province is worthy of discussion.

2.2. Methodology

2.2.1. Measurement Method of Economic Polarization

This paper combines the three most classic methods: The Esteban–Ray index (ER index), the Tsui–Wang index (TW index), and the P index proposed by Wolfson. Among them, the ER index is a polarization index constructed from the perspective of the appearance (disappearance) of any group of random groups such as a group of people and income groups. (that is, “the middle class disappears”); the TW index and the P index are mainly attempts to divide a random group of people (e.g., income groups) into two groups, specifically by the median. Although the calculation principles followed by the three polarization indices are different, in order to avoid the measurement error and applicability of the single research method, the study measures the economic polarization in three ways for verification. The formula is as follows:
ER = A i = 1 N j = 1 N p i 1 + a p j | y i y j |
where N is the number of counties and cities in Jiangsu Province, p i is the population weight of county i, y i is the per capita GDP of county i, A is the standardization coefficient, and α is the sensitivity coefficient, α ∈ (0,1.6). This paper takes α = 1.5.
TW = θ K i = 1 N π i | y i m m | r
where K is the total population of the province, π i is the population of county i, m is the intermediate value of Jiangsu’s per capita GDP, and θ is a positive constant scalar, r ∈ (0,1). This paper takes θ = 0.5 and r = 0.5.
P = ( T G ) μ m ,   Where   T = ( μ U μ l ) μ
where T is the median-related deviation, G and μ are the Gini index and average of Jiangsu’s per capita GDP, m is the median of Jiangsu’s per capita GDP, μ U is the average of the per capita GDP higher than the median, and μ l is the average of the per capita GDP below the median.

2.2.2. Measurement Method of the Economic Polarization Spatial Structure

The Kanbur-Zhang index (KZ index) is a polarization measure method that decomposes regional differences into regional differences and interval differences and uses the ratio of these two differences as the polarization level. Combined with our previous research results [16], it is believed that the regional economic imbalance in Jiangsu Province is mainly reflected in the imbalance between urban and rural areas and between the three regions of Sunan, Suzhong, and Subei. Therefore, this paper uses the KZ indices of Sunan, Suzhong, and Su to analyze the changes of Jiangsu’s economic polarization pattern in the northern and urban areas (urban and rural areas). The formula is as follows:
K Z = B T W T = r f ( y r ) log ( Y ¯ Y r ¯ ) r f ( y r ) T r
where BT is the difference between regions, WT is the difference within the region, r is the number of divided areas, Y ¯ is the per capita GDP of Jiangsu Province, Y r ¯ is the per capita GDP of the r region, f ( y r ) is the proportion of the population of region r to the national population, and T r is the Theil index of region r.
The KZ index divides the regional economic polarization of Jiangsu Province into three major regions and urban and rural areas, but there is no intuitive image that reflects economic polarization in the space from the county level. Therefore, considering the spatial interaction between counties and cities, the spatial polarization index model is constructed. The spatial polarization index refers to the spatial polarization of economic polarization in a certain geographical area; the more obvious the phenomenon of economic polarization, the greater it is [14]. Its formula is as follows:
P i = 100 j = 1 N R i j / i = 1 N j = 1 N R i j
where Pi is the economic location of city i and Rij is the economic connection between city i and city j.
In addition, in order to make the geographic areas of different sizes and populations comparable, the per capita GDP indicators of each county and city are used to measure the variable indicators of regional economic polarization. All data are sourced from the 2001–2017 Jiangsu Statistical Yearbook compiled by the Jiangsu Provincial Bureau of Statistics.

3. Temporal and Spatial Characteristics of Economic Polarization Evolution in Jiangsu Province

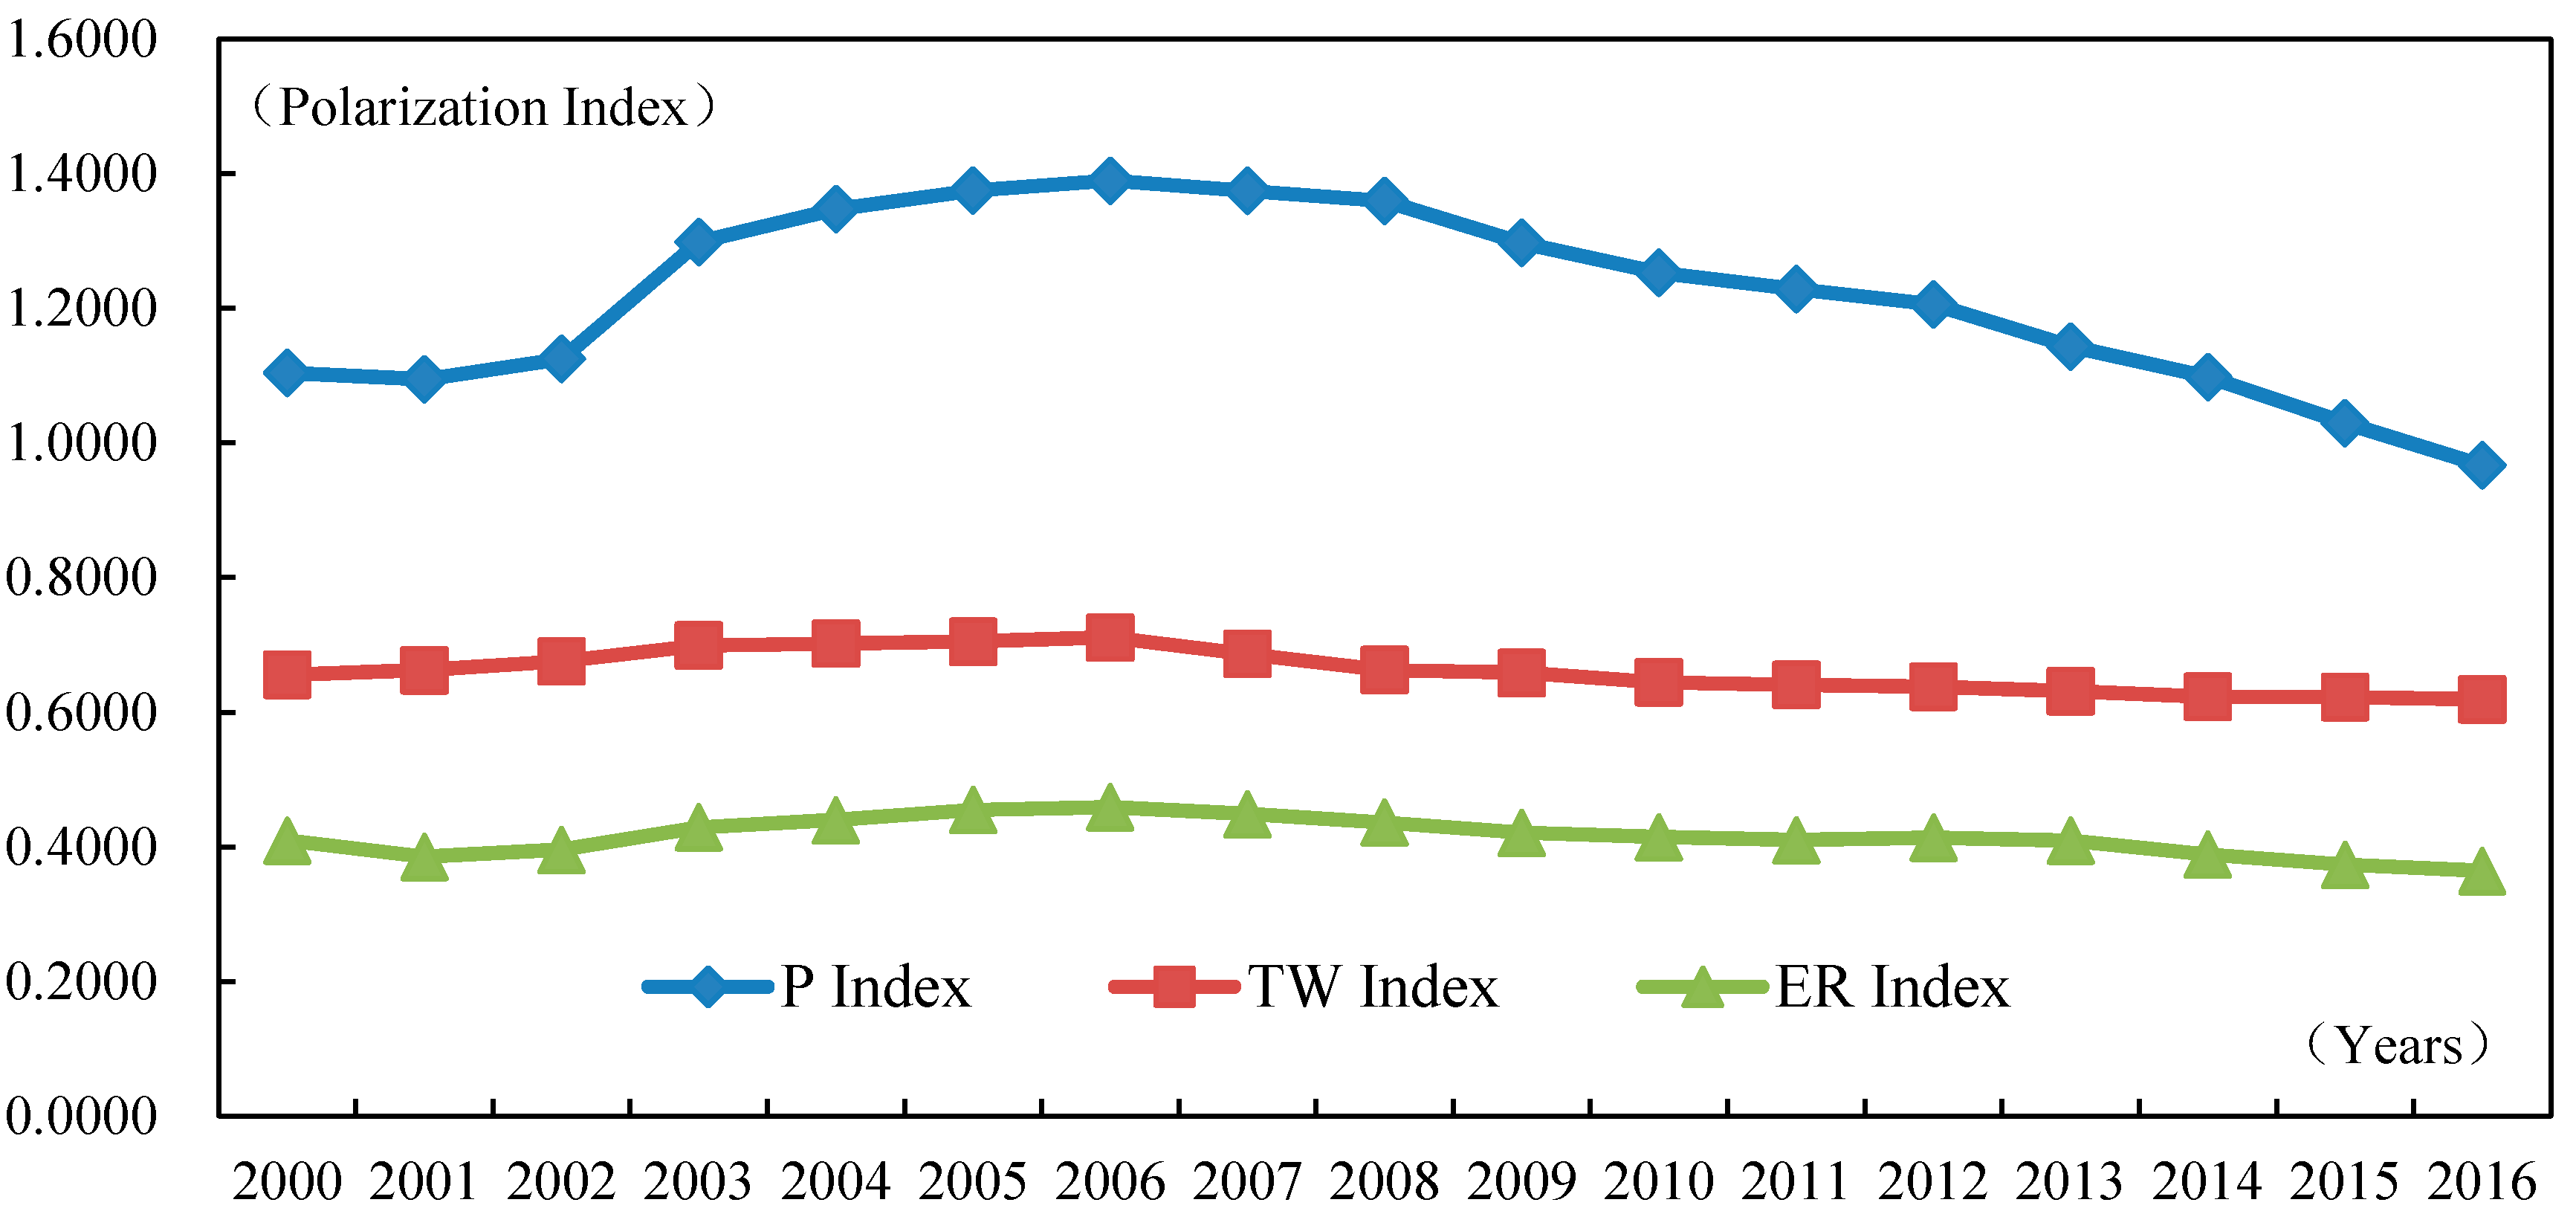
3.1. Time Evolution Feature

To explore the evolutionary characteristics of Jiangsu’s regional economic polarization, we first measured the economic polarization level of Jiangsu Province from 2000 to 2016. The results show that the regional economic polarization evolution trends of Jiangsu Province from 2000 to 2016 measured by the three methods of the ER index, TW index, and P index are basically the same (Figure 2). This is similar to the research conclusions of other scholars in China; that is, the polarization of regional economic polarization in Jiangsu has weakened since 2000. The ER index, TW index, and P index have respectively decreased from 0.4092, 0.6555, and 1.1041 in 2000 to 0.3639, 0.6190, and 0.9671 in 2016. Among them, the P index has the largest fluctuation, while the TW and ER indices are relatively flat. This is mainly because the P index is a polarization measurement method based on the Lorenz curve, and the calculated value is larger than the TW and ER indices, so the degree of volatility is more obvious.
According to the trends of the ER index, TW index, and P index, the evolution process of regional economic polarization in Jiangsu Province from 2000 to 2016 can be divided into two stages as follows:

3.1.1. The Rising Period of Regional Economic Polarization Level (2000–2006)

Since 2000, in order to integrate the advantages of urban groups and promote regional economic and social development, the Jiangsu Government has successively implemented a series of policy measures. In 2000, the Jiangsu government started from the actual situation of regional economic development in the province and divided the province into three economic regions—Sunan, Suzhong, and Subei—and proposed “regional classification guidelines”: That is, Sunan relies on Shanghai and needs to rapidly improve its overall development; the Suzhong area is supported by the Yangtze River industrial belt to improve the level of industrialization and promote a rapid rise; and Subei focuses on infrastructure construction, creating regional characteristic industries and exerting late-comer advantages. Subsequently, in order to seize the development opportunities for China’s entry into the WTO, Jiangsu Province proposed the “development strategy along the Yangtze River” in 2003. The “Three Edges” (along the Shanghai–Nanjing line, along the Yangtze River, and along the East Longhai Line) and “Four Edges” industrial belts (and along the coast) were proposed, respectively, in 2004 and 2005. The implementation of this series of regional development strategic measures and the rapid development of the social economy of the Yangtze River urban belt, coastal and Donglonghai town axis, and three major metropolitan areas (Suxichang, Nanjing, and Xuzhou) led to the continuous strengthening of regional economic polarization in Jiangsu Province.

3.1.2. The Steady Shift of Regional Economic Polarization (2006–2016)

Facing the fact that the difference between the North and the South of the province is expanding and the economic polarization is intensifying, the Jiangsu government is actively implementing its regional common development strategy. In 2006, the government proposed the “North–South Linkage and Joint Construction of the Subei Development Zone” and encouraged the major industrial transfer project in Sunan to settle in Subei. In 2008, the coastal area development strategy was proposed to better integrate the development of coastal areas with the acceleration of the revitalization of Subei. The “Twelfth Five-Year Plan” of Jiangsu Province proposes a regional coordinated development strategy and promotes regional coordinated development at a higher level than that proposed by the “Thirteenth Five-Year Plan”. Under the guidance of the coordinated development of these regions, the advantages of the post-development in Subei have gradually become prominent, and the Suzhong region has risen rapidly. Due to the impact of the financial crisis in 2008, Sunan began to adjust its industrial structure and transform its economic growth mode, which led to a slowdown in regional economic growth. As a result, the regional economic polarization in Jiangsu Province has steadily declined.

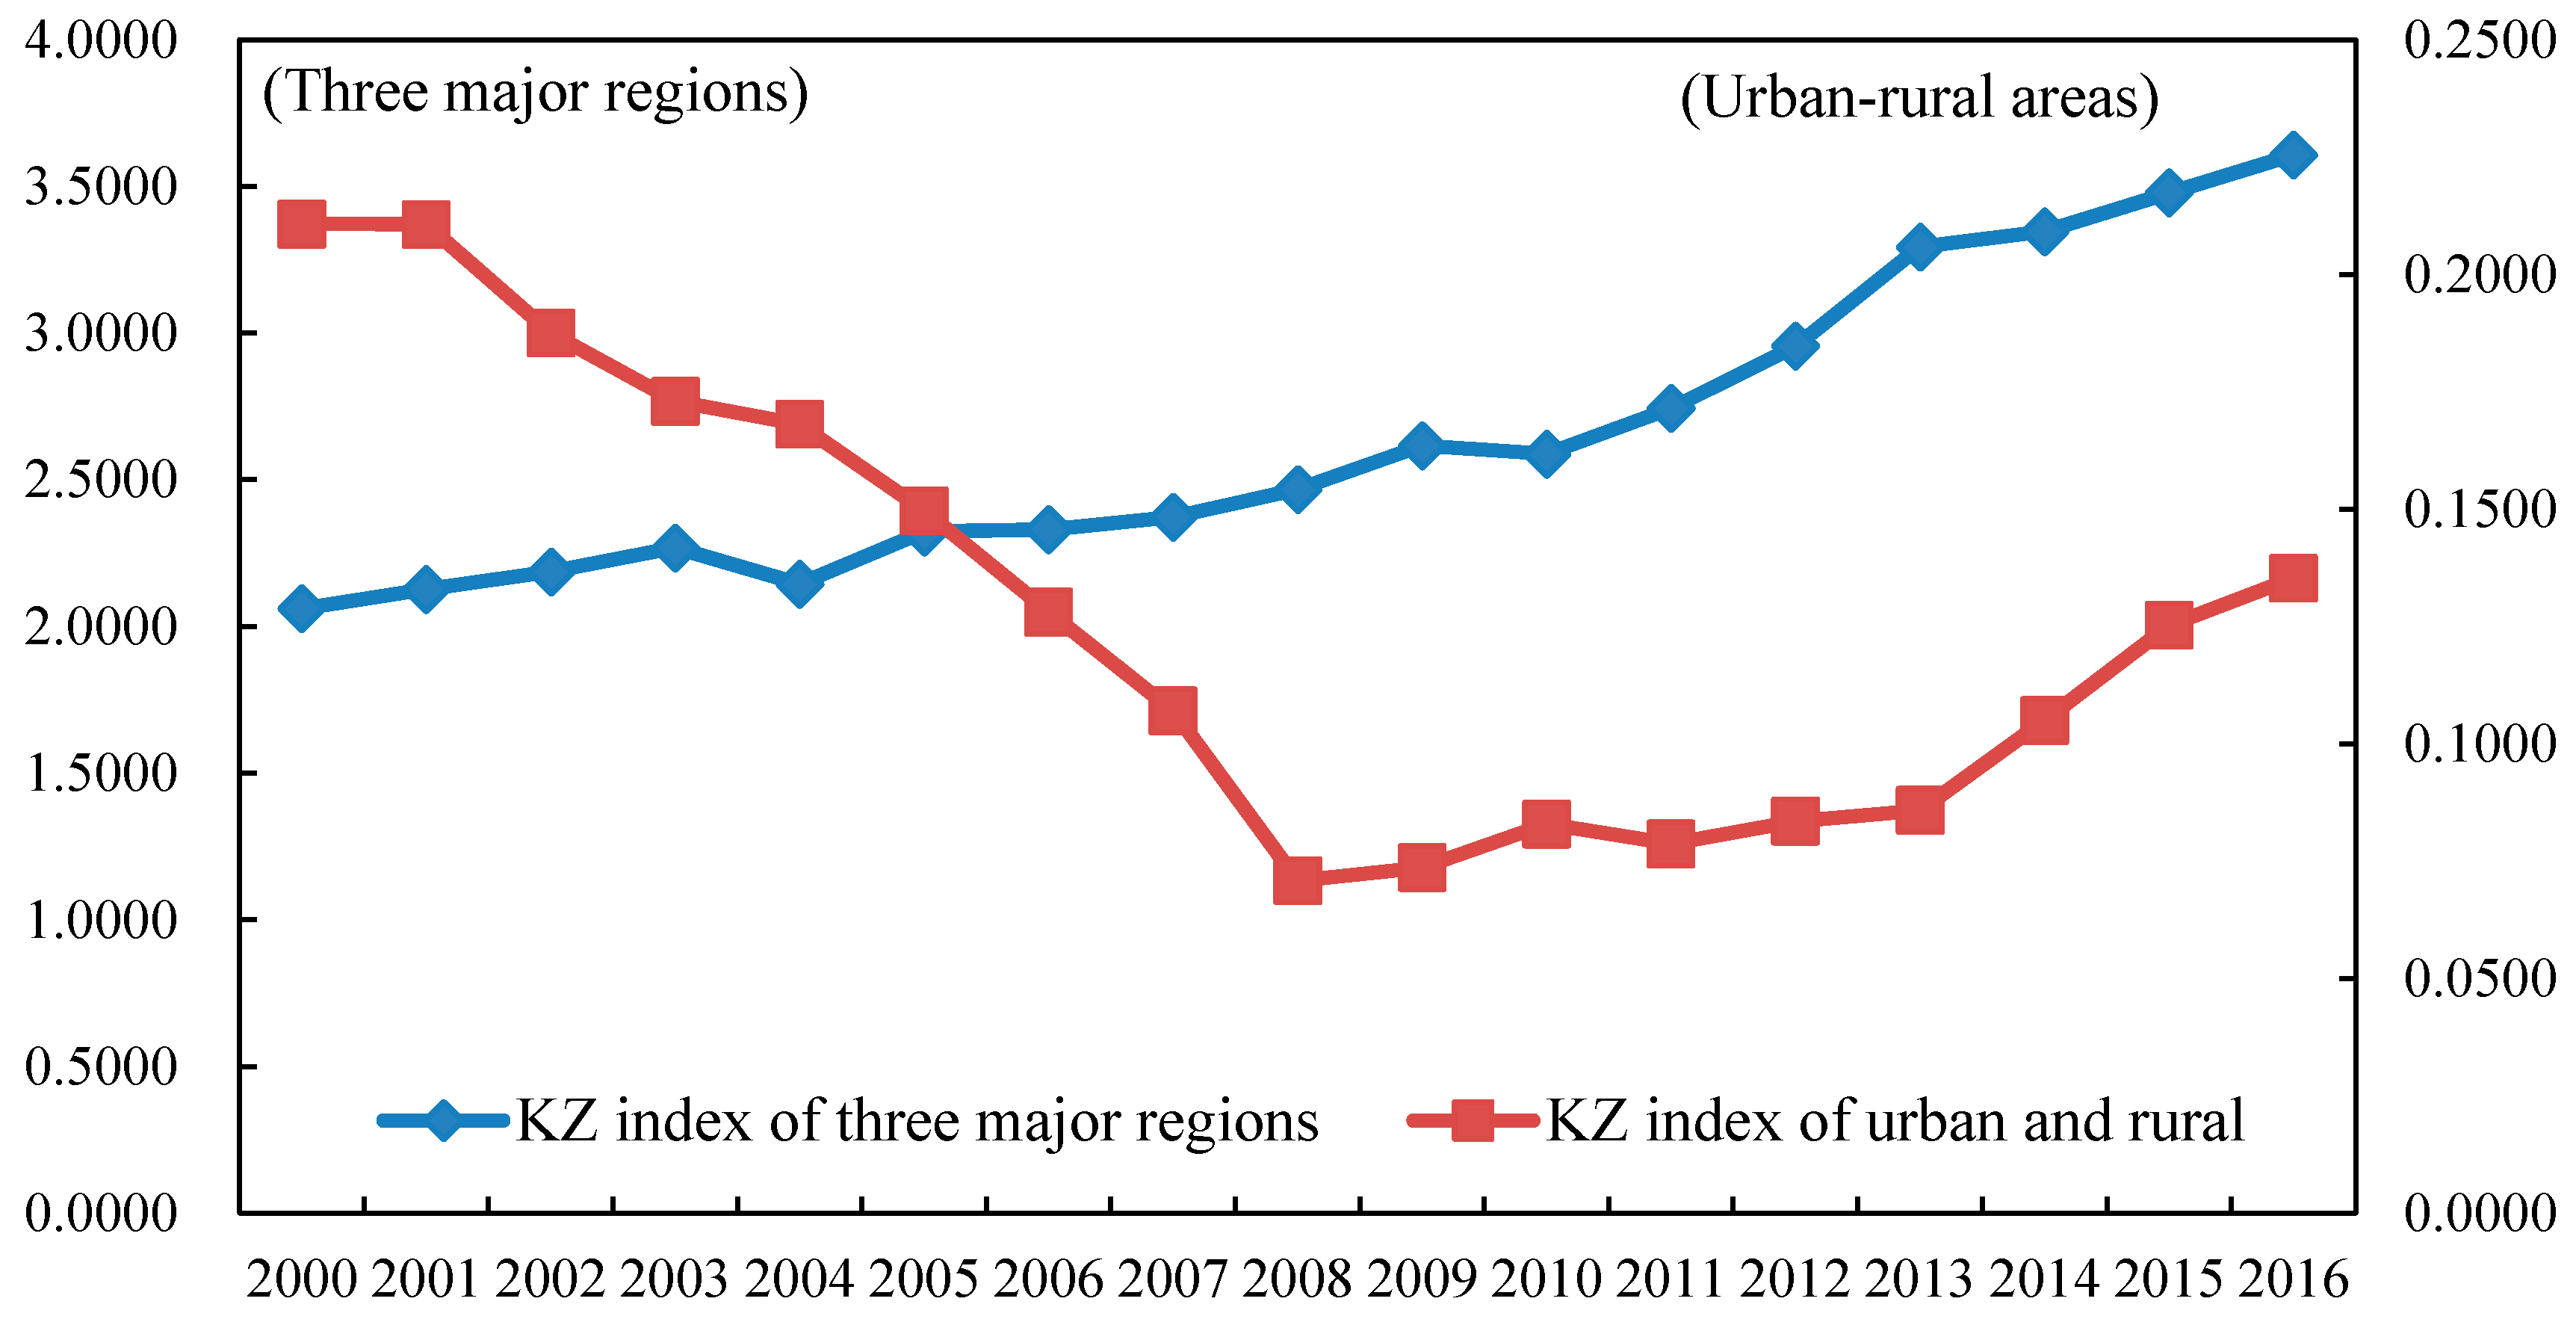
3.2. Spatial Characteristics

The ER index, TW index, and P index theoretically only verify the existence and evolution of regional economic polarization, which illustrates the phenomenon of clustering around the poles, but cannot explain which regions of regional economic polarization have agglomeration and differentiation in which directions. In order to further study the spatial structure of economic polarization evolution in Jiangsu Province, the KZ index and spatial polarization indices are used to analyze the regional economic polarization to express spatial considerations in the three regions, between urban and rural areas, and within 54 counties and cities (Figure 3 and Figure 4).
It can be seen from Figure 3 that the economic polarization between Sunan, Suzhong, and Subei is increasing, while the economic polarization between urban and rural areas, which is lower than the level of polarization between the three major regions, is generally shrinking. The economic polarization in Jiangsu Province is mainly reflected in the polarization between the three regions, while the polarization between urban and rural areas is relatively small.
Specifically, during different periods, the magnitude and trend of economic polarization between the three regions of Sunan, Suzhong, and Subei are different. The economic polarization between the three major regions in 2000–2009 showed a volatility trend and increased sharply during 2009–2016. The main reason is that, on the one hand, from the similarities and closeness of the historical foundation, economic strength, and geographical location of the counties and cities in Sunan, Suzhong, and Subei, the economic polarization level in the each three major regions is relatively small; on the other hand, the implementation of the regional coordinated development strategy has effectively alleviated the overall economic polarization phenomenon in Jiangsu Province due to the large economic base and location conditions between the three major regions of Sunan, Suzhong, and Subei. Therefore, compared with the level of difference in the each region, the differences between the three regions are still significant.
The process of economic polarization between urban and rural areas can also be divided into two stages: The urban-rural KZ index decreased sharply from 2000 to 2008 and showed increased volatility in 2008-2016. However, at any stage, the KZ index is less than 1, indicating that, unlike the polarization phenomenon in the three major regions, the internal differences between urban and rural areas are greater than the differences between urban and rural areas. This is mainly related to the unique development model of Jiangsu Province: On the one hand, after the reform and opening up, Sunan adopted the township government as the main organization resource mode, vigorously developed township enterprises, and combined entrepreneurs and social idle capital. Therefore, it quickly crossed the stage of capital accumulation, and the rapid development of township enterprises in Southern Jiangsu was realized. Since then, the economic differences between cities and villages in Jiangsu Province have been continuously widened. On the other hand, with the implementation of the urban-rural integration strategy, the differences between cities and villages have gradually narrowed to become far less than the difference between the interior of the city and the interior of the village, so the comprehensive urban and rural KZ index is less than 1 and has gradually shrunk. Since 2008, affected by the international financial crisis, the export of goods, foreign investment, and product competitiveness of township and village enterprises in Sunan have been affected to varying degrees, so the economic development has been hindered and the difference in the villages between Sunan and Subei has begun to shrink, leading to an increasing trend in the urban and rural KZ index.
According to the evolution trend of polarization in Jiangsu Province (Figure 2), 54 cities and counties in Jiangsu Province will be used by using the natural fracture method with the smallest intra-class difference and the largest difference between classes and the cross-sectional data of four inflection points in 2000, 2006, 2010, and 2016. The spatial polarization index is divided into four categories: (1) Polarized core area—refers to the region with high economic location and has become the polarization center of the region; (2) polarized inner margin area—refers to the higher economic location, but not reaching the pole. This is the level of the center of the chemical center; (3) polarization transition zone—refers to the relatively small economic location in the transition zone between the polarized zone and the non-polar zone; (4) polarization epitaxial zone—refers to the economical location is small, and other counties in the zone. The city’s connections are small and are in the edge of polarization.
From 2000 to 2016, the spatial pattern change of economic polarization in Jiangsu counties and cities was generally consistent with the change trend of regional economic polarization level. The degree of agglomeration was large in the North and South, and the polarization effect was increasingly prominent. The polarized core area was mainly concentrated in Sunan County. The number of cities has increased slightly, and the polarized areas along the Yangtze and Subei have expanded and mainly developed around the polarized inner edge region.
Specifically, the polarization core area in the space is the smallest but gradually expanding. It is concentrated in the urban area of Southern Jiangsu. It gradually shows the contiguous situation centered on the urban area of Southern Jiangsu. The spatial form can be abstracted as a "single center" circle structure. The process of multi-center structure evolution has basically formed the two polarization core circles of Nanjing, Suzhou, and Wuxi.
The polarized inner edge region is small, and the quantity does not change much. The space is gradually distributed by the distribution of Sunan and Suzhong along the banks of the Yangtze River, and there are scattered high-value discrete areas in a few counties (cities) in the Arctic.
The polarization transition zone is relatively small and is in a polarized zone and a non-polar zone. The distribution of the region has been expanding year by year and has a spatially distinct discrete distribution. By 2016, the spatial pattern had basically formed along East Longhai and along the Yangtze river
The number of such counties and cities in the polarization epitaxial zone has been decreasing, and the large-scale concentrated contiguous distribution in North Jiangsu has been broken by the polarization transition zone and the polarization inner zone counties and cities. It has gradually formed a relatively discrete distribution pattern.

4. Early Warning Analysis of Economic Polarization Level in Jiangsu Province

4.1. Standardization of Economic Polarization Level

At present, the internationally accepted indicator for measuring economic differences is the Gini coefficient (G), and there is a clear phase division. The Gini coefficient has a great relationship with the P index, which measures the economic polarization level, as above; it is one of the indicators necessary for the P index calculation. Therefore, we first calculated the Gini coefficient of economic development in Jiangsu Province from 2000 to 2016, used the P index as the dependent variable (Y) and the Gini coefficient as the independent variable (X), carried out regression analysis, and constructed a linear regression equation model between the two (Equation (6)).
P = 5.1264 G 0.7959
The goodness of fit of the regression results was R = 0.95, the adjusted goodness of fit R2 = 0.94, the F statistic was 288.54, and the significance probability was 0.0000. Then, the coefficient of G and the constant term C passed the test at the level of significance of 1%. The test shows that the overall fit of the equation is good, and there is a relatively positive linear correlation between the P index and the Gini coefficient. According to the UNSD and other organizations’ division criteria for the Gini coefficient, the P index is also divided into corresponding standards, and the level of economic polarization in Jiangsu Province from 2000 to 2016 is graded and alerted (Table 1).
In 2000, the per capita GDP of Jiangsu Province was 1.10, which was at a medium level and required an appropriate alert. In 2004–2009, the economic polarization level first expanded and then narrowed in Jiangsu Province. At this stage, the economic polarization level was relatively high and was at a high level of alert. In 2010–2016, the economic polarization level further narrowed in Jiangsu Province. The P index of per capita GDP decreased from 1.25 in 2010 to 0.97 in 2016. At this stage, the economic polarization level was moderate and required an appropriate alert level.

4.2. Forecast and Warning of Economic Polarization

The occurrence and development of economic polarization in a region often has no obvious regularity and some missing information, so it cannot be directly observed and predicted. According to our previous research [16], there are many factors affecting economic polarization, such as historical basis, location conditions, and spatial strategy, but these factors are constantly changing and some cannot be quantified.
Grey system predictive modeling is used to transform the actual value of a phenomenon in a certain time series into a differential equation, thus establishing a development model of the abstract system [46,47,48,49]. Under the circumstances, it is more reasonable to use the grey model to predict the economic polarization level of Jiangsu Province. Utilizing the grey system theory modeling software (GTMS3.0), the single-sequence first-order linear dynamic model—namely the GM (1,1) model—was used to predict the economic polarization P index of Jiangsu Province (Table 2).
Through calculation, the predicted value of the economic polarization P index in Jiangsu Province from 2000 to 2016 was obtained, and the accuracy of the model was tested (Table 2). The predicted value of the economic polarization P index of Jiangsu Province showed a trend of increasing first and then decreasing, which was consistent with the trend of the actual values. Secondly, the relative error between the predicted value and the actual value was, at less than 0.1, generally small. The average relative error was 0.0433, which is a secondary accuracy. The absolute correlation between the predicted and actual values of the P index was 0.9844, which indicates that there is a strong relationship between the actual value and the predicted value. In a word, the model is a long-term forecasting model. Without large market fluctuations and policy changes, the model has higher precision, and the predicted results are more credible. Therefore, it is preferable to use the GM (1,1) model to predict the P index in Jiangsu Province.
According to the model calculation, the development coefficient a = 0.0107, and the grey action amount b = 1.3442 and b a = 125.6262, so the grey prediction model result is as follows:
X ^ ( K )   =   ( x ( 0 ) ( 1 ) b a ) e a ( K 1 ) + b a =   ( 1.1041 125.6262 ) e 0.0107 ( K 1 ) + 125.6262 =   124.5221 e 0.0107 ( K 1 ) + 125.6262
where X ^ ( K ) is the predicted value of the K phase and x ( 0 ) ( 1 ) is the P index of economic polarization in Jiangsu Province in 2000. According to formula 6, the economic polarization level of Jiangsu from 2017 to 2025 is predicted, and the polarization level of the time period is analyzed by early warning (Table 3).
It can be seen from Table 3 that the economic polarization level of Jiangsu Province will decrease year by year from 2017 to 2025. The P index will decrease from 1.1168 in 2017 to 1.0251 in 2025. The polarization level is at a moderate level, and the alert level is moderate.

5. Summary and Conclusions

In this study, we analyzed the spatial and temporal evolution characteristics of economic polarization in Jiangsu Province from 2000 to 2016 and proposed a standard for rationally dividing the economic polarization level and judging the alert level of Jiangsu’s regional economic polarization. Finally, the grey model was used to predict the future economic polarization level and development trend of the region. Three conclusions can be drawn.
Firstly, with the continuous implementation of the regional coordinated development strategy of Jiangsu Province since 2000, the economic polarization level has shown a weakening trend. The regional economic polarization level fluctuated from 2000 to 2006, and the regional economic polarization steadily declined in the period 2006–2016.
Secondly, the economic polarization between Sunan, Suzhong, and Subei is increasing; the economic polarization between urban and rural areas first reduced and then strengthened, and the level of economic polarization between urban and rural areas is much lower than the polarization level between the three regions. The degree of economic polarization in counties and cities is quite different from north to south, and the polarization effect is increasingly significant. The polarized core area is mainly concentrated in Sunan, and the number is slightly increased. The polarized areas along the Yangtze and Subei are expanding and mainly developing around the inner edge of polarization.
Finally, the economic polarization of Jiangsu Province was at a moderate level and moderate warning stage from 2000 to 2003 and from 2010 to 2016. However, from 2004 to 2009, it was higher and at a high level of alert. Using the grey correlation prediction model to predict the economic polarization level of Jiangsu Province from 2017 to 2025, it was found that the level of polarization shows a clear trend of shrinking year by year, which has been at a moderate level and a moderate alert.
To this end, this paper proposes the following countermeasures: (1) We should constantly accelerate the economic construction of urban and rural areas in Northern Jiangsu and reduce the economic differences between cities and villages in Jiangsu Province; (2) the government should accelerate the construction of urban-rural infrastructure and continuously improve the basic public services in urban and rural areas to effectively solve the problem of people’s livelihood; (3) we should improve its ability to regulate regional economic polarization, strengthen support for the Northern Jiangsu region, promote exchanges and cooperation between the North and the South, and strive to narrow the North–South gap.
Our article has theoretical and practical significance, in terms of the division of economic polarization levels, analysis and prediction of regional economic polarization alert levels, and the promotion of regional coordinated development. However, our research has several limitations that should be addressed in the future. First of all, this paper only measures the level of economic polarization from the perspective of per capita GDP, and the indicator system is not perfect. Therefore, studying economic polarization and conducting predictive analysis from multiple perspectives such as regional economic, social, and geographical environment will be the focus of our future research. In addition, the timing of our research was not long enough, and we will try to study the characteristics of economic polarization since the reform and opening-up in China. Finally, this study only analyzes and warns the economic polarization of Jiangsu Province, but economic polarization is a universal phenomenon. In order to avoid the economic and social problems, the economic polarization in different spatial backgrounds will be discussed. Early warning analysis is also very important, so we will try to enlarge the research area and analyze it in China—and even other countries and regions—in order to provide deeper valuable theoretical and practical references.

Author Contributions

All of the authors made contributions to the work in this paper. C.Z. and X.O. designed the research. C.Z. wrote the article, and X.O. checked it. J.T. modified the article and improved the language.

Funding

This work was supported by the Social Science Foundation of Jiangsu Province (15JD013) and the key projects of the Philosophy and Social Science Foundation of Jiangsu Higher Education (2018SJZDI091).

Conflicts of Interest

The authors declare no conflict of interest.

References

  1. Anderson, G. Toward an empirical analysis of polarization. J. Econom. 2004, 122, 1–26. [Google Scholar] [CrossRef]
  2. Wolfson, M.C. Conceptual issues in normative measurement when inequalities diverge. Int. Libr. Crit. Writ. Econ. 2003, 158, 594–602. [Google Scholar]
  3. Esteban, J.M.; Ray, D. On the measurement of polarization. Econometrics 1994, 62, 819–851. [Google Scholar] [CrossRef]
  4. Wolfson, M.C. When Inequalities Diverge? Am. Econ. Rev. 1994, 84, 353–358. [Google Scholar]
  5. Wang, Y.Q.; Tsui, K.Y. Polarization orderings and new classes of polarization indices. J. Public Econ. Theory 2000, 2, 349–363. [Google Scholar] [CrossRef]
  6. Zhang, X.; Kanbur, R. What difference do polarisation measures make? An application to China. J. Dev. Stud. 2001, 37, 85–98. [Google Scholar] [CrossRef]
  7. Rodriguez, J.G.; Salas, R. Extended Bi-Polarization and Inequality Measures; Universidad Complutense de Madrid: Madrid, Spain, 2002. [Google Scholar]
  8. Lukaze, P. Economic Polarization across European Union Regions in the years 2007–2012 at NUTS 2 Level. Folia Oeconomica Stetin. 2016, 16, 135–150. [Google Scholar]
  9. Llorca-Rodríguez, C.M.; Casas, A.C.; García-Fernández, R.M. The Regional Polarization of Tourism’s Contribution to Economic Growth in Peru: Alternative Solutions. Tour. Econ. 2016, 22, 397–415. [Google Scholar] [CrossRef]
  10. Wang, C.; Wan, G. Income polarization in China: Trends and changes. China Econ. Rev. 2015, 36, 58–72. [Google Scholar] [CrossRef]
  11. Alonso, M. Structural Hegemony in Sub-Sahara Africa: Implications for Readjustment of Polarized Economic Regions. Ann. Assoc. Am. Geogr. 2015, 79, 257–274. [Google Scholar]
  12. Qin, X.H.; Duan, X.J. Analysis on the Economic Gradient Evolution in the Formation of Yangtze River Delta Polarized Area. Resour. Environ. Yangtze Basin 2018, 27, 1179–1185. [Google Scholar]
  13. Tian, J.F.; Liu, Y.J.; Fu, Z.H.; Wang, B.Y. The differentiation of agglomeration degree and pattern of spatial polarization of the internal elements in the Ha-Da giant urban belt. Hum. Geogr. 2017, 3, 123–129. [Google Scholar]
  14. Liu, B.Z.; Gao, J.H. Dynamic analysis of economic polarization and spatial pattern of Central Plains Economic Area. J. Henan Univ. (Nat. Sci.) 2016, 46, 631–637. [Google Scholar]
  15. Tal, M.S.; Maarten, V.H. Neighbourhood change and spatial polarization: The roles of increasing inequality and divergent urban development. Cities 2018, 82, 108–118. [Google Scholar]
  16. Ou, X.J.; Gu, C.L. Quantitative Analysis of Regional Economic Polarization and Dynamic Mechanism in Jiangsu Province. Acta Geogr. Sin. 2004, 59, 791–799. [Google Scholar]
  17. Zhen, F.; Gu, C.L.; Shen, J.F.; Huang, J.Y.; Zhu, J.R. Study on regional polarization of Guangdong Province since 1978. Sci. Geogr. Sin. 2000, 20, 403–410. [Google Scholar]
  18. Guo, T.Y. The change trends of regional economic polarization in China, 1952–2000. Econ. Geogr. 2004, 24, 743–747. [Google Scholar]
  19. Duan, X.J.; YU, X.G.; Nipper, J. Economic polarized trends function and expanded boundaries of the Yangtze Delta. J. Geogr. Sci. 2009, 19, 733–735. [Google Scholar] [CrossRef]
  20. Woo, J. Social polarization, fiscal instability and growth. Eur. Econ. Rev. 2009, 49, 1451–1477. [Google Scholar] [CrossRef]
  21. Ezcurra, R. Does income polarization affect economic growth? The case of European regions. Reg. Stud. 2009, 43, 267–285. [Google Scholar] [CrossRef]
  22. Wang, W.C. Information economy and inequality: Wage polarization, unemployment and occupation transition in Taiwan since 1980. J. Econ. Inequal. 2009, 20, 120–136. [Google Scholar] [CrossRef]
  23. Foster, E.; Wolfson, M.C. Polarization and the decline of the middle class: Canada and the U.S. J. Econ. Inequal. 2010, 8, 247–273. [Google Scholar] [CrossRef]
  24. Kosta, J.; Novica, S. Income Polarization of the U.S. Working Class: An Institutionalist View. J. Econ. Issues 2018, 52, 498–508. [Google Scholar]
  25. Yu, T.H. An Analysis of the Relationship of Urban-Rural Income Polarization and Economic Growth in China. Econ. Surv. 2016, 33, 19–24. [Google Scholar]
  26. Pellegrini, G. Proximity, Polarization, and Local Labor Market Performances. Netw. Spat. Econ. 2002, 2, 151–173. [Google Scholar] [CrossRef]
  27. Xiu, C.L.; Zhao, Y.H.; Song, W. Spatial polarization of railway transport in northeast China: 1990–2005. Acta Geogr. Sin. 2008, 63, 1097–1107. [Google Scholar]
  28. Li, X.W.; Xiu, C.L. New pattern of regional economic polarization in the three provinces of northeast China. Sci. Geogr. Sin. 2008, 28, 722–728. [Google Scholar]
  29. Zhang, C.M.; Zhang, Z.L.; Xu, H.Y. Evolution of Regional Economic Polarization Structure Based on Spatial Autocorrelation: A Case Study of Jiangsu Province. Sci. Geogr. Sin. 2018, 38, 557–563. [Google Scholar]
  30. Ye, L.; Ou, X.J. Analysis on the process and spatial evolution of economic polarization in the Yangtze River Delta. Prog. Geogr. 2012, 31, 1668–1677. [Google Scholar]
  31. Miao, C.H.; Wang, H.J. Urban economic location index and spatial economic contacts: Case study of Shandong peninsula, Zhongyuan and Guanzhong urban agglomerations. Yellow River Civiliz. Sustain. Dev. 2012, 4, 21–31. [Google Scholar]
  32. Liu, Z.D.; Yao, L.L.; Yu, X.G. Study on Spatial Polarization of the Yangtze River Delta since the 1990s. Geogr. Geo-Inf. Sci. 2007, 23, 82–86. [Google Scholar]
  33. Michelson, R.L.; Wheeler, J.O. The flow of information in a global economy: The role of the American urban system in 1990. Ann. Assoc. Am. Geogr. 1994, 84, 87–107. [Google Scholar] [CrossRef]
  34. Fedrov, L. Regional inequality and polarization in Russia. World Dev. 2002, 30, 443–456. [Google Scholar]
  35. Fritizell, J. Income inequality in the 1980s: A five-country comparison. Acta Sociol. 1993, 36, 47–62. [Google Scholar] [CrossRef]
  36. Denzel, S.; Gottschalk, P. Polarization Tides: Rising Inequality in America; Russell Sage Foundation: New York, NY, USA, 1993; pp. 3–17. [Google Scholar]
  37. Fan, C.C.; Casetti, E. The spatial and temporal dynamics of US regional income inequality, 1950–1989. Reg. Sci. 1994, 28, 177–196. [Google Scholar] [CrossRef] [Green Version]
  38. Gu, C.L.; Kesteloot, C. Social polarization and segregation phenomenon in Beijing. Acta Geogr. Sin. 1997, 52, 385–393. [Google Scholar]
  39. Zhao, Y.H.; Xiu, C.L.; Jiang, B. Polarization development of three urban groups in Northeast China since 1990. Econ. Geogr. 2010, 30, 738–743. [Google Scholar]
  40. Liu, Z.D.; Yang, Q. Research on the spatial polarization and its influencing factors in the Shandong Peninsula urban agglomerations regions. Resour. Environ. Yangtze Basin 2011, 20, 790–795. [Google Scholar]
  41. Ma, X.C.; Ou, X.J.; Ye, L. The evolution process and early warning analysis of regional economic polarization in Jiangsu Province. Urban Probl. 2013, 5, 51–56. [Google Scholar]
  42. Nie, G.H.; Qiu, Y.D.; Long, W.Q. Analysis on regional Economic Development Difference and Prediction of Spatial Polarization in Jiangxi Province. J. Harbin Univ. Commer. (Soc. Sci. Ed.) 2018, 2, 91–100. [Google Scholar]
  43. Yang, Q.; Duan, X.; Wang, L. Spatial–Temporal Patterns and Driving Factors of Rapid Urban Land Development in Provincial China: A Case Study of Jiangsu. Sustainability 2017, 9, 2371. [Google Scholar] [CrossRef]
  44. Cheng, C.C. The coastal development strategy and balanced development of regional economy in Jiangsu Province. Jiangsu Soc. Sci. 2009, 6, 207–213. [Google Scholar]
  45. Duan, Q.L. Evolution of regional spatial structure in Jiangsu Province. Mod. Econ. Res. 2007, 11, 57–61. [Google Scholar]
  46. Liu, S.F.; Cai, H.; Yang, Y.J.; Cao, Y. Advance in grey incidence analysis modelling. Syst. Eng. Theory Pract. 2013, 33, 2041–2046. [Google Scholar]
  47. Xu, M.; Liu, C.L.; Li, D.; Zhong, X.L. Tourism ecological security early warning of Zhangjiajie, China based on the improve TOPSIS method and the grey GM (1,1) model. Chin. J. Appl. Ecol. 2017, 28, 3731–3739. [Google Scholar]
  48. Xing, W.; Tu, J.J.; Li, Q.; Zhu, Y.; Liu, L. Early-warning of urban land ecological security in Yangtze River Economic Belt based on grey forecasting model. Ecol. Sci. 2018, 37, 78–88. [Google Scholar]
  49. Sun, W.; Hou, Y.; Guo, L. Analyzing and Forecasting Energy Consumption in China’s Manufacturing Industry and Its Subindustries. Sustainability 2019, 11, 99. [Google Scholar] [CrossRef]
Figure 1. Location of Jiangsu Province with its three sub-regions, in China.
Sustainability 11 01339 g001
Figure 2. Polarization evolution trend of the regional economy in Jiangsu Province (2000-2016) TW: Tsui–Wang; ER: Esteban–Ray.
Sustainability 11 01339 g002
Figure 3. Evolution of the three regional and urban–rural economic polarization patterns in Jiangsu Province (2000–2016).
Sustainability 11 01339 g003
Figure 4. Evolution of economic polarization spatial patterns in Jiangsu Province (2000–2016). (a): 2000; (b): 2006; (c): 2010; (d): 2016.
Sustainability 11 01339 g004
Table 1. Classification and alert standards of economic polarization level in Jiangsu Province.
GiniP Polarization LevelAlert LevelYears
<0.2<0.23Low levelWeak alertNone
0.2–0.30.23–0.74Lower levelWeaker alertNone
0.3–0.40.74–1.26Moderate levelModerate alert2000, 2001, 2002, 2010, 2011, 2012, 2013, 2014, 2015, 2016
0.4–0.61.26–2.28Higher levelStronger alert2003, 2004, 2005, 2006, 2007, 2008, 2009
>0.6>2.28High levelStrong alertNone
Table 2. The predicted value, actual value, relative error, and accuracy level of the economic polarization P index in Jiangsu Province.
YearsPredicted ValueActual ValueRelative Error,Accuracy Level
20001.1041 1.1041
20011.1284 1.0948 0.0307 Second rank
20021.1179 1.1250 0.0064 First rank
20031.2972 1.2988 0.0012 First rank
20041.3418 1.3477 0.0044 First rank
20051.3070 1.3754 0.0498 Second rank
20061.3162 1.3901 0.0531 Third rank
20071.2429 1.3748 0.0960 Third rank
20081.2296 1.3598 0.0957 Third rank
20091.2356 1.2976 0.0478 Second rank
20101.2036 1.2532 0.0396 Second rank
20111.1908 1.2291 0.0312 Second rank
20121.1781 1.2063 0.0233 Second rank
20131.1656 1.1437 0.0192 Second rank
20141.1532 1.0983 0.0500 Second rank
20151.1309 1.0297 0.0983 Third rank
20161.0119 0.9671 0.0463 Second rank
Table 3. Economic Polarization Level Prediction and Warning Level in Jiangsu Province (2017–2025).
YearsP IndexPolarization LevelAlert Level
20171.1168Moderate levelModerate alert
20181.1049Moderate levelModerate alert
20191.0931Moderate levelModerate alert
20201.0815Moderate levelModerate alert
20211.0700Moderate levelModerate alert
20221.0586Moderate levelModerate alert
20231.0473Moderate levelModerate alert
20241.0362Moderate levelModerate alert
20251.0251Moderate levelModerate alert

