Sustainable Development of Food Processing Enterprises in China


Abstract
:1. Introduction
1.1. Definition of Sustainable Development
1.2. Definition on Enterprise Sustainability
1.3. How to Evaluate Enterprise Sustainability
1.3.1. CSR Theory (Corporate Social Responsibility)
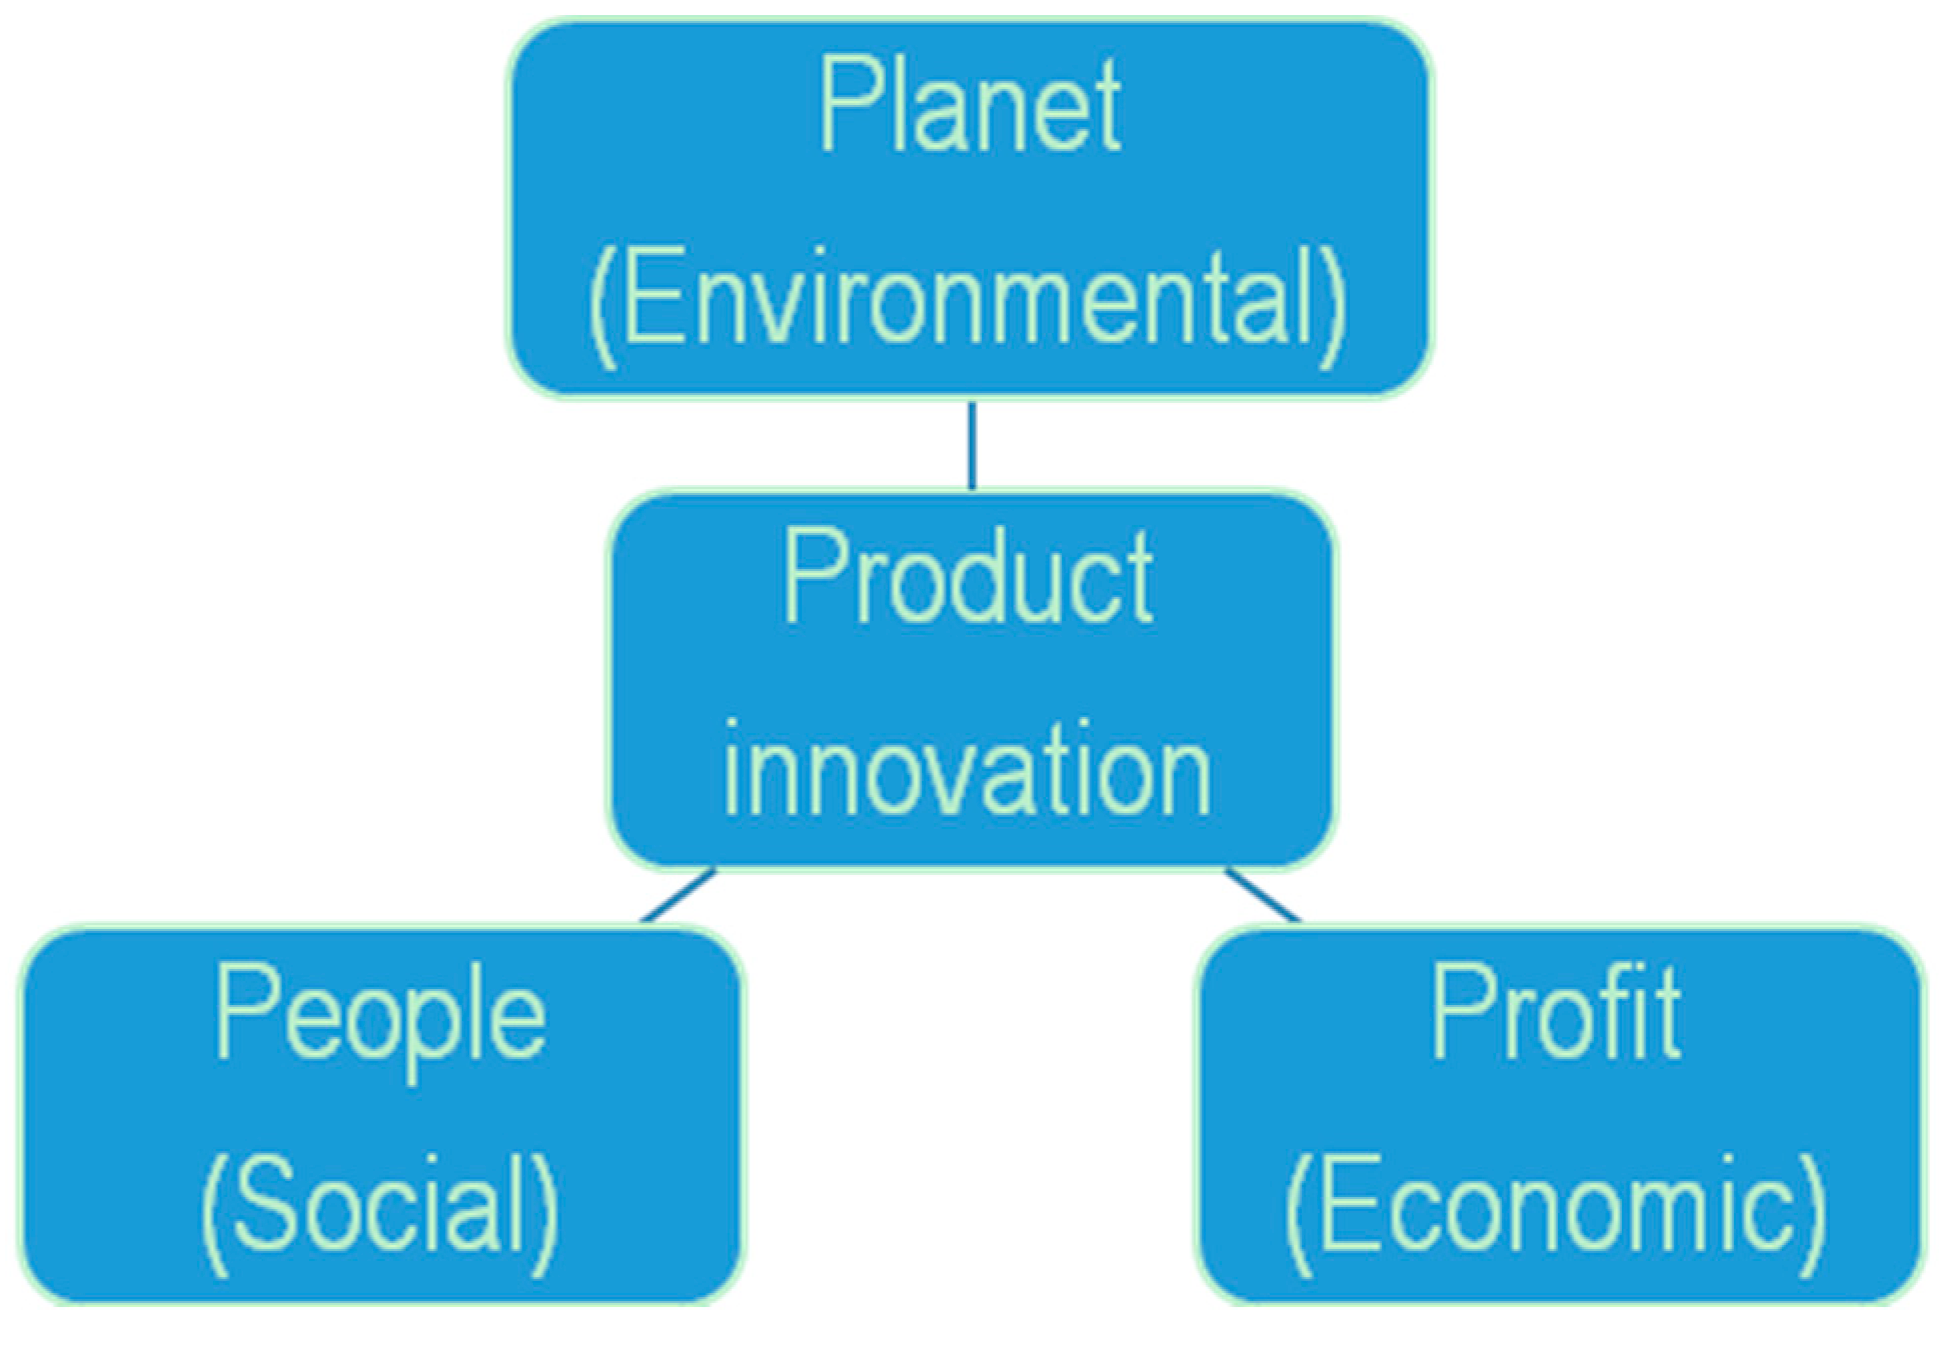
1.3.2. D4S (Design for Sustainability):
1.4. The Dimension of Sustainability Evaluation
1.5. Research Population: Food Processing Enterprises
1.6. Technical Criteria for Indicator Design and Selection
- Specific: Indicators must relate to the desired outcome, i.e. fit the purpose for measuring.
- Measurable: Indicators should preferably be open to measurement in a quantitative manner.
- Pedagogical: Indicators should be practical and designed for those who are going to use them.
- Sensitive: Indicators must readily change as circumstances change.
- Reliable: The information that an indicator is providing must be reliable. Data upon which the indicator is based must therefore be collected using a systematic method.
- Cost-effective: The cost of accumulating necessary data should not exceed the benefits of using the indicator.
2. Materials and Methods
2.1. Detailed Description of the Indicators of the First, Second and Third Level
2.1.1. Growth
2.1.2. Security
2.1.3. Legal Compliance
2.1.4. Staff and Production Safety
2.1.5. Employee Benefits
2.1.6. Organizational Management
2.1.7. Production Preparation
2.1.8. Energy and Water Consumption Management
2.1.9. Waste Management
2.2. Description of the Indicators
2.3. Theoretical Basis: The Analytic Hierarchy Process (AHP)
- Calculation the product matrix of each row element
- Calculation 3 times square ,
- Calculation the feature vector ,
- Calculation the maximum Eigen value of the judgment matrix ,
- The result
- A1 = B1 ∗ 0.2956 + B2 ∗ 0.2076;
- A2 = B3 ∗ 0.1395 + B4 ∗ 0.0504 + B5 ∗ 0.0300;
- A3 = B6 ∗ 0.1145 + B7 ∗ 0.0496 + B8 ∗ 0.0565 + B9 ∗ 0.0563;
- B1 = C1 ∗ 0.0406 + C2 ∗ 0.1161 + C3 ∗ 0.0530;
- B2 = C4 ∗ 0.0860 + C5 ∗ 0.0777 + C6 ∗ 0.1299;
- B3 = C7 ∗ 0.1008 + C8 ∗ 0.0388;
- B4 = C9 ∗ 0.0504;
- B5 = C10 ∗ 0.0300;
- B6 = C11 ∗ 0.0558 + C12 ∗ 0.0214 + C13 ∗ 0.0277 + C14 ∗ 0.0097;
- B7 = C15 ∗ 0.0263 + C16 ∗ 0.0233;
- B8 = C17 ∗ 0.0308 + C18 ∗ 0.0257;
- B9 = C19 ∗ 0.0092 + C20 ∗ 0.0122 + C21 ∗ 0.0148 + C22 ∗ 0.0202;
3. Results
3.1. Evaluation Framework
3.2. General Overview of the Results
4. Discussion
Author Contributions
Funding
Conflicts of Interest
References
- The State of Food and Agriculture. Available online: http://www.fao.org/publications/sofa/2013/en/ (accessed on 3 December 2014).
- Bourlakis, M.; Maglaras, G.; Gallear, D.; Fotopoulos, C. Examining sustainability performance in the supply chain: The case of the Greek dairy sector. Ind. Mark. Manag. 2014, 43, 56–66. [Google Scholar] [CrossRef]
- León-Bravo, V.; Caniato, F.; Caridi, M.; Johnsen, T. Collaboration for Sustainability in the Food Supply Chain: A Multi-Stage Study in Italy. Sustainability 2017, 9, 1253. [Google Scholar] [CrossRef]
- Fritz, M.; Schiefer, G. Food chain management for sustainable food system development: A European research agenda. Agribusiness 2008, 24, 440–452. [Google Scholar] [CrossRef]
- Carter, C.R.; Rogers, D.S. A framework of sustainable supply chain management: Moving toward new theory. Int. J. Phys. Distrib. Logist. Manag. 2008, 38, 360–387. [Google Scholar] [CrossRef]
- Varsei, M.; Soosay, C.A.; Fahimnia, B.; Sarkis, J. Framing sustainability performance of supply chains with multidimensional indicators. Supply Chain Manag. Int. J. 2014, 19, 242–257. [Google Scholar] [CrossRef]
- Pullman, M.E.; Maloni, M.J.; Carter, C.R. Food for thought: Social versus environmental sustainability practices and performance outcomes. J. Supply Chain Manag. 2009, 45, 38–54. [Google Scholar] [CrossRef]
- Yakovleva, N.; Sarkis, J.; Sloan, T.W. Sustainability indicators for the food supply chain. In Environmental Assessment and Management in the Food Industry: Life Cycle Assessment and Related Approaches; Sonesson, U., Berlin, J., Ziegler, F., Eds.; Woodhead Publishing: Cambridge, UK, 2010; pp. 297–329. [Google Scholar]
- Matopoulos, A.; Bourlakis, M. Sustainability practices and indicators in food retail logistics: Findings from an exploratory study. J. Chain Netw. Sci. 2010, 10, 207–218. [Google Scholar] [CrossRef]
- Erol, I.; Sencer, S.; Sari, R. A New fuzzy multi-criteria framework for measuring sustainability performance of a supply chain. Ecol. Econ. 2011, 70, 1088–1100. [Google Scholar] [CrossRef]
- Yakovleva, N.; Sarkis, J.; Sloan, T. Sustainable benchmarking of supply chains: The case of the food industry. Int. J. Prod. Res. 2012, 50, 1297–1317. [Google Scholar] [CrossRef]
- Beske-Janssen, P.; Johnson, M.P.; Schaltegger, S. 20 years of performance measurement in sustainable supply chain management—What has been achieved? Supply Chain Manag. Int. J. 2015, 20, 664–680. [Google Scholar] [CrossRef]
- Slaper, T.; Hall, T. The triple bottom line: What is it and how does it work? Indiana Bus. Rev. 2011, 86, 4. [Google Scholar]
- Barbier, E.B. Economics, Natural Resource Scarcity and Development: Conventional and Alternative Views; Earthscan Publications: London, UK, 1989. [Google Scholar]
- Brown, L.R. Ecological Economy Revolution—The Five Steps of Saving the Planet and Economic; Taiwan Yangzhi cultural undertakings co., LTD.: Taipei, Taiwan, 1999. [Google Scholar]
- Kotler, P. Kotler New Thinking: Rethinking Marketing Model and Asian Cases; China Renmin University Press: Beijing, China, 2004. [Google Scholar]
- Guo, M.J. The Modern Enterprise Sustainable Development Theory and Strategy; Tsinghua University Press: Beijing, China, 2004. [Google Scholar]
- Carroll, A.B. A three-dimensional conceptual model of corporate performance. Acad. Manag. 1979, 4, 497–505. [Google Scholar]
- Carroll, A.B. Corporate social responsibility: Evolution of a definitional construct. Bus. Soc. 1999, 38, 268–295. [Google Scholar] [CrossRef]
- Bowen, H. Social Responsibility of the Businessman; Harper and Row: New York, NY, USA, 1953. [Google Scholar]
- Swanson, D.L. Addressing a theoretical problem by reorienting the corporate social performance model. Acad. Manag. Rev. 1995, 20, 43–64. [Google Scholar] [CrossRef]
- Goodland, R.; Daly, H. Environmental sustainability: Universal and non-negotiable. Ecol. Appl. 1996, 6, 1002–1017. [Google Scholar] [CrossRef]
- Xia, B.; Olanipekun, A.; Chen, Q.; Xie, L.; Liu, Y. Conceptualising the state of the art of corporate social responsibility (CSR) in the construction industry and its nexus to sustainable development. J. Clean. Prod. 2018, 5, 340–353. [Google Scholar] [CrossRef]
- Fordham, A.E.; Robinson, G.M.; Blackwell, B.D.; Cleary, J. Contributing to sustainable community livelihoods: corporate social responsibility programmes of resource companies. Rural Soc. 2018, 27, 224–242. [Google Scholar] [CrossRef]
- Zhuravlyov, V.; Varkova, N.; Aliukov, S.; Khudyakova, T. Strategic Aspects of Ensuring Sustainable Development of Gold Enterprises of the Russian Federation. Sustainability 2018, 10, 4410. [Google Scholar] [CrossRef]
- Bombiak, E.; Marciniuk-Kluska, A. Green Human Resource Management as a Tool for the Sustainable Development of Enterprises: Polish Young Company Experience. Sustainability 2018, 10, 1739. [Google Scholar] [CrossRef]
- Saaty, T.L. Decision making with the analytic hierarchy process. Int. J. Serv. Sci. 2008, 1, 83–98. [Google Scholar] [CrossRef]
- Pipatprapa, A.; Huang, H.; Huang, C. Enhancing the effectiveness of AHP for environmental performance assessment of Thailand and Taiwan’s food industry. Environ. Monit. Assess. 2018, 190, 748. [Google Scholar] [CrossRef] [PubMed]
- Ulkhaq, M.; Nartadhi, R.L.; Akshinta, P.Y. Evaluating service quality of Korean restaurants: a fuzzy analytic hierarchy approach. Ind. Eng. Manag. Syst. 2016, 15, 77–91. [Google Scholar] [CrossRef]
- Lee, J.H.; Lim, S. An Analytic Hierarchy Process (AHP) Approach for Sustainable Assessment of Economy-Based and Community-Based Urban Regeneration: The Case of South Korea. Sustainability 2018, 10, 4456. [Google Scholar]
- Park, K.S.; Seo, Y.J.; Kim, A.; Ha, M.H. Ship Acquisition of Shipping Companies by Sale & Purchase Activities for Sustainable Growth: Exploratory Fuzzy-AHP Application. Sustainability 2018, 10, 1763. [Google Scholar]
- Oudah, M.; Jabeen, F.; Dixon, C. Determinants Linked to Family Business Sustainability in the UAE: An AHP Approach. Sustainability 2018, 10, 246. [Google Scholar] [CrossRef]


| Authors | Research Angle | Dimensions | Source |
|---|---|---|---|
| John Elkington | Corporate social responsibility field | Social, economic, environmental | 《The Power of Unreasonable People: How Social Entrepreneurs Create Markets That Change the World》 |
| CSD(Commission on Sustainable Development) | Sustainable development | Social, economic, environmental, institutional | https://sustainabledevelopment.un.org/csd.html |
| Delft University of Technology and UNEP | Sustainability in product innovation | Social (people), economic (profit), environmental (planet) | https://www.unenvironment.org/ |
| Region | Number | Proportion | Region | Number | Proportion |
|---|---|---|---|---|---|
| Anhui | 14 | 1.38% | Jiangxi | 25 | 2.46% |
| Beijing | 41 | 4.04% | Liaoning | 12 | 1.18% |
| Fujian | 8 | 0.79% | Inner Mongolia | 3 | 0.30% |
| Gansu | 3 | 0.30% | Ningxia | 1 | 0.10% |
| Guangdong | 101 | 9.95% | Qinghai | 62 | 6.11% |
| Guangxi | 7 | 0.69% | Shandong | 58 | 5.71% |
| Hainan | 1 | 0.10% | Shanxi | 11 | 1.08% |
| Hebei | 19 | 1.87% | Shaanxi | 6 | 0.59% |
| Henan | 225 | 22.17% | Shanghai | 77 | 7.59% |
| Heilongjiang | 4 | 0.39% | Sichuan | 200 | 19.70% |
| Hubei | 14 | 1.38% | Tianjin | 9 | 0.89% |
| Hunan | 13 | 1.28% | Yunnan | 3 | 0.30% |
| Jilin | 7 | 0.69% | Zhejiang | 35 | 3.45% |
| Jiangsu | 44 | 4.33% | Chongqing | 12 | 1.18% |
| Indicator Name | C1. Market Share | |
|---|---|---|
| Second Level | B1. Growth | |
| Description | This indicator provides an insight on the market occupancy rate of products produced by the enterprise, and the ability enterprises control the market. The expansion of the market share can make enterprises obtain some kind of monopoly, further not only bring monopoly profits but also maintain a competitive advantage. | |
| Unit rate | Percentage of the company’s main products in the main sales market. | |
| Rating | a. Less than 20% | 0 |
| b. 20–40% | 0.25 | |
| c. 40–60% | 0.50 | |
| d. 60–80% | 0.75 | |
| e. More than 80% | 1 | |
| Indicator name | C2. Technology and Research Development | |
| Second Level | B1. Growth | |
| Description | This indicator provides an insight on R & D ability of enterprises to meet realistic or potential market demand, through certain material and technical route, using appropriate methods and means. For this purpose, this indicator is the percent of the staffs, who engaged in technology research and development, accounts for all employees. | |
| Unit rate | Percentage of personnel involved in R & D activities. | |
| Rating | a. Less than 1% | 0 |
| b. 1–2% | 0.25 | |
| c. 2–3% | 0.50 | |
| d. 3–4% | 0.75 | |
| e. More than 4% | 1 | |
| Indicator name | C3. Customer Service | |
| Second Level | B1. Growth | |
| Description | This indicator provides an insight on customer oriented values. Any measures to improve customer satisfaction degree can be considered as the scope of customer service. For this purpose, this indicator accesses the staff percent who engaged in customer service. | |
| Unit rate | Percentage of personnel involved in customer service. | |
| Rating | a. Less than 1% | 0 |
| b. 1–2% | 0.25 | |
| c. 2–3% | 0.50 | |
| d. 3–4% | 0.75 | |
| e. More than 4% | 1 | |
| Indicator name | C4. Product Renewal Rate | |
| Second Level | B2. Security | |
| Description | This indicator provides an insight on product renewal ability of enterprises to meet realistic or potential market demand, through certain material and technical route, using appropriate methods and means. For this purpose, this indicator is the ratio of new product output value to the total industrial output value, so as to reflect the status of the technological innovation results in the upgrading of the enterprise products. | |
| Unit rate | Percentage of new product output value to the total output value. | |
| Rating | a. Less than 10% | 0 |
| b. 10–20% | 0.25 | |
| c. 20–30% | 0.50 | |
| d. 30–40% | 0.75 | |
| e. More than 40% | 1 | |
| Indicator name | C5. Receivables Turnover Ratio | |
| Second Level | B2. Security | |
| Description | This indicator provides an insight on receivables turnover ability of enterprises to meet financing ability and capital security, If the company’s accounts receivable can be recovered in time, the company’s capital efficiency can be greatly improved. | |
| Unit rate | Percentage of actual payment and should be received. | |
| Rating | a. Less than 50% | 0 |
| b. 50–60% | 0.25 | |
| c. 60–70% | 0.50 | |
| d. 70–80% | 0.75 | |
| e. More than 80% | 1 | |
| Indicator name | C6. Product Sales Rate | |
| Second Level | B2. Security | |
| Description | This indicator reflect the sale level of product, analysis of production and marketing cohesion, study the degree of products meet the needs of society. Product sales rate can be very intuitive to see the sales of the product, thereby increasing profits. | |
| Unit rate | Percentage of sales value and total value of out-put. | |
| Rating | a. Less than 60% | 0 |
| b. 60–70% | 0.25 | |
| c. 70–80% | 0.50 | |
| d. 80–90% | 0.75 | |
| e. More than 90% | 1 | |
| Indicator Name | C7. Products Traceability | |
|---|---|---|
| Second Level | B3. Law Compliance | |
| Description | This indicator provides an insight on food traceability and risk management and control. For this purpose, this indicator assesses the traceability adoption and implementation to provide the means to trace the products and potential recall across the supply chain, from farm to folk. For this purpose, this indicator accesses the proportion of product can be traceable within one company. | |
| Unit rate | Percentage of products that can be traced back. | |
| Rating | a. No traceability system. | 0 |
| b. Less than 30% | 0.25 | |
| c. Between 30–60% | 0.50 | |
| d. Between 60–90% | 0.75 | |
| e. More than 90% | 1 | |
| Indicator name | C8. Contract Compliance Rate | |
| Second Level | B3. Law Compliance | |
| Description | This indicator provides an insight on the ratio of the actual delivery amount stipulated in the contract goods. For this purpose, this indicator assesses the fulfilment of important indicators. Enterprise contract credit rating have third grade nine. Level means: AAA, very good; AA, fine; A, better; BBB, acceptable; BB, general; B, subpar; CCC, poor; CC, bad C, very bad. For this purpose, this indicator accesses contract execution rate at what level. | |
| Unit rate | Percentage of contract compliance. | |
| Rating | a. Less than 20% | 0 |
| b. 20–40% | 0.25 | |
| c. 40–60% | 0.50 | |
| d. 60–80% | 0.75 | |
| e. More than 80% | 1 | |
| Indicator name | C9. Academic Education and Skills | |
| Second Level | B4. Staffs and Production Safety | |
| Description | This indicator provides an insight on staff capacity development. For enterprises to be sustainable they must provide conditions for stable employment, internal advancement, capacity development and growth for employees’ effective training is to promote the process of the enterprise comprehensive competitiveness. For this purpose, this indicator measures whether employees have opportunities for capacity development and advancement within the enterprise. | |
| Unit rate | Percentage of personnel receiving training (all staff and new staff) | |
| Rating | a. 100% of staff does not receive training. | 0 |
| b. Between 25% and 50% of staff receives training | 0.25 | |
| c. Only new staff receives training. | 0.50 | |
| d. Between 50% and 75% of staff receives training | 0.75 | |
| e. 100% of staff receives training. | 1 | |
| Indicator name | C10. Salary Level of Staff | |
| Second Level | B5. Staffs and Production Safety | |
| Description | This indicator provides an insight on the level of workers average income. Competitive wages can attract high-quality talents, improve enterprise core competitive ability and work efficiency. | |
| Unit rate | The level of workers average income in the same area and industry. | |
| Rating | a. Lowest | 0 |
| b. Lower | 0.25 | |
| c. The same | 0.5 | |
| d. Higher | 0.75 | |
| e. Highest | 1 | |
| Indicator Name | C11. Environmental Evaluation Report and Sustainability Report | |
|---|---|---|
| Second Level | B6. Organisation Management | |
| Description | This indicator provides an insight on the commitment of the enterprise with the reporting and communication of the company’s sustainability and environmental protection. For this purpose, this indicator assesses the development by the company of sustainability and/or environmental reports that are reports published by a company or organization about the environmental impacts caused by its everyday activities. | |
| Unit rate | Existence and status of development of the environment evaluation report and/or sustainability report | |
| Rating | a. Has not published any environment evaluation and sustainability report. | 0 |
| b. Has not published any environment evaluation and sustainability report yet, but is planning to elaborate them. | 0.3 | |
| c. Has not published any environment evaluation and sustainability report yet, but currently in the process of developing them. | 0.6 | |
| d. Has published environment evaluation and sustainability reports. | 1 | |
| Indicator name | C12 Department of Environmental Protection | |
| Second Level | B6. Organisation Management | |
| Description | This indicator provides an insight on how the enterprises are in accordance with the national laws, regulations, policies, to protect and improve the living environment and ecological environment, prevent and control pollution and other public hazards. For this purpose, this indicator assesses if the enterprise set up a special section or department to manage the environmental issues. | |
| Unit rate | Status of the environmental protection department | |
| Rating | a. Has no department responsible for the environmental protection. | 0 |
| b. Has no department responsible for the environmental protection yet, but planning to set it up in the near future. | 0.3 | |
| c. The department responsible for the environmental protection is currently under development. | 0.6 | |
| d. Has a department responsible for the environmental protection. | 1 | |
| Indicator name | C13. Enterprise’s Regulation and Management System for The Environmental Protection | |
| Second Level | B6. Organisation Management | |
| Description | This indicator provides an insight on development and improvement of management system in enterprise. For this purpose, this indicator assesses if the enterprise establish an adequate management system. | |
| Unit rate | It is provided enterprise’s regulation and guidelines on environment protecting or some evidences to show the efforts for regulation and guidelines by the enterprise. | |
| Rating | a. Has no regulation and guidelines for the environment protection. | 0 |
| b. Has no regulation and guidelines for the environment protection yet, but planning to establish one. | 0.3 | |
| c. Is currently in the process of establishing a regulation and guidelines for the environment protection. | 0.6 | |
| d. Has a regulation and guidelines for the environment protection. | 1 | |
| Indicator name | C14. Emergency Contingency Plan Formulation | |
| Second Level | B6. Organisation Management | |
| Description | This indicator provides an insight on environment affairs response ability. For this purpose, this indicator assesses if the enterprises to set emergency plans of environment. | |
| Unit rate | Existence of written emergency contingency plans. | |
| Rating | a. No | 0 |
| b. Yes | 1 | |
| Indicator name | C15. Equipment Purchase Standard | |
| Second Level | B7. Production Management | |
| Description | This indicator provides an insight on energy-saving awareness for the equipment procurement. For this purpose, this indicator assesses whether the enterprises consider the energy efficiency when purchasing production equipment. | |
| Unit rate | Percentage of production equipment purchases in which energy efficiency has been considered. | |
| Rating | a. Never | 0 |
| b. Rarely | 0.25 | |
| c. Occasionally | 0.50 | |
| d. Often | 0.75 | |
| e. Always | 1 | |
| Indicator name | C16. Material Purchase Standard | |
| Second Level | B7. Production Management | |
| Description | This indicator provides an insight on environmental awareness for raw materials standard. For this purpose, this indicator assesses whether the enterprises consider ecological standards when purchasing raw materials. | |
| Unit rate | Percentage of raw material purchases in which ecological standards have been considered. | |
| Rating | a. Never | 0 |
| b. Rarely | 0.25 | |
| c. Occasionally | 0.50 | |
| d. Often | 0.75 | |
| e. Always | 1 | |
| Indicator name | C17. Water Saving Measures and Technologies | |
| Second Level | B8. Energy and Water Management | |
| Description | This indicator assesses the presence of technologies that have achieved a decrease in water consumption and thus, avoid that enterprise contributes to problematic levels of water scarcity. | |
| Unit rate | Number of technologies adopted to save water during the last year. | |
| Rating | a. None | 0 |
| b. One measure or technology | 0.3 | |
| c. Two measures or technologies | 0.6 | |
| d. More than three measures or technologies | 1 | |
| Indicator name | C18. Energy Saving Measures and Technologies | |
| Second Level | B8. Energy and Water Management | |
| Description | This indicator provides an insight on energy-saving awareness. For this purpose, this indicator assesses the number of technologies were adopted by the enterprise that have effectively saved energy. | |
| Unit rate | Number of technologies adopted to save energy during the last year. | |
| Rating | a. None | 0 |
| b. One measure or technology | 0.3 | |
| c. Two measures or technologies | 0.6 | |
| d. More than three measures or technologies | 1 | |
| Indicator name | C19. Waste Water Treatment | |
| Second Level | B9. Pollution Management | |
| Description | This indicator checks the number of written measures and implemented technologies adopted by the enterprise to treat the sewages. | |
| Unit rate | Number of written measures and technologies adopted to treat waste water by the company with positive results in the water treatment during the last year. | |
| Rating | a. None | 0 |
| b. One measure or technology implemented | 0.3 | |
| c. Two measures or technologies implemented | 0.6 | |
| d. More than three measures and technologies | 1 | |
| Indicator name | C20. Air Pollution Management | |
| Second Level | B9. Pollution Management | |
| Description | This indicator checks the number of written measures and implemented technologies adopted by the enterprise to treat the air emissions. | |
| Unit rate | Number of written measures and technologies adopted to treat air emissions by the company with positive results during the last year. | |
| Rating | a. None | 0 |
| b. One measure or technology implemented | 0.3 | |
| c. Two measures or technologies implemented | 0.6 | |
| d. More than three measures and technologies | 1 | |
| Indicator name | C21. Solid Waste Treatment | |
| Second Level | B9. Pollution Management | |
| Description | This indicator checks the number of written measures and implemented technologies adopted by the enterprise to treat the solid wastes generated by its operation. | |
| Unit rate | Number of measures and technologies adopted to treat solid wastes generated by the company with positive results during the last year. | |
| Rating | a. None | 0 |
| b. One measure or technology implemented | 0.3 | |
| c. Two measures or technologies implemented | 0.6 | |
| d. More than three measures and technologies | 1 | |
| Indicator name | C22. Recycle and Comprehensive Utilisation | |
| Second Level | B9. Pollution Management | |
| Description | The generation of wastes and in particular of hazardous wastes creates disposal problems that can cause social problems (health risks, noxious gas), environmental pollution (leaching from inappropriate disposal, gaseous emissions) and economic damage (cost of disposal and rehabilitation). Therefore, waste generation should be reduced to the minimum in value chains. | |
| Unit rate | This indicator measures all practices and activities that have been implemented to effectively reduce the quantities of, and hazards derived from, waste generated by an enterprise’ operations. | |
| Rating | a. Has no recycle and comprehensive utilisation for the environment protection. | 0 |
| b. Has no recycle and comprehensive utilisation for the environment protection yet, but is planning to establish one. | 0.3 | |
| c. Is currently in the process of establishing a recycle and comprehensive utilisation for the environment protection. | 0.6 | |
| d. Has a recycle and comprehensive utilisation for the environment protection. | 1 | |
| Sustainability of Enterprises | First level | Second level | Third level indicators |
| A1-Economic Sustainability | B1-Growth | C1-Market share | |
| C2-Technology and Research Development | |||
| C3-Customer service | |||
| B2-Security | C4-Product renewal rate | ||
| C5-Asset-liability ratio | |||
| C6-Product sales rate | |||
| A2-Social Sustainability | B3-Law compliance | C7-Products Traceability | |
| C8-Contract Compliance Rate | |||
| B4-Staff and production safety | C9-Academic education and skills | ||
| B5-employee benefits | C10-Salary level of staff | ||
| A3-Environmental Sustainability | B6-Organization and management | C11-Environment Evaluation Report and Sustainability Report | |
| C12-Department of Environmental Protection | |||
| C13-Enterprise’s regulation and guidelines on Environment Protection | |||
| C14-Environmental accident emergency plan formulation | |||
| B7-Production preparation | C15-Equipment Purchase Standard | ||
| C16-Material Purchase Standard | |||
| B8-Energy and Water management | C17-water saving measures and technology | ||
| C18-energy saving measures and technology | |||
| B9-Waste management | C19-Waste water treatment | ||
| C20-Air pollution management | |||
| C21-Solid waste treatment | |||
| C22-Waste reduction practices |
| Scale | Meaning |
|---|---|
| 1 | The two elements have the equal importance |
| 3 | The former element is slightly more important than the latter element |
| 5 | The former element is essentially more important than the latter element |
| 7 | The former element is intensity more important than the latter element |
| 9 | The former element is Extremely more important than the latter element |
| 2,4,6,8 | The middle value of the adjacent judgment |
| Judgment System | A1 | A2 | A3 |
|---|---|---|---|
| A1 | 1.0000 | 2.4607 | 1.6887 |
| A2 | 0.4064 | 1.0000 | 0.6553 |
| A3 | 0.5922 | 1.5259 | 1.0000 |
| n | 1 | 2 | 3 | 4 | 5 | 6 | 7 | 8 | 9 | 10 |
|---|---|---|---|---|---|---|---|---|---|---|
| RI | 0 | 0 | 0.58 | 0.90 | 1.12 | 1.24 | 1.32 | 1.41 | 1.45 | 1.49 |
| Judgment System | λmax | CI | CR |
|---|---|---|---|
| 3.0158 | 0.0158 | 0.0272 | |
| 3.0001 | 0.0001 | 0.0002 | |
| 4.0088 | 0.0088 | 0.0098 | |
| 4.0059 | 0.0059 | 0.0065 | |
| 4.0042 | 0.0042 | 0.0046 | |
| 4.0042 | 0.0042 | 0.0047 |
| Enterprise sustainability 1.0000 | First level | Second level | Third level indicators |
| A1-Economic Sustainability 0.5032 | B1-Growth 0.2956 | C1-Market share 0.0406 | |
| C2-Technology and Research Development 0.1161 | |||
| C3-Customer service 0.0530 | |||
| B2-Security 0.2076 | C4-Product renewal rate 0.0860 | ||
| C5-Asset-liability ratio 0.0777 | |||
| C6-Product sales rate 0.1299 | |||
| A2-Social Sustainability 0.2198 | B3-Law compliance 0.1395 | C7-Products Traceability 0.1008 | |
| C8-Contract Compliance Rate 0.0388 | |||
| B4-Staff and production safety 0.0504 | C9-Academic education and skills 0.0504 | ||
| B5-Employee benefits 0.0300 | C10-Salary level of staff 0.0300 | ||
| A3-Environmental Sustainability 0.2769 | B6-Organization and management 0.1145 | C11-Environment Evaluation Report and Sustainability Report 0.0558 | |
| C12-Department of Environmental Protection 0.0214 | |||
| C13-Enterprise’s regulation and guidelines on Environment Protection 0.0277 | |||
| C14-Environmental accident emergency plan formulation 0.0097 | |||
| B7-Production preparation 0.0496 | C15-Equipment Purchase Standard 0.0263 | ||
| C16-Material Purchase Standard 0.0233 | |||
| B8-Energy and Water management 0.0565 | C17-water saving measures and technology 0.0308 | ||
| C18-energy saving measures and technology 0.0257 | |||
| B9-Waste management 0.0563 | C19-Waste water treatment 0.0092 | ||
| C20-Air pollution management 0.0122 | |||
| C21-Solid waste treatment 0.0148 | |||
| C22-Waste reduction practices 0.0202 |
| Performance | Score |
|---|---|
| Best | 0.8–1 |
| Good | 0.6–0.8 |
| Moderate | 0.4–0.6 |
| Limited | 0.2–0.4 |
| Unacceptable | 0–0.2 |
| First Level Index | Best | Good | Moderate | Limited | Unacceptable |
|---|---|---|---|---|---|
| Economic sustainability | 0.4–0.5032 | 0.3–0.4 | 0.2–0.3 | 0.1–0.2 | 0–0.1 |
| Social sustainability | 0.16–0.2198 | 0.12–0.16 | 0.08–0.12 | 0.04–0.08 | 0–0.04 |
| Environmental sustainability | 0.2–0.2769 | 0.15–0.2 | 0.1–0.15 | 0.05–0.1 | 0–0.05 |
| Second Level Index | Best | Good | Moderate | Limited | Unacceptable |
|---|---|---|---|---|---|
| B1. Growth | 0.24–0.2956 | 0.18–0.24 | 0.12–0.18 | 0.06–0.12 | 0–0.06 |
| B2. Security | 0.16–0.2075 | 0.12–0.16 | 0.08–0.12 | 0.04–0.08 | 0–0.04 |
| B3.Law compliance | 0.1–0.1395 | 0.075–0.1 | 0.05–0.075 | 0.025–0.05 | 0–0.025 |
| B4. Staffs and production safety | 0.04–0.0504 | 0.03–0.04 | 0.02–0.03 | 0.01–0.02 | 0–0.01 |
| B5. Employee benefits | 0.024–0.03 | 0.018–0.024 | 0.012–0.018 | 0.006–0.012 | 0–0.006 |
| B6. Organisation management | 0.08–0.1145 | 0.06–0.08 | 0.04–0.06 | 0.02–0.04 | 0–0.02 |
| B7. Production preparation | 0.04–0.0496 | 0.03–0.04 | 0.02–0.03 | 0.01–0.02 | 0–0.01 |
| B8. Energy and water management | 0.04–0.0565 | 0.03–0.04 | 0.02–0.03 | 0.01–0.02 | 0–0.01 |
| B9. Waste management | 0.04–0.0563 | 0.03–0.04 | 0.02–0.03 | 0.01–0.02 | 0–0.01 |
| Third Level Index | Best | Good | Moderate | Limited | Unacceptable |
|---|---|---|---|---|---|
| C1-Market share | 0.0320–0.0406 | 0.0240–0.0320 | 0.0160–0.0240 | 0.0080–0.0160 | 0–0.0080 |
| C2-Technology and Research Development | 0.0800–0.1161 | 0.0600–0.0800 | 0.0400–0.0600 | 0.0200–0.0400 | 0–0.0200 |
| C3-Customer service | 0.0400–0.0530 | 0.0300–0.0400 | 0.0200–0.0300 | 0.0100–0.0200 | 0–0.0100 |
| C4-Product renewal rate | 0.0690–0.0860 | 0.0520–0.0690 | 0.0350–0.0520 | 0.0180–0.0350 | 0–0.0180 |
| C5-Asset-liability ratio | 0.0600–0.0777 | 0.0450–0.0600 | 0.0300–0.0450 | 0.0150–0.0300 | 0–0.0150 |
| C6-Product sales rate | 0.1000–0.1299 | 0.0750–0.1000 | 0.0500–0.0750 | 0.0250–0.0500 | 0–0.0250 |
| C7-Products Traceability | 0.0800–0.1008 | 0.0600–0.0800 | 0.0400–0.0600 | 0.0200–0.0400 | 0–0.0200 |
| C8-Contract Compliance Rate | 0.0320–0.0388 | 0.0240–0.0320 | 0.0160–0.0240 | 0.0080–0.0160 | 0–0.0080 |
| C9-Academic education and skills | 0.0400–0.0504 | 0.0300–0.0400 | 0.0200–0.0300 | 0.0100–0.0200 | 0–0.0100 |
| C10-Salary level of staff | 0.0240–0.030 | 0.0180–0.0240 | 0.0120–0.0180 | 0.0060–0.0120 | 0–0.0060 |
| C11-Environment Evaluation Report and Sustainability Report | 0.0400–0.0558 | 0.0300–0.0400 | 0.0200–0.0300 | 0.0100–0.0200 | 0–0.0100 |
| C12-Department of Environmental Protection | 0.0160–0.0214 | 0.0120–0.0160 | 0.0080–0.0120 | 0.0040–0.0080 | 0–0.0040 |
| C13-Enterprise’s regulation and guidelines on environment protection | 0.0200–0.0277 | 0.0150–0.0200 | 0.0100–0.0150 | 0.0050–0.0100 | 0–0.0050 |
| C14-Environmental accident emergency plan formulation | 0.0080–0.0097 | 0.0060–0.0080 | 0.0040–0.0060 | 0.0020–0.0040 | 0–0.0020 |
| C15-Equipment Purchase Standard | 0.0200–0.0263 | 0.0150–0.0200 | 0.0100–0.0150 | 0.0050–0.0100 | 0–0.0050 |
| C16-Material Purchase Standard | 0.0200–0.0233 | 0.0150–0.0200 | 0.0100–0.0150 | 0.0050–0.0100 | 0–0.0050 |
| C17-Water saving measures and technology | 0.0240–0.0308 | 0.0180–0.0240 | 0.0120–0.0180 | 0.0060–0.0120 | 0–0.0060 |
| C18-Energy saving measures and technology | 0.0200–0.0257 | 0.0150–0.0200 | 0.0100–0.0150 | 0.0050–0.0100 | 0–0.0050 |
| C19-Waste water treatment | 0.0080–0.0092 | 0.0060–0.0080 | 0.0040–0.0060 | 0.0020–0.0040 | 0–0.0020 |
| C20-Air pollution management | 0.0100–0.0122 | 0.0075–0.0100 | 0.0050–0.0075 | 0.0025–0.0050 | 0–0.0025 |
| C21-Solid waste treatment | 0.0100–0.0148 | 0.0075–0.0100 | 0.0050–0.0075 | 0.0025–0.0050 | 0–0.0025 |
| C22-Waste reduction practices | 0.0160–0.0202 | 0.0120–0.0160 | 0.0080–0.0120 | 0.0040–0.0080 | 0–0.0040 |
© 2019 by the authors. Licensee MDPI, Basel, Switzerland. This article is an open access article distributed under the terms and conditions of the Creative Commons Attribution (CC BY) license (http://creativecommons.org/licenses/by/4.0/).
Share and Cite
Cao, S.; Tian, D.; Zhang, X.; Hou, Y. Sustainable Development of Food Processing Enterprises in China. Sustainability 2019, 11, 1318. https://doi.org/10.3390/su11051318
Cao S, Tian D, Zhang X, Hou Y. Sustainable Development of Food Processing Enterprises in China. Sustainability. 2019; 11(5):1318. https://doi.org/10.3390/su11051318
Chicago/Turabian StyleCao, Shuai, Dong Tian, Xiaoshuan Zhang, and Yunxian Hou. 2019. "Sustainable Development of Food Processing Enterprises in China" Sustainability 11, no. 5: 1318. https://doi.org/10.3390/su11051318
APA StyleCao, S., Tian, D., Zhang, X., & Hou, Y. (2019). Sustainable Development of Food Processing Enterprises in China. Sustainability, 11(5), 1318. https://doi.org/10.3390/su11051318