Article

Fusing Sentinel-2 Imagery and ALS Point Clouds for Defining LULC Changes on Reclaimed Areas by Afforestation

1
Department of Forest Management, Geomatics and Forest Economics, Institute of Forest Resources Management, Faculty of Forestry, University of Agriculture in Krakow, Al. 29 Listopada 46, Krakow 31-425, Poland
2
Department of Forest Ecology and Reclamation, Institute of Forest Ecology and Silviculture, Faculty of Forestry, University of Agriculture in Krakow, Al. 29 Listopada 46, Krakow 31-425, Poland
*
Author to whom correspondence should be addressed.
Sustainability 2019, 11(5), 1251; https://doi.org/10.3390/su11051251
Submission received: 21 December 2018 / Revised: 12 February 2019 / Accepted: 22 February 2019 / Published: 27 February 2019
(This article belongs to the Section Environmental Sustainability and Applications)

Abstract

:
The study was performed on two former sulphur mines located in Southeast Poland: Jeziórko, where 216.5 ha of afforested area was reclaimed after borehole exploitation and Machów, where 871.7 ha of dump area was reclaimed after open cast strip mining. The areas were characterized by its terrain structure and vegetation cover resulting from the reclamation process. The types of reclamation applied in these areas were forestry in Jeziórko and agroforestry in the Machów post-sulphur mine. The study investigates the possibility of applying the most recent Sentinel-2 (ESA) satellite imageries for land cover mapping, with a primary focus on detecting and monitoring afforested areas. Airborne laser scanning point clouds were used to derive precise information about the spatial (3D) characteristics of vegetation: the height (95th percentile), std. dev. of relative height, and canopy cover. The results of the study show an increase in afforested areas in the former sulphur mines. For the entire analyzed area of Jeziórko, forested areas made up 82.0% in the year 2000 (Landsat 7, NASA), 88.8% in 2009 (aerial orthophoto), and 95.5% in 2016 (Sentinel-2, ESA). For Machów, the corresponding results were 46.1% in 2000, 57.3% in 2009, and 60.7% in 2016. A dynamic increase of afforested area was observed, especially in the Jeziórko test site, with the presence of different stages of vegetation growth.

1. Introduction

Data sets collected using remote sensing technologies, and processed and integrated into Geographic Information Systems (GIS), can be used to derive 2D and 3D spatial information, a useful tool in land management, forestry, or the reclamation of degraded areas. They are an irreplaceable source of knowledge about changes taking place in the environment, particularly with natural processes resulting from both climatic conditions and anthropogenic factors [1].
Mine workings, as post-industrial landscapes, are examples of land transformation. In Poland, there are many areas where the landscape has changed due to mining or other industrial activities [2,3,4,5,6,7]. National regulations require that all mined lands, whether for coal or other minerals, receive reclamation treatments as soon as possible after mining ceases. The monitoring of forested regions in post-industrial areas is an important and up-to-date issue [8,9,10,11], mainly in terms of the assessment of reclamation results.
Spatial information is the basis for undertaking analyses and provides support in decision-making processes. Current trends and ideas help to pursue improvements and to introduce novel techniques including geoinformation technologies, mainly those used for the monitoring of land use and land cover (LULC) changes, as well as morphometric characterization and determining the spatial structure of vegetation in reclaimed post-mining areas. The aim of this research was to test the possibilities of using the latest publicly available satellite imageries acquired by Sentinel-2 European Space Agency (ESA) for LULC classification, primarily for determining and monitoring the vegetated areas of former sulphur mines. Using Sentinel-2 (ESA) imageries opens up new possibilities [12,13,14], mainly due to its better ground (GSD—Ground Sampling Distance) and spectral resolution, comparing to existing satellite sensors like Landsat 8 (NASA).
Its images are delivered by the ESA and the European Commission, within the structure of the Copernicus programme. The mission consists of launching two satellites, Sentinel-2A and Sentinel-2B, at a height of 705 km into the same orbit, at 180° from each other, with an orbital slope of 98.5°. Sentinel-2A was put into orbit in 2015 and Sentinel-2B in 2017. Both satellites are equipped with modern multispectral scanners with a high resolution 13 spectral bands with resolutions of 10 m, 20 m, and 60 m (GSD). The repetition interval for satellite one is 10 days and 5 days for satellite two. Images from Sentinel-2 represent a new resource and free products with improved parameters for field resolution.
Airborne laser scanning (ALS) point clouds were used to obtain precise spatial information (2D and 3D) on the vegetation structure. ALS, a type of light detection and ranging (LiDAR) technology, offers possibilities for collecting 3D information (point clouds). ALS technology allows the definition of many indices, characterising various aspects of vegetation and provides possibilities for monitoring land cover dynamics [15,16,17,18,19,20,21]. Filtration and classification of the point cloud leads to the production of very precise information about the terrain, generating Digital Terrain Models (DTM), Digital Surface Models (DSM), and normalized Digital Surface Models (nDSM) to represent approximated surface objects [22]. Processing ALS point clouds allow the spatial characteristics of the vegetation to be determined, i.e., its structure [23,24,25,26,27]. The use of processed ALS data allows for an objective and relatively accurate assessment of the spatial structure of vegetation growing over reclaimed areas, e.g., its height above ground level (AGL) and canopy cover.

2. Materials and Methods

The study areas were the former sulphur mines of Jeziórko (50°32′ N; 21°47′ E) and Machów (50°29′ N; 21°36′ E), located in Southeast Poland (Figure 1a), in the Podkarpacie voivodeship, Tarnobrzeg county, in the municipality of Grębów. According to the physico-geographical regionalization of Kondracki [28], the area is in the mesoregion of the Tarnobrzeg Plain, in the Sandomierz Basin macroregion. The area of the Sandomierz Basin macroregion is mainly made of Pleistocene sands and Holocene alluvial mud, under which there is a Miocene sulphur layer. The region has an average annual temperature of +8.2 °C (−1.6 °C in January and +18.7 °C in July) and the average annual precipitation ranges from 550–650 mm. The growing season lasts for 200–220 days per annum [29].
The sulphur deposit in Tarnobrzeg county was discovered in 1953 and the subsequent mining area incorporated mines in Osiek, Machów, Jeziórko, and Grzybów [5,7]. The deposit was estimated at 560 million tons, which constituted about 75% of Poland’s resources [30]. However, the poor national economic situation, the world economic crisis, and the arrival of new technology enabling cheaper sulphur to be obtained from the flotation process meant that the extraction of Polish sulphur ceased to be profitable, resulting in the closure of the mines. Over many years, the exploitation of sulphur contributed to the devastation of the environment and after this ended, reclamation works, individually adjusted to the specifics of each mine, began in earnest.
The Jeziórko mine was in operation from 1967 to 2001 and was the largest borehole mine for sulphur. The borehole method involves pumping in water at a high temperature (140–160 °C) and taking melted sulphur to the surface using a pneumatic lift. Reclamation works started in 1993 and in this case, a forest and ecological type of recovery was considered appropriate. This direction for reclamation suited the ordinates of the mining area’s surface, which dominated over the water table’s ordinates by several metres. The formation of flooded areas became possible because of the subsidence troughs that remained after excavation as well as the introduction of a diverse composition of tree species [31,32,33,34].
In 1968, the Machów sulphur mine was the fourth established mine in the area, and operated until 1992. Open-cast and flotation-refining methods were applied to extract sulphur from the deposit [30]. The reclamation of the Machów sulphur mine spoil dump began in 1976 and lasted until 1998. An agricultural/forest type of reclamation was carried out, covering an area of 871.7 ha. Scarps, hilltops, and broad shelves between scarps were crafted onto the spoil dump. Afforestation took place on the scarps and various species of trees and shrubs were introduced. In the remaining sections, agricultural reclamation was carried out and alfalfa and grasses were sown. After four years, other annual plants were introduced: Spring barley, fodder beet (cultivated on manure), winter wheat, and annual ryegrass [35].
The study was performed on parts of the former sulphur mines in Jeziórko (Figure 1b) and Machów (Figure 1c). For the Jeziórko sulphur mine, this included 216.5 ha of afforested area reclaimed after borehole exploitation and for the Machów sulphur mine, this included 871.7 ha of dump area reclaimed after open-cast strip mining.
The study was based on the following data set:
  • Sentinel-2 image (Sentinel-2A, 8 August 2016, source: ESA);
  • Airborne laser scanning point clouds (source: Head Office of Surveying and Cartography) from the ISOK project (pl. Informatyczny System Osłony Kraju przed nadzwyczajnymi zagrożeniami)—the IT System for the Protection of the Country. From ISOK, the products used were ALS LiDAR point clouds, delivered to almost the entirety of Poland. For the research areas, the point cloud density was 6 pts/m2 (acquired in 2012);
  • Cadastral data (source: Geoportal and webEWID portal).
The Sentinel-2 satellite image was downloaded from the Copernicus Open Access Hub (https://scihub.copernicus.eu). The spectral bands: Blue (B), Green (G), Red (R), and Near Infrared (NIR) were obtained with a 10 m GSD. The preliminary processing was carried out using SNAP (Sentinel Application Platform) software (open-source software, ESA). Linear spreading histograms were created and color compositions RGB and CIR (Color InfraRed) were prepared in ILWIS (Integrated Land and Water Information System) open-source software. The main stage involved generating the supervised (pixel-based) classification of the Sentinel-2 (ESA) image. During field work, the training areas (AOI—Area of Interest) were established using Spectra Precision GNSS (Global Navigation Satellite Systems) receiver and a photointerpretation key for RGB and CIR Sentinel-2 color composition was prepared. For each study area, groups of pixels were defined as an AOI for each LULC class—for Machów, the total number was almost 600 pixels, and for Jeziórko it was around 350 pixels. The supervised (pixel-based) image classification was performed using the Minimum Distance algorithm (ILWIS). An assessment of the classification results was carried out using the Confusion Matrix function (ILWIS), defining the parameters for average accuracy (AA), average reliability (AR), and overall accuracy (OA). The error matrix compares the reference pixels to the classified points. The reference pixels were based on validation points from the test areas (not including the training areas). For each class, validation points (a group of pixels) were defined and the total number for Machów was around 2300 pixels, and for Jeziórko almost 600 pixels.
For the Sentinel-2 (ESA) image classification result, a generalization process was used with the Boundary Clean and Majority Filter function (ArcGIS, Esri). These tools were used to generalise the edges of zones in a raster. The edges were smoothened to varying degrees, either by expanding and shrinking boundaries, or by growing or shrinking zones based on the values within the neighbourhood of individual locations. It should be noted that zones with smaller areas were incorporated into the larger areas’ zones (ArcGIS, Esri).
Finally, the results were converted from a raster to a vector layer in order to compare it to the results of a photointerpretation and on-screen vectorization orthophoto. The Sentinel-2 (ESA) classification results were also compared with previous studies [36]—the classification of Landsat 7 (NASA; 2000) and Landsat 8 (NASA; 2013) images. The participation of individual LULC classes in the research areas was calculated with a polygon tool to calculate each area. The aim was to obtain information about the progress of the forestation process in the reclaimed research areas.
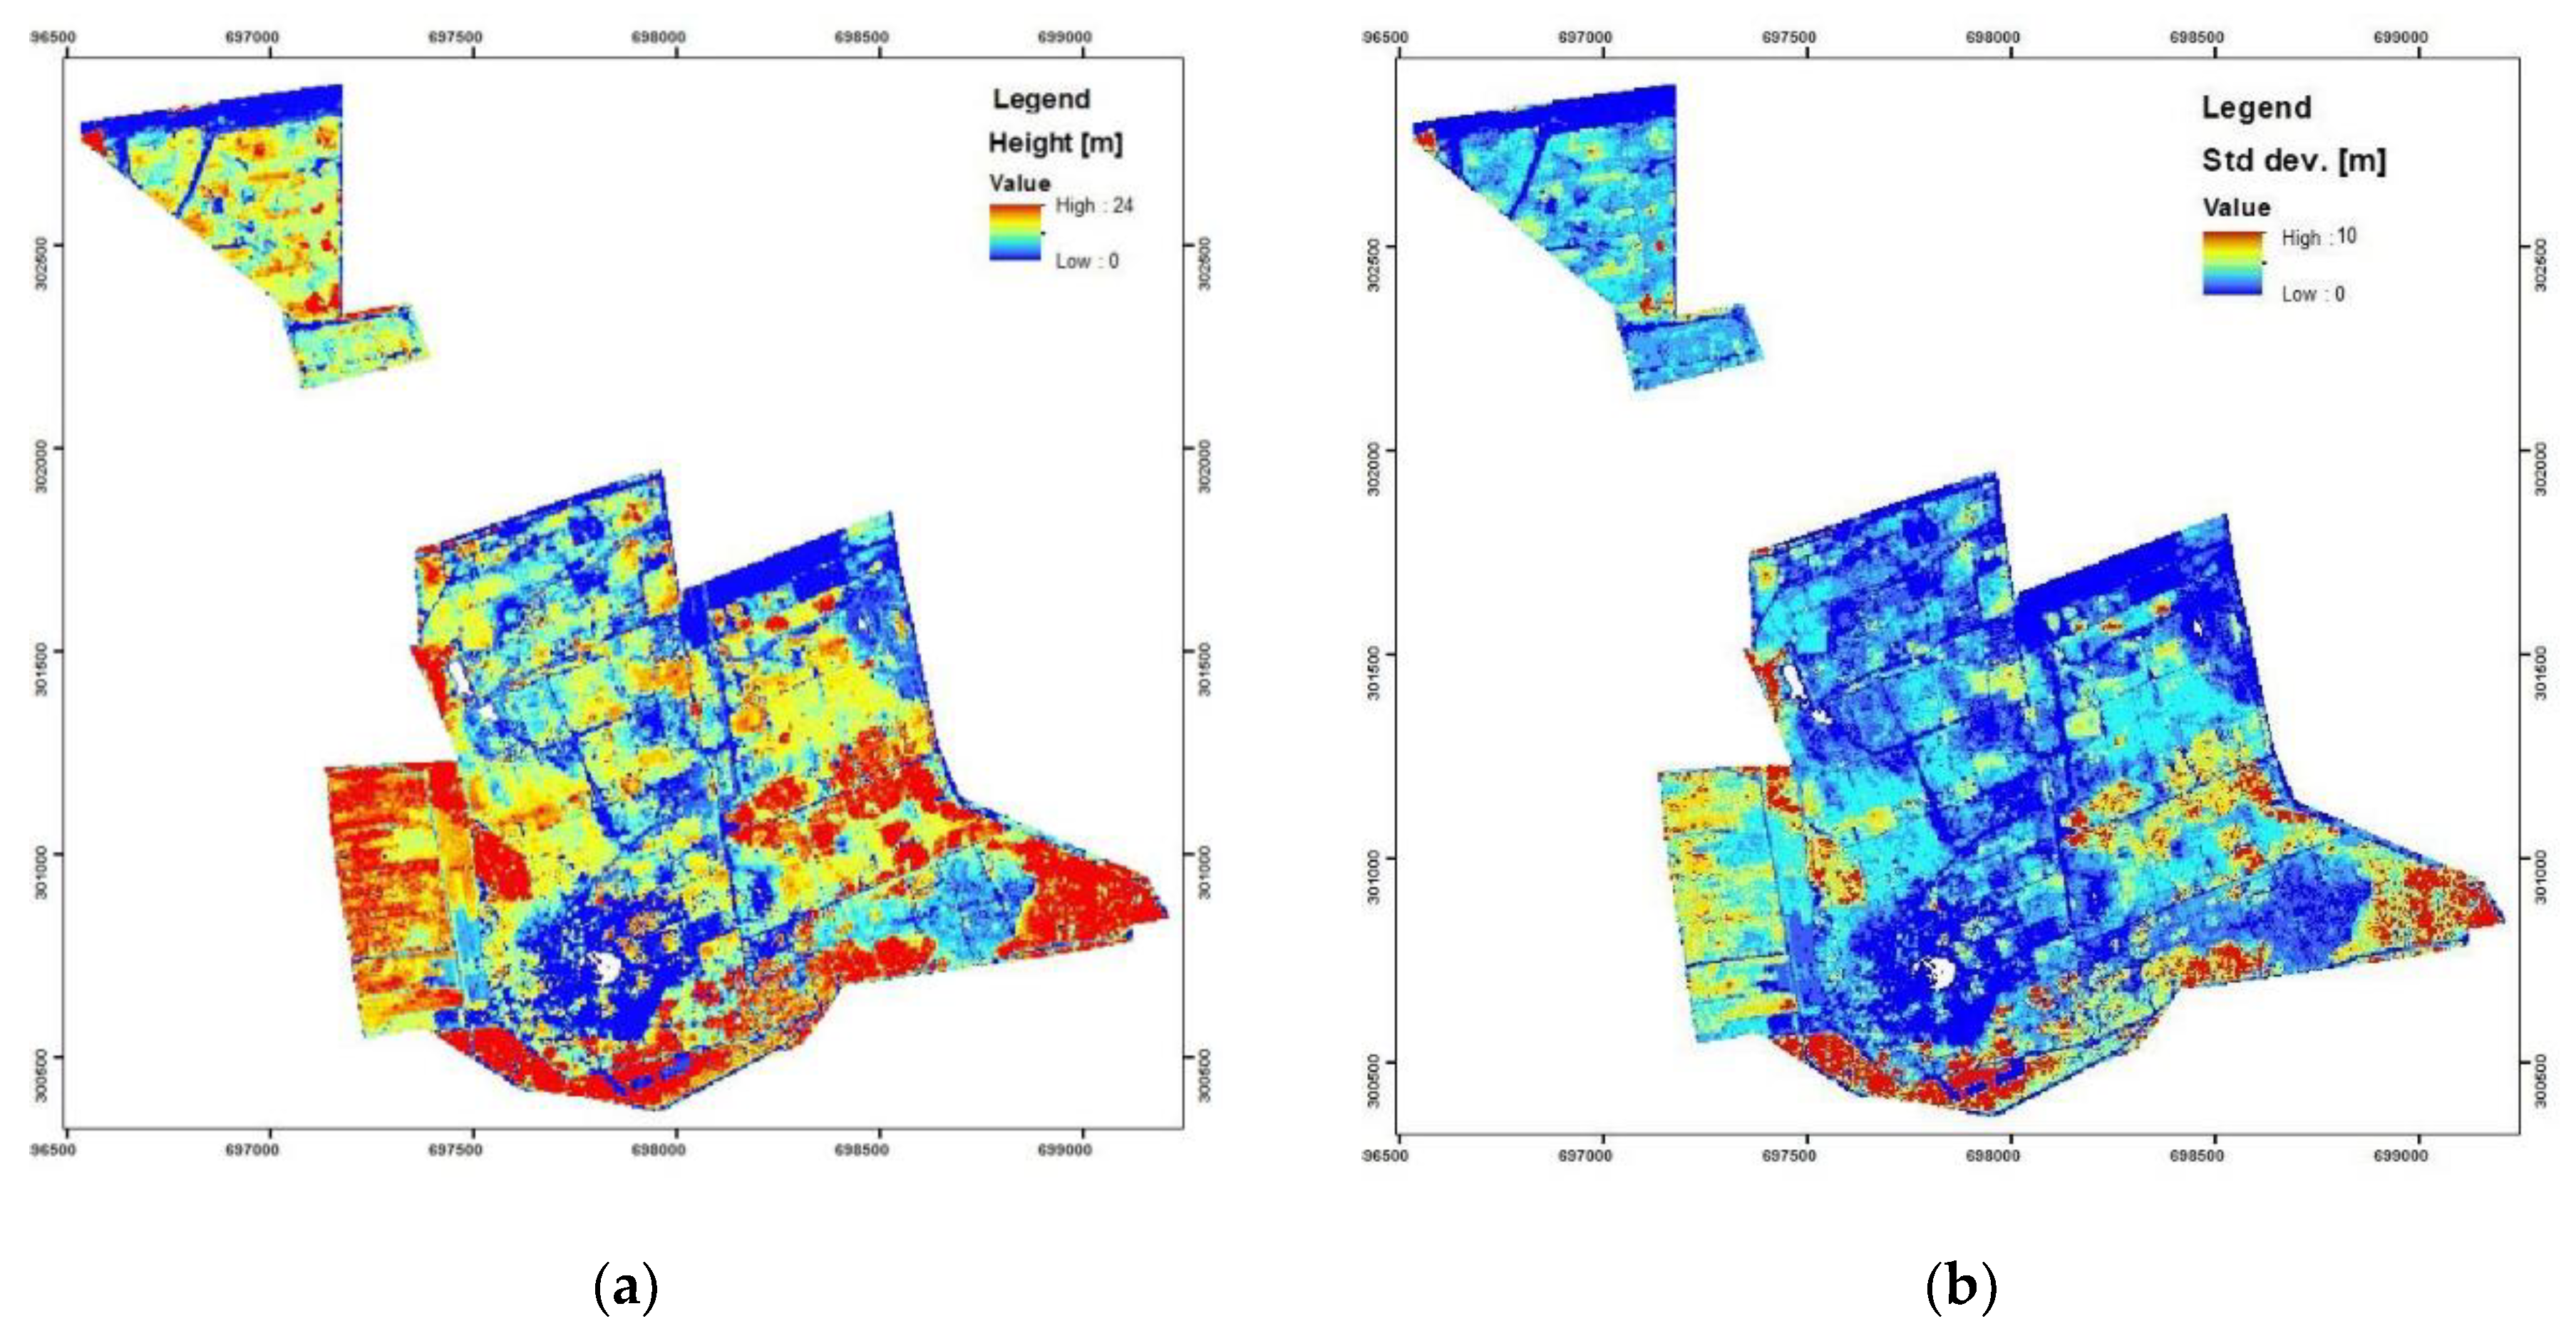
To obtain information about the spatial characteristics of vegetation, airborne laser scanning point clouds were used. The processing of ALS point clouds started by generating: DTM based on the automatic approximation of the points of the ‘ground’ class, DSM based on points from the other classes, and nDSM, where the relative height (AGL) is determined as the difference between the absolute altitude (MSL—Mean Sea Level) of a given point and the place found exactly under this point on the DTM surface. DTM and DSM model generation was performed using the GridSurface Create and Canopy Model functions in FUSION Version 3.50 (McGaughey, Pacific Northwest Research Station) [37]. The nDSM (difference: DSM–DTM) model was generated as a raster (Grid) in ArcGIS (Esri) using Map Algebra. ALS point clouds were also used to obtain precise information about the structure (2D and 3D) of vegetation. Using FUSION software, the vegetation’s height was calculated (GridMetrics and CloudMetrics functions) [37] as the value of the 95th percentile of the ALS point cloud’s relative altitude, indicating a height below 95% of the whole analyzed points’ population. This quantile is often used in the calculation of a tree’s height in airborne laser scanning data [38]. The std. dev. of height and canopy cover (value: 0%–100%) [37] was also calculated.

3. Results

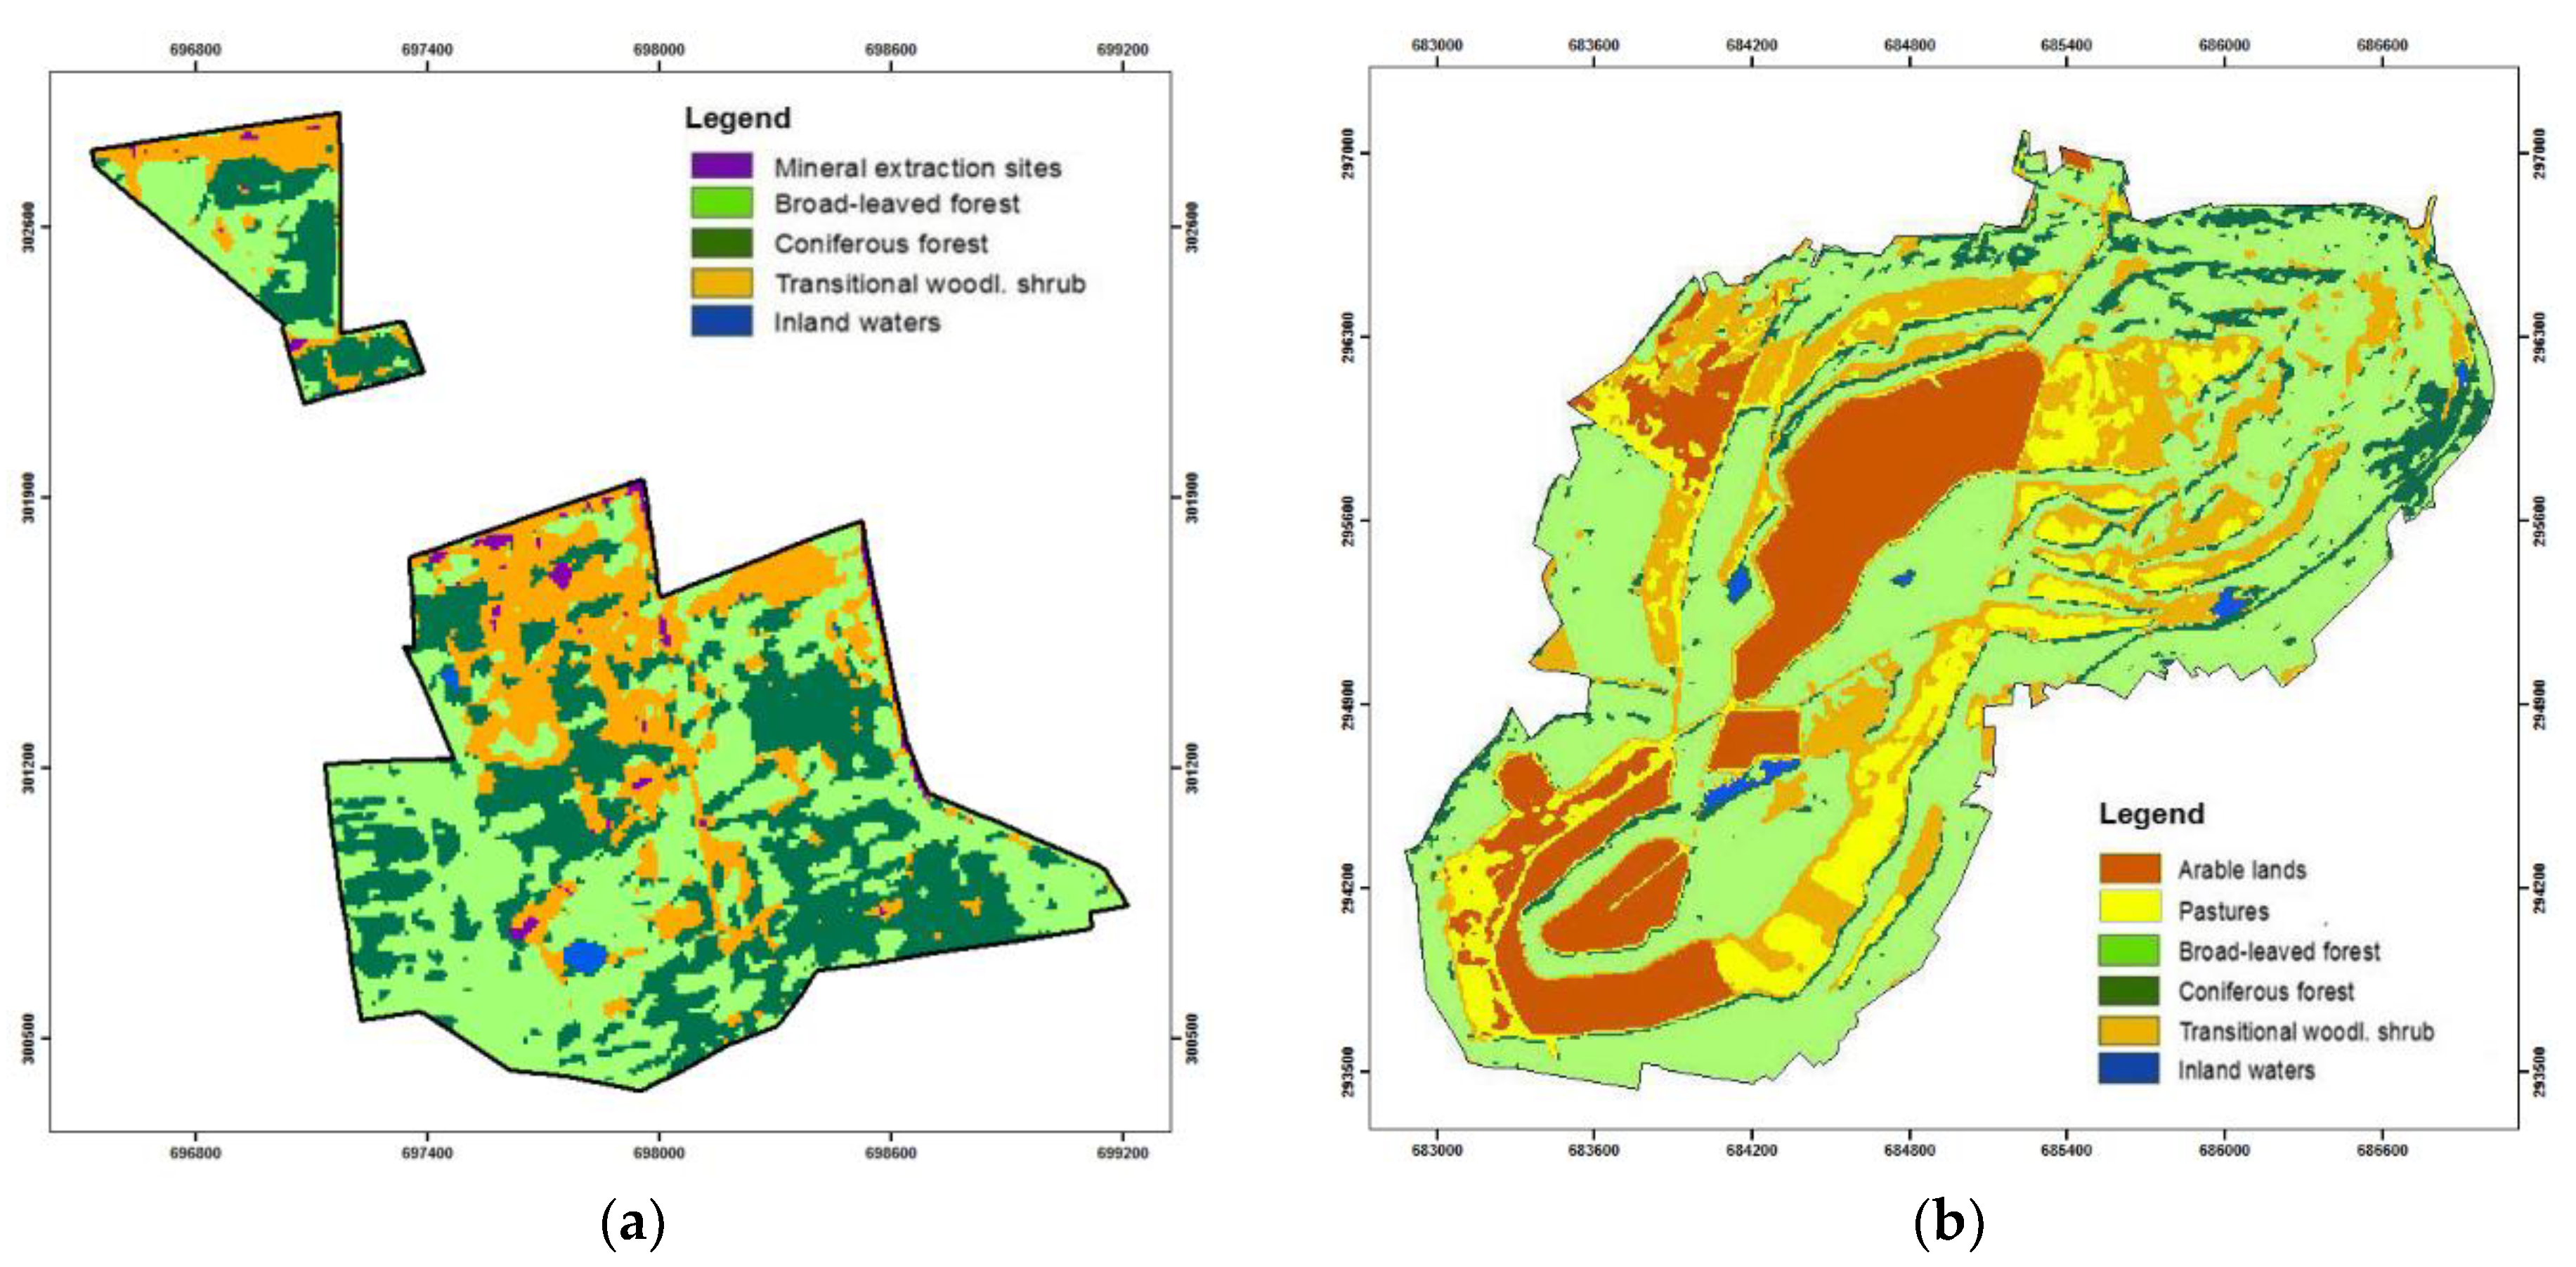
The results of the Sentinel-2 (ESA) image classification are presented in Figure 2. The assessment parameters have the values: For Jeziórko—AA = 86.17%, AR = 87.73%, and OA = 90.54%; for Machów—AA = 95.13%, AR = 95.28%, and OA = 96.82%. The results of the Sentinel-2 (2016) image classification were compared with previous studies of these areas [36]—the results of Landsat 8 (2013) image classification (Figure 3), the results of the photointerpretation and on-screen vectorization orthophoto (2009, Figure 4), and the results of Landsat 7 (NASA; 2000) image classification (Figure 5). The results obtained from the classification of Sentinel-2 (ESA) images gave satisfactory graphical results, better than that of Landsat 7 and Landsat 8 image classification.
Detailed information about the participation of individual LULC classes is given in Table 1 for Jeziórko and in Table 2 for Machów. The results of Landsat 7 (2000), Landsat 8 (2013), Sentinel-2 (2016) image classification, and on-screen vectorization orthophoto (2009) are presented [36].
Based on the results of Sentinel-2 image classification and previous studies [36], the following was established for forested areas (the total value of LULC classes: Coniferous Forest, Broad-leaved Forest, and Transitional Woodland Shrub):
  • Jeziórko constituted 82.0% of the analyzed area in the year 2000, 88.8% in 2009 (showing a 6.8% difference between 2000 and 2009), and 95.5% in 2016 (a 6.5% difference between 2009 and 2016);
  • Machów constituted 46.1% of the analyzed area in the year 2000, 57.3% in 2009 (showing an 11.2% difference between 2000 and 2009), and 60.7% in 2016 (a 3.4% increase from 2009).
The analyzed results of the former sulphur mine areas, showed a spatial range increase in forested areas from 2000 to the present (i.e., the total value of Coniferous Forest, Broad-leaved Forest, and Transitional Woodland Shrub classes), which are presented in Figure 6.
Table 1 and Table 2, and Figure 6 show a dynamic increase in the forested areas. Jeziórko is almost fully covered by forested areas. For Machów, forested areas are the most dominant LULC classes but there are also important agricultural lands; arable lands and pastures covered a total of 38.7% of the analyzed area.
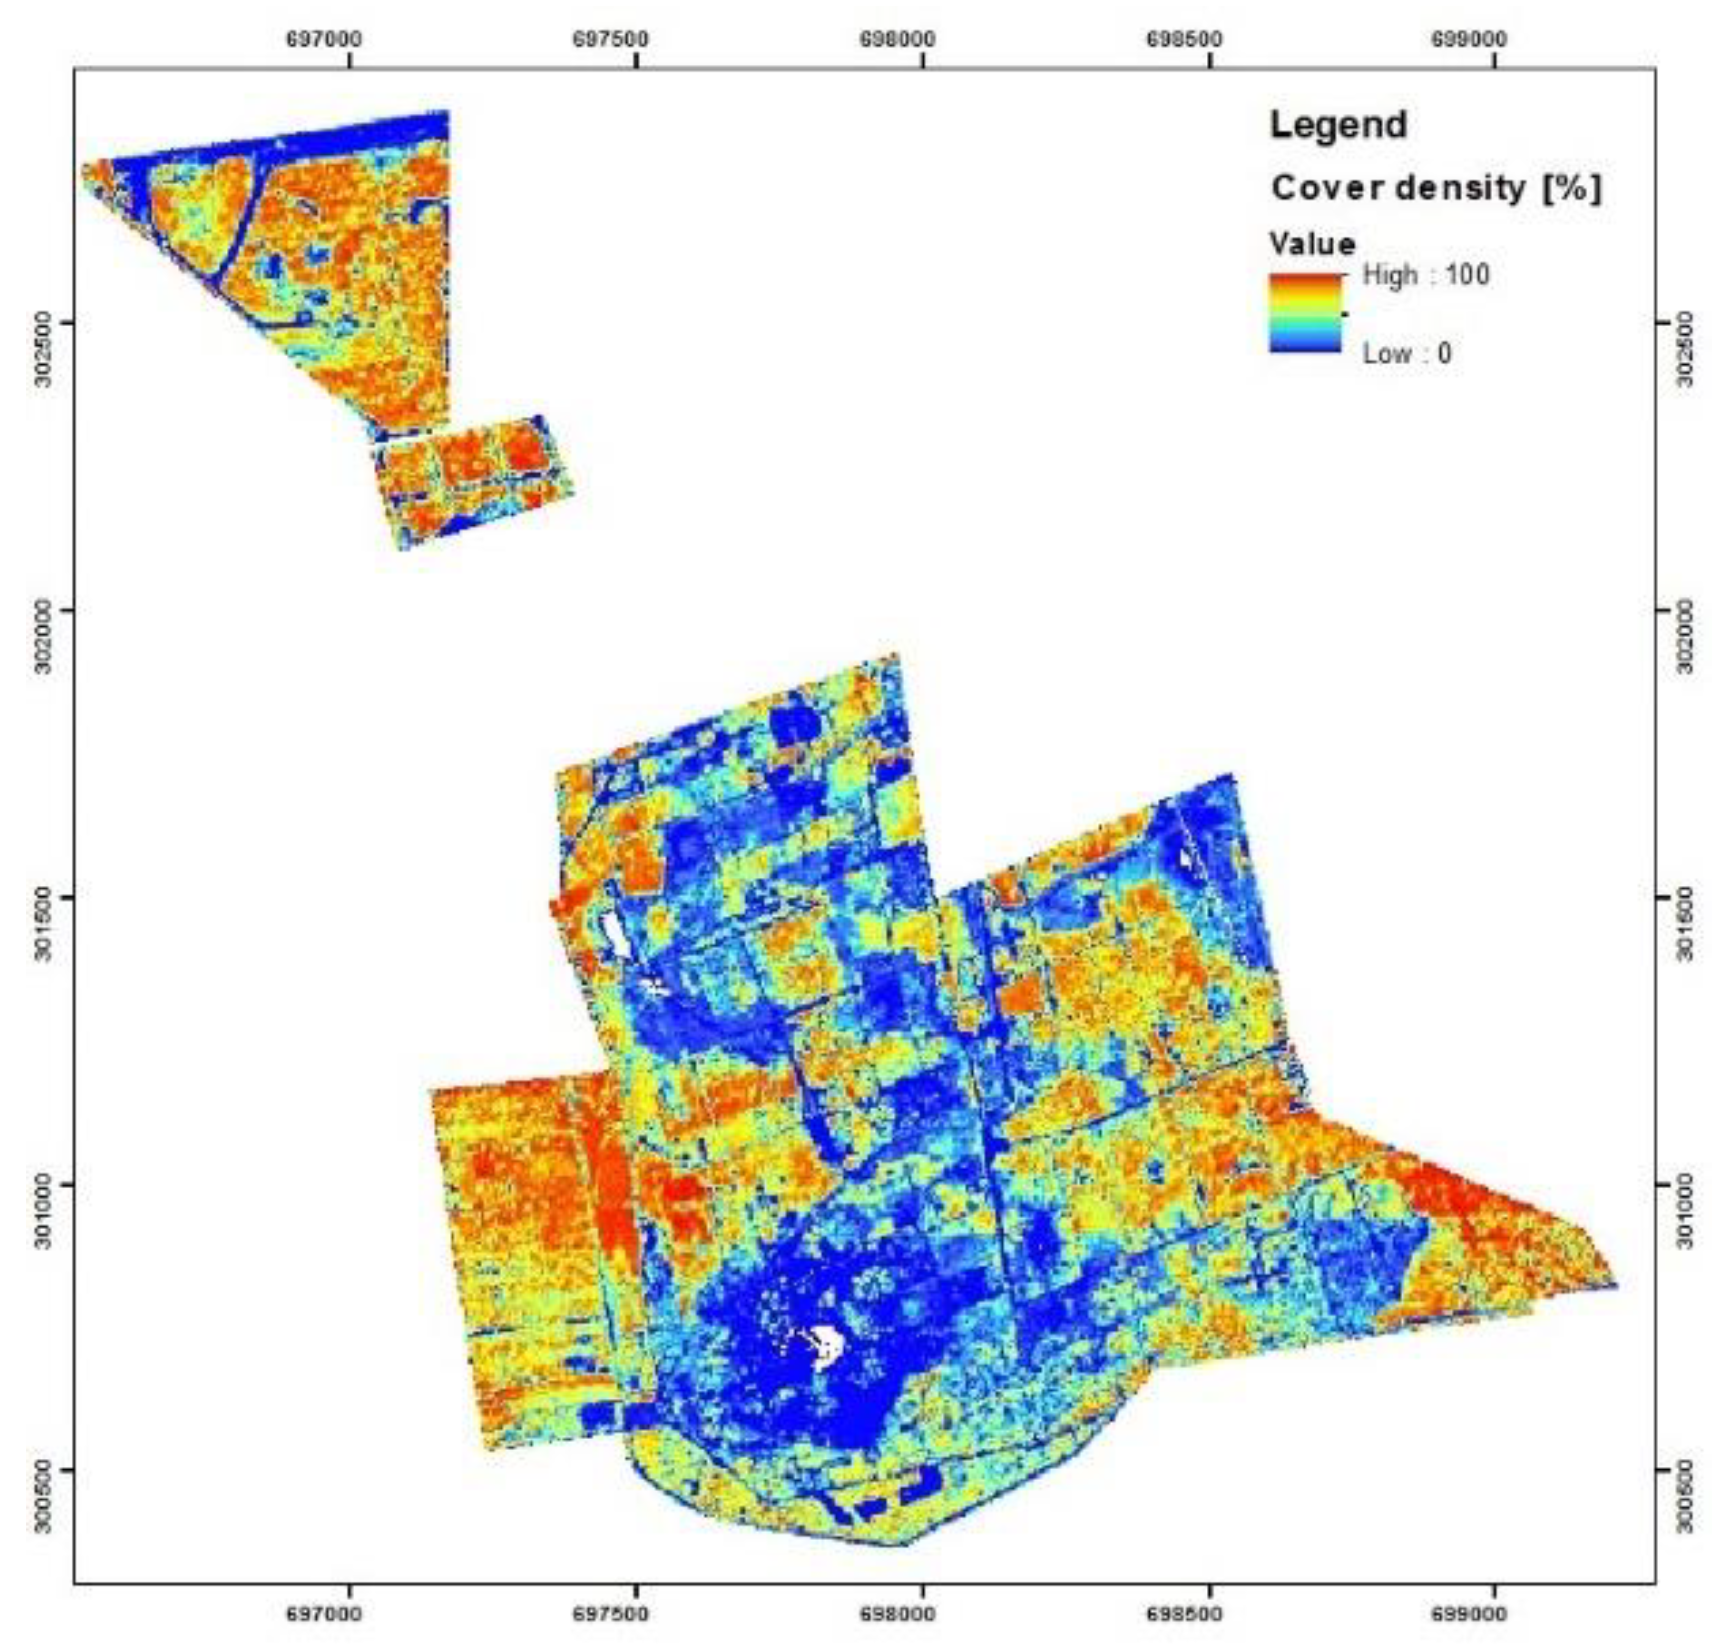
For the Jeziórko area, we can see that the vegetation is at different stages of growth and therefore, it is important to obtain more information about its spatial characteristics. The results of using ALS point clouds for deriving precise information about the height of vegetation (95th percentile) and its std. dev. are presented in Figure 7 and the canopy cover is shown in Figure 8. These parameters, generated based on ALS point clouds, allow for objective and relatively accurate assessments of the spatial structure of the vegetation growing in the area. Parameters from processed LiDAR point clouds suggest that the variation in the height of vegetation and canopy cover (LULC classes: Coniferous Forest, Broad-leaved Forest, and Transitional Woodland Shrub) occurs due to the effect of heavy degradation in this area. Graphical and spatial views of the area’s vegetation structure showed differences in vegetation growth that could not be observed using satellite images alone.

4. Discussion

Reclaimed areas were characterised by a high dispersion of land cover classes, but Sentinel-2 images allowed the correct identification of LULC classes. The results of the Sentinel-2 images’ classification were satisfactory, indicating that it is reasonable to automate the process of the classification of land cover and monitor the increase in forested areas based on them. According to papers on using Sentinel images [12,39,40,41,42,43] and preparing terrain information about reclaimed areas using remote sensing data [10,36,44,45,46,47], research has confirmed the possibility of using Sentinel-2 images for LULC change detection and the monitoring of vegetated areas in reclaimed areas. The essence of this study was to indicate the methodology for the common and widespread detection of LULC class changes and the increase of forested areas’ spatial range based on the newest, generally available satellite imagery—Sentinel-2. For these reasons, in this study, the supervised (pixel-based) classification method was used. More advanced methods such as Geographic Object Based Image Analysis (GEOBIA) [48,49] and other classification methods could also be applied. Using the GEOBIA method for monitoring LULC classes for reclaimed areas was the subject of previous studies [36,50]. GEOBIA could provide better results but requires specialised software and user knowledge. Additionally, results depend on the image’s pixel size. For detecting small LULC changes, the most important method is field-based observation, for training areas (AOI) and for results and validation.
Current LULC classes at the Machów and Jeziórko former sulphur mines, based on Sentinel-2 (ESA) image processing, confirmed there has been an applied type of reclamation in both these areas. This was forestry for Jeziórko and agroforestry for Machów. The Jeziórko area is now almost fully covered by Coniferous forest, Broad-leaved forest, and Transitional woodland shrub with significant participation of LULC classes. At Machów, forested areas (Broad-leaved Forest and Transitional Woodland Shrub) have the largest value but there are also important agricultural lands—Arable Lands and Pastures.
According to previous studies on Jeziórko and Machów, particularly for the Jeziórko area, an increase in forested areas was shown [36,45]. For Jeziórko, a test site analysis of ALS point clouds suggests a significant variation in the height of vegetation and canopy cover. Jeziórko was a heavily degraded area, in which there are still the remains of sulphur mines and a graphical and spatial view of the vegetation structure shows differences in vegetation growth. This indicates an ongoing process of vegetation development, as an effect of the reclamation treatment for this area [29,33,34].

5. Conclusions

The current availability of spatial data obtained with remote sensing technologies provides access to objective and precise information about the surrounding environment. It may be possible to use these geo-data to determine indicators that show the spatial range and structure of vegetation. Remote sensing data allow to build-up time series about LULC classes of reclaimed areas, including areas of dynamically-forming forested areas.
Using Sentinel-2 imageries opens up new possibilities in monitoring the progress of afforestation over any time interval, which is an important aspect in any assessment of the results of reclamation. The application of orthophotos or airborne photos was limited, due to the scarcity of these materials. The availability of Sentinel-2 images and automated procedures for processing, including classification, offers possibilities for monitoring reclaimed areas, especially as the results are highly accurate, and can enable land cover classification for any time interval and permit analysis of LULC changes.
ALS LiDAR technology provides detailed spatial information, allowing for the description of the spatial structure of the vegetation growing on the reclaimed surface. It can provide information about biometrical features, including the height of trees, their biomass and volume, the number per unit area, the density and length of their crowns, the area occupied by vegetation patches and their spatial distribution, and many other features describing the vegetation in greater or lesser detail.
The obtained results may be valuable in the context of the implementation of putting usage remote sensing into practice for monitoring spatial and temporal changes. This is an important ecological issue when examining reclaimed surfaces.

Author Contributions

Conceptualization, M.S.; methodology, M.S.; software, M.S. and K.K.; validation, M.S. and K.K.; formal analysis, M.S.; writing—original draft preparation, M.S., J.L.-C. and M.P.; visualization, M.S.; supervision, M.S.; writing—review, M.S. and P.W.

Funding

The research was financed by the Ministry of Science and Higher Education of the Republic of Poland.

Conflicts of Interest

The authors declare no conflict of interest. The founding sponsors had no role in the design of the study, in the collection, analyses, or the interpretation of data, in the writing of the manuscript, or in the decision to publish the results.

References

  1. Bergen, K.M.; Dronova, I. Observing succession on aspen-dominated landscapes using a remote sensing-ecosystem approach. Landsc. Ecol. 2007, 22, 1395–1410. [Google Scholar] [CrossRef]
  2. Gołda, T. Rekultywacja; Uczelniane Wydawnictwa Naukowo−Dydaktyczne AGH: Kraków, Poland, 2005. [Google Scholar]
  3. Gołda, T.; Haładus, A.; Kulma, R. Geosozologiczne skutki likwidacji kopalń siarki w 19 rejonie Tarnobrzega. Inżynieria Środowiska 2005, 10, 70–72. [Google Scholar]
  4. Hajdo, S.; Klich, J.; Galiniak, G. Ekologiczne i technologiczne osiągnięcia w 40−letniej historii górnictwa otworowego siarki w Polsce. Górnictwo i Geoinżynieria 2007, 31, 199–215. [Google Scholar]
  5. Krzaklewski, W.; Pietrzykowski, M.; Likus, J.; Pająk, M.; Twaróg, A. Characteristic of selected soil properties and plant communities on reclaimed sites and sites left for succession on post-exploitation areas of Grzybów sulfur mine. Uniwersytet Zielonogórski. Zeszyty Naukowe. Inżynieria Środowiska 2016, 41, 78–86. [Google Scholar]
  6. Pająk, M.; Błońska, E.; Szostak, M.; Gąsiorek, M.; Pietrzykowski, M.; Urban, O.; Derbis, P. Restoration of Vegetation in Relation to Soil Properties of Spoil Heap Heavily Contaminated with Heavy Metals. Water Air Soil Pollut. 2018, 229, 1–15. [Google Scholar] [CrossRef] [PubMed]
  7. Pietrzykowski, M.; Krzaklewski, W. Reclamation of mine lands in Poland. In Bio-Geotechnologies for Mine Site Rehabilitation; Prasad, M.N.V., de Campos Favas, P.J., Maiti, S.K., Eds.; Elsevier: Amsterdam, The Netherlands; Oxford-Cambridge, UK, 2017; Volume 27, pp. 493–513. [Google Scholar]
  8. Szostak, M.; Wężyk, P.; Pająk, M.; Hawryło, P.; Lisańczuk, M. Determination of the spatial structure of vegetation on the repository of the mine Fryderyk in Tarnowskie Góry, based on airborne laser scanning from the ISOK project and digital orthophotomaps. Geod. Cartogr. 2015, 64, 87–99. [Google Scholar] [CrossRef]
  9. Wang, J.; Wei, Z.; Wang, O. Evaluating the eco-environment benefit of land reclamation in the dump of an opencast coal mine. Chem. Ecol. 2017, 33, 607–624. [Google Scholar] [CrossRef]
  10. Wężyk, P.; Szostak, M.; Krzaklewski, W.; Pająk, M.; Pierzchalski, M.; Szwed, P.; Hawryło, P.; Ratajczak, M. Landscape monitoring of post-industrial areas using LiDAR and GIS technology. Geod. Cartogr. 2015, 64, 125–137. [Google Scholar] [CrossRef] [Green Version]
  11. Yuan, Y.; Zhao, Z.; Niu, S.; Li, X.; Wang, Y.; Bai, Z. Reclamation promotes the succession of the soil and vegetation in opencast coal mine: A case study from Robinia pseudoacacia reclaimed forests, Pingshuo mine, China. Catena 2018, 165, 72–79. [Google Scholar] [CrossRef]
  12. Forkuor, G.; Dimobe, K.; Serme, I.; Tondoh, J.E. Landsat-8 vs. Sentinel-2: Examining the added value of sentinel-2’s red-edge bands to land-use and land-cover mapping in Burkina Faso. Giscience Remote Sens. 2018, 55, 331–354. [Google Scholar] [CrossRef]
  13. Sekertekin, A.; Marangoz, A.M.; Akcin, H. Pixel-based classification analysis of land use land cover using Sentinel-2 and Landsat-8 data. Int. Arch. Photogramm. Remote Sens. Spat. Inf. Sci.—Isprs Arch. 2017, 42(4W6), 91–93. [Google Scholar] [CrossRef]
  14. Marangoz, A.M.; Sekertekin, A.; Akçin, H. Analysis of land use land cover classification results derived from sentinel-2 image. In Proceedings of the 17th International Multidisciplinary Scientific GeoConference Surveying Geology and Mining Ecology Management, SGEM 2017, Albena and Varna, Bulgaria, 27 June–6 July 2017; pp. 25–32. [Google Scholar]
  15. Bork, E.; Su, J. Integrating LIDAR data and multispectral imagery for enhanced classification of rangeland vegetation: A meta-analysis. Remote Sens. Environ. 2007, 111, 11–24. [Google Scholar] [CrossRef]
  16. Falkowski, M.; Jeffrey, S.; Evans, J.; Martinuzzi, S.; Gessler, P.; Hudak, A. Characterizing forest succession with lidar data: An evaluation for the Inland Northwest, USA. Remote Sens. Environ. 2009, 113, 946–956. [Google Scholar] [CrossRef]
  17. Kolecka, N.; Kozak, J.; Kaim, D.; Dobosz, M.; Ginzler, C.; Psomas, A. Mapping secondary forest succession on abandoned agricultural land with LiDAR point clouds and terrestrial photography. Remote Sens. 2015, 7, 8300–8322. [Google Scholar] [CrossRef]
  18. Singh, K.; Vogler, J.; Shoemaker, D.; Meentemeyer, R. LiDAR-Landsat data fusion for large-area assessment of urban land cover: Balancing spatial resolution, data volume, and mapping accuracy. ISPRS J. Photogramm. Remote Sens. 2012, 74, 110–121. [Google Scholar] [CrossRef]
  19. Szostak, M.; Bednarski, A.; Wężyk, P. Monitoring of secondary forest succession on abandoned farmland using LiDAR point clouds. Geod. Cartogr. 2018, 67, 305–319. [Google Scholar] [CrossRef]
  20. Szostak, M.; Wężyk, P.; Tompalski, P. Aerial orthophoto and airborne laser scanning as monitoring tools for land cover dynamics: A case study from the Milicz Forest District (Poland). Pure Appl. Geophys. 2014, 171, 857–866. [Google Scholar] [CrossRef]
  21. Szostak, M.; Wężyk, P.; Király, G.; Hawryło, P.; Bednarski, A. Automation in the assessment of forest succession dynamics using airborne laser scanning data. In Proceedings of the International Multidisciplinary Scientific GeoConference Surveying Geology and Mining Ecology Management, SGEM, Albena, Bulgaria, 30 June–9 July 2018; pp. 41–48. [Google Scholar] [CrossRef]
  22. Axelsson, P. DEM generation from laser scanner data using adaptive TIN models. Int. Arch. Photogramm. Remote Sens. 2000, XXXIII/4B, 203–210. [Google Scholar]
  23. Andersen, H.E.; Reutebuch, S.E.; McGaughey, R.J. A rigorous assessment of tree height measurements obtained using airborne lidar and conventional field methods. Can. J. Remote Sens. 2006, 32, 355–366. [Google Scholar] [CrossRef]
  24. Hyyppä, J.; Hyyppä, H.; Litkey, P.; Yu, X.; Haggrén, H.; Rönnholm, P.; Pyysalo, U.; Pitkanen, J.; Maltamo, M. Algorithms and methods of airborne laser-scanning for forest measurements. In Laser-Scanners for Forest and Landscape Assessment, Proceedings of the International Archives of Photogrammetry, Remote Sensing, and the Spatial Information Sciences, Freiburg, Germany, 4–6 October 2004; Thies, M., Koch, B., Spiecker, H., Weinacker, H., Eds.; XXXVI–8/W2. [Google Scholar]
  25. McGaughey, R.J.; Carson, W.W.; Reutebuch, S.; Andersen, H.E. Direct measurement of individual tree characteristics from lidar data. In Proceedings of the Annual ASPRS Conference, Denver, CO, USA, 23–28 May 2004; American Society of Photogrammetry and Remote Sensing: Bethesda, MD, USA, 2004. [Google Scholar]
  26. Wężyk, P.; Szostak, M.; Tompalski, P.; Zajączkowski, G. The role of Airborne Laser Scanning in updating and revision of GIS databases—A case study in the Polish State Forest (Chojna District). In Proceedings of the Silvilaser 2010—10th International Conference on LiDAR Applications for Assessing Forest Ecosystems, Freiburg, Germany, 14–17 September 2010. [Google Scholar]
  27. Wężyk, P.; Tompalski, P.; Szostak, M.; Glista, M.; Pierzchalski, M. Describing the selected canopy layer parameters of the Scots pine stands using ALS data. In Proceedings of the SiliviLaser 2008—8th International Conference on LiDAR Applications in Forest Assessment and Inventory, Edinburgh, UK, 17–19 September 2008; pp. 636–645. [Google Scholar]
  28. Kondracki, J. Geografia Regionalna Polski; Wydawnictwo Naukowe PWN: Warszawa, Poland, 2009. [Google Scholar]
  29. Likus-Cieślik, J.; Pietrzykowski, M. Vegetation development and nutrients supply of trees in habitats with high sulfur concentration in reclaimed former sulfur mines Jeziórko (Southern Poland). Environ. Sci. Pollut. Res. 2017, 24, 20556–20566. [Google Scholar] [CrossRef] [PubMed] [Green Version]
  30. Michno, W.; Dziedzic, W.; Czajkowski, E. Przywracanie wartości użytkowych terenom górniczym na przykładzie KiZPS „Siarkopol”. In Proceedings of the Warsztaty Górnicze z Cyklu „Zagrożenia Naturalne W górnictwie”, Świeradów-Zdrój, Poland, 17–19 June 2009; pp. 197–211. [Google Scholar]
  31. Długosiewicz, F. Reclamation of post-industrial sites in the area of the Jeziórko sulhur mine. In Proceedings of the Open-Cast Mine Environmental Reclamation—with Special Focus on the Bełchatów Lignite Mine, Bełchatów, Poland, 8–9 June 1999; pp. 50–59. [Google Scholar]
  32. Likus-Cieślik, J.; Pietrzykowski, M.; Śliwińska-Siuśta, M.; Krzaklewski, W.; Szostak, M. Peliminary assessment of soil sulphur contamination and vegetation characteristic in the vicinity of former boreholes on afforested post-mine site Jeziorko. Geol. Geophys. Environ. 2015, 42, 371–380. [Google Scholar] [CrossRef]
  33. Likus-Cieślik, J.; Pietrzykowski, M.; Szostak, M.; Szulczewski, M. Spatial distribution and concentration of sulfur in relation to vegetation cover and soil properties on a reclaimed sulfur mine site (Southern Poland). Environ. Monit. Assess. 2017, 189, 1–12. [Google Scholar] [CrossRef] [PubMed]
  34. Pietrzykowski, M.; Likus-Cieślik, J. Comprehensive Study of Soil-Plant and Surface Water Chemistry Relationships in Highly S Contaminated Environment on Reforested Former Sulfur Borehole Mine Sites. Sustainability 2018, 10, 2442. [Google Scholar] [CrossRef]
  35. Kowalik, S. Właściwości chemiczne gleb industrioziemnych użytkowanych rolniczo i leśnie na zrekultywowanym zwałowisku Kopalni Siarki „Machów”. Roczniki Gleboznawcze 2004, 55, 239–249. [Google Scholar]
  36. Szostak, M.; Wężyk, P.; Hawryło, P.; Pietrzykowski, M. The analysis of spatial and temporal changes of land cover and land use in the reclaimed areas with the application of airborne orthophotomaps and LANDSAT images. Geod. Cartogr. 2015, 64, 75–86. [Google Scholar] [CrossRef] [Green Version]
  37. McGaughey, R.J. FUSION/LDV: Software for Lidar Data Analysis and Visualization. Software Manual. Available online: https://w3.ual.es/GruposInv/ProyectoCostas/FUSION_manual.pdf (accessed on 20 December 2018).
  38. Næsset, E. Predicting forest stand characteristics with airborne scanning laser using a practical two-stage procedure and field data. Remote Sens. Environ. 2002, 80, 80–99. [Google Scholar] [CrossRef]
  39. Akyürek, D.; Koç, Ö.; Akbaba, E.M.; Sunar, F. Land use/land cover change detection using multi-temporal satellite dataset: A case study in Istanbul new airport. Int. Arch. Photogramm. Remote Sens. Spat. Inf. Sci. 2018, 42(3W4), 17–22. [Google Scholar] [CrossRef]
  40. Bontemps, S.; Arias, M.; Cara, C.; Dedieu, G.; Guzzonato, E.; Hagolle, O.; Defourny, P. Building a data set over 12 globally distributed sites to support the development of agriculture monitoring applications with Sentinel-2. Remote Sens. 2015, 7, 16062–16090. [Google Scholar] [CrossRef]
  41. Haas, J.; Ban, Y. Urban Land Cover and Ecosystem Service Changes based on Sentinel-2A MSI and Landsat TM Data. IEEE J. Sel. Top. Appl. Earth Obs. Remote Sens. 2018, 11, 485–497. [Google Scholar] [CrossRef]
  42. Szostak, M.; Hawryło, P.; Piela, D. Using of Sentinel-2 images for automation of the forest succession detection. Eur. J. Remote Sens. 2018, 51, 142–149. [Google Scholar] [CrossRef]
  43. Whyte, A.; Ferentinos, K.P.; Petropoulos, G.P. A new synergistic approach for monitoring wetlands using Sentinels -1 and 2 data with object-based machine learning algorithms. Environ. Model. Softw. 2018, 104, 40–54. [Google Scholar] [CrossRef]
  44. Pitblado, J.R.; Amiro, B.D. Landsat Mapping of the Industrially Disturbed Vegetation Communities of Sudbury, Canada. Can. J. Remote Sens. 2014, 8, 17–28. [Google Scholar] [CrossRef]
  45. Szostak, M.; Likus-Cieślik, J.; Knapik, K.; Wężyk, P.; Pietrzykowski, M. Analysis of land use and land cover classes for the afforested post-mine site using Sentinel-2 images. In Proceedings of the International Multidisciplinary Scientific GeoConference Surveying Geology and Mining Ecology Management, SGEM, Albena, Bulgaria, 30 June–9 July 2018; pp. 41–48. [Google Scholar] [CrossRef]
  46. Townsend, P.; Helmers, D.; Kingdon, C.; McNeil, B.; de Beurs, K.; Eshleman, K. Changes in the extent of surface mining and reclamation in the Central Appalachians detected using a 1976–2006 LANDSAT time series. Remote Sens. Environ. 2009, 113, 62–72. [Google Scholar] [CrossRef]
  47. Urban, R.; Koska, B.; Moudry, V.; Solsky, M. Terrain of post mining site from airship lidar. In Proceedings of the 16th International Multidisciplinary Scientific GeoConference SGEM 2016, Albena, Bulgaria, 28 June–7 July 2016; pp. 577–584. [Google Scholar] [CrossRef]
  48. Blaschke, T.; Hay, G.J.; Kelly, M.; Lang, S.; Hofmann, P.; Addink, E.; Queiroz Feitosa, R.; van der Meer, F.; van der Werff, H.; van Coillie, F.; et al. Geographic Object-Based Image Analysis—Towards a New Paradigm. ISPRS J. Photogramm. Remote Sens. 2014, 87, 180–191. [Google Scholar] [CrossRef] [PubMed]
  49. Hay, G.J.; Castilla, G. Geographic Object-Based Image Analysis (GEOBIA): A New Name for a New Discipline. In Object-Based Image Analysis: Spatial Concepts for Knowledge-Driven Remote Sensing Applications, 1st ed.; Blaschke, T., Lang, S., Hay, G.J., Eds.; Springer: Berlin/Heidelberg, Germany, 2008; pp. 75–89. [Google Scholar]
  50. Szostak, M.; Wężyk, P.; Hawryło, P.; Puchała, M. Monitoring the secondary forest succession and land cover/use changes of the Błędów Desert (Poland) using geospatial analyses. Quaest. Geogr. 2016, 35, 5–13. [Google Scholar] [CrossRef]
Figure 1. Location of the 2 study’s areas: (a) Overview map of Poland (aerial orthophoto 2012, coordinates system PL-1992), (b) Jeziórko study area, (c) Machów study area Sentinel-2 (ESA), RGB color composition, red line—boundaries of study areas.
Sustainability 11 01251 g001
Figure 2. Land use and land cover (LULC) classes—the results of Sentinel-2 (2016) image classification: (a) Jeziórko and (b) Machów.
Sustainability 11 01251 g002
Figure 3. LULC classes—the results of Landsat 8 (2013) image classification [36]: (a) Jeziórko and (b) Machów.
Sustainability 11 01251 g003
Figure 4. LULC classes—the results of photointerpretation and on-screen vectorization of aerial orthophoto (2009) [36]: (a) Jeziórko and (b) Machów.
Sustainability 11 01251 g004
Figure 5. LULC classes—the results of Landsat 7 (2000) image classification: (a) Jeziórko and (b) Machów.
Sustainability 11 01251 g005
Figure 6. Increase in forested areas in Jeziórko and Machów areas.
Sustainability 11 01251 g006
Figure 7. Jeziórko test site—ALS point clouds processing results: (a) The relative height of vegetation, calculated as a 95th percentile, (b) std. dev. of height.
Sustainability 11 01251 g007
Figure 8. Jeziórko test site—ALS point clouds processing results: Canopy cover (0%–100%).
Sustainability 11 01251 g008
Table 1. Distribution (%) of LULC classes in the Jeziórko research area.
LULC ClassesLandsat 7 2000Orthophoto 2009Landsat 8 2013Sentinel-2 2016
Mineral extraction sites17.52.02.61.2
Transitional woodland shrub70.813.415.718.3
Broad-leaved forest8.253.452.352.6
Coniferous forest3.018.925.824.6
Mixed forest-3.1--
Waters0.52.43.63.4
Other classes -6.8 -
Table 2. Distribution (%) of LULC classes in the Machów research area.
LULC ClassesLandsat 7 2000Orthophoto 2009Landsat 8 2013Sentinel-2 2016
Arable lands 31.729.530.526.5
Pastures 22.04.218.412.2
Transitional woodland shrub-19.6-17.6
Broad-leaved forest44.137.249.141.4
Coniferous forest2.00.51.41.7
Waters0.20.40.60.6
Other classes -8.6--