Article

Occupant Comfort Management Based on Energy Optimization Using an Environment Prediction Model in Smart Homes

Department of Computer Engineering, Jeju National University, Jeju 63243, Korea
*
Author to whom correspondence should be addressed.
Sustainability 2019, 11(4), 997; https://doi.org/10.3390/su11040997
Submission received: 7 January 2019 / Revised: 7 February 2019 / Accepted: 10 February 2019 / Published: 15 February 2019

Abstract

:
Occupant comfort management is an important feature of a smart home, which requires achieving a high occupant comfort level as well as minimum energy consumption. Based on a large amount of data, learning models enable us to predict factors of a mathematical model for deriving the optimal result without expensive experiments. Comfort management supports high-level comfort to the occupant in the individual indoor environment, using the optimal power consumption to run home appliances. In this paper, we propose occupant comfort management based on energy optimization, using an environment prediction model. The proposed energy optimization model provides optimal power consumption based on the proposed objective function, which requires temperature and comfort index data as the input parameters. For the input requirement, temperature prediction model and humidity prediction model are presented based on a recurrent neural network with a pre-collected dataset, including indoor and outdoor temperature and humidity sensing data. Using the predicted temperature and humidity data, the comfort index model derives the predicted mean vote value to be used in the energy optimization model with the predicted temperature data. The experimental results present an 8.43% reduction of the optimized power consumption compared to the actual power consumption using mean absolute percentage error to calculate. Moreover, the emulation of an indoor environment using optimal energy consumption presents as approximately similar to the actual data.

1. Introduction

In modern life, various electronic appliances provide convenience and improve people’s living quality in a way that is based on the consumption of electronic energy. These electronic appliances are one of the biggest consumers of electricity in many cities, where people live urban lives with many electronic products day and night [1]. Especially in buildings, a huge amount of electricity in the form of final electronic energy is consumed, which is a larger proportion than both industry and transportation in many developed countries [2]. As shown through the survey, people spend more than 80% of their days in the indoor environment, using electronic products for living, working, and entertainment [3]. With the development of internet infrastructures, much work will be done through the remote access by employees in the indoor environment, such as their home, office, and wherever people feel comfor working. Furthermore, according to the United Nations, the population of urban centers will increase from today’s 55% to 68% in 2050, including most people in developing countries [4]. This growth is leading to increasing energy consumption by the operation of electronic appliances in the buildings. Nevertheless, providing a comfortable environment to occupants is an important function of the indoor environment because of the occupant’s living quality, including the health and productivity [5,6,7,8]. Therefore, in any building, an intelligent approach is required for maintaining the user’s environmental comfort while consuming minimal energy through electronic appliances.
The intelligent control system of buildings is comprised of a computer, data storage, sensor, and actuator, to support the occupant’s expected comfort while reducing energy consumption during the operation of building [9]. For supporting a comfortable environment, the intelligent control system requires parameters, including various indoor and outdoor environmental sensing data with user preferences, to build the model. The parameters are difficult to collect for the mathematical solution, which may require the parameters in specific cases for previous studies [10,11,12]. The limitations of deploying various sensors to satisfy the condition of the formula for calculating the comfort index with minimal energy consumption is a challenge [13]. The comfort index can be predicted through a historical dataset for the individual environment [14]. Predicting various parameters is important to get the factors for making a comfortable environment for users without human intervention, where the electronic appliances work by consuming the power. Through prediction, outputs can be used to change the environment through the actuators. The environmental parameters are the inputs of the prediction model to affect the factors of a control system for heating, cooling, ventilation, and lighting [15]. In order to minimize power consumption with the comfortable environment, the control system of smart buildings is required to include the functionalities for supporting high-level comfort, high power efficiency, and user-friendliness.
However, the tradeoff between the energy consumption and indoor comfort level is difficult to achieve, because energy consumption depends on the total operational cost of electronic appliances, and the comfort experience is affected by various dynamic factors, including the occupant’s state in the conditioned environment [16]. Furthermore, for supporting comfort, various electronic appliances collaborate, such as heating, ventilation, and air conditioning (HVAC), gas, and lighting [17,18]. Therefore, supporting the comfortable environment continuously without human intervention shall consume unnecessary energy for satisfying the conditions of user preference. A simple rule-based control system can adjust these actuators based on the collected sensing data from the sensors for each environmental parameter [19,20]. Therefore, frequent controlling is required for changing the desired temperature, humidity, and other environmental parameters through the actuators. However, the frequent operation of actuators results in consumption of more energy.
In this paper, we propose a scheme of imposed energy optimization for supporting the high-level comfort to the user in the individual indoor environment using optimal power consumption. The indoor environment is comprised of sensors, actuators, indoor environmental parameters, and the user. For the awareness of the environment, various environmental data is required to be collected. The data on outdoor environmental parameters can be collected from the weather station, and the data of indoor environmental parameters can be collected from indoor sensors. Using the collected data of environmental parameters, the environment can be predicted based on prediction models. The recurrent neural network (RNN) is a machine learning (ML) algorithm that is used for forecasting parameters in the time sequence based on involving the initial states and the past states of the neurons in the series of processing [21]. For predicting the indoor environment, an RNN-based prediction model is used occupant comfort management. The prediction model forecasts the indoor environment for the user using the individual historical dataset, including indoor and outdoor data, which is collected by the Oak Ridge National Laboratory (ORNL) to be published online [22]. The predicted indoor environment in the future is used for calculating the comfort index and supporting parameters of the objective function in the optimizer. The comfort index is derived by the predicted mean vote (PMV) formula, which provides physical phenomenon and an outcome of human thermal sensation for the heat transfer between a human body and its surrounding environment [23]. The objective function is implemented using a complex formula from an optimal control strategy used for a multi-zone air conditioning system [24]. The control factor is inferred by the objective function of the optimizer, based on the future comfort index and other environmental parameters. Through comfort management, including a prediction model and optimizer, the optimal power consumption is applied to change the indoor environment for achieving maximum user comfort with minimum energy consumption.
The rest of the paper is structured as follows. Section 2 introduces related works regarding occupants’ building environment control systems, based on advanced approaches of fuzzy logic, optimization, and ML. Section 3 illustrates the proposed occupant comfort management, including models of environment parameter prediction, the comfort index, and energy consumption optimization. Section 4 presents prediction and optimization results regarding indoor environmental parameters and energy consumption. Section 5 presents our conclusions regarding the proposed occupant comfort management model.

2. Related Works

Energy consumption is of paramount importance in residual buildings, due to the fact that most of the buildings consume energy to ensure a certain degree of comfortable environment for occupants. Controlling temperature in an individual space for residents is one of the fundamental functions in occupant buildings. In literature, numerous comfort indices have been considered, including primarily thermal comfort, visual comfort, and air quality. These indices are the function of environmental parameters, such as temperature, humidity, illumination, and air quality [25]. Numerous comfort management strategies have been devised to exploit the indoor and outdoor environmental parameters and ensure a certain degree of comfort for occupants in these buildings. In [26,27,28], an optimal model is proposed to provide a solution for energy saving, and to predict the factors of heating, ventilating, and air conditioning systems. Many recent studies leverage fuzzy logic controllers to control the environmental parameters through actuators [29,30]. These methods primarily deal with single object optimization, and thus have addressed a single-factor controlling mechanism in the comfort management system. However, in reality such systems require multiple factors to ensure a comfortable environment. Model predictive control (MPC) scheme is another approach, in which the optimal control can be reached through modeling the future environment based on the operation strategy for saving energy and making a comfortable environment [31]. A variation of this approach has been proposed, which introduces feedback MPC and allows automatic control in a building in order to maintain energy efficiency and the self-operation of building actuators [32]. Weighted parameters in the objective function have been employed to get the optimal control factor, in order to solve multiple parameters for the complex environment [33,34,35].
For achieving optimal values of various parameters in the objective function, an optimization algorithm is required to be selected. Many optimization algorithms have been proposed that are inspired from the behavior of nature. These optimization algorithms are modelled to get optimal results based on reaching the optimal value in each parameter of the objective function. For instance, colony optimization uses stochastic nature to reach its optimal value [36]. Similarly, the genetic algorithm (GA) and particle swarm optimization (PSO) are evolutionary algorithms, which can be used for non-linear optimization problems to achieve optimization [37]. GA and PSO are used in many different cases to optimize power consumption while controlling electronic appliances [38,39,40]. Certain instances from the literature have also been found where GA is utilized in the building control system, in order to optimize the control factor of HVAC to reach the optimal performance [41]. PSO, on the other hand, is used in the recommendation system of buildings to minimize the annual energy consumption for the building energy performance optimization [42]. These optimization solutions provide a real-time solution for complex multi-objective optimization problems, which most linear mathematical models cannot realistically solve. Based on these algorithms, objective functions are proposed to give the optimal values in the comfort management system. However, these objective functions require multiple parameters in the complex environment [43,44]. In the proposed comfort management scheme, the parameters are inferred through the prediction model and calculated by the PMV formula. Heater power consumption is the only value to be required for achieving optimal comfort from the objective function. Therefore, optimization algorithms are not required to optimize the objective function in the proposed scheme.
Energy consumption has become increasingly important to control the stress on today’s electrical grid infrastructure [45]. Therefore, predicting energy consumption is crucial to find energy demand in the future, for the reliability of power supply system. Through the prediction model, the parameters can be based on the inputs of the model. For forecasting of time series, historical data are required as the inputs of the model, to predict future data in the time sequence. A variety of ML algorithms have been proposed for forecasting, such as the artificial neural network (ANN), hidden Markov model (HMM), support vector machine (SVM), and many other ML algorithms [46]. The ANNs have been used for solving nonlinear methods, which can be trained to learn the relationship for recognizing patterns from given data, through the functions of self-organizing, data-driven, self-study, self-adaptive, and associated memory [47]. For the training algorithms to predict the parameter in a time sequence, various neural network architectures have been proposed, such as generalized regression, wavelet, dynamic, and backpropagation [48]. Recently, most of the neural networks have been based on multiple layers for enabling the complex mapping between inputs and outputs, in order to learn the approximate nonlinear relationship [49]. Multi-layer neural networks are based on two basic architectures: convolutional neural network (CNN) and RNN [50]. The CNN is handy in cases like image recognition, where the image data is independent from the time series [51,52].
In contrast, RNN contains a memory component, to pass the selected information to the outputs of the model for capturing the time-related dependencies [53]. Using an RNN based prediction model, the long short-term memory (LSTM) can be used for learning time series with long time spans [54]. Therefore, for forecasting the data continued in the time series, the model of an RNN is trained by the continuous data to pass the features on to the next time in the timeline. For forecasting wind speed, Cheng et al. present an RNN-based architecture to maintain diversities of sub-models and take advantages of learning [55]. For estimating the charging state of an Li-ion battery without using battery models, filters, and inference systems like Kalman filters, Chemali et al. introduce an RNN with an LSTM model to predict the charging state, based on continuous battery life [56]. Microsoft engineers Tam et al. proposed an RNN-based, spoken-language understanding model to generate valid unseen labeled data, through capturing the structure of a word sequence for evaluating live logs of Cortana [57]. For a short-term traffic data forecast in the transportation system, Zhao et al. introduce an RNN-based data prediction approach using LSTM cells [58]. Therefore, most of the forecasting problems are implemented by an RNN that can deliver the information from data to the next data that are continuous in the time sequence.
For user comfort, the PMV is the most widely used model, and was developed through costly laboratory experiments by Fanger in 1970s [59]. The PMV model is the basis of the International Organization for Standardization (ISO) 7730 standard, which has 1994 and 2005 versions [60,61]. A personal comfort model results in individual thermal comfort, which presents the comfort level based on the person’s surrounding environment. The PMV-based comfort model takes an individual person as the unit instead of the average of a group, and uses direct feedback from individuals, including thermal sensation, preference, acceptability and pleasure. A personal comfort model is used for better understanding regarding specific comfort needs and the desired thermal comfort of an occupant in an individual environment. For intelligent comfort management, the comfort data can be used for the intelligent controlling model, to manage the building or other environments and to achieve optimal conditioning with energy efficiency [62,63,64]. In the proposed comfort management, the PMV results from the predicted environment for the future comfort of the individual occupant environment, to be used for optimizing power consumption within the comfortable environment.

3. Proposed Occupant Comfort Management Methodology

For occupant comfort management in smart spaces, where the sensors and actuators are deployed to support a comfortable environment to the user, the intelligent system needs to collect environmental information and make the smart decision for controlling the actuators to change the environment, using appropriate power consumption. Figure 1 presents the power consumption optimization process, which is based on environment prediction.
The prediction model requires a set of data that is used for predicting the next time. In order to develop the prediction model, the dataset is used for training the model. The prediction model is used for predicting the indoor environment, which is comprised of various environmental parameters. The parameters change over time. Therefore, the data must be continuous for training the model, as well as predicting the next time. The input data that is used for predicting the next time, which can be a data moment or a data sequence from a point in time in the past to the current point. The outputs of the prediction model are a dataset for the predicted indoor environmental parameters in the future. This forecasting is continued from the past, which is affected by all the data from the past.
Using the outputs of the prediction model, the comfort index can be calculated for the future. The comfort index is used for evaluating the indoor environment, where the user stays. Through the comfort index, the system can make a strategy to control the actuators for updating the indoor environmental parameters to support the comfortable environment. The comfort index calculator is a generator for the comfort index, which outputs the data for evaluating the indoor environment.
The optimizer includes the objective function for optimizing the power parameter for the environment using environment parameters, including historical data, predicted data, and comfort index. The output of the optimizer is a power consumption value that is used for operating the actuator to change the indoor environment for the user comfort. The value results from the objective function for the minimum power consumption of the comfortable environment. Therefore, the actuators shall make the environment comfortable for the user using optimal power consumption.

3.1. Environmental Parameter Prediction Model

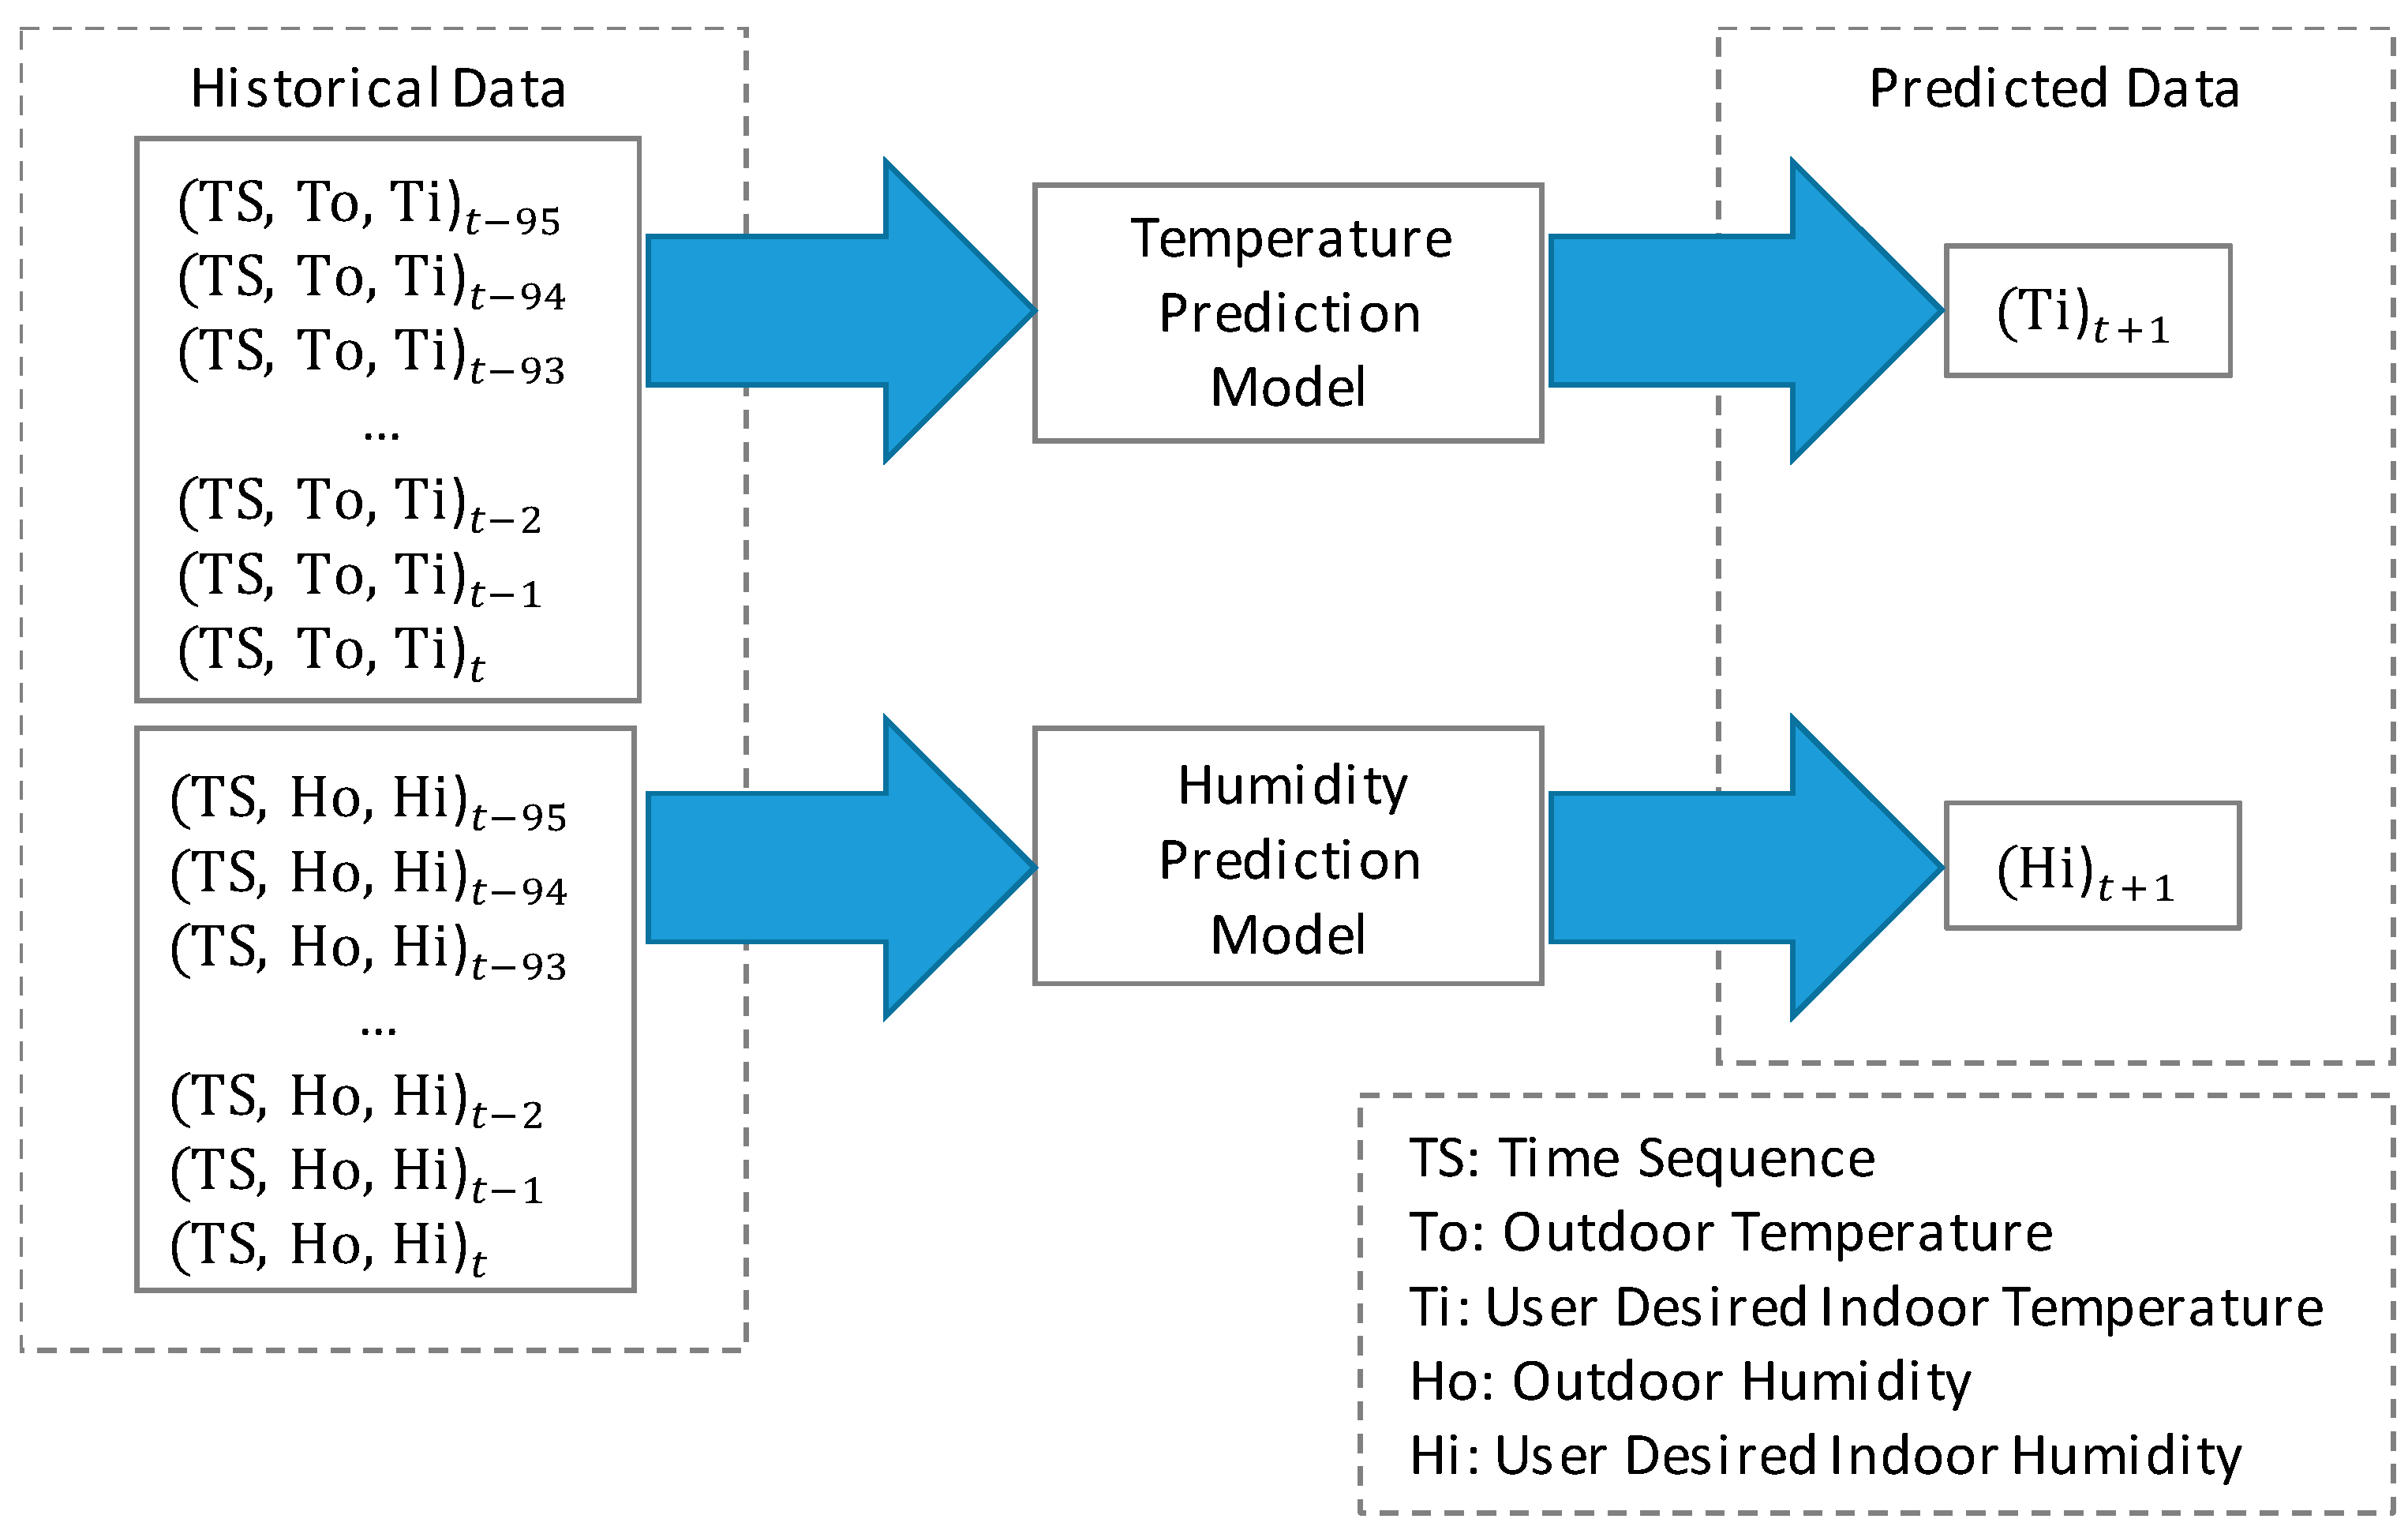
For predicting the environmental parameters, prediction models are proposed for temperature data and humidity data in the indoor space. The predicted data is used for calculating the PMV value that is the comfort index, to present user comfort in the future indoor environment. The proposed optimizer also requires the predicted indoor environmental data with the future comfort index to infer the optimal power. Figure 2 shows the prediction models to predict the temperature data and humidity data, using historical data for indoor and outdoor environmental parameters.
The proposed prediction models require input parameters, such as time sequence (TS), outdoor temperature (To), user-desired indoor temperature (Ti), outdoor humidity (Ho), and user-desired indoor humidity (Hi). The temperature prediction model (TPM) requires historical data for the environmental parameters To and Ti. For each environmental parameter, the TPM requires 96 sequential data. Each row of the input dataset is comprised of a TS, To, and Ti. The 96 sequential data are the historical data from t − 96 to t. Each t represents the number of TSs that present 15 min. The t means the number for the current time in the TS. Therefore, 96 of TS presents 1 h. Through the TPM, the Ti of t + 1 can be predicted. Similarly, the humidity prediction model (HPM) requires the historical data of Ho and Hi. The output of the HPM is the Hi of t + 1.
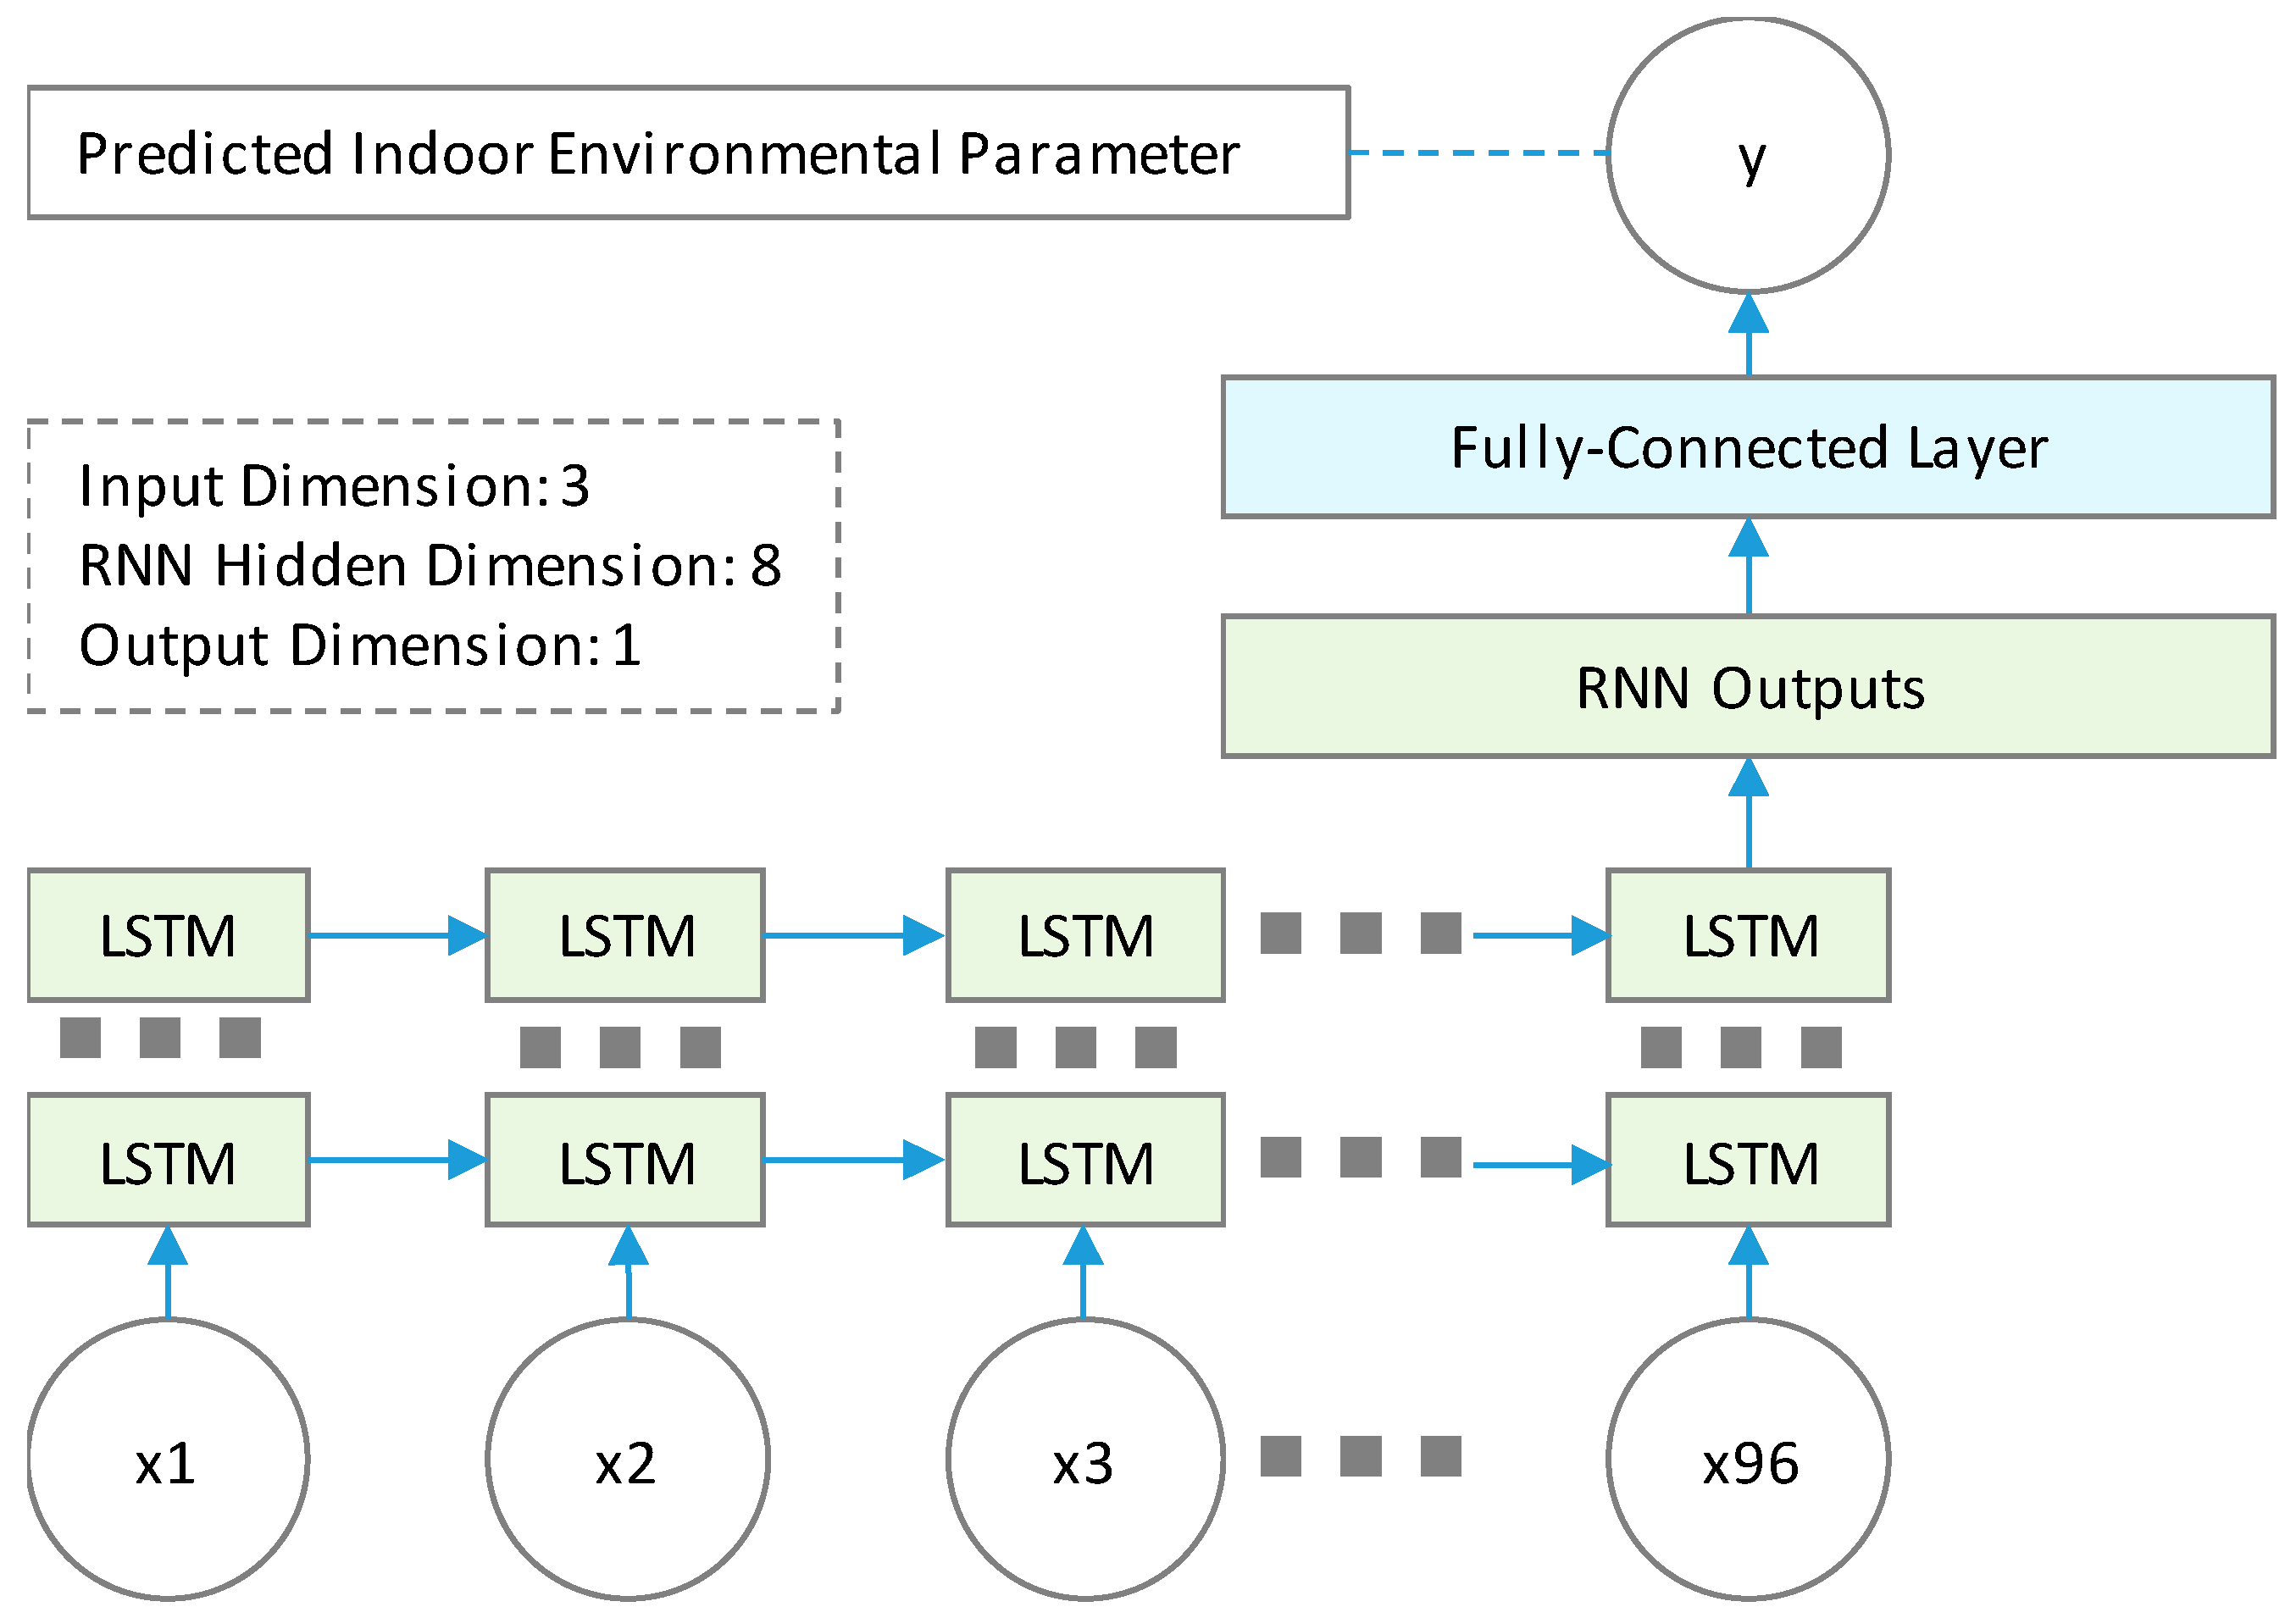
The prediction models are built by the RNN-based ML, which is good in scenarios where there are temporal or order dependencies through containing a memory component, to pass the selective knowledge down the time sequence. Figure 3 shows the sequential architecture of an RNN-based environmental prediction model for predicting the indoor temperature and humidity.
In the RNN-based indoor environment prediction model, the input parameters are continuous in the time axis, and the output parameter is also continued from the inputs. An RNN model enables efficient learning, to handle sequential data with temporal correlation based on connecting hidden layers with the former ones circularly. In the proposed RNN-based model, eight hidden layers are connected with the LSTM cells, which are the recurrent units, to save the historical information from the sequence. In an RNN model, there are numerous connections between current and previously hidden layers. However, training such a network becomes difficult because of the vanishing gradient problem [65]. The LSTM cells were proposed to build recurrent units for the hidden layers in the network of RNN model. The LSTM cells are used for remembering the short-term memory that delivers information to the result. The input parameters are presented as x(n), which are continuous data. Each x has three dimensions: TS, To, and Ti for TPM; and TS, Ho, and Hi for HPM. In the model, the last outputs are taken to the fully-connected layer that outputs the power consumption value.
Figure 4 presents an architecture of the proposed occupant comfort management based on the proposed environment prediction model. The inputs of the environment prediction model are collected from an environment where the occupant lives. The required data for the environmental parameters is for 1 h, which is 96 sequential values. Through the prediction model, values of temperature and humidity are derived for the next time. The values are used for the PMV and optimization models to determine a power value. The power value is used for controlling an actuator to affect the environment.

3.2. Comfort Index Model

The PMV results in a comfort index that predicts the mean value from the votes of a large group of people, based on the heat balance of the human body. The PMV presents seven points to represent the level of thermal sensation scale: hot, warm, slightly warm, neutral, slightly cool, cool, and cold. The PMV model is used for getting the comfort index to be used in the energy consumption optimization model. The parameters of the PMV-based comfort index model are the predicted environmental data for the indoor environmental parameters using TPM and HPM. Therefore, the PMV value presents a predicted comfort index for the person who is in the individual environment, as well as the environmental data collected to be used in the proposed prediction model.
For calculating the PMV, Equations (1)–(8) are used. These equations refer the IOS 7730 2005 version that is mentioned in the Related Works section. The PMV formula is comprised of evaporation, respiration, radiation, convection, and other parameters. For the overall comfort index model, the input parameters are metabolic rate (M), effective mechanical power (W), air temperature (Ta), mean radiant temperature (Tr), relative humidity (Rh), air velocity (Va), and clothing insulation (icl) [66,67,68].
The overall mathematical model is presented in Equation (1), and accordingly the parameters in Equation (1) are further derived in Equations (2)–(5):
P M V = ( 0.303 × e ( 0.036 × M ) + 0.028 ) × ( M W + E v a p o r a t i o n + R e s p i r a t i o n + R a d i a t i o n + C o n v e c t i o n )
E v a p o r a t i o n = 3.05 × 10 3 × ( 5733 6.99 × ( M W ) P a ) 0.42 × ( M W 58.15 )
R e s p i r a t i o n = 1.7 × 10 5 × M ( 5867 P a ) 0.0014 × M × ( 34 T a )
R a d i a t i o n = 3.96 × 10 8 × f c l × ( ( t c l + 273 ) 4 ( T r + 273 ) 4 )
C o n v e c t i o n = f c l × h c × ( t c l T a )
where the unit of M and W is watts per square meter (W/m2); the unit of P a is pascals (Pa), and the unit of T a , T r , and t c l is degrees Celsius. The parameter f c l is the clothing surface area factor that is derived by icl, and the parameter h c is the convective heat transfer coefficient in watts per square meter kelvin, derived from Equations (6) and (7) below:
h c 1 = 2.38 × | t c l T a | 0.25
h c 2 = 12.1 × V a
where the unit of parameter V a in Equation (7) is meters per second (m/s). The outputs hc1 and hc2 from Equations (6) and (7) are selected by the Algorithm 1 through the comparison between the results of the equations.
For using the relative humidity in the PMV model, converting the relative humidity to saturation vapor pressure is required. In a space, the pressure of the air is affected by humidity and temperature. The mathematical model was given by Tetens [69], which is introduced in [70] and presented in below with Equation (8):
P a = R h × ( 610.78 × e ( 17.2694 × T a / ( T a + 238.3 ) ) / 100 )
Algorithm 1 shows the steps of calculating the PMV based on given parameters, including M, W, Ta, Tr, Va, Rh, and icl, using the function getPMV (M, W, Ta, Tr, Va, Rh, icl). In the first step, the value of parameter icl is checked. Depending on whether or not the value is bigger than 0.078, the fcl is given a different value. For the hc, according to the comparison of Equations (6) and (7), hc is given a different value. Once the fcl and hc are confirmed, the Pa is given by Equation (8). The parameter tcl is given by Algorithm 2. Then all required values of parameters are prepared for equations, and values are assigned to the equations to derive the value of PMV.
Algorithm 1. Calculate PMV.
1:function getPMV(M, W, Ta, Tr, Va, Rh, icl)
2:if icl > 0.078 then
3:fcl = 1.05 + 0.645 * icl;
4:else
5:fcl = 1.00 + 1.290 * icl;
6:end
7:if hc1 from Equation (6) > hc2 Equation (7) then
8:hc = hc1;
9:else
10:hc = hc2;
11:end
12:Pa = Get the value using Equation (8);
13:tcl = Algorithm 2(fcl, M, W, Ta, Tr, Va, icl);
14:Evaporation = Get the value using Equation (2);
15:Respiration = Get the value using Equation (3);
16:Radiation = Get the value using Equation (4);
17:Convection = Get the value using Equation (5);
18:PMV = Get the value using Equation (1);
19:return PMV;
20:end function
Algorithm 2 shows the steps to calculate the tcl for Equations (4)–(6), which are used in Algorithm 1. For deriving the value of tcl, the input parameters fcl, M, W, Ta, Tr, Va, and icl are required. The fcl is a result in Algorithm 1, and others are the inputs of the PMV model. The function getTcl(fcl, M, W, Ta, Tr, Va, icl) includes an iterator to get the minimum distance between two variables, resulting in the tcl. In this iteration the function, getTclf(tcl, fcl, ts, Ta, Tr, Va, icl) is used.
Algorithm 2. Calculate tcl.
1:function getTcl(fcl, M, W, Ta, Tr, Va, icl)
2:ts = 35.7 − 0.028 * (MW);
3:eps = 1e − 9;
4:q = {−50, 50};
5:while (|q[0] − q[1]|) > eps) {
6:temp = (q[0] * getTclf(q[1], fcl, ts, Ta, Tr, Va, icl)
7:q[1] * getTclf (q[0], fcl, ts, Ta, Tr, Va, icl))
8:/( getTclf (q[1], fcl, ts, Ta, Tr, Va, icl)
9:−getTclf (q[0], fcl, ts, Ta, Tr, Va, icl));
10:q[0] = q[1];
11:q[1] = temp;
12:}
13:return (q[0] + q[1]) / 2;
14:end function
15:function getTclf(tcl, fcl, ts, Ta, Tr, Va, icl)
16:t1 = (tcl + 273)^(−4) − (Tr + 273)^(−4);
17:if hc1 from Equation (7) > hc2 Equation (8) then
18:hc = hc1;
19:else
20:hc = hc2;
21:end
22:tcle = tsicl * (3.96 * 1e − 8 * fcl * t1 + fcl * hc * (tclTa));
23:return tcltcle;
24:end function
To use the proposed comfort index model based on the PMV, the parameters M, W, Va, and icl are fixed, because of the lack of training data for the environmental prediction model. The proposed prediction models are used for resulting in the indoor temperature and humidity, which are the inputs of the comfort index model. Therefore, we assume other parameters for the occupant in the individual environment. The value of M is 58, W is 0, Va is 0, and icl is 1.1. In this case, these parameters refer to a person in a seated, quiet state, wearing long shirts and pants, when the wind cannot be detected by the person. Based on the experiment with the given values for the input parameters of the PMV model, the PMV value is derived correctly to compare with the American Society of Heating, Refrigerating and Air-Conditioning Engineers (ASHRAE) Standard 55-2017 from Center for the Built Environment (CBE) Thermal Comfort Tool [71].

3.3. Energy Consumption Optimization Model

The energy consumption model is a multi-objective function, and addresses minimizing energy while simultaneously achieving thermal comfort. Our formula is based on the derivation of House and Smith [22], where the cost is defined in terms of two distinct subparts. The first part is the differential quantity of the current temperature and predicted temperature at the next time interval (t + 1), and the second is the PMV subpart, which is also the differential quantity of the current and predicted PMVs. In addition to these two parameters, the predicted energy consumption ( E h t + 1 ) is also considerd as given in Equation (9):
f ( E h t + 1 ) = | t t + 1 { α ( ( T t T t + 1 ) 2 + ( P M V t P M V t + 1 ) 2 ) } d t + ( E h t + 1 ) 3 3 | ,   α = 10 9
where f ( E h t + 1 ) is the objective function of energy consumption optimization; α is a weighting factor, and is taken as 10^9; T t is the generated temperature; and T t + 1 is the predicted temperature at time interval t + 1. These change with respect to time in these two differential quantities are integrated into the interval t and t + 1.
Equation (9) is further expanded to form Equation (10):
f ( E h t + 1 ) = | α ( ( T t T t + 1 ) 3 3 ( T t 1 T t ) 3 3 + ( P M V t P M V t + 1 ) 3 3 ( P M V t 1 P M V t ) 3 3 ) + ( E h t + 1 ) 3 3 | , α = 10 9 .
The value of the energy consumption optimization model is generated by an integration by parts formula, and the result shows that the cube average filter is applied to the main parts of the model, i.e., temperature and PMV.
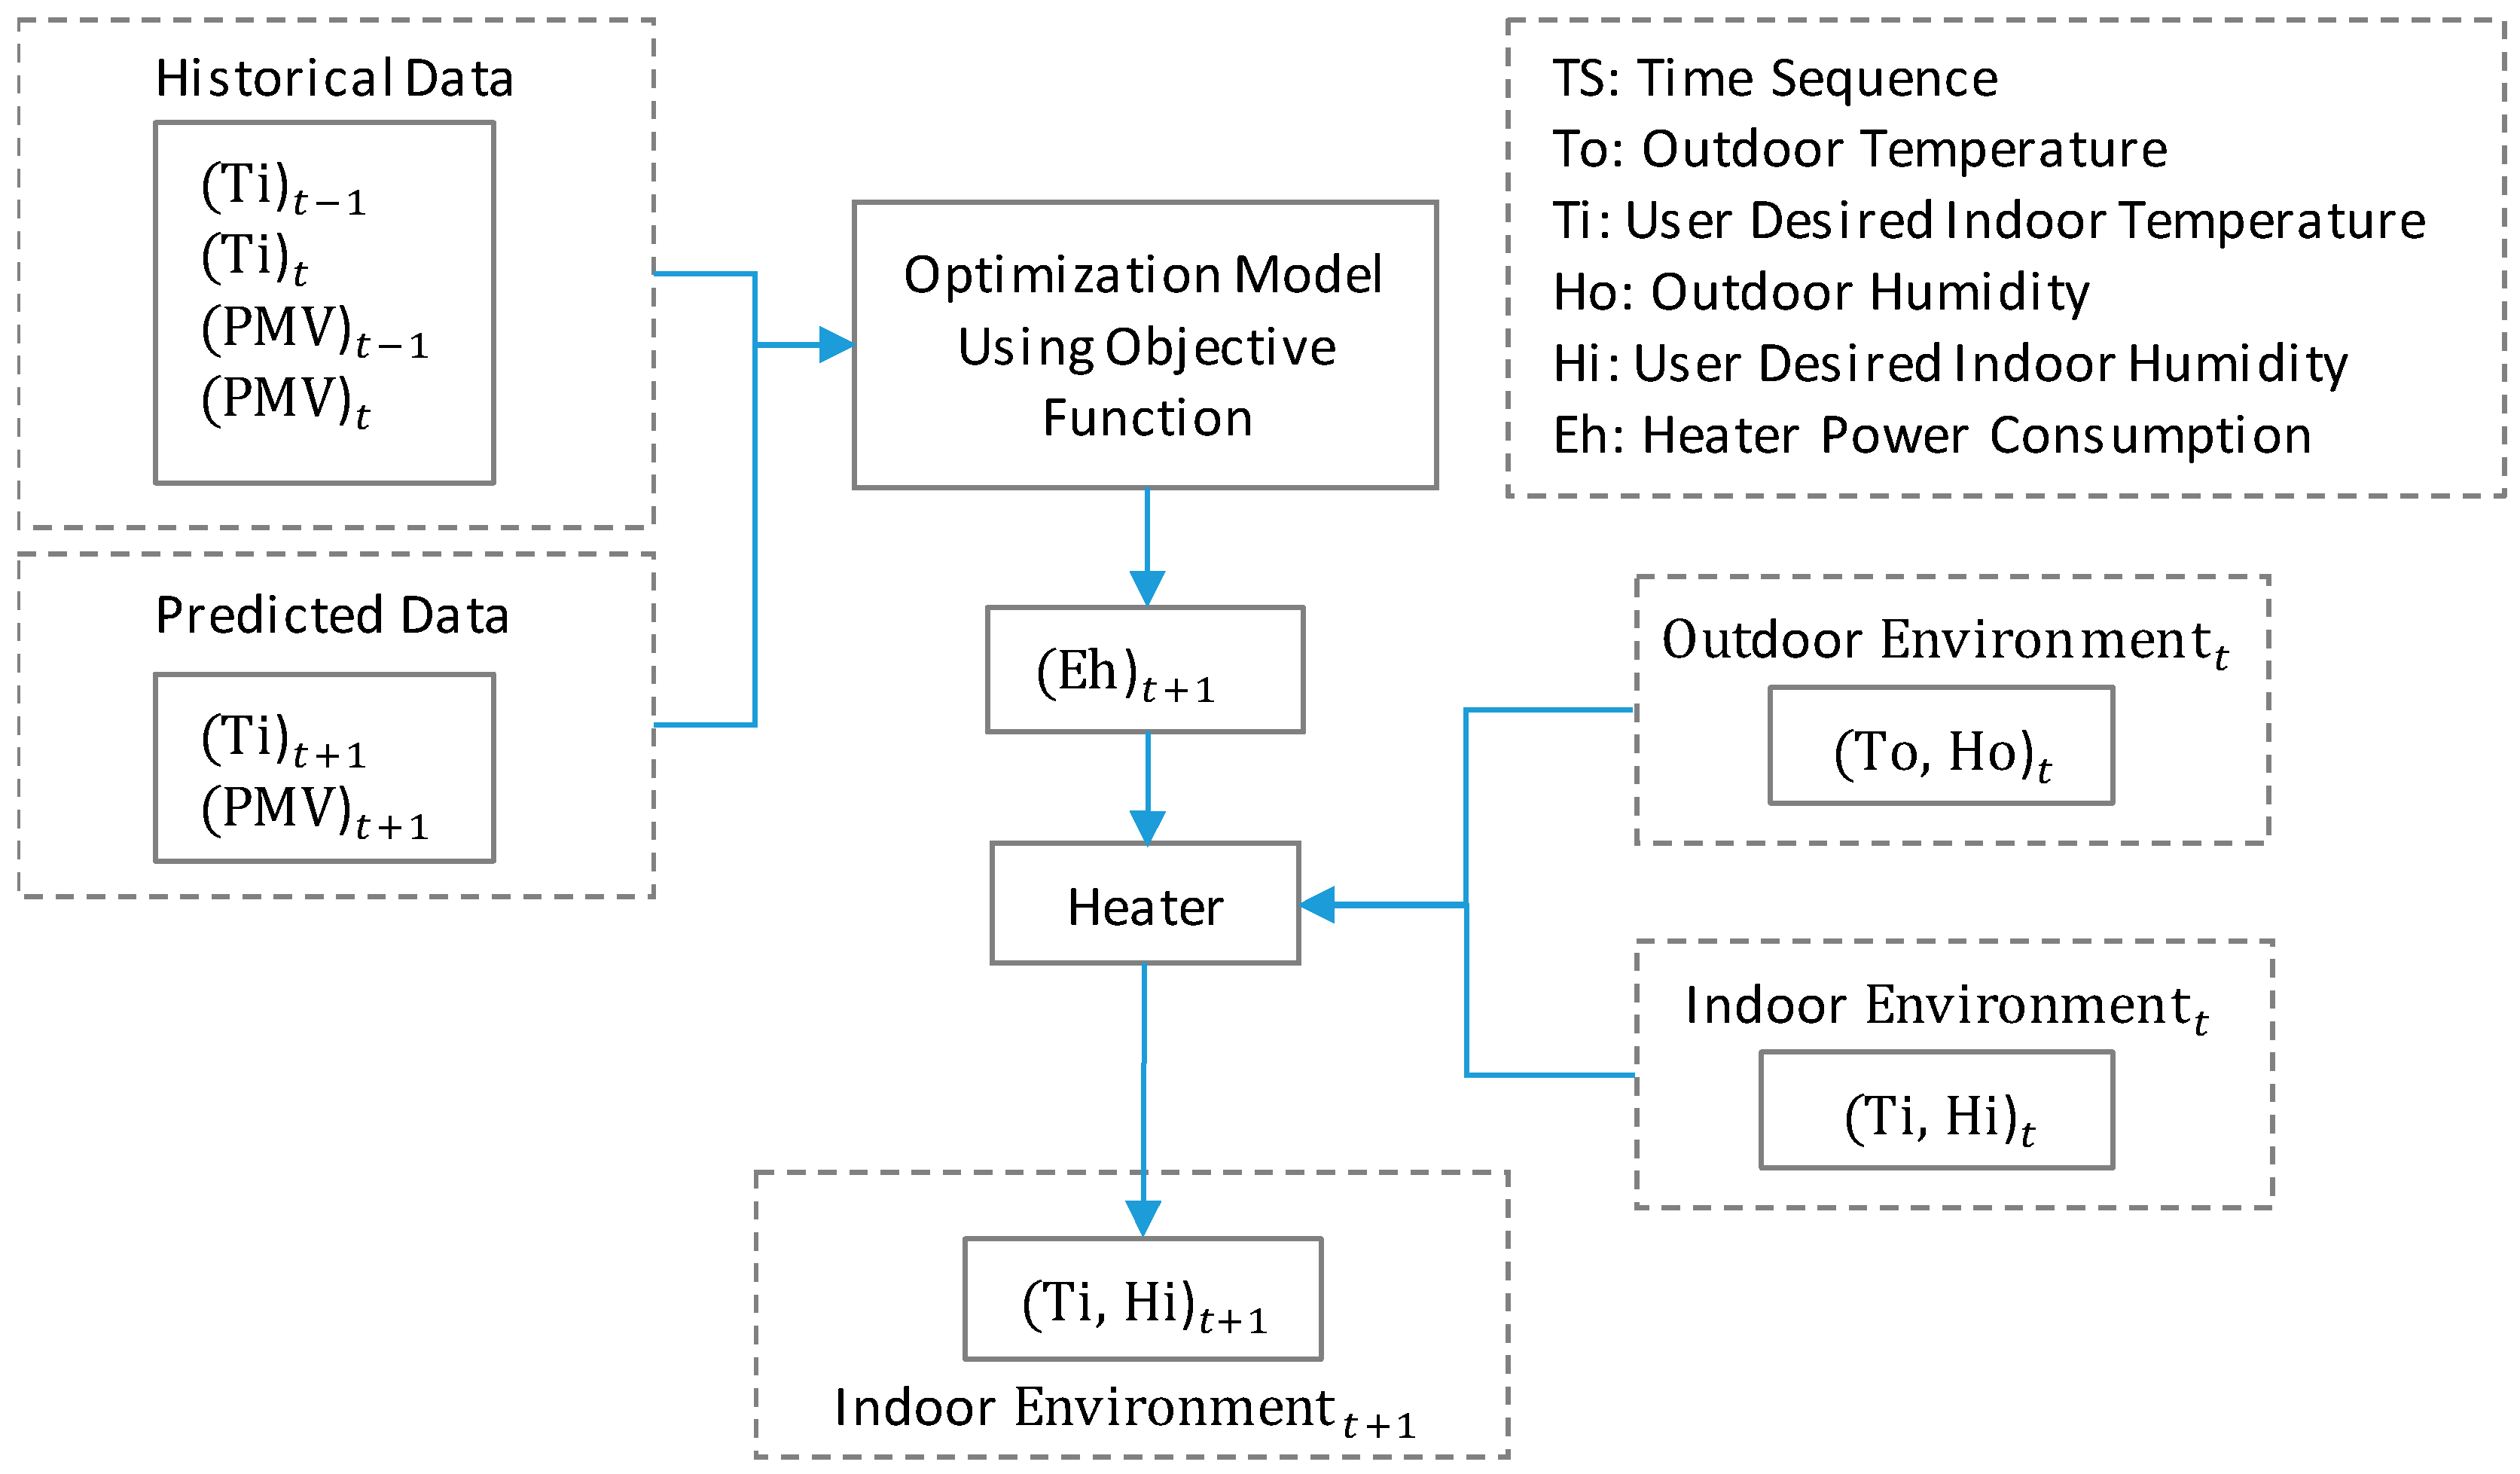
Figure 5 shows the schematic of the energy consumption optimization model, using an objective function for operating the heater to change the indoor environment, including temperature and humidity. The TPM and HPM are adapted to provide the predicted indoor environment data for the objective function. Through the predicted indoor temperature and humidity data, the PMV, which is a parameter of the objective function, is derived for the future environment. The future indoor temperature is also a parameter of the objective function. From the historical dataset, the indoor temperature data for the time sequence t − 1 and t are required, and the PMV data for the same time sequence with the indoor temperature are required. The optimization model outputs the power consumption for the heater, which is a value to present the energy consumption from a time sequence t to t + 1. The heater consumes power according to the output of the optimization model, to affect the indoor environment. In the time t, the outdoor and indoor environments are the factors of the heater. From these factors, the heater updates the indoor environment based on the power value, in order to achieve the indoor environment in time t + 1.
In the implementation, we developed a Deep Neural Network (DNN)-based heater emulator trained by the same dataset with applied to the TPM and HPM. Therefore, when the indoor and outdoor temperature and humidity data for time t and the power value for time t + 1 are inputted into the heater emulator, the indoor temperature and humidity for time t + 1 are outputted.

4. Experimental Results

For experimenting with the proposed occupant comfort management model, using energy optimization and environmental prediction for the individual home environment, we present the indoor temperature and humidity data comparison between the actual data and predicted results. The TensorFlow 1.8 was used to implement the environment prediction model with the ORNL dataset. The ORNL dataset is collected from a house in Compbell, United States. The dataset has 35,040 rows and includes various sensing data. The indoor and outdoor temperature and humidity data, as well as the heater power consumption data for a room of the house were used in our experiment. The indoor data, including temperature, humidity, and energy consumption of the heater, was collected from a great room titled as “Great RM/Room” in the dataset. The indoor environment of the room is controlled by the user, who adjusts the heater and other appliances to achieve comfort environment. We present the prediction result of the PMV data, which is derived by the predicted temperature and humidity for the future. Once the predicted indoor environment data is gathered from the TensorFlow-based RNN model, then the PMV data is determined through the Java application, which is the implementation of comfort index model. We present the environmental and PMV data assigned to the optimization model in order to get the optimal power consumption for the heater. Microsoft Office Excel was used for deriving the optimal value based the proposed objective function. For evaluating the result of proposed optimization model, the optimal heater power consumption data is presented, and the indoor temperature and humidity data comparisons between actual data and optimal results are presented.

4.1. Indoor Environmental Parameters Predictions

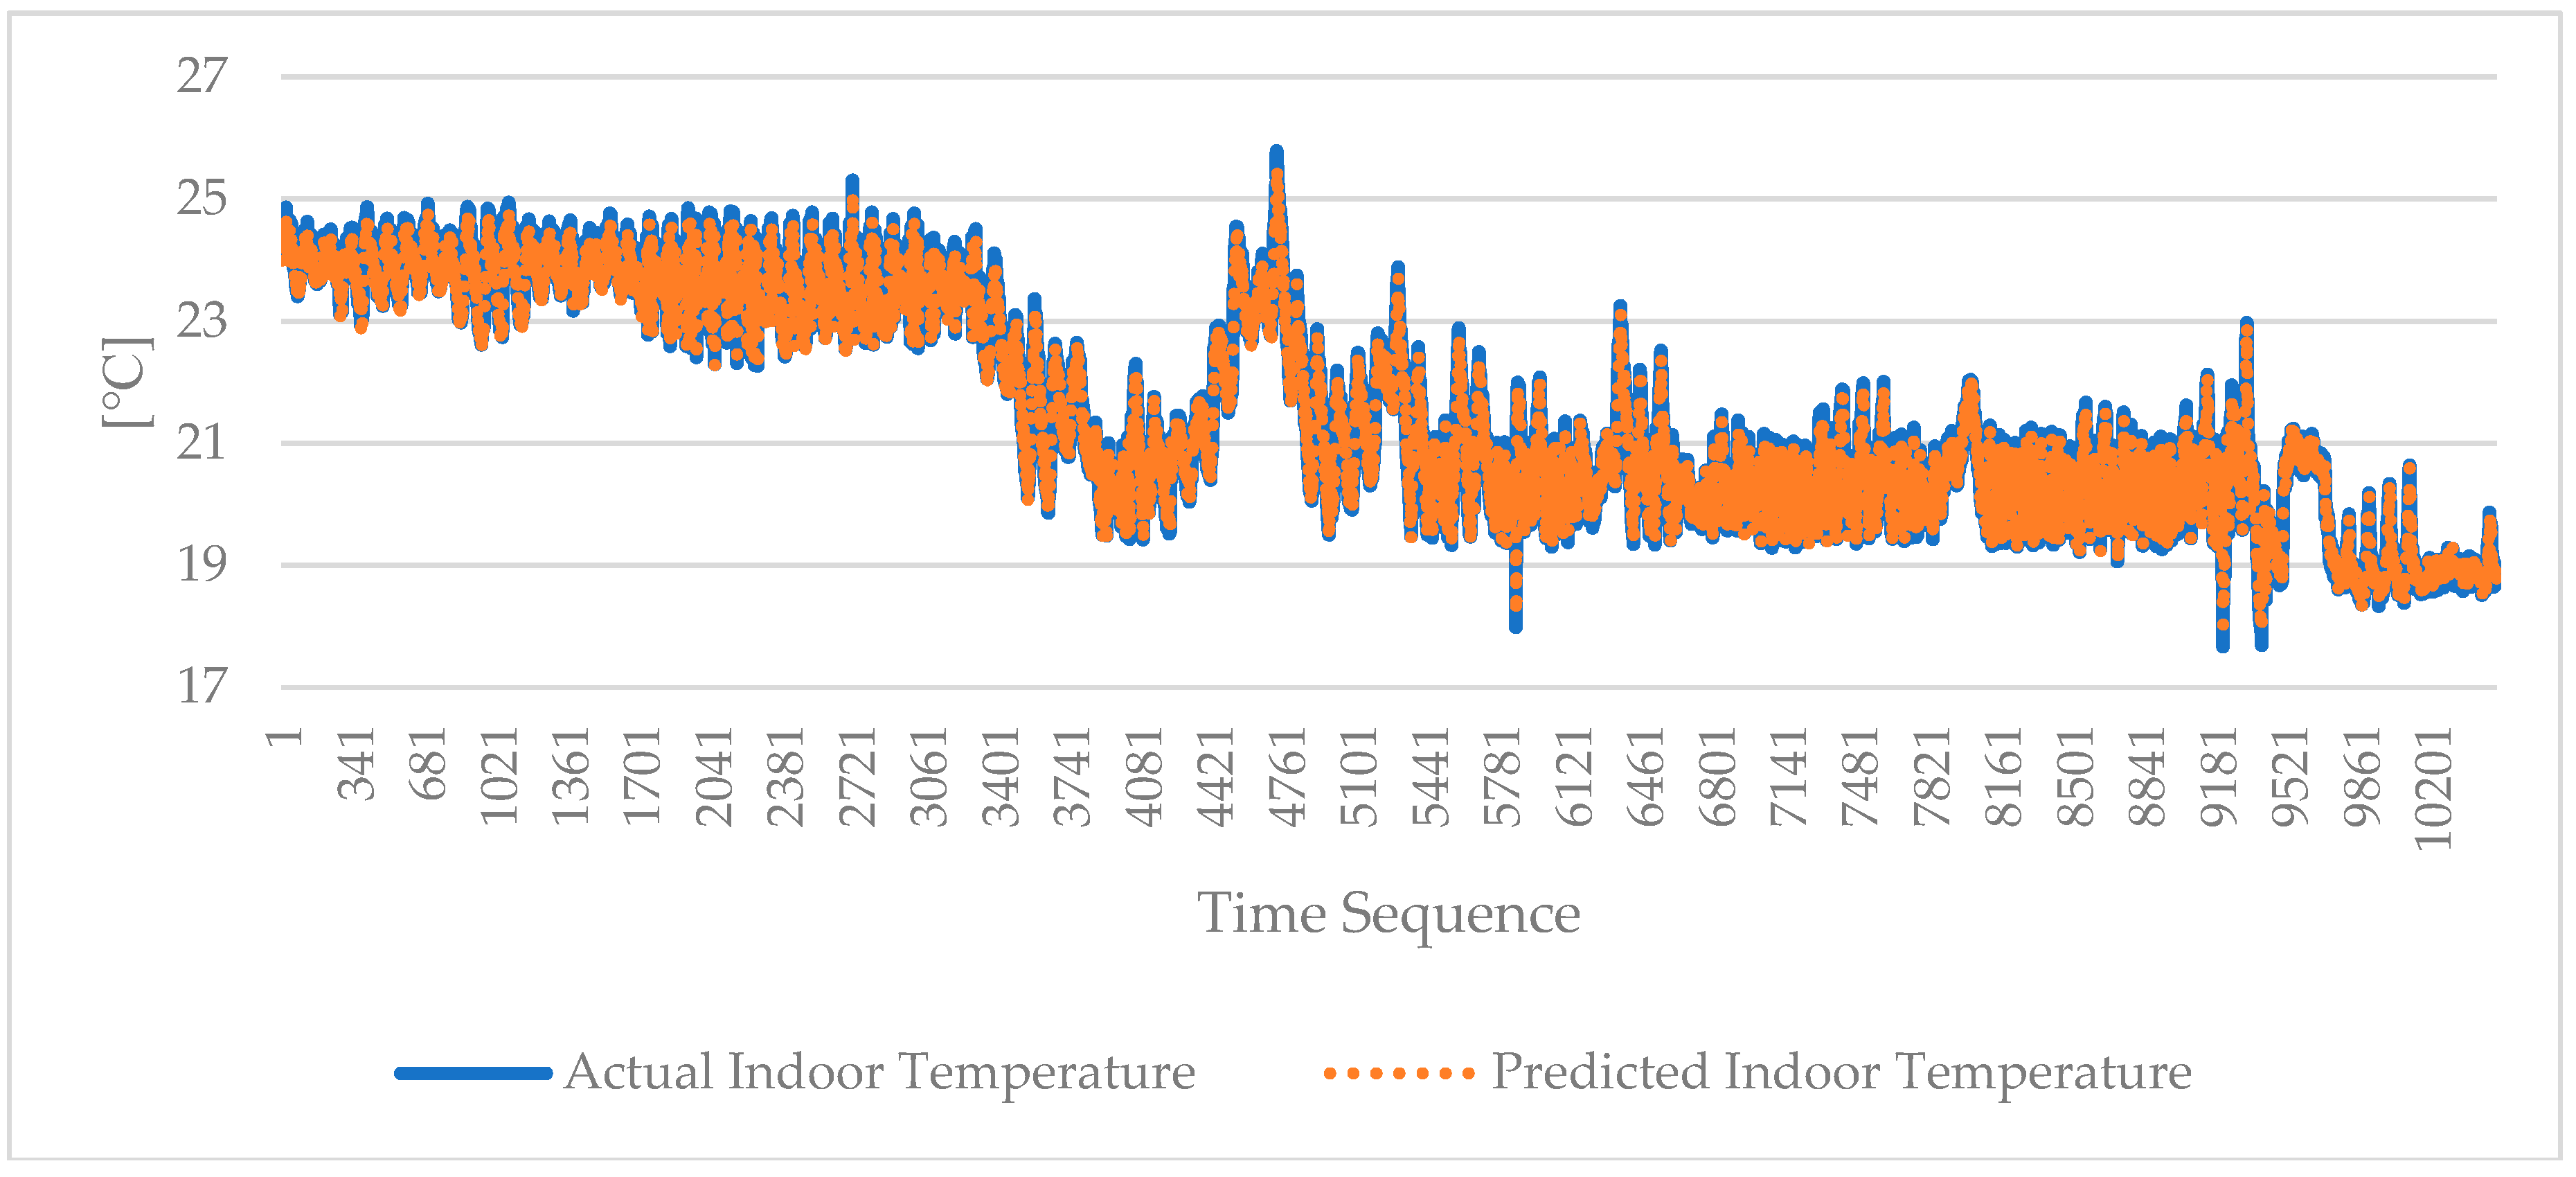
Figure 6 shows the data comparison between actual indoor temperature and predicted indoor temperature. The unit of the presented data is degrees Celsius (ºC), and the x-axis presents the sequence numbers. The actual data is presented for 10,512 values that show the indoor temperature in the experimental house from 13 September at 11:45 to 31 December at 23:30. The average temperature of actual data was 21.63 °C, the minimum temperature was 17.63 °C, and the maximum temperature was 25.79 °C. The predicted data were the results from the TPM. The predicted data are also presented for 10,512 values. The average temperature of the predicted data was 21.57 °C, the minimum temperature was 18.03 °C, and the maximum temperature was 25.53 °C. The mean absolute percentage error (MAPE) of the predicted data with actual data is 1.05%, the minimum absolute percentage error is 0.00%, and the maximum absolute percentage error is 6.72%.
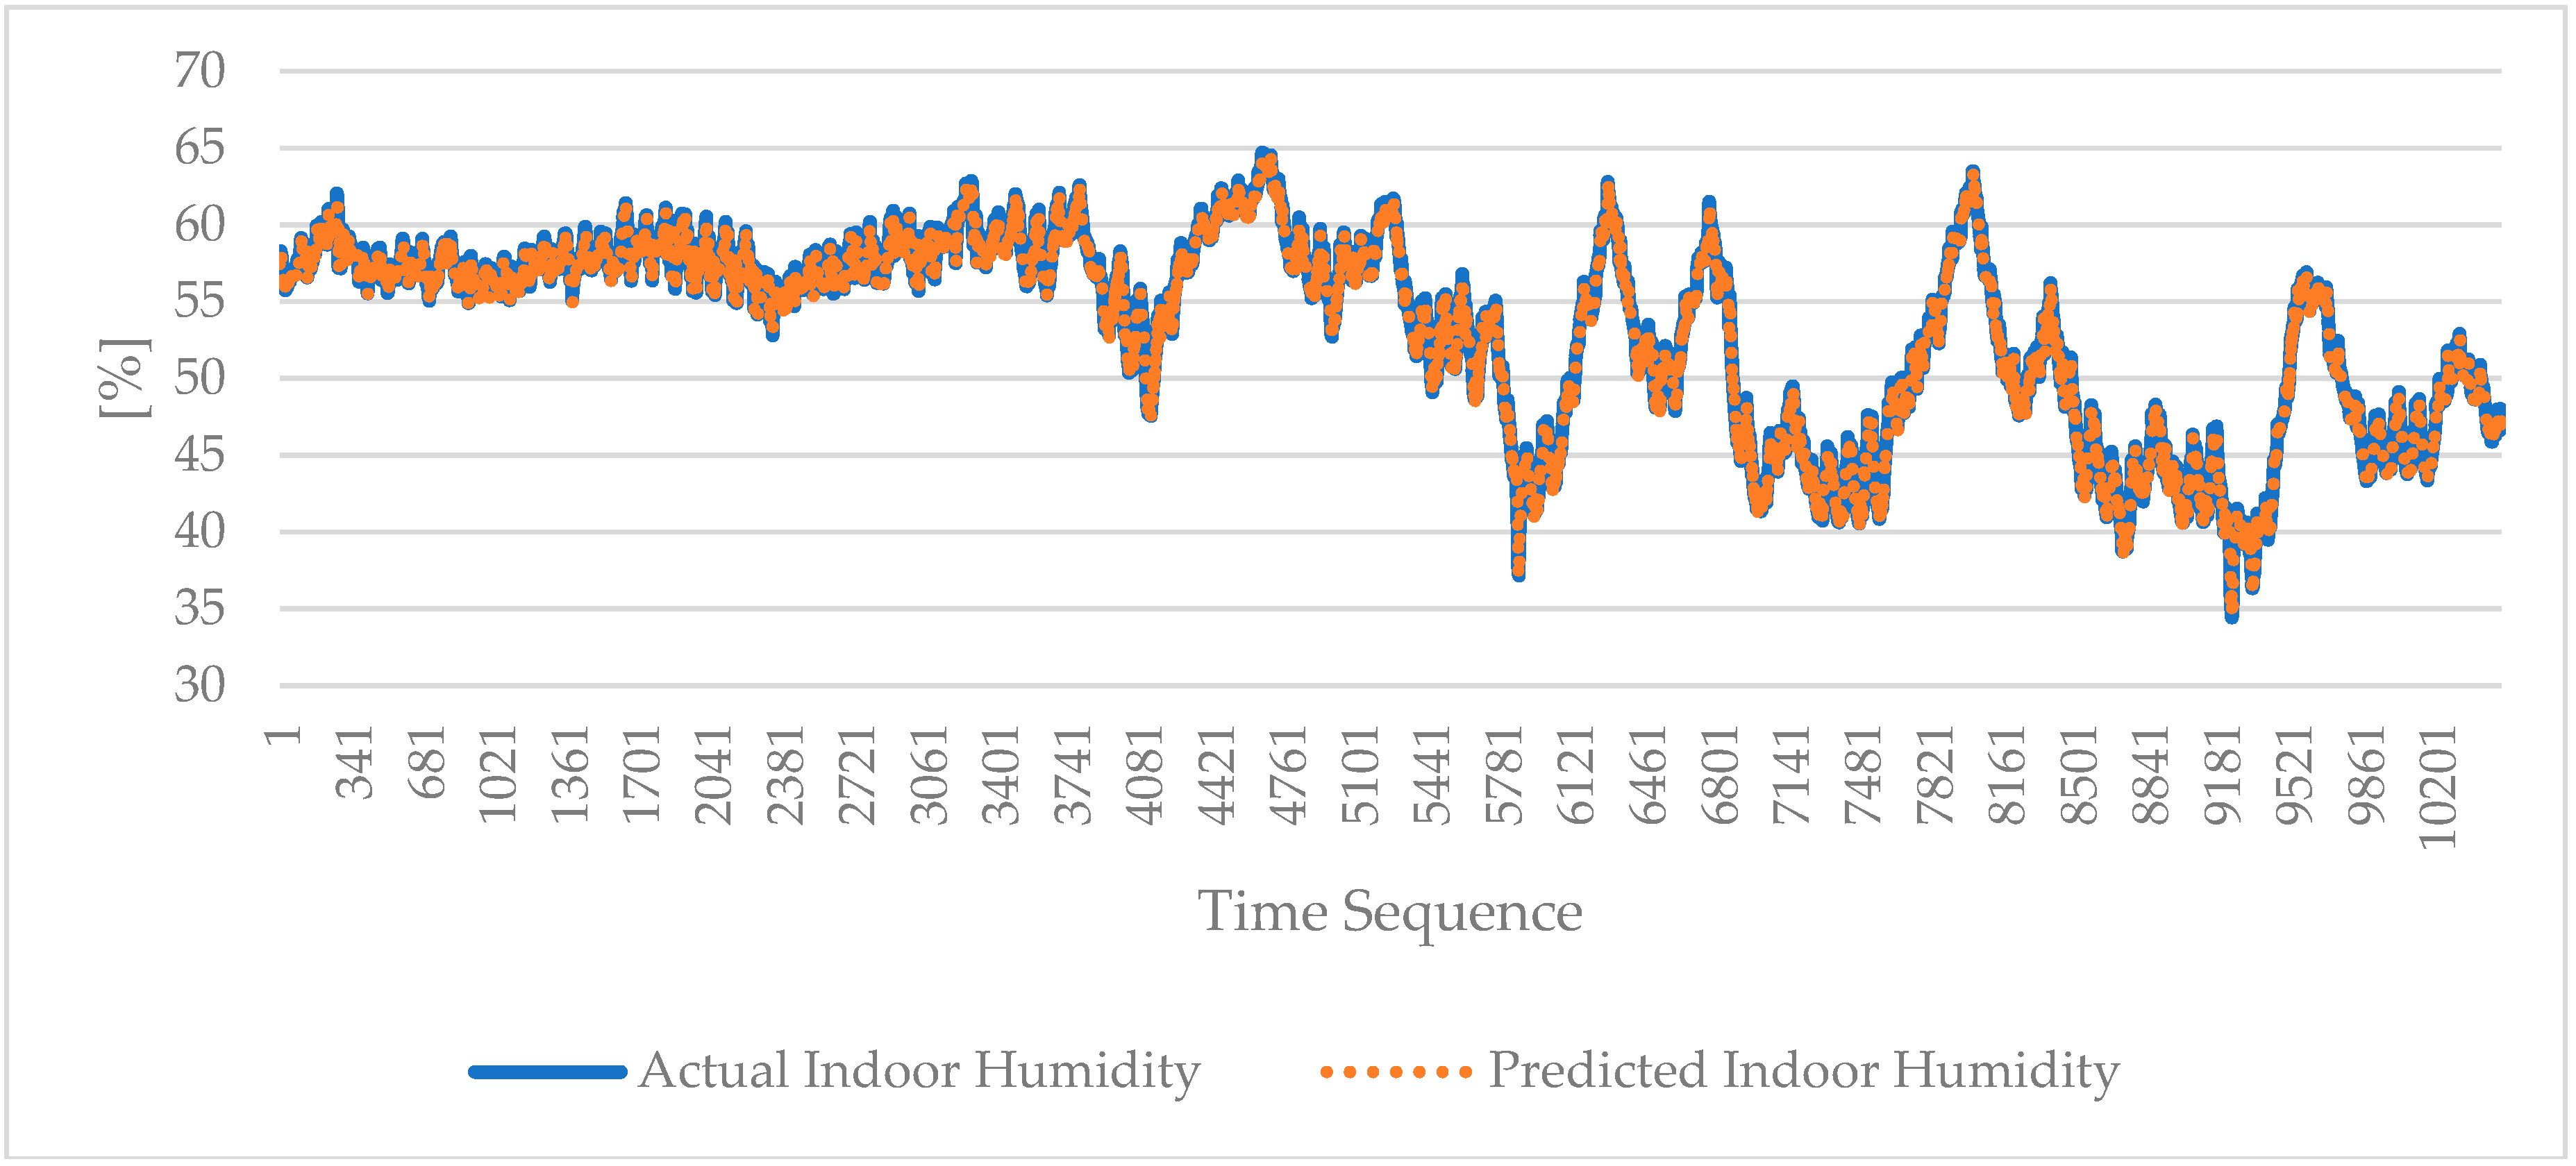
Figure 7 shows the data comparison between actual indoor humidity and predicted indoor humidity. The unit of the presented data is percentage (%), and the x-axis presents the sequence numbers. The actual data is presented for 10,512 values that show the indoor humidity in the experimental house from 13 September at 11:45 to 31 December at 23:30. The average humidity of the actual data was 53.4%, the minimum humidity was 34.44%, and the maximum humidity was 64.49%. The predicted data resulted from the HPM. The predicted data are also presented for 10,512 values. The average humidity of the predicted data was 53.21%, the minimum humidity was 34.37%, and the maximum humidity was 64.49%. The MAPE of the predicted data with actual data is 0.56%, the minimum absolute percentage error is 0.00%, and the maximum absolute percentage error is 4.53%.

4.2. Indoor Environmental User Comfort Prediction

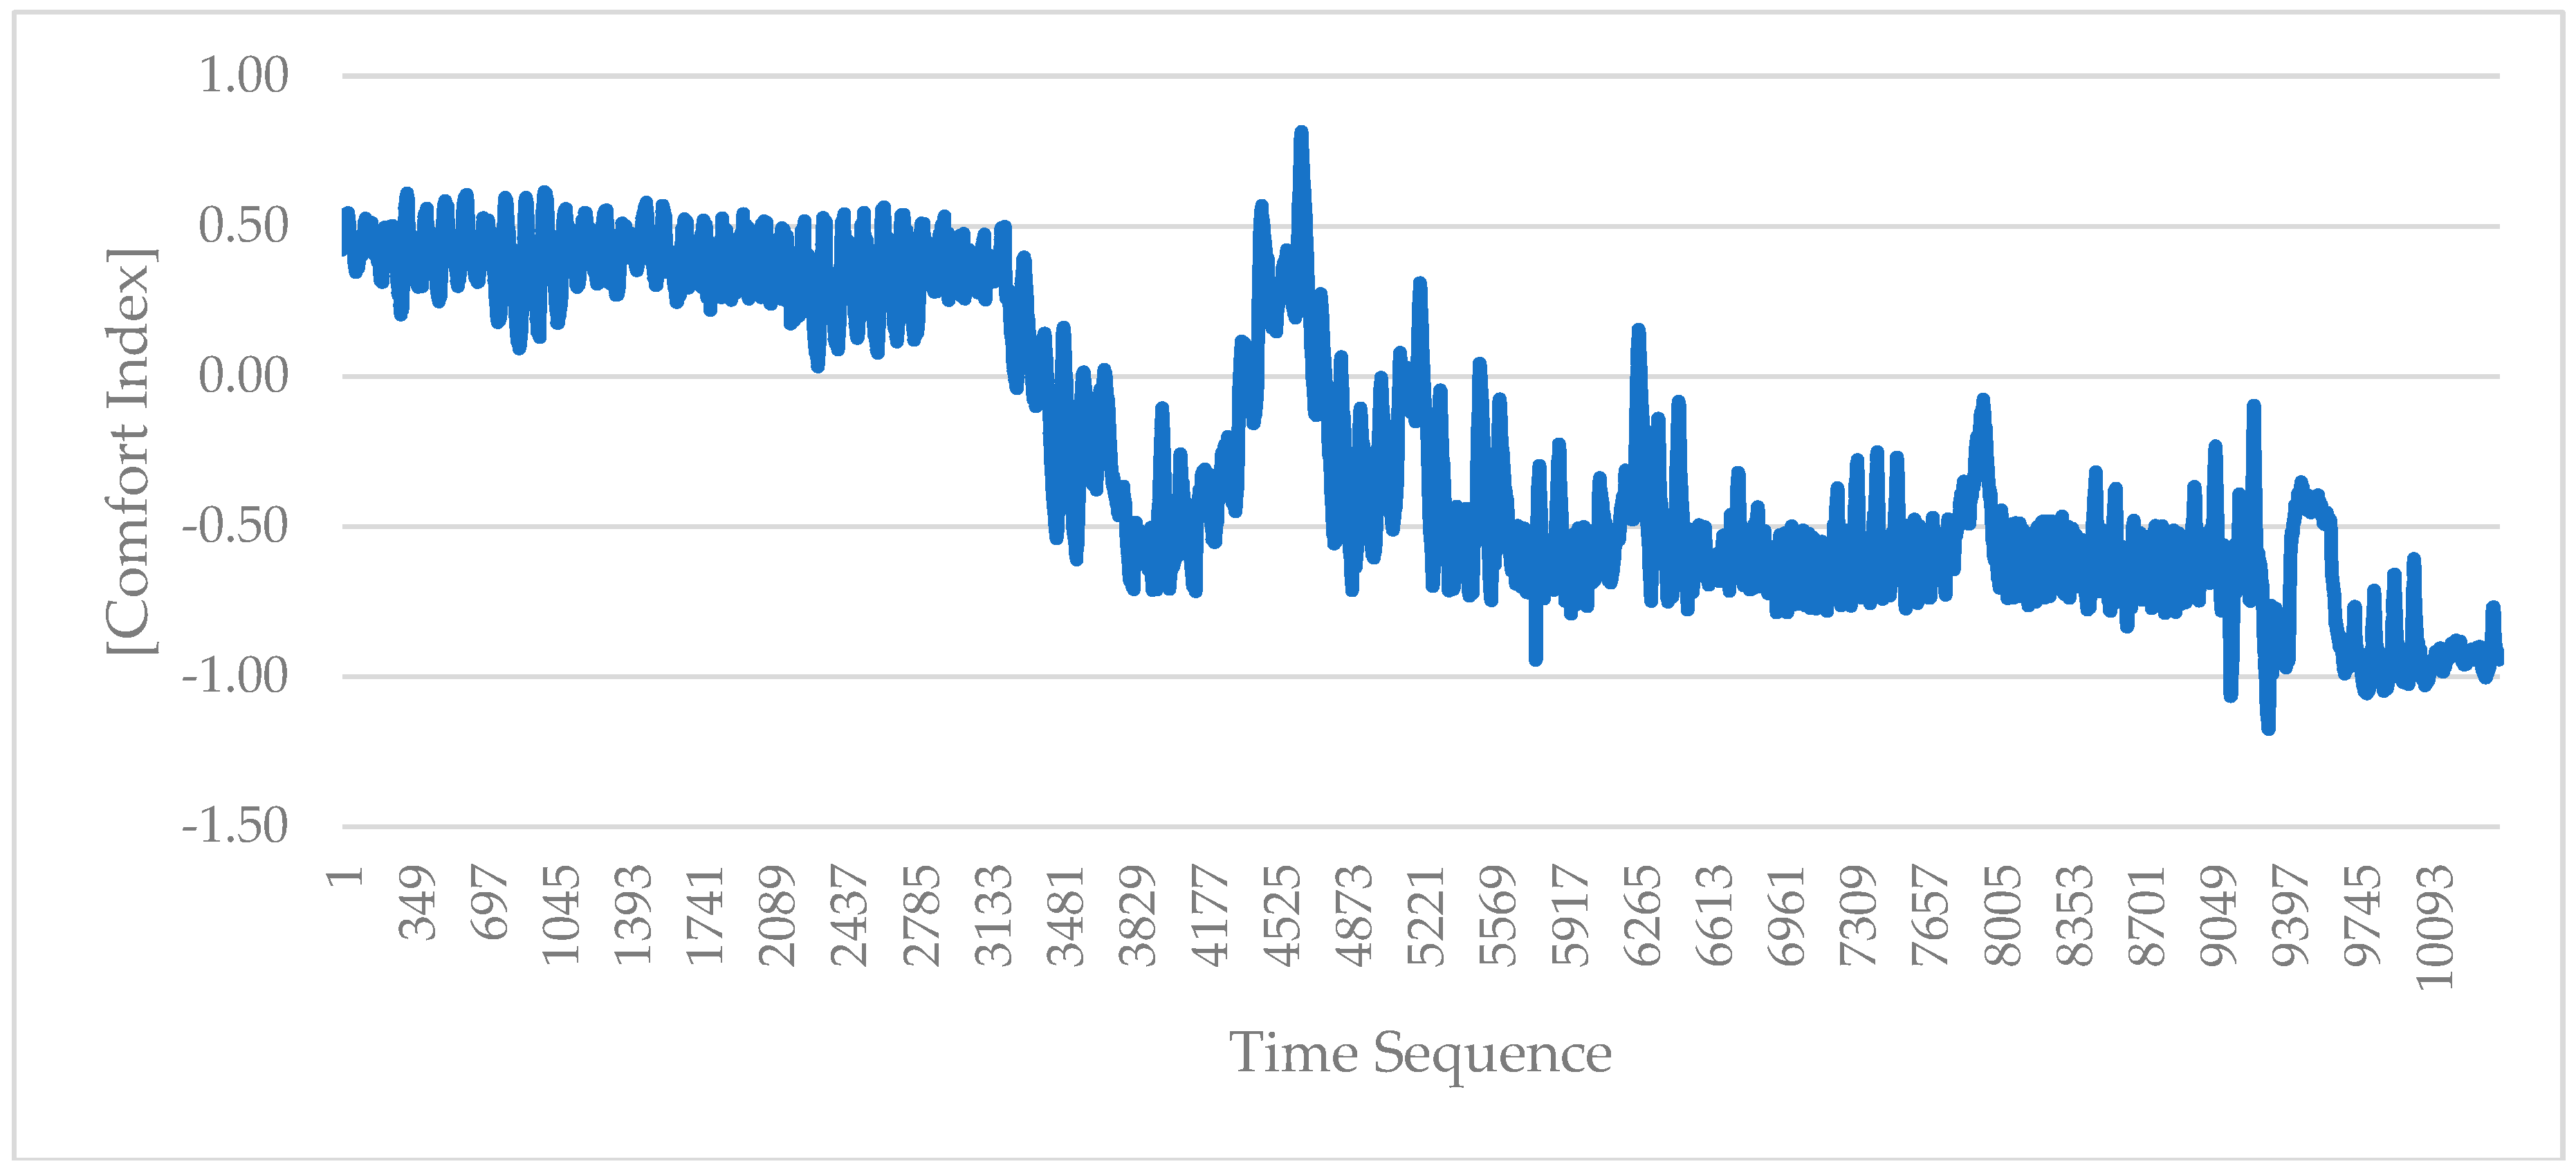
Figure 8 shows the PMV data based on the predicted indoor temperature and humidity data using TPM and HPM. Through the TPM, the indoor temperature data is predicted based on the TS, Ti, and To. Using the same RNN architecture, the HPM is used for predicting the indoor humidity data, based on the TS, Hi, and Ho. The PMV model derives the PMV data using these predicted temperature and humidity data. The other parameters are fixed values for the inputs of the model. The length of the presented PMV data is 10,512, which presents the future comfort index of the environment based on the predicted temperature and humidity. The minimum comfort index is −1.1, then the indoor temperature is 18.30 °C and indoor humidity is 41.64%. The maximum comfort index is 0.81, then the indoor temperature is 25.28 °C and indoor humidity is 61.35%.

4.3. Optimal Energy Consumption

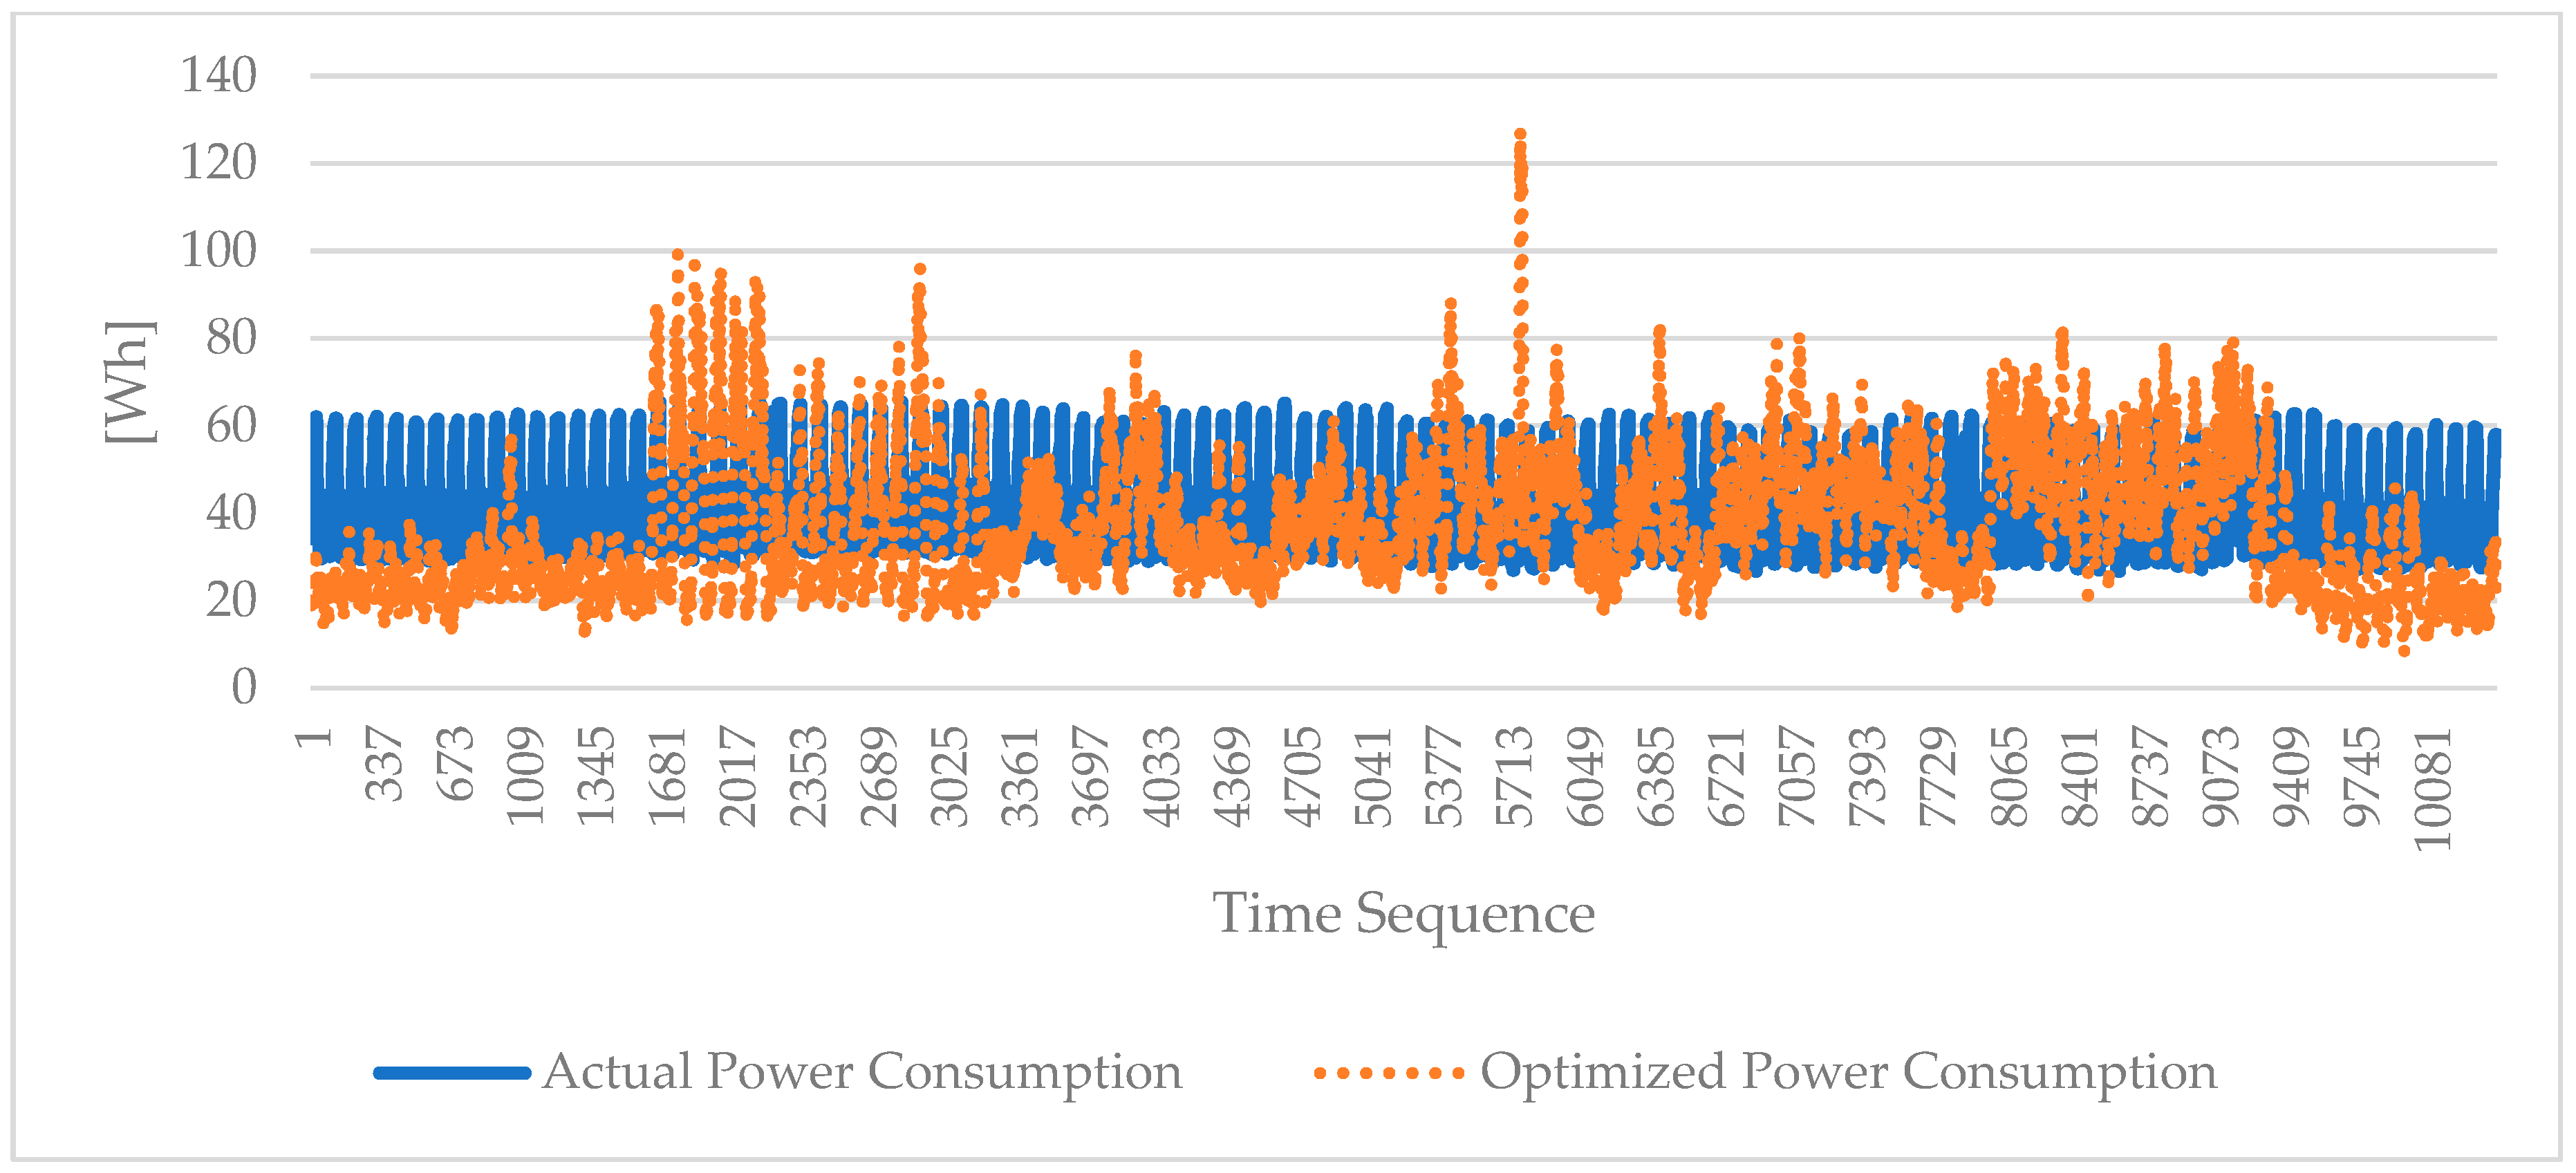
Figure 9 shows power consumption data based on the energy optimization model to operate the heater. Using the indoor temperature, humidity, and PMV data as the parameters of the input parameters for the optimization model, the optimal power value is derived be used in the heater. The purpose of the optimal energy consumption value is supporting high-level comfort, as well as minimum energy. To compare with actual energy consumption data, the optimized power consumption data is reduced by 8.43% for 10,400 collected values in the experiment. The total consumption of actual data was 414,887.06 Watt (W), and the total optimized power consumption was 382,622.91 W. The average of the actual data was 39.89 Watt-hour (Wh), the minimum was 26.75 Wh, and the maximum was 65.41 Wh. The average of the optimized power consumption is 36.79 Wh, the minimum is 8.20 Wh, and the maximum is 127.95 Wh.

4.4. Indoor Environment Using Optimal Power Consumption

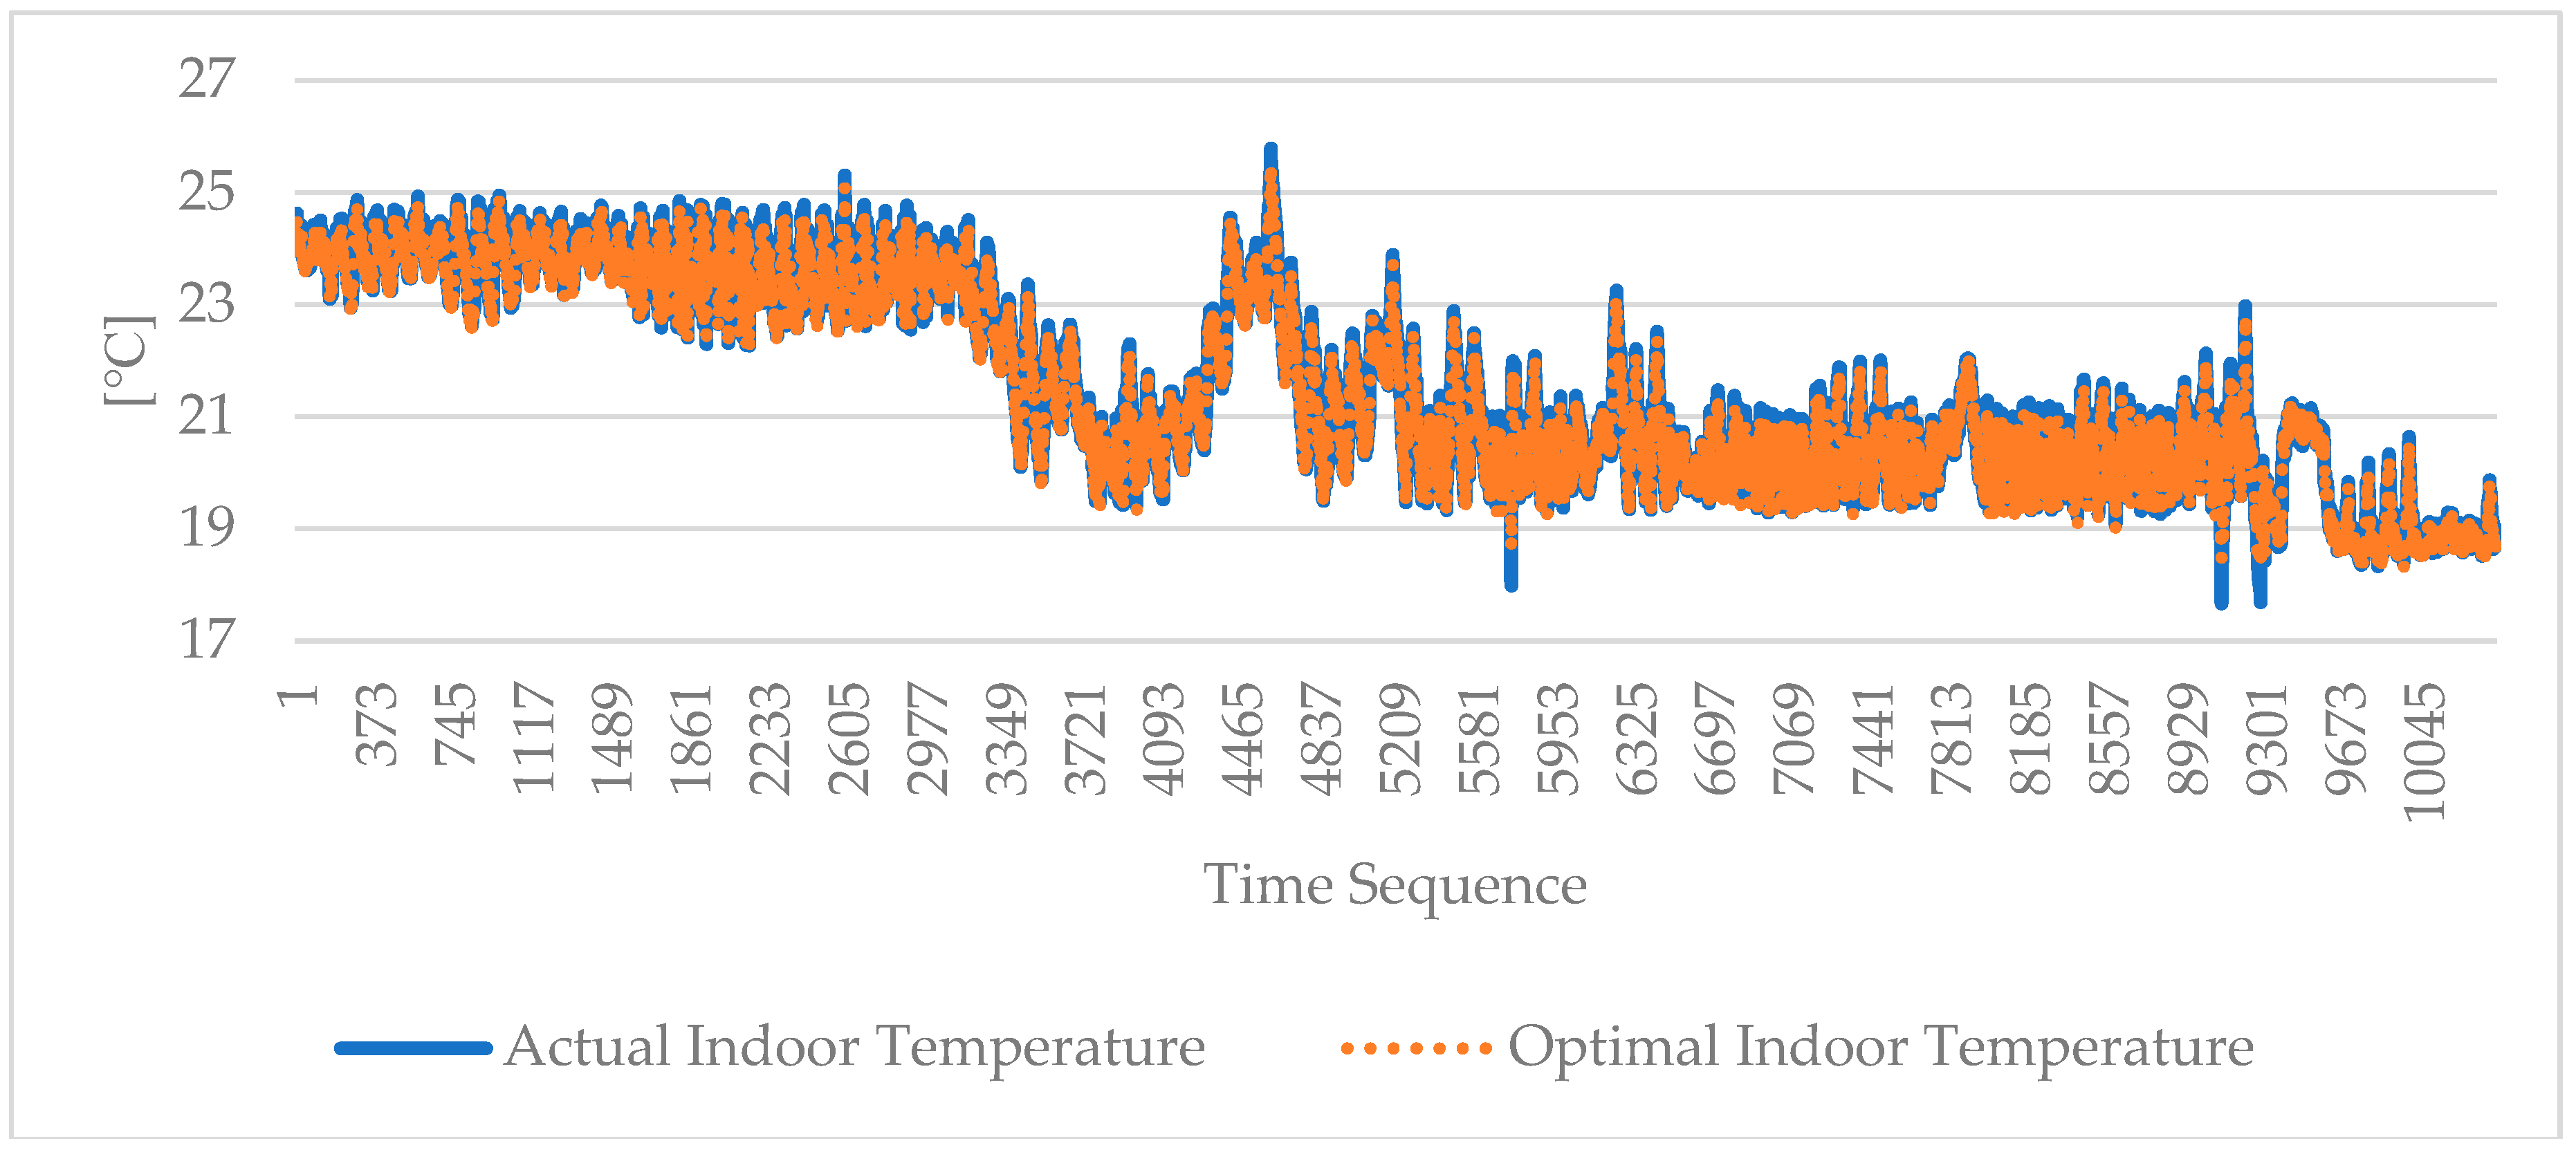
Figure 10 shows the data comparison between the actual indoor temperature and optimal indoor temperature. The average temperature of the actual data was 21.60 °C, the minimum temperature was 17.67 °C, and the maximum temperature was 25.79 °C. The average temperature of the optimal data was 21.51 °C, the minimum temperature was 18.26 °C, and the maximum temperature was 25.51 °C. The MAPE of the optimal data with the actual data is 0.42%, the minimum absolute percentage error is 0.00%, and the maximum absolute percentage error is 4.27%.
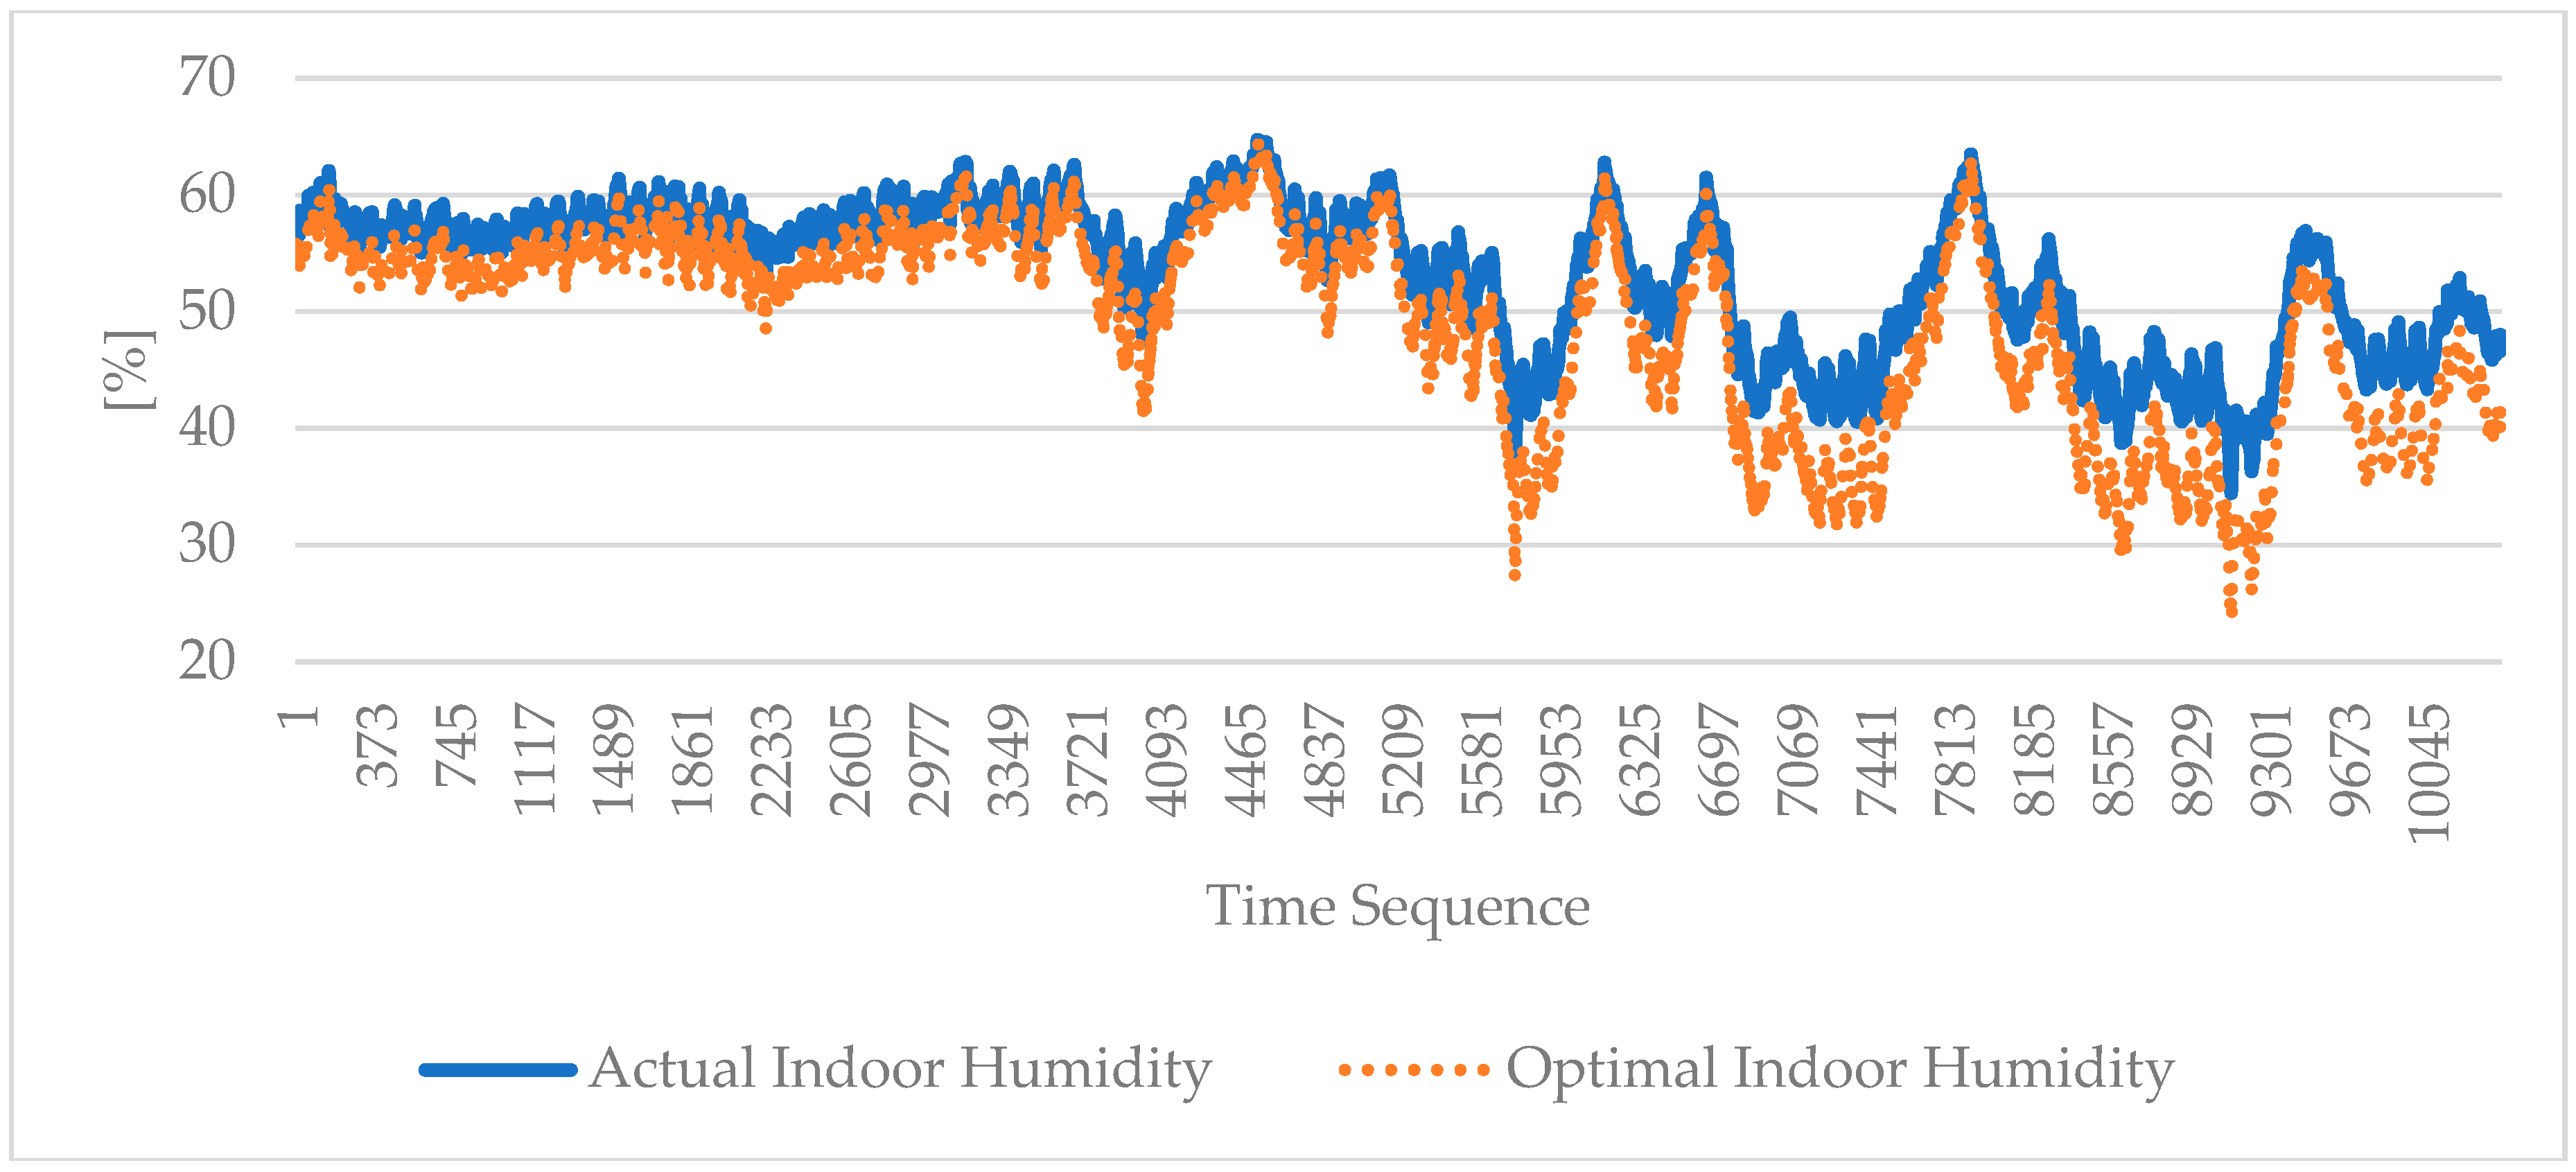
Figure 11 shows the data comparison between the actual indoor humidity and optimal indoor humidity. The average humidity of the actual data was 53.36%, the minimum humidity was 34.44%, and the maximum humidity was 64.72%. The average humidity of the optimal data was 53.36%, the minimum humidity was 23.66%, and the maximum humidity was 64.45%. The MAPE of the optimal data with actual data is 9.99%, the minimum absolute percentage error is 0.04%, and the maximum absolute percentage error is 46.09%.

5. Conclusions

In this paper, we propose an improved energy optimization model to recommend optimal power consumption for operating heaters, which is necessary to change the indoor environmental factors like temperature and humidity. We used indoor temperature and humidity as input parameters for the optimization model. We also used RNN and LSTM for prediction models to forecast energy consumption. The results of the prediction model suggest that the PMV values lead to the derivation of the comfort index values, which can be applied to the proposed optimization model. In the present experiment, we have exploited MAPE to predict indoor temperature values and indoor humidity values that have 1.05% and 0.56% differences with the actual data, respectively. Based on the predicted data with relation to the PMV data, the optimized power consumption for 10,400 records result in an 8.43% reduction compared to the actual data. Similarly, on the basis of the optimized power consumption, the indoor temperature data results in a 0.42% and indoor humidity data results in a 9.99% difference with the actual data. Consequently, the experimental results dictate that the proposed optimization scheme saves energy, as well as providing a comfortable environment, using the optimal power consumption to operate the heater and thus keep the user-desired temperature and humidity in the indoor environment.

Author Contributions

W.J., I.U., S.A. and D.H.K. designed the overall system. W.J. implemented the overall system and performed experiments. W.J. wrote this paper.

Funding

This research was funded by Korea government (MSIT) grant number 2018-0-01456.

Acknowledgments

This work was supported by Institute for Information & communications Technology Promotion (IITP) grant funded by the Korea government (MSIT) (No.2018-0-01456, AutoMaTa: Autonomous Management framework based on artificial intelligent Technology for adaptive and disposable IoT), and this research was supported by the MSIT (Ministry of Science and ICT), Korea, under the ITRC (Information Technology Research Center) support program (IITP-2017-2016-0-00313) supervised by the IITP (Institute for Information & communications Technology Promotion). Any correspondence related to this paper should be addressed to Dohyeun Kim.

Conflicts of Interest

The authors declare no conflict of interest.

References

  1. Rupp, R.F.; Vásquez, N.G.; Lamberts, R. A review of human thermal comfort in the built environment. Energy Build. 2015, 105, 178–205. [Google Scholar] [CrossRef]
  2. Yang, L.; Yan, H.; Lam, J.C. Thermal comfort and building energy consumption implications—A review. Appl. Energy 2014, 115, 164–173. [Google Scholar] [CrossRef]
  3. Chu, Y.; Xu, P.; Yang, Z.; Li, W. Existing building retrofitting for Indoor PM2.5 Concentration Control on Smog Days: Case study in China. Procedia Eng. 2017, 205, 3222–3227. [Google Scholar] [CrossRef]
  4. UN. World Urbanization Prospects: The 2014 Revision-Highlights; UN: New York, NY, USA, 2014. [Google Scholar]
  5. MacNaughton, P. Green Buildings and Health. 2016. Available online: https://dash.harvard.edu/handle/1/32644538 (accessed on 1 December 2018).
  6. Al Horr, Y.; Arif, M.; Kaushik, A.; Mazroei, A.; Katafygiotou, M.; Elsarrag, E. Occupant productivity and office indoor environment quality: A review of the literature. Build. Environ. 2016, 105, 369–389. [Google Scholar] [CrossRef] [Green Version]
  7. Haynes, B.; Suckley, L.; Nunnington, N. Workplace productivity and office type: An evaluation of office occupier differences based on age and gender. J. Corp Real Estate 2017, 19, 111–138. [Google Scholar] [CrossRef]
  8. Geng, Y.; Ji, W.; Lin, B.; Zhu, Y. The impact of thermal environment on occupant IEQ perception and productivity. Build. Environ. 2017, 121, 158–167. [Google Scholar] [CrossRef]
  9. Shaikh, P.H.; Nor, N.B.M.; Nallagownden, P.; Elamvazuthi, I.; Ibrahim, T. A review on optimized control systems for building energy and comfort management of smart sustainable buildings. Renew. Sustain. Energy Rev. 2014, 34, 409–429. [Google Scholar] [CrossRef]
  10. Wang, Z.; Yang, R.; Wang, L. Multi-agent intelligent controller design for smart and sustainable buildings. In Proceedings of the 2010 IEEE International Systems Conference, San Diego, CA, USA, 5–8 April 2010. [Google Scholar]
  11. Yang, R.; Wang, L. Optimal control strategy for HVAC system in building energy management. In Proceedings of the PES T&D 2012, Orlando, FL, USA, 7–10 May 2012; pp. 1–8. [Google Scholar]
  12. Dounis, A.; Caraiscos, C. Advanced control systems engineering for energy and comfort management in a building environment—A review. Renew. Sustain. Energy Rev. 2009, 13, 1246–1261. [Google Scholar] [CrossRef]
  13. Laftchiev, E.; Nikovski, D. An IoT system to estimate personal thermal comfort. In Proceedings of the 2016 IEEE 3rd World Forum on Internet of Things (WF-IoT), Reston, VA, USA, 12–14 December 2016; pp. 672–677. [Google Scholar]
  14. Farhan, A.A.; Pattipati, K.; Wang, B.; Luh, P. Predicting individual thermal comfort using machine learning algorithms. In Proceedings of the 2015 IEEE International Conference on Automation Science and Engineering (CASE), Gothenburg, Sweden, 24–28 August 2015; pp. 708–713. [Google Scholar]
  15. Afram, A.; Janabi-Sharifi, F.; Fung, A.S.; Raahemifar, K. Artificial neural network (ANN) based model predictive control (MPC) and optimization of HVAC systems: A state of the art review and case study of a residential HVAC system. Energy Build. 2017, 141, 96–113. [Google Scholar] [CrossRef]
  16. Zupančič, D.; Luštrek, M.; Gams, M. Trade-off between Energy Consumption and Comfort Experience in Smart Buildings. Inf. Technol. Control 2015, 44, 420–432. [Google Scholar] [CrossRef]
  17. Akkaya, K.; Guvenc, I.; Aygun, R.; Pala, N.; Kadri, A. IoT-based occupancy monitoring techniques for energy-efficient smart buildings. In Proceedings of the 2015 IEEE Wireless Communications and Networking Conference Workshops (WCNCW), New Orleans, LA, USA, 9–12 March 2015; pp. 58–63. [Google Scholar]
  18. Cannistraro, G.; Cannistraro, M.; Trovato, G. Island “Smart Energy” for Eco- Sustainable Energy—A Case Study “Favignana Island”. Int. J. Heat Techol. 2017, 35, S87–S95. [Google Scholar] [CrossRef]
  19. Suryadevara, N.K.; Mukhopadhyay, S.C.; Kelly, S.D.T.; Gill, S.P.S. WSN-Based Smart Sensors and Actuator for Power Management in Intelligent Buildings. IEEE/ASME Trans. Mechatron. 2015, 20, 564–571. [Google Scholar] [CrossRef]
  20. Cannistraro, M.; Lorenzini, E. The Applications of the New Techologies E-Sensing in Hospitals. Int. J. Heat Techol. 2016, 34, 551–557. [Google Scholar] [CrossRef]
  21. Wang, J.; Wang, J. Forecasting energy market indices with recurrent neural networks: Case study of crude oil price fluctuations. Energy 2016, 102, 365–374. [Google Scholar] [CrossRef]
  22. Long-term energy/environment data for ORNL Research House #3. Available online: https://openei.org/datasets/dataset/ornl-research-house-3 (accessed on 1 July 2018).
  23. Kim, J.; Schiavon, S.; Brager, G. Personal comfort models—A new paradigm in thermal comfort for occupant-centric environmental control. Build. Environ. 2018, 132, 114–124. [Google Scholar] [CrossRef]
  24. Mossolly, M.; Ghali, K.; Ghaddar, N. Optimal control strategy for a multi-zone air conditioning system using a genetic algorithm. Energy 2009, 34, 58–66. [Google Scholar] [CrossRef]
  25. Peeters, L.; De Dear, R.; Hensen, J.; D’Haeseleer, W. Thermal comfort in residential buildings: Comfort values and scales for building energy simulation. Appl. Energy 2009, 86, 772–780. [Google Scholar] [CrossRef] [Green Version]
  26. Wang, Z.; Wang, L.; Dounis, A.I.; Yang, R. Multi-agent control system with information fusion based comfort model for smart buildings. Appl. Energy 2012, 99, 247–254. [Google Scholar] [CrossRef]
  27. Molina-Solana, M.; Ros, M.; Ruiz, M.D.; Gómez-Romero, J.; Martin-Bautista, M. Data science for building energy management: A review. Renew. Sustain. Energy Rev. 2017, 70, 598–609. [Google Scholar] [CrossRef] [Green Version]
  28. Široký, J.; Oldewurtel, F.; Cigler, J.; Prívara, S. Experimental analysis of model predictive control for an energy efficient building heating system. Appl. Energy 2011, 88, 3079–3087. [Google Scholar] [CrossRef]
  29. Dounis, A.; Santamouris, M.; Lefas, C. Building visual comfort control with fuzzy reasoning. Energy Convers. Manag. 1993, 34, 17–28. [Google Scholar] [CrossRef]
  30. Jabłoński, K.; Grychowski, T. Fuzzy inference system for the assessment of indoor environmental quality in a room. Indoor Built Environ. 2017, 27, 1415–1430. [Google Scholar] [CrossRef]
  31. Aste, N.; Manfren, M.; Marenzi, G. Building Automation and Control Systems and performance optimization: A framework for analysis. Renew. Sustain. Energy Rev. 2017, 75, 313–330. [Google Scholar] [CrossRef]
  32. Manic, M.; Wijayasekara, D.; Amarasinghe, K.; Rodriguez-Andina, J.J. Building Energy Management Systems: The Age of Intelligent and Adaptive Buildings. IEEE Ind. Electron. Mag. 2016, 10, 25–39. [Google Scholar] [CrossRef]
  33. Shaikh, P.H.; Nor, N.B.M.; Nallagownden, P.; Elamvazuthi, I. Stochastic optimized intelligent controller for smart energy efficient buildings. Sustain. Cities Soc. 2014, 13, 41–45. [Google Scholar] [CrossRef]
  34. Hall, D.; Llinas, J. An introduction to multisensor data fusion. Proc. IEEE 1997, 85, 6–23. [Google Scholar] [CrossRef]
  35. Dounis, A.I.; Caraiscos, C. Intelligent coordinator of fuzzy controller-agents for indoor environment control in buildings using 3-D fuzzy comfort set. In Proceedings of the 2007 IEEE International Fuzzy Systems Conference, London, UK, 23–26 July 2007. [Google Scholar]
  36. Karaboga, D. An Idea Based on Honey Bee Swarm for Numerical Optimization; Technical Report-tr06; Computer Engineering Department, Engineering Faculty, Erciyes University: Talas, Turkey, 2005; Volume 200. [Google Scholar]
  37. Fong, K.; Hanby, V.; Chow, T. System optimization for HVAC energy management using the robust evolutionary algorithm. Appl. Therm. Eng. 2009, 29, 2327–2334. [Google Scholar] [CrossRef]
  38. Wright, J.A.; Loosemore, H.A.; Farmani, R. Optimization of building thermal design and control by multi-criterion genetic algorithm. Energy Build. 2002, 34, 959–972. [Google Scholar] [CrossRef]
  39. Soares, N.; Bastos, J.; Pereira, L.D.; Soares, A.; Amaral, A.; Asadi, E.; Rodrigues, E.; Lamas, F.; Monteiro, H.; Lopes, M.; et al. A review on current advances in the energy and environmental performance of buildings towards a more sustainable built environment. Renew. Sustain. Energy Rev. 2017, 77, 845–860. [Google Scholar] [CrossRef] [Green Version]
  40. Serale, G.; Fiorentini, M.; Capozzoli, A.; Bernardini, D.; Bemporad, A. Model Predictive Control (MPC) for Enhancing Building and HVAC System Energy Efficiency: Problem Formulation, Applications and Opportunities. Energies 2018, 11, 631. [Google Scholar] [CrossRef]
  41. Huang, W.; Lam, H. Using genetic algorithms to optimize controller parameters for HVAC systems. Energy Build. 1997, 26, 277–282. [Google Scholar] [CrossRef]
  42. Delgarm, N.; Sajadi, B.; Kowsary, F.; Delgarm, S. Multi-objective optimization of the building energy performance: A simulation-based approach by means of particle swarm optimization (PSO). Appl. Energy 2016, 170, 293–303. [Google Scholar] [CrossRef]
  43. Wang, Z.; Yang, R.; Wang, L. Multi-agent control system with intelligent optimization for smart and energy-efficient buildings. In Proceedings of the IECON 2010—36th Annual Conference on IEEE Industrial Electronics Society, Glendale, AZ, USA, 7–10 November 2010. [Google Scholar]
  44. Ullah, I.; Kim, D. An Improved Optimization Function for Maximizing User Comfort with Minimum Energy Consumption in Smart Homes. Energies 2017, 10, 1818. [Google Scholar] [CrossRef]
  45. Cetin, K.; Tabares-Velasco, P.; Novoselac, A. Appliance daily energy use in new residential buildings: Use profiles and variation in time-of-use. Energy Build. 2014, 84, 716–726. [Google Scholar] [CrossRef]
  46. Ullah, I.; Ahmad, R.; Kim, D. A Prediction Mechanism of Energy Consumption in Residential Buildings Using Hidden Markov Model. Energies 2018, 11, 358. [Google Scholar] [CrossRef]
  47. Tripathy, M. Power transformer differential protection using neural network Principal Component Analysis and Radial Basis Function Neural Network. Simul. Model. Pract. Theory 2010, 18, 600–611. [Google Scholar] [CrossRef]
  48. Niu, H.; Wang, J. Financial time series prediction by a random data-time effective RBF neural network. Soft Comput. 2013, 18, 497–508. [Google Scholar] [CrossRef]
  49. Sermpinis, G.; Stasinakis, C.; Dunis, C. Stochastic and genetic neural network combinations in trading and hybrid time-varying leverage effects. J. Int. Financ. Mark. Inst. Money 2014, 30, 21–54. [Google Scholar] [CrossRef] [Green Version]
  50. Schmidhuber, J. Deep learning in neural networks: An overview. Neural Netw. 2015, 61, 85–117. [Google Scholar] [CrossRef] [Green Version]
  51. Mudassar, L.; Byun, Y. Customer Prediction on Parking Logs Using Recurrent Neural Network. In International Conference on Software Engineering, Artificial Intelligence, Networking and Parallel/Distributed Computing; Springer: Cham, Switzerland, 2018. [Google Scholar]
  52. Jain, V.; Seung, S. Natural image denoising with convolutional networks. In Proceedings of the Twenty-Second Annual Conference on Neural Information Processing Systems, Vancouver, BC, Canada, 8–11 December 2008. [Google Scholar]
  53. Fernández, S.; Graves, A.; Schmidhuber, J. Sequence labelling in structured domains with hierarchical recurrent neural networks. In Proceedings of the 20th International Joint Conference on Artificial Intelligence, IJCAI 2007, Hyderabad, India, 6–12 January 2007. [Google Scholar]
  54. Wu, Z.; Ma, X.; Yu, H.; Wang, S.; Wang, Y. Spatiotemporal Recurrent Convolutional Networks for Traffic Prediction in Transportation Networks. Sensors 2017, 17, 1501. [Google Scholar] [Green Version]
  55. Cheng, L.; Zang, H.; Ding, T.; Sun, R.; Wang, M.; Wei, Z.; Sun, G. Ensemble Recurrent Neural Network Based Probabilistic Wind Speed Forecasting Approach. Energies 2018, 11, 1958. [Google Scholar] [CrossRef]
  56. Chemali, E.; Kollmeyer, P.J.; Preindl, M.; Ahmed, R.; Emadi, A.; Kollmeyer, P. Long Short-Term Memory Networks for Accurate State-of-Charge Estimation of Li-ion Batteries. IEEE Trans. Ind. Electron. 2018, 65, 6730–6739. [Google Scholar] [CrossRef]
  57. Tam, Y.-C.; Shi, Y.; Chen, H.; Hwang, M.-Y. RNN-based labeled data generation for spoken language understanding. In Proceedings of the Sixteenth Annual Conference of the International Speech Communication Association, Dresden, Germany, 6–10 September 2015. [Google Scholar]
  58. Zhao, Z.; Chen, W.; Wu, X.; Chen, P.C.Y.; Liu, J. LSTM network: A deep learning approach for short-term traffic forecast. IET Intell. Transp. Syst. 2017, 11, 68–75. [Google Scholar] [CrossRef]
  59. Fanger, P.O. Thermal Comfort: Analysis and Applications in Environmental Engineering; Danish Technical Press: Copenhagen, Denmark, 1970. [Google Scholar]
  60. Olesen, B.W.; Parsons, K.C. Introduction to thermal comfort standards and to the proposed new version of EN ISO 7730. Energy Build. 2002, 34, 537–548. [Google Scholar] [CrossRef]
  61. ISO EN7730:2005. Ergonomics of the Thermal Environment-Analytical Determination and Interpretation of Thermal Comfort Using Calculation of the PMV and PPD Indices and Local Thermal Comfort Criteria; ISO: Geneva, Switzerland, 2005. [Google Scholar]
  62. Chen, X.; Wang, Q.; Srebric, J. A data-driven state-space model of indoor thermal sensation using occupant feedback for low-energy buildings. Energy Build. 2015, 91, 187–198. [Google Scholar] [CrossRef]
  63. Ghahramani, A.; Castro, G.; Becerik-Gerber, B.; Yu, X. Infrared thermography of human face for monitoring thermoregulation performance and estimating personal thermal comfort. Build. Environ. 2016, 109, 1–11. [Google Scholar] [CrossRef] [Green Version]
  64. Ari, S.; Wilcoxen, P.; Khalifa, H.E.; Dannenhoffer, J.F.; Işik, C. A practical approach to individual thermal comfort and energy optimization problem. In Proceedings of the NAFIPS 2008—2008 Annual Meeting of the North American Fuzzy Information Processing Society, New York, NY, USA, 19–22 May 2008. [Google Scholar]
  65. Kawakami, K. Supervised Sequence Labelling with Recurrent Neural Networks. Ph.D. Thesis, Technical University of Munich, Munich, Germany, 2008. [Google Scholar]
  66. Cannistraro, M.; Cannistraro, G.; Restivo, R. The Local Media Radiant Temperature for the Calcuilation of Comfort in Areas Characterized by Radiant Surfaces. Int. J. Heat Techol. 2015, 33, 115–122. [Google Scholar] [CrossRef]
  67. Cannistraro, M.; Cannistraro, G.; Restivo, R. Some Observations on the Influence on Exchanges Radiative. Int. J. Heat Techol. 2015, 33, 79–84. [Google Scholar] [CrossRef]
  68. Cannistraro, M.; Cannistraro, G.; Restivo, R. Smart Controll of Air Climatization System in Function on the Values of the Mean Local Radiant Temperature. Smart Sci. 2015, 3. [Google Scholar] [CrossRef]
  69. Tetens, O. Uber einige meteorologische Begriffe. Z. Geophys. 1930, 6, 297–309. [Google Scholar]
  70. Snyder, R.L. Humidity Conversion; Biometeorology Program, University of California: Davis, CA, USA, 2005. [Google Scholar]
  71. CBE Thermal Comfort Tool. Available online: http://comfort.cbe.berkeley.edu (accessed on 12 December 2018).
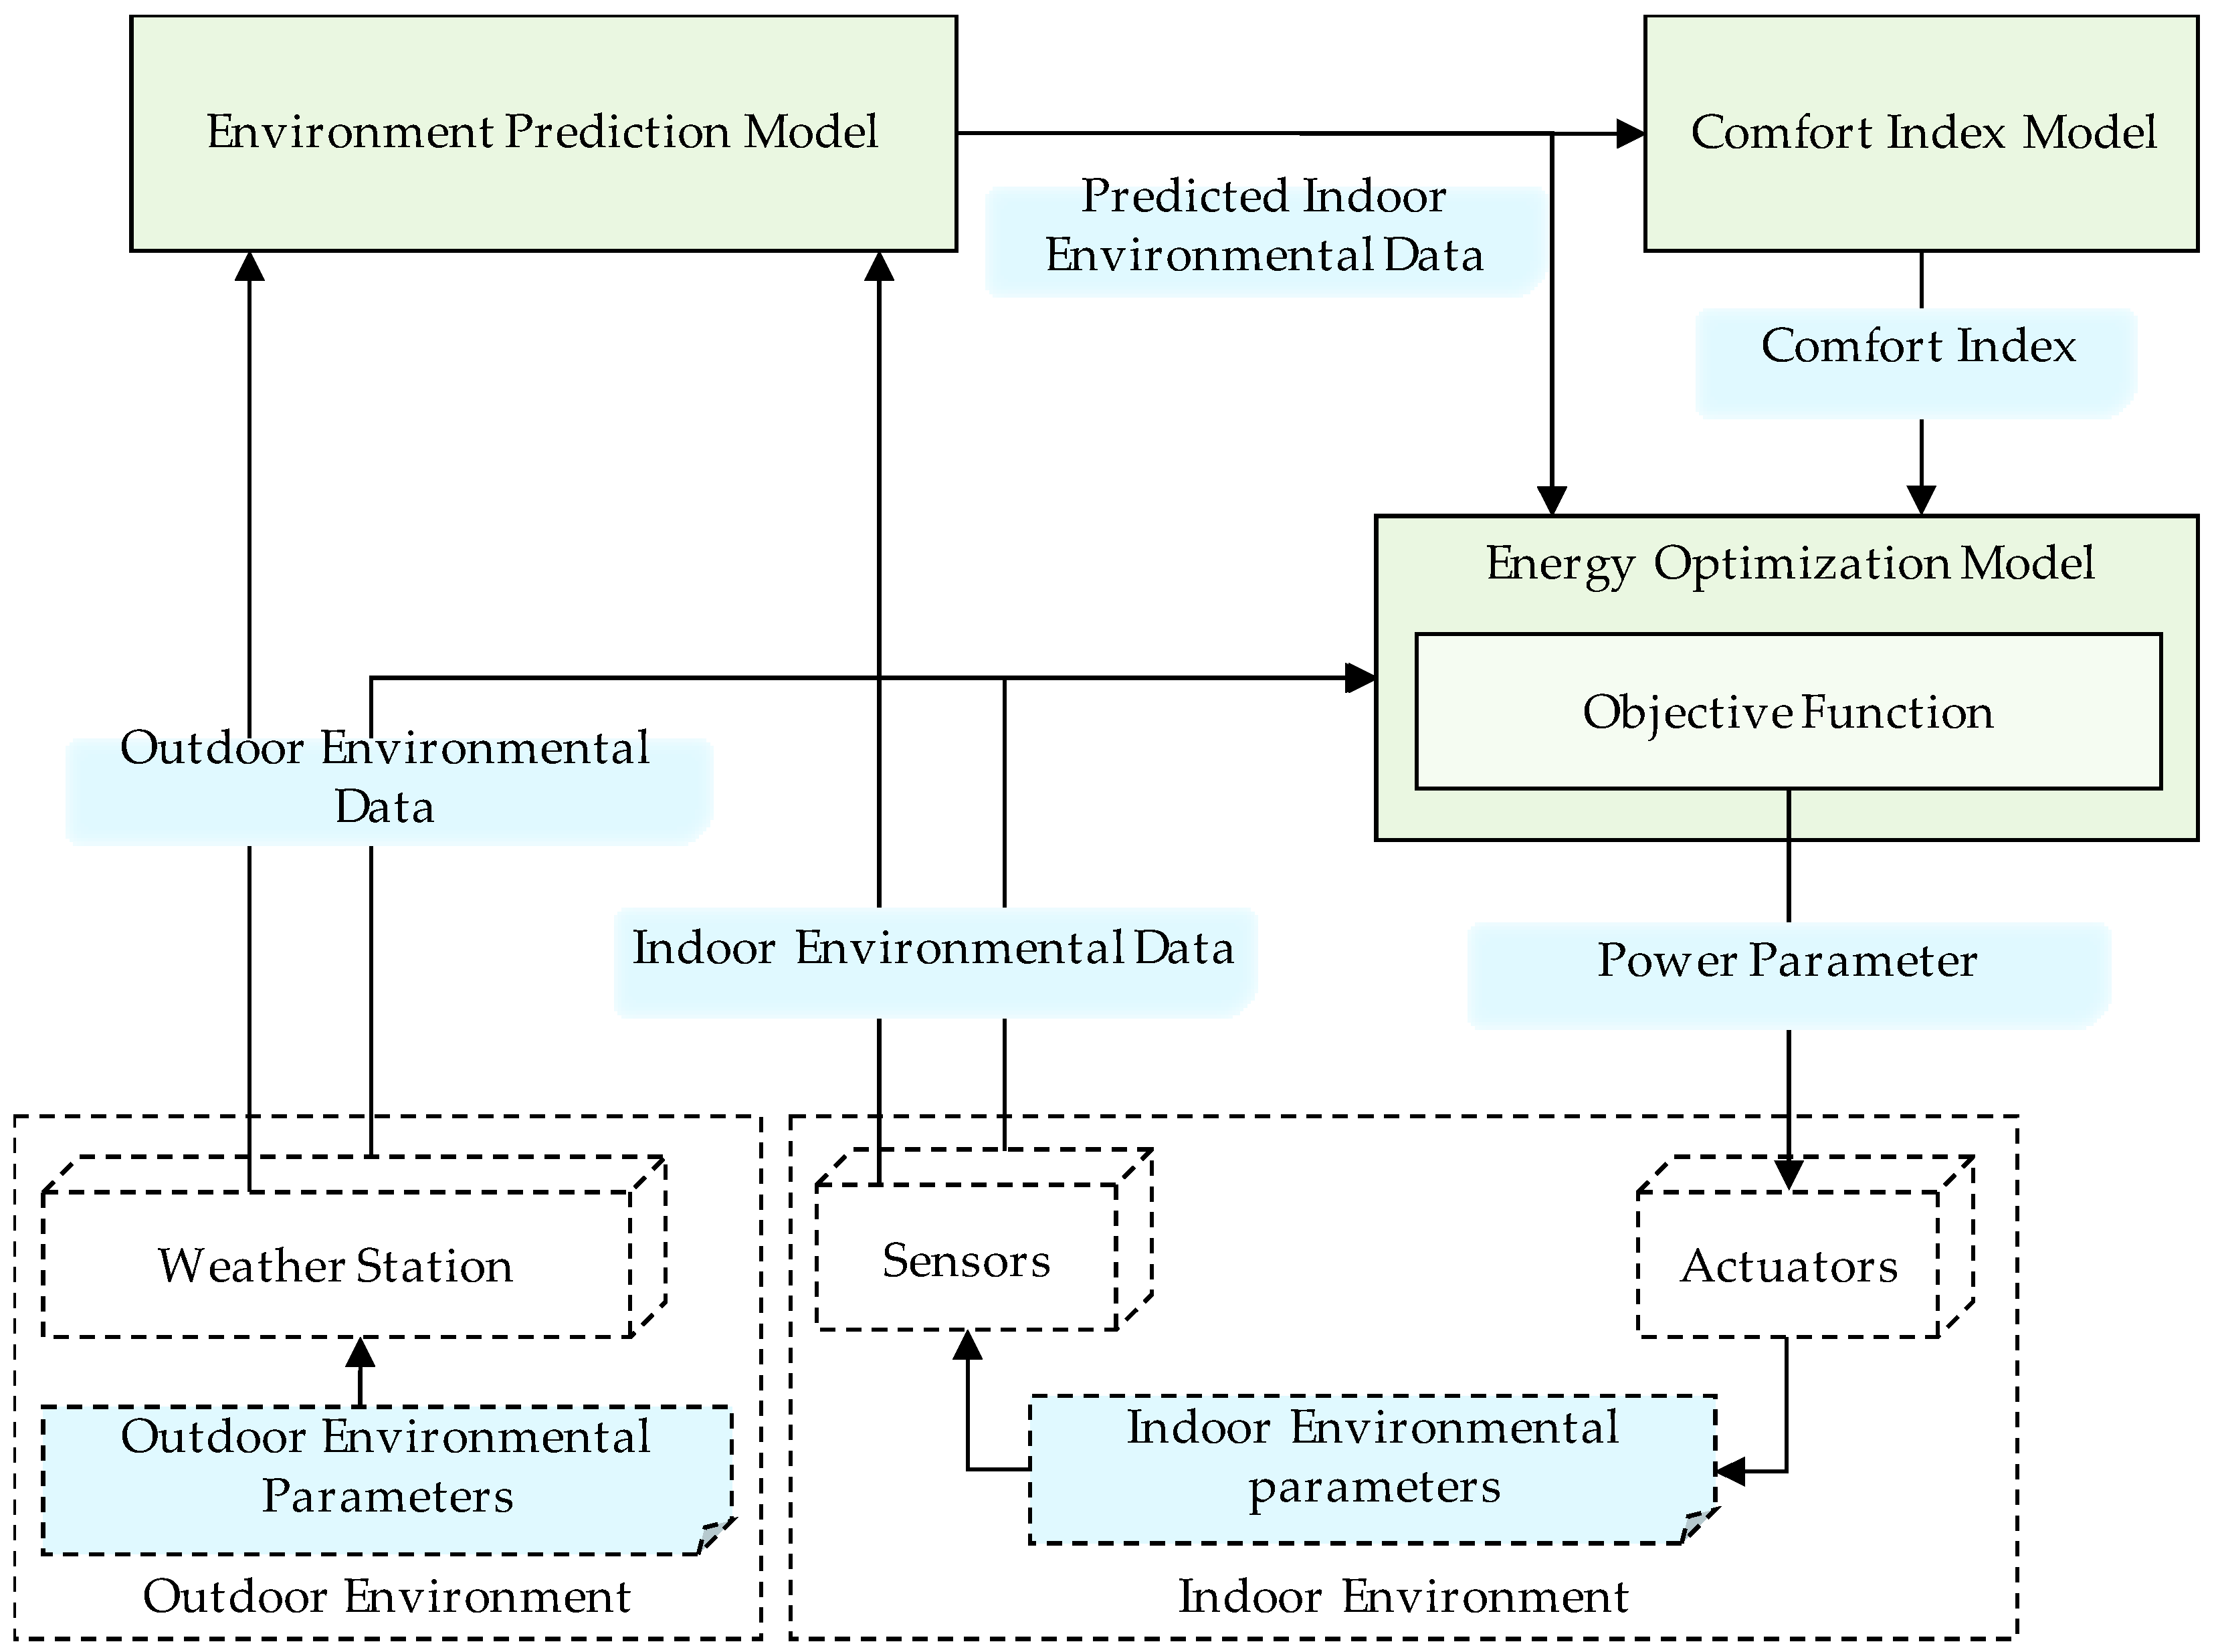
Figure 1. Energy consumption optimization based on environmental parameter prediction.
Sustainability 11 00997 g001
Figure 2. Environmental prediction model based on indoor and outdoor temperature and humidity.
Sustainability 11 00997 g002
Figure 3. Recurrent neural network (RNN)-based indoor environment prediction model.
Sustainability 11 00997 g003
Figure 4. Architecture of the proposed occupant comfort management based on the prediction model.
Sustainability 11 00997 g004
Figure 5. Operation of a heater based on an optimization model using an objective function.
Sustainability 11 00997 g005
Figure 6. Data comparison between the actual indoor temperature and predicted indoor temperature.
Sustainability 11 00997 g006
Figure 7. Data comparison between actual indoor humidity and predicted indoor humidity.
Sustainability 11 00997 g007
Figure 8. Predicted mean vote (PMV) data based on predicted indoor temperature and humidity data.
Sustainability 11 00997 g008
Figure 9. Optimal power consumption data for operating heater.
Sustainability 11 00997 g009
Figure 10. Data comparison between actual indoor temperature and optimal indoor temperature.
Sustainability 11 00997 g010
Figure 11. Data comparison between actual indoor humidity and optimal indoor humidity.
Sustainability 11 00997 g011