2. Theoretical Background and Empirical Evidences
One of the central and favorite topics in the corporate governance and financial management research refers to the link between ownership structure and corporate performance, as a specific concern derived from the agency theory. As such, research on this topic has flourished particularly after the publication of Jensen [
1] and Demsetz [
2], but overall with more attention paid to the nature of ownership—i.e., family versus non-family firms—than to the degree of ownership concentration. Moreover, the existing literature shows less concern about the relationship between ownership and performance in the case of emerging economies, including those that are now part of the European Union. At the same time, only recent investigations have tackled the issue of performance and ownership in economic downturns or in stressed economic environments after major crises.
The crisis that originated in the United States’ financial sector at the end of 2007 and spread towards the European Union in 2008 represented a major shock for the real economy, by its dramatic negative impact on corporate performance, subsequently reflected in stock returns. Moreover, the European Union confronted itself with a second crisis in 2009–2011, as a result of unsustainable government debt in part of the countries that are members of the European and Monetary Union (EMU)—Greece, Ireland, Italy, Portugal and Spain. The rise in bond yield spreads for government-issued securities has led to the augmentation of volatility in financial markets, with negative impact on asset prices [
3] and corporate performance. There is research that documents this negative impact of high levels of government debt on businesses through higher borrowing costs [
4] and by crowding out credit to the private sector, generating lower investment and growth [
5].
The agency theory’s assumptions that business owners’ interests towards profit maximization or shareholders’ value, on one hand; and managers’ interests towards increased compensation, lower levels of effort, preferred expenses and so on, on the other hand, collide, are well known to scholars interested in corporate governance. The empirical research that attempted to confirm or contradict these assumptions is extremely diverse and has focused on the consequences of the existing conflict between owners and shareholders, but also on the mechanisms and tools available to and used by shareholders in order to control managers and induce a conduct that maximizes shareholders’ value, and not advantages to managers. In studies concentrated on managerial propensity towards diversification as detrimental for shareholders’ returns, the seminal paper of Amihud and Lev [
6] concluded that large block shareholders are more likely to discourage the engagement of management in mergers and acquisitions that reduce shareholders’ value; their results have been supported by other research [
7,
8,
9,
10], although Lane et al. [
11] have contradicted these findings. The other stream of research based on agency theory is more concerned with mechanisms available to shareholders aimed at inducing managers to maximize profits and shareholders’ value, building on the assumption that large shareholders and, more generally, a more concentrated ownership, are able to reduce excessive diversification and enhance corporate performance, by a stricter management monitoring [
12,
13,
14]. Thus, Dzingai and Fakoya [
15] find that effective corporate governance through a small effective board and monitoring by an independent board result in increased firm financial performance. Still, Fama and Jensen [
16] suggest that concentrated ownership above a certain level might prove to be counterproductive, as it may entrench managers and expropriate the wealth of smaller, minority shareholders. Their findings are confirmed by Morck et al. [
17], Claessens et al. [
18] or Benedsen and Nielsen [
19]. More recently, Salvionni et al. [
20] militate for sustainable corporate governance structures that are valuable for shareholders and show that such structures reflect the differences between insider and outsider ownership patterns.
Building on these contributions, literature has provided so far mixed answers to the question of whether a more concentrated ownership leads to improved corporate performance, showing that the link between ownership and performance is intermediated by specific conditions and circumstances. Moreover, Demsetz [
2] argues that the ownership structure of the firm is “an endogenous outcome of competitive selection in which various cost advantages and disadvantages are balanced to arrive at an equilibrium organization of the firm” [
2] (p. 384). A review of the main conceptual motives behind both a positive and a negative relationship between ownership concentration and firm performance is provided by Wang and Shailer [
21]. Thus, the positive relationship is based on (i) interest alignment between shareholders and managers—i.e., large shareholders may increase firm value through more efficient management monitoring, but also by influencing management decisions directly; (ii) substitution of legal protection, particularly when a country’s legal system is weak; and (iii) signaling of commitment to bailout or not to expropriate, also with more effect on countries with weak legal systems. On the other hand, ownership concentration has a number of detriments, leading to a negative relationship between concentrated ownership and performance, such as (i) increased conflicts of interest between controlling and minority shareholders; (ii) a negative impact on the firm’s ability to raise capital and manage risk—i.e., ownership concentration may induce a higher firm dependence on the controlling shareholders’ wealth or internal financing, as well as reduced portfolio diversification and risk-bearing efficiency; (iii) a negative influence on other corporate governance mechanisms—i.e., entrenching controlling shareholders or their representatives in management positions instead of employing better qualified outsiders may lead to reduced monitoring efficiency of board of directors.
In this framework, a number of circumstances seems to mitigate the relationship between the degree of ownership and performance, i.e., the level of concentration itself, the ownership identity and the performance measures, and they are interconnected. From the perspective of ownership concentration level, Demsetz and Lehn [
22] show that there is an insignificant relationship between ownership concentration and performance measured by accounting profitability; their results are supported by subsequent literature [
23,
24]. On the other hand, when market measures of performance are used in the empirical literature, such as price-to-earnings ratio (PER), Tobin Q or market-to-book value, the results appear to indicate a positive relationship between ownership concentration and performance [
12,
25]. From this perspective, the study of Thomsen and Pedersen [
26] challenges previous results by finding evidence on a bell-shaped relationship between ownership shares, on one hand, and return on assets and market-to-book values, on the other hand, but the authors do not identify any such effect when sales growth is considered as a performance indicator. Thus, they conclude that “ownership structure affects the priority attached to profit vs. growth objectives” [
26] (p. 702). On the other hand, the same study enforces the importance of the ownership identity, as a significant effect of ownership concentration on market-to-book value is found when the largest owner is an institutional investor.
Ownership identity is a critical factor that determines firm performance and the literature on the ownership nature and performance has been developed along the different types of significant shareholders: institutional investors, banks, families, foreign shareholders and insider ownership, with rather mixed results, which should not be surprising, given the argument by Thomsen and Pedersen [
26] that each type of ownership comes with different objectives and attributes that have particular implications for firm strategy and corporate performance.
The growing volume of corporate equity controlled by institutional investors and the resulting more active role played by institutional investors in companies’ management has generated increased interest in the relationship between ownership and corporate performance. The most important features of institutional investors that control the link between ownership and performance stem from their relative specialization as shareholders and their concrete measures of performance employed, connected to shareholder value and liquidity [
26]. Thus, although in many cases they are not the majority shareholder, their presence as shareholders may pressure the other shareholders to take action and determine managers to act in shareholders’ interest; moreover, they tend to have a preference for firms that already have good corporate governance practices [
27,
28,
29]. Generally, studies find positive links between the involvement of institutional investors and firm performance, fueled by institutional investors’ pressures on management to align their decision to shareholders’ interests [
30], higher board remuneration and incentives for executives [
31] and more efficient monitoring of managers [
32].
Transforming managers in shareholders (i.e., insider ownership) is a solution proposed by Fama and Jensen [
16] with the aim of aligning managers’ interest to the shareholders’ ones; subsequent studies confirm that this type of ownership reduces the differences between managers and shareholders’ goals and lowers agency costs [
33,
34]. The direct consequence is a positive relationship between insider ownership and corporate performance, as identified by Kaserer and Moldenhauer [
35] or Bohren and Odegaard [
36], but the optimal level of insider ownership that leads to this positive relationship depends on company size, industry and firm performance [
37]. On the other hand, there are studies that find a less convincing relationship between insider ownership and performance, such as Demsetz and Lehn [
22].
A well-researched type of ownership and its implications on corporate performance is family ownership, often in the context of family as owner and manager at the same time; one critical attribute of this ownership is the wealth level of the family and, subsequently, its long-term commitment to firm survival and success. The results are maybe less convincing than expected in terms of the family ownership impact and performance. On one hand, research supports the expropriation hypothesis at the expense of minority shareholders [
16,
38,
39], particularly when shareholder protection is low and control is high [
40]. On the other hand, various studies find no influence of family ownership on performance [
27,
41]. Also, Anderson and Reeb [
42] investigate the S&P500 firms and conclude that family firms perform better than nonfamily firms, thus contradicting the expropriation hypothesis and suggesting that family ownership is an effective organizational structure. Their results are confirmed by Chu [
43] for Taiwan, by Cai et al. [
44] for China, or by Isakov and Weisskopf [
45] for Switzerland, but also by Barontini and Caprio [
46] in a study on 675 publicly-traded corporations from 11 countries in Continental Europe.
Foreign ownership seems to be an attribute of more performing companies, compared to local ownership, building on the specific advantages of multinational companies explained by the renowned OLI (ownership-location-internalization) paradigm of Dunning [
47,
48]. In this framework, ownership advantages refer to tangible and intangible assets of the firm and materialize in the company’s ability to transfer them over the border as part of the multinational company’s operations [
49]. Moreover, these advantages may be the benefit of being part of a network of affiliates, but, in all cases, the industry in which the company operates, its size, parent country and multinationality level mitigate the relationship between foreign ownership and the performance gap between locally- versus foreign-owned companies [
50,
51]. Empirical research on the relationship between foreign ownership and firm competitiveness and performance (measured by labor productivity, wages, profitability etc.) has generally indicated improved results for foreign-owned companies. For example, Grasseni [
52] uses quantile regressions for the investigation of performance gaps between Italian domestic companies and foreign-owned firms between 1995 and 1997 and finds significant better performance for foreign-owned firms only in terms of higher wages and lower indebtedness, but not higher labor productivity, while no conclusive result is obtained for profitability. On the other hand, Bentivogli and Mirenda [
53] investigate the existence of a “foreign ownership premium” for domestic Italian companies acquired by foreign companies between 2007 and 2013 and the results are positive in terms of profitability and financial safety, but only for companies operating in the services sector. In a larger scope study on foreign-owned and domestic-owned companies in 34 transition and non-transition economies, Chacar et al. [
54] confirm the improved performance associated to foreign ownership, but show that a longer period of collaboration between a local affiliate and its foreign owner strengthens this superior performance.
Bank ownership plays an important role in some EU economies, such as Germany, but also in China, whereby banks provide privileged financial services to the companies they own (in the form of better access to capital, better financing costs, but also services that are less available to common customers) [
55]. The empirical research on the relationship between bank ownership and corporate performance is again mixed in terms of results, but Lin et al. [
55] suggest that this relationship is intermediated by the institutional background; as such, Lin et al. [
55] find that, for China, an emerging economy, companies where banks are the leading shareholders witness relatively poor operating performance. On the other hand, studies on developed economies suggest a more positive influence of bank ownership on corporate performance [
56]. Moreover, studies on developed countries demonstrate that banks can provide improved monitoring of corporate borrowers and enhance firm performance [
57,
58].
Government ownership is a special category, due to the likely pursuance of different objectives than maximization of shareholders’ value by the main owners; the literature indicates that governments tend to enforce low output prices or employment as corporate objectives, thus encouraging a non-profit maximizing behavior [
59]. On the other hand, government ownership might create privileges for firms in terms of access to credit or lower cost of capital, somehow in a similar manner to bank ownership [
26]. Empirical research has delivered so far inconclusive results on this topic, though. For example, Ang and King [
60] find that Singaporean government-linked companies have higher valuations and better corporate governance than a control group of non-government-linked-companies. In the same vein, Sun and Tong [
61] find that government ownership has a positive impact on partially privatized state-owned enterprises in China, but the relationship is nonlinear and shows an inverted U-shape. At the other end, Bradbury [
62] finds that government computer services in New Zealand have recorded improved financial performance after moving from a government department to an autonomous agency, “which is consistent with the hypotheses concerning the deregulation of the product and labor markets and changes to the governance structure” (p. 157). In the same direction, Correia and Marques [
63] study water utilities companies in Portugal, all owned entirely or partially by the government, and find that the average level of efficiency in these companies is higher when directed by private management.
While the majority of academic studies has examined the causality linkages between ownership and performance particularly for developed countries, the literature that has tackled this issue in the case of developing or emerging economies is more recent, but its results seem to contradict at least some of the findings for mature economies. The literature builds on the reality that developing economies, but also developed economies outside the Anglo-American part of the world, tend to have more concentrated ownership [
32,
64], but also that corporate governance structures are typically dominated by family ownership and high insider ownership [
65,
66]. As such, shareholders’ higher incentives towards management monitoring might be able to ease the conflict postulated by the agency theory, but the substantial control of large shareholders over the business might be a source of newer conflicts, given the propensity of these shareholders in the direction of using firm resources in an unjustifiable manner from the perspective of firm objectives (in the form of excessive compensation, special dividends, related-party transactions), coupled with negative effects at the level of minority shareholders [
42].
The research focusing on developing economies considers that ownership structure plays a key role in corporate governance in these countries, even more important than the one in developed economies. As Zeitun and Tian [
67] state, factors of various nature (economic, social, political and cultural) influence the corporate ownership structures around the world, but they may be rather different in developing economies, which limits the use of empirical models already calibrated for developed economies [
68]. At the same time, Claessens and Yurtoglu [
69] show that better corporate frameworks benefit firms from emerging economies through increased performance and more favorable treatment of all stakeholders. In a meta-study on ownership concentration and corporate performance in emerging countries, based on 42 primary studies, [
21] identify “substantial and robust negative underlying relations across countries” (p. 222), but also significant heterogeneity in the relationship between ownership concentration and performance from one country to another. This heterogeneity is explained, in the authors’ views, by different levels of macroeconomic environment and shareholder protection. An interesting issue is raised by Aluchna and Kaminsky [
70] in relation to research on emerging markets: Are the changes in ownership as a result of privatizations, economic and social reforms and the emergence of newly founded companies able to generate better corporate performance and firm value? Their study focused on Poland, an EU member now, but with a communist past and an economy with a significant degree of ownership concentration—they find a statistically significant negative relationship between ownership concentration and return on assets (ROA). At the same time, they do not find any significant evidence between financial investors and state ownership, on one hand, and corporate performance, on the other hand, but there is a positive link between ownership by industry investor and ROA. They thus confirm the previous study of Bedo and Acs [
71].
Another research direction that received less interest in the academic literature refers to the influence of crises on the relationship between ownership and performance and, related to it, the ability of firms with different ownership structures to recover after economic downturns. Only a few papers tackled this topic, but their results indicate that ownership concentration helped companies to record better performance during the crises. Alfaro and Chen [
72] compare the role of foreign ownership during the global financial crisis with the non-crisis years for 12 million establishments in 53 countries, and using the annual percentage change in sales as performance measure they conclude that foreign ownership mattered during the turbulent times, as multinational subsidiaries recorded better performance than local peers; on the other hand, during the non-crisis years, the effect of foreign ownership on performance is insignificant. Listed Australian firms are examined by Saleh et al. [
73] and the results show that companies with a higher ownership concentration recorded better performance measured by ROA and ROE for both family and non-family firms before and during the recent global financial crisis. The impact of ownership on Indonesian firms’ performance in the 1997 and 2008 financial crises is studied by Hanafi et al. [
74]; the authors find that ownership concentration is beneficial for performance, with a plus for large firms, in whose case the connection between ownership concentration and firm value is stronger. Unfortunately, the impact of ownership concentration on firms’ recovery after crises has not been studied so far, and our research fills this gap for EU companies.
Overall, regardless of the countries they tackle, the studies on corporate ownership and firm performance differ in many attributes, such as performance measures used (accounting measures versus market measures of performance), samples of companies used (listed versus non-listed companies, government versus privately-owned companies, small or big companies etc.), and research methodologies employed (multiple regressions, panel regressions, quantile regressions, surveys, stochastic frontier analysis benchmarking etc.), so it is not surprising to see their conflicting results. Demsetz and Villalonga [
75] discuss the heterogeneity of these results and conclude that “the market responds to forces that create suitable ownership structures for firms, and this removes any predictable relation between empirically observed ownership structures and firm rates of return” (p. 230). Given this predicament, our paper departs from the methodologies employed in the previous studies and proposes a straightforward but thorough manner of investigating the relationship between ownership concentration and corporate performance, by considering a classification of ownership concentration provided by Bureau van Dijk (BvD).
4. Results and Discussion
Our research is the first to explore the relationship between ownership concentration and corporate performance in the European Union after the global financial crisis of 2007–2009, but also during the sovereign debt crisis of 2010–2011. Moreover, it sheds light on the influence of ownership concentration on performance for the two main categories of countries within the EU, i.e., older EU members that are developed and mature economies and newer EU emerging and developing countries. Before 1990, the Eastern part of the EU, characterized by centrally-planned economies and businesses owned by the state, was out of reach for Western investors, but the transition to capitalism of these countries showed the perspective of long-term growth. At the same time, as Healey [
79] shows, this transition has been accompanied and mitigated by various political, economic, social and technological factors, including high rates of inflation and debt, low productivity and political instability, particularly during the ‘90s. As the presence of Western companies in the Eastern part of the Europe became stronger through foreign direct investments, in a framework of liberalization of economic systems, the performance gap between the West and the East diminished, but is still present and uneven across countries. The accession to EU of Eastern countries became thus a paramount step that capitalized on these prospects for economic growth and development—the enlargement process of the EU towards the East started in 2004 with nine Eastern countries (Czech Republic, Estonia, Hungary, Latvia, Lithuania, Malta, Poland, Slovakia and Slovenia) and continued in 2007 (Bulgaria and Romania) and 2013 (Croatia). As a result of their membership to EU, these economies and their businesses benefited from the free movement of goods, services, labor and capital, as a fundamental pillar of the organization, but they have not managed to get the most out of it in a similar manner.
The period after the global financial crisis of 2007–2009 was a difficult one for all EU businesses regardless of the industry, as reflected by their unstable performance over the years, until 2016, shown by all indicators included in our research. This means that EU firms’ recovery after the crisis was a strained process, also by taking into account the difficult and tense years 2010 and 2011, marked by the sovereign debt crisis at EU level. At the same time, there are marked differences between performance patterns between 2008 and 2016 for firms from the two parts of the EU tackled in our analysis, Western and Eastern ones, as Eastern-based companies seem to have been more affected by the financial turmoil that Western ones. Moreover, these differences are even more accentuated when we take into account firms’ ownership concentration, at least for some of the performance indicators used in our research.
We do not address the issue of industry effect on performance and focus only on industries from the manufacturing sector. The results discussed below reveal, in our opinion, interesting the thought-provoking patterns of firm performance within EU, on one hand, as well as dissimilarities in the relationship between ownership concentration and performance, on the other hand, in the two categories of countries. In this section, we present the results of our research on the performance differences between EU companies with various degrees of ownership concentration at two levels: the Western EU countries level and the Eastern EU countries level. As mentioned above, there are reasons to believe that ownership concentration has different effects on companies from the two parts of EU and, as we present our results, these differences will be outlined and discussed.
4.1. Analysis of performance based on Return on assets (ROA)
Return on assets is a well-known and used comprehensive accounting-based financial indicator that reflects managerial performance (see, in this respect, [
80] and [
81]) and that, in our view, is able to capture differences in performance between companies with dissimilar ownership structures.
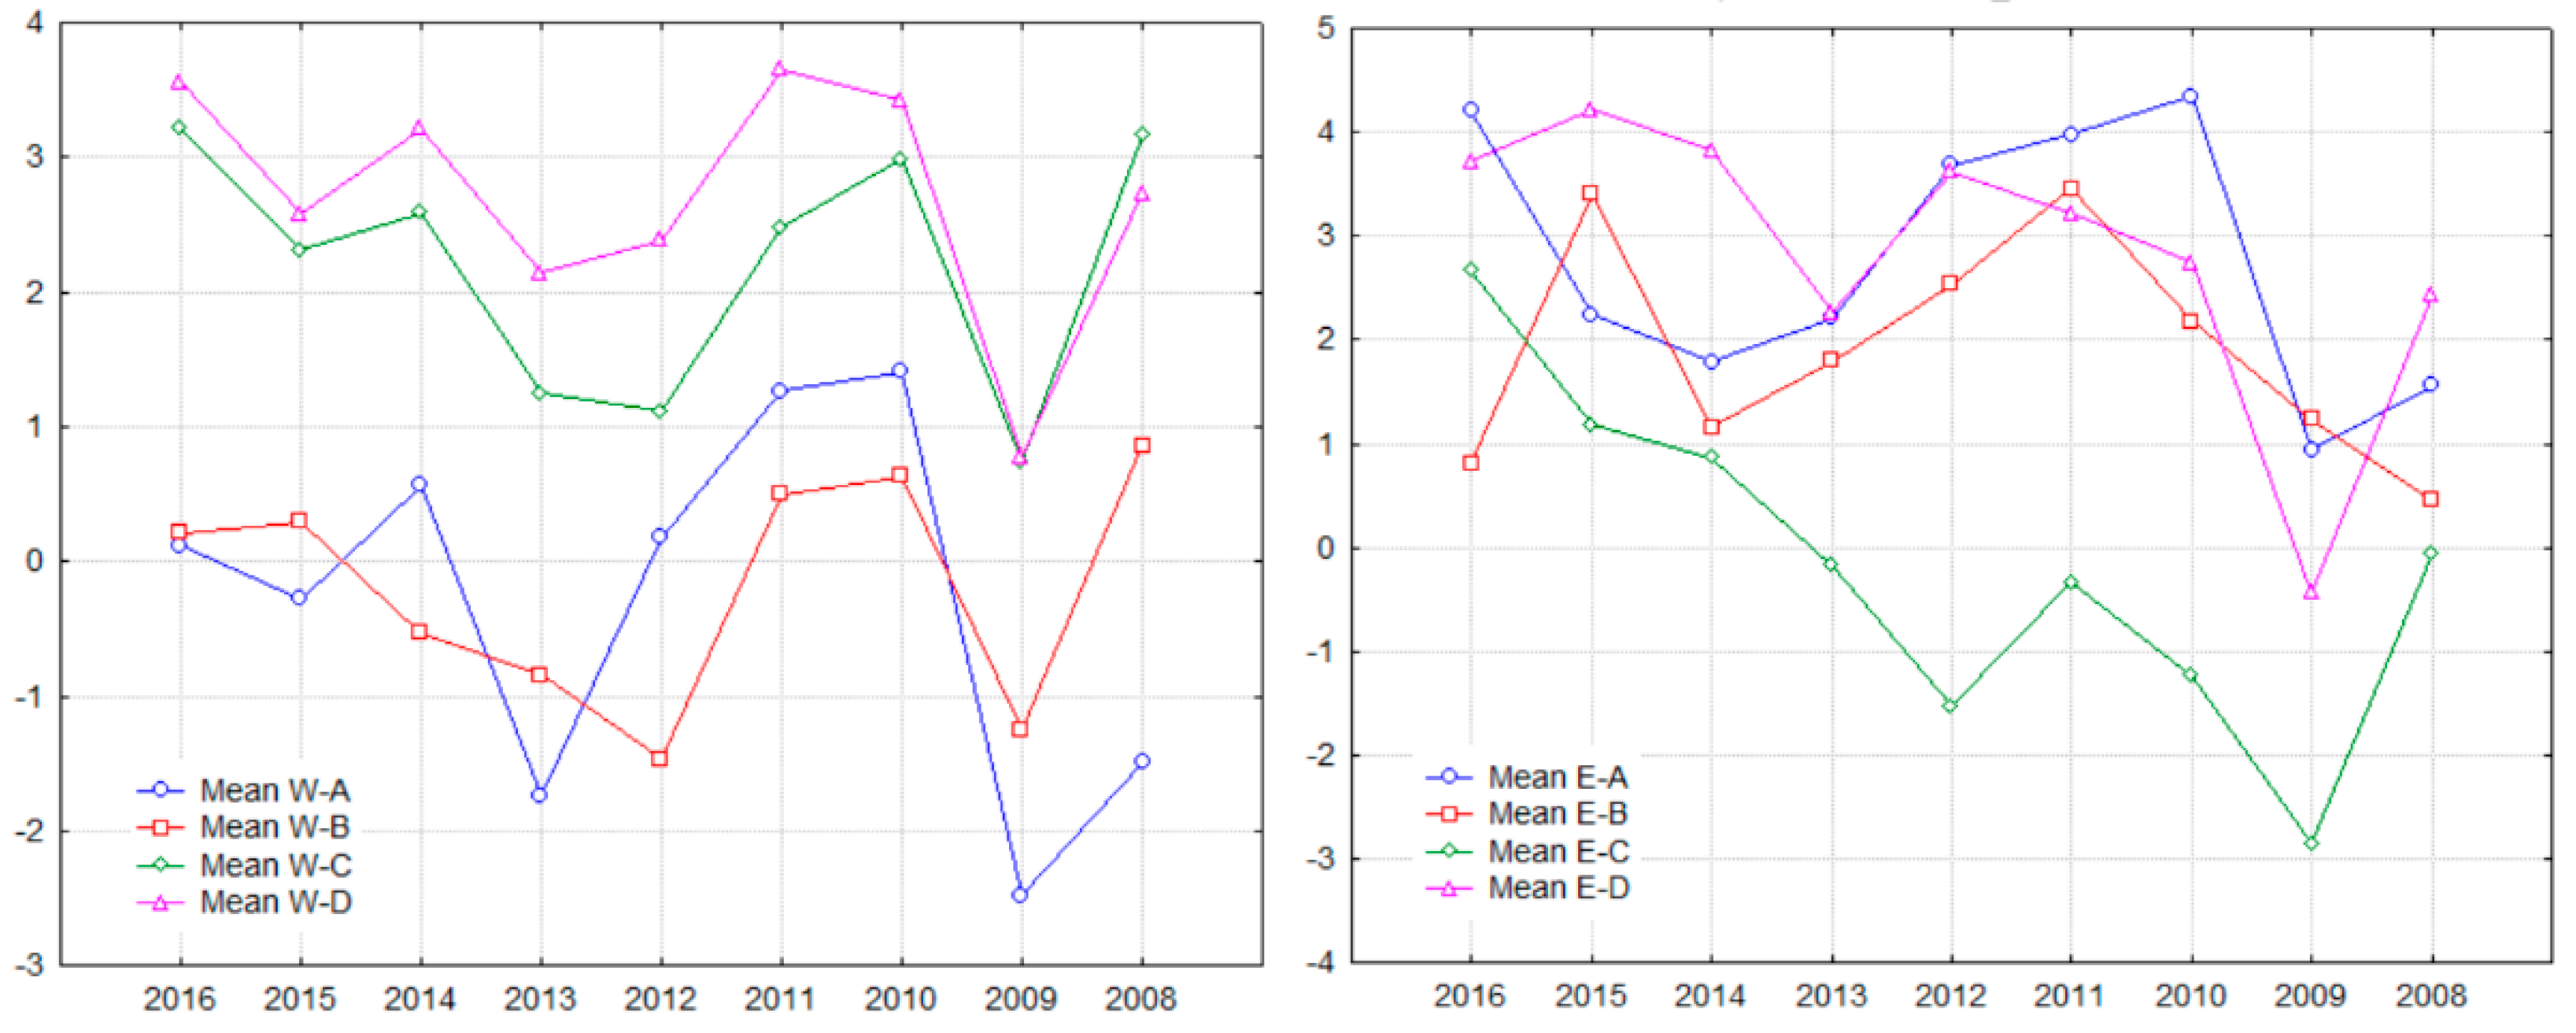
Table 5 shows the means for ROA between 2008 and 2016 for Western- and Eastern-based EU companies, respectively. We notice the rather small values of ROA over the years, but also its high variability, regardless of the company category depending on ownership concentration and of company origin (Western or Eastern); for Western companies, we see ROA varying between −2.48% and 3.65% and for Eastern companies between −2.85% and 4.34%. Interestingly, ROA means are higher for Western-based companies compared to Eastern-based ones mostly for C-companies and D-companies (in 2008 to 2011), but, overall, Eastern-based companies seem to have enjoyed, on average, better performance measured by ROA, particularly in the case of A and B companies, with a lower degree of ownership concentration.
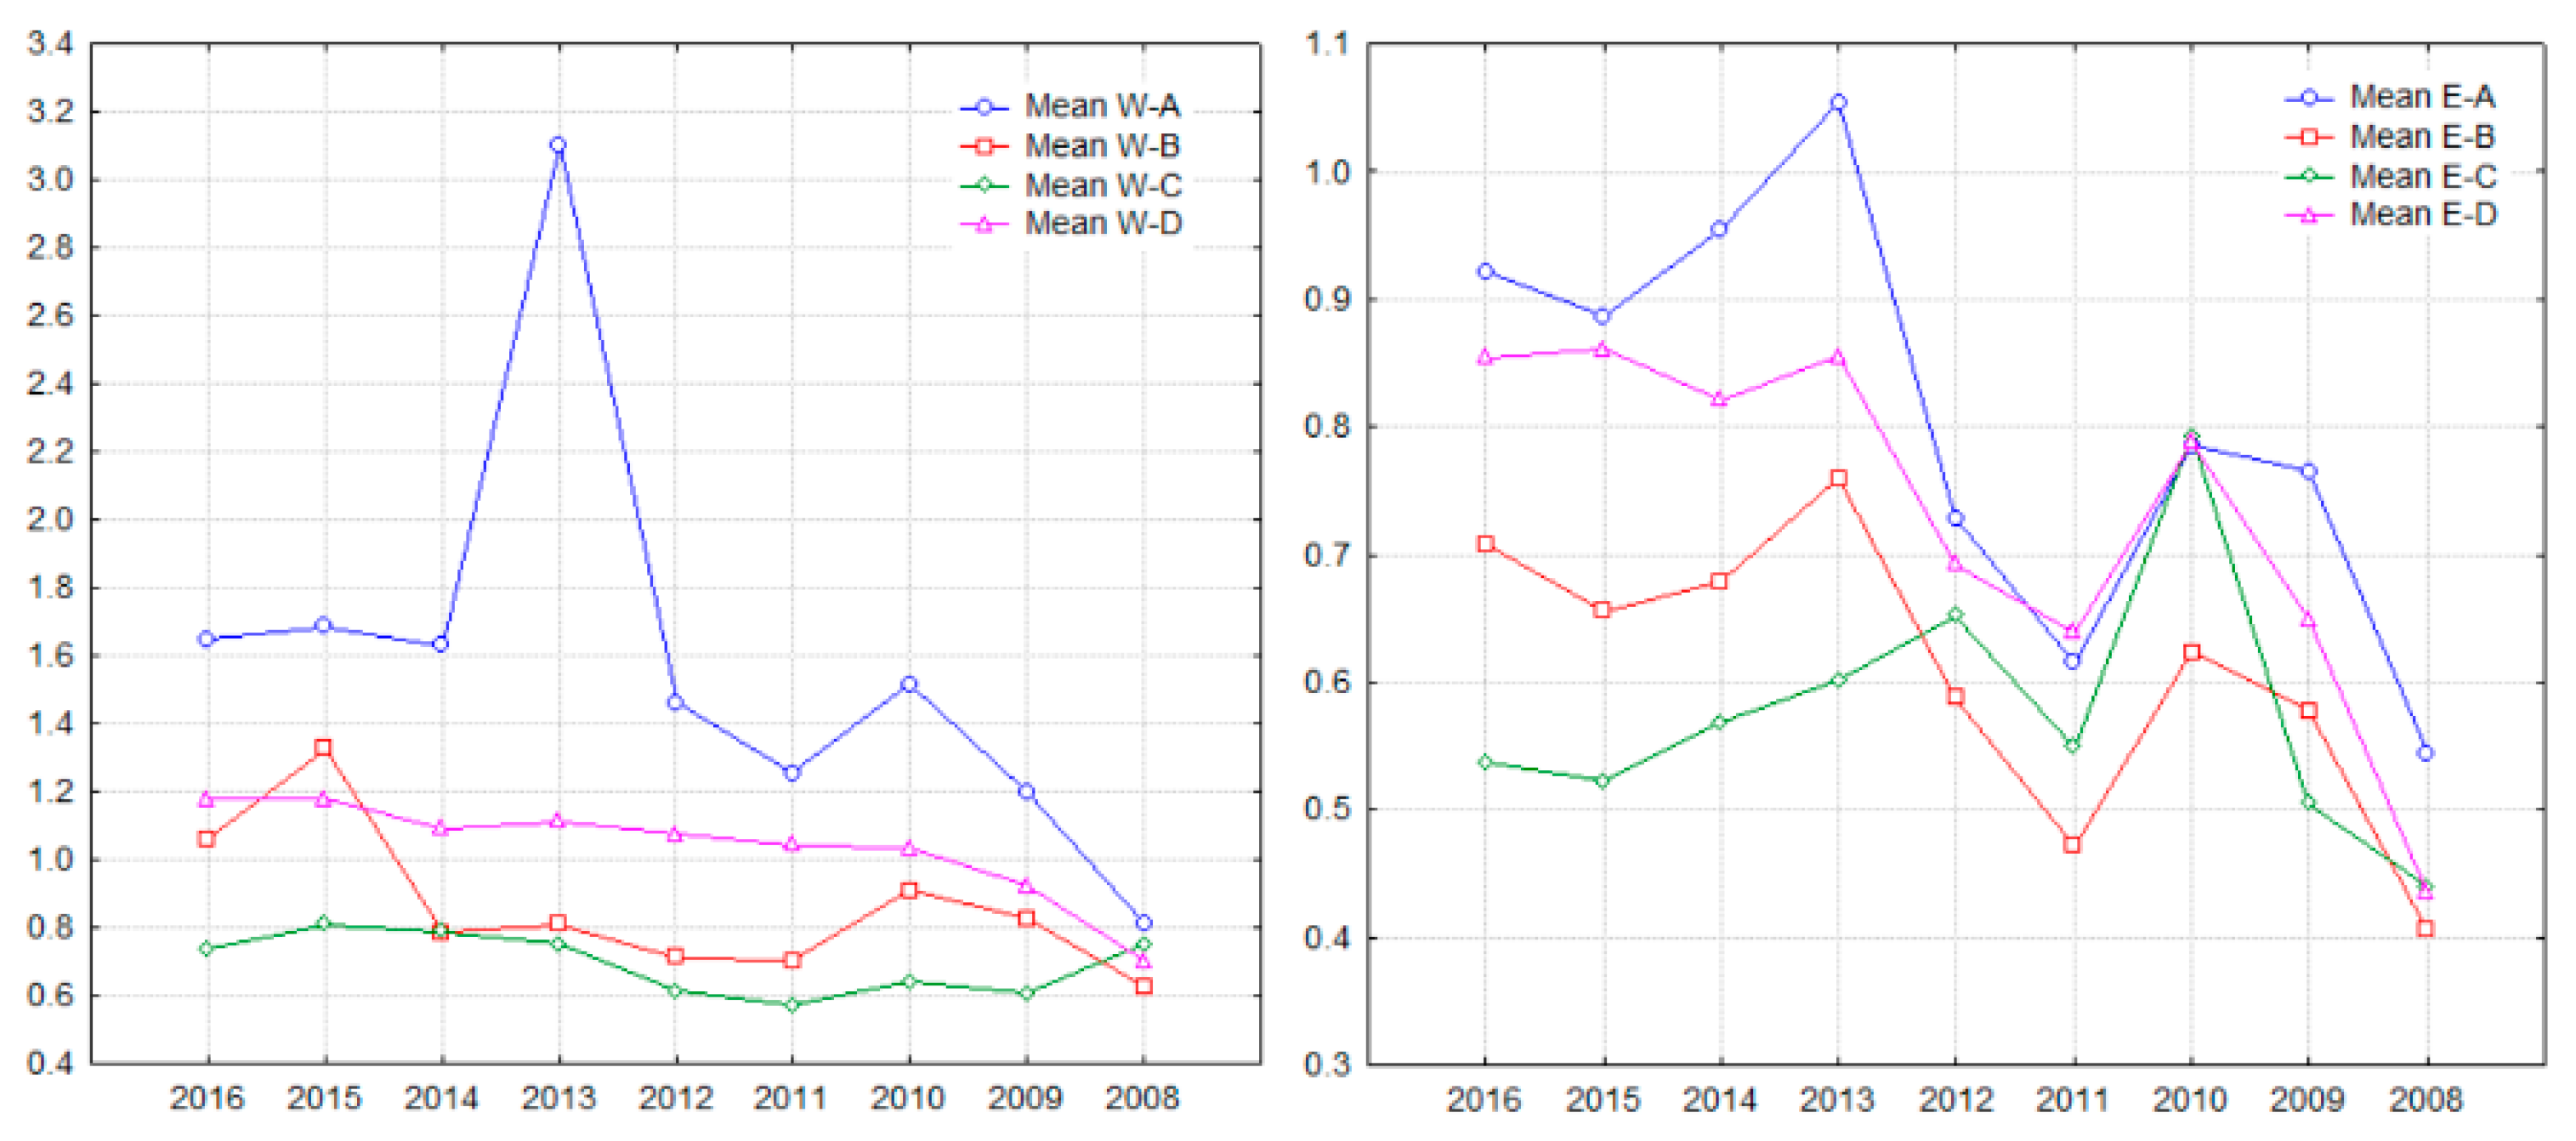
The plot of ROA means in
Figure 1 allows us to better observe ROA patterns for companies in our samples. The dissimilarity in performance between the four categories of companies depending on their ownership structure is clearer for Western-based companies, but not necessarily for Eastern-based companies, at least for what concerns A, B and D companies. In the case of Western-based companies, C and D companies had better ROA, on average, compared to A and B companies in all years (with A and B companies changing their relative positions between 2008 and 2016), but mean values of ROA calculated for Eastern companies show a disordered picture, with no A, B or D category of companies clearly dominating others in terms of performance. Still, C companies are the underperformers in terms of ROA, but their mean ROA is constantly improving after 2012.
At the same time, the drop in mean ROA between 2008 and 2009 for all companies (except B-companies in the Eastern sample), as well as between 2011 and 2013 for Western-based companies, regardless of their degree of ownership concentration is easily observable; we interpret this as the result of the two crises that swept EU after 2008 (the global financial crisis of 2007–2009 and the subsequent sovereign debt crisis of 2010–2011). After 2013, no distinctive pattern in ROA evolution is detectable. Business recovery after the crisis may be captured as a linear trend of mean ROA between 2008 and 2016; when investigating the trends for companies with different degrees of ownership concentration, there seems to be no distinctive pattern of differentiation between ownership concentration and recovery path for both Western companies (trends for A, B and D companies are positive and the trend for B companies is negative), and Eastern companies (all trends are positive). Further exploring mean ROA trends,
Table 6 shows the distribution of positive and negative trend values for mean ROA between 2008 and 2016 in our samples. As expected, the distributions indicate that more Western companies enjoyed positive ROA trends after 2008, regardless of their degree ownership concentration, but this result is observable also for Eastern companies, with the exception of A companies.
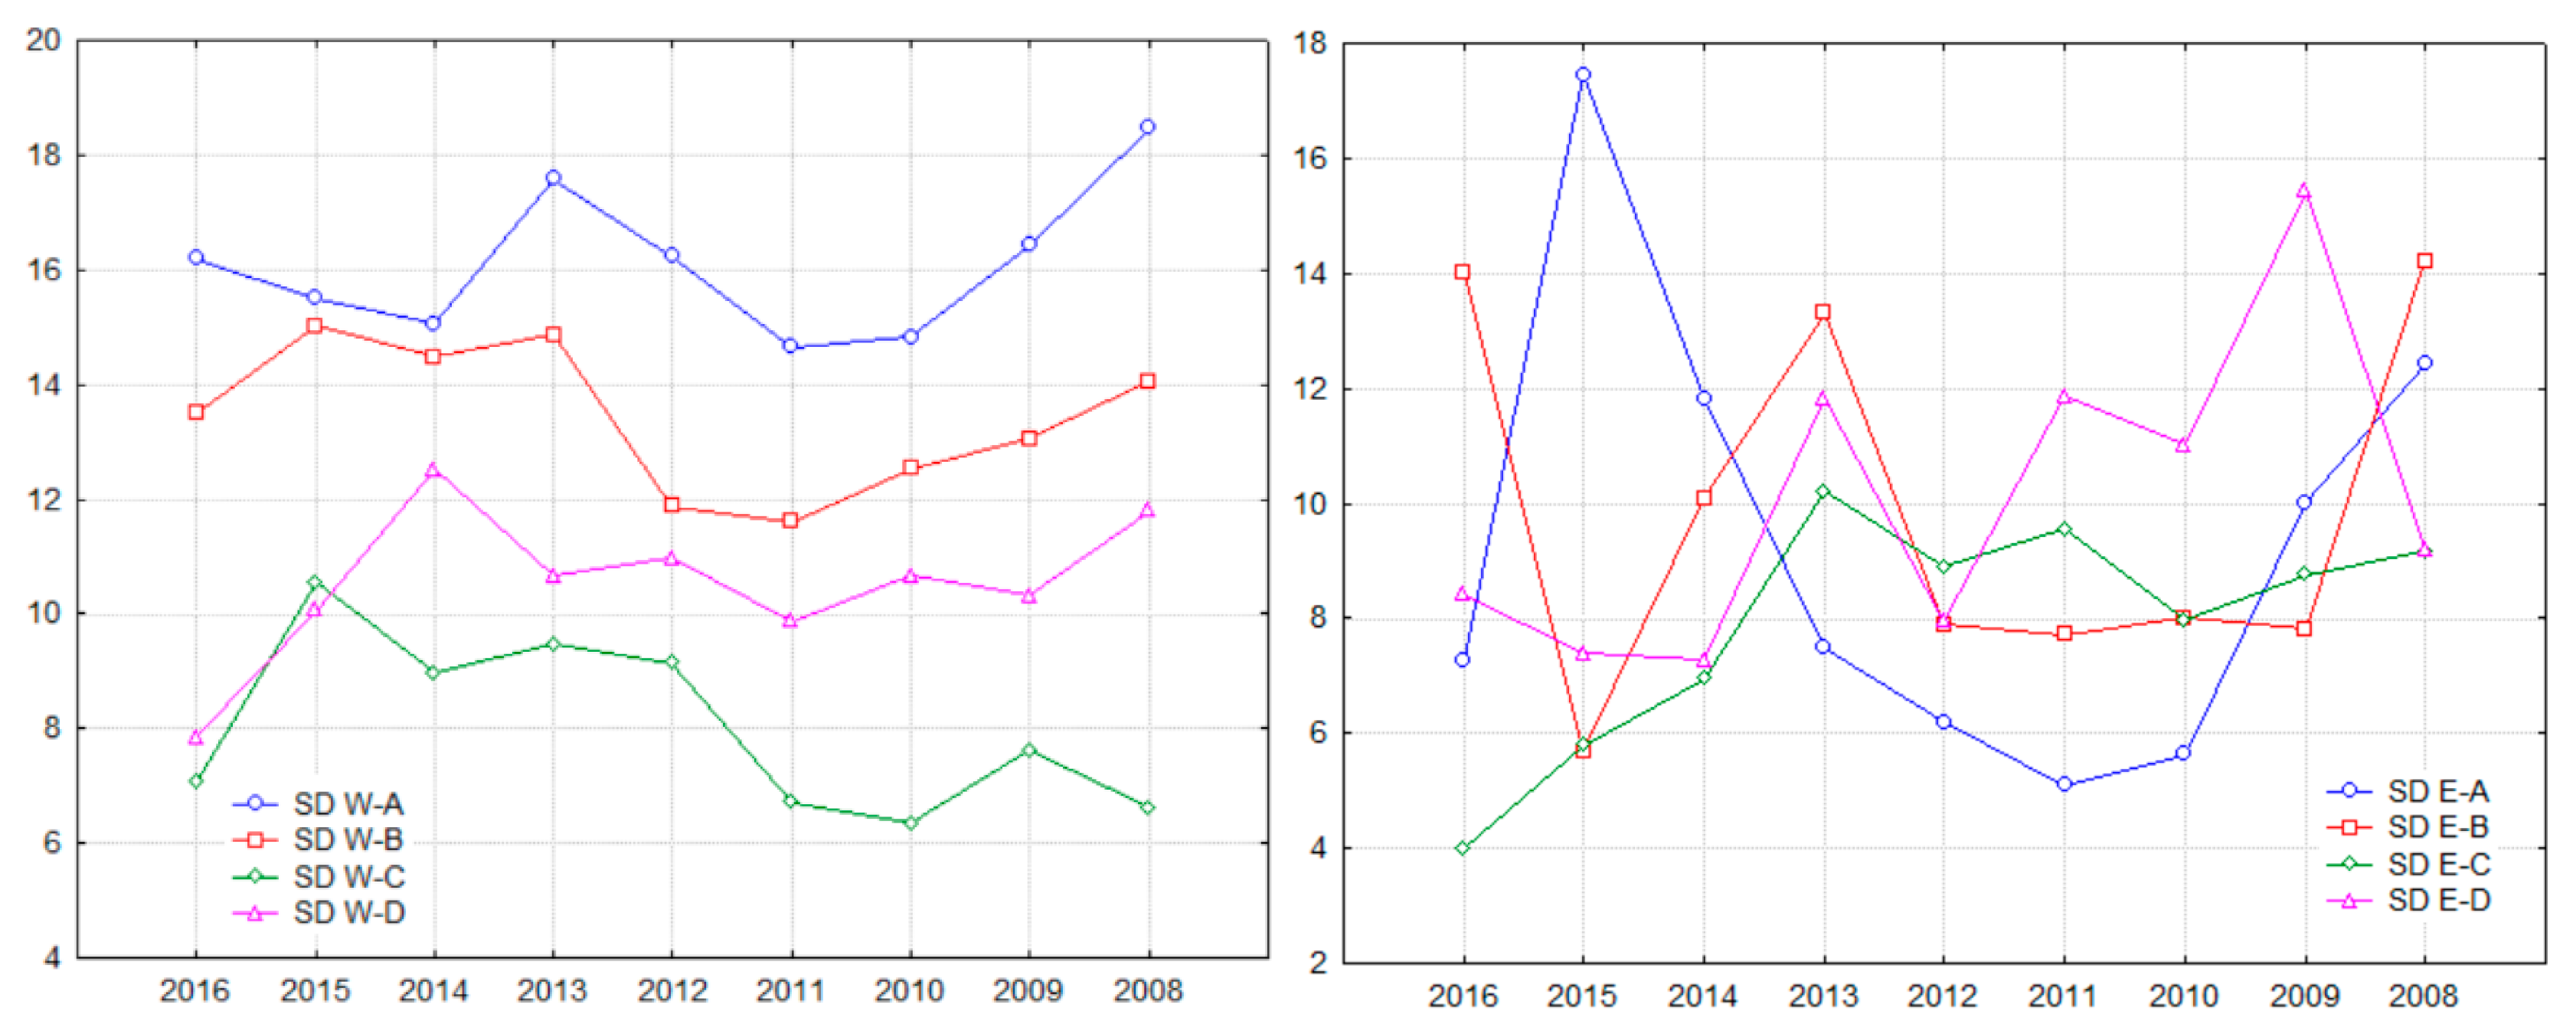
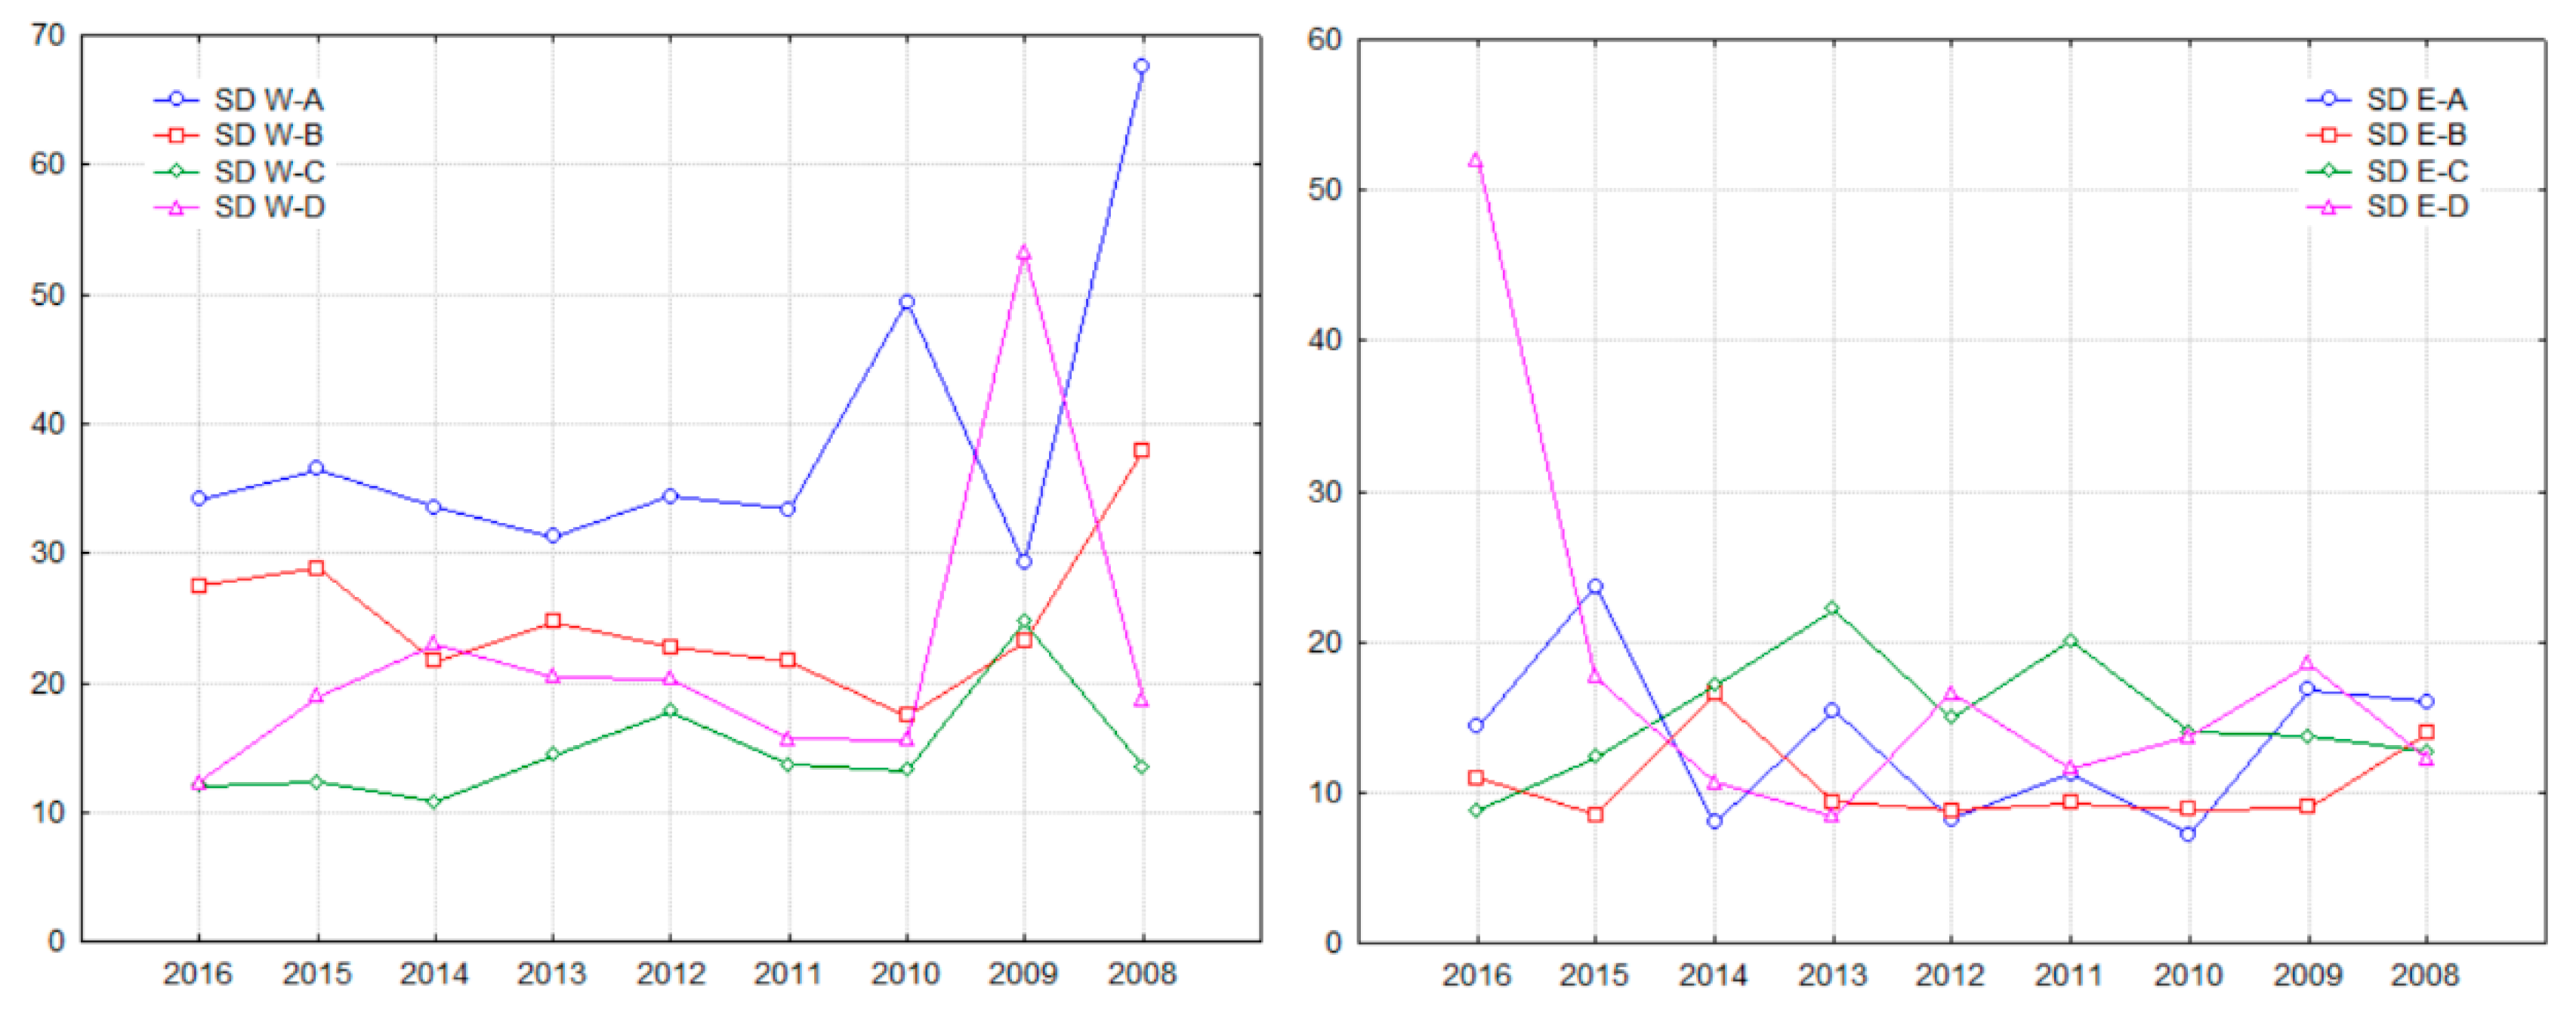
Another interesting result that accompanies our findings on mean ROA is that, at the overall EU level, mean ROAs display high volatility across companies (measured by standard deviation) for each year included in our analysis (see
Table A2 in
Appendix), but there is a clear ranking from this perspective.
Figure 2 shows that for each of the nine years between 2008 and 2016; A-companies had the highest volatility of ROA, followed by B-, D- and C-companies; this indicates that companies with a lower ownership concentration had, on average, more volatile ROA than companies with more concentrated ownership. The same result is also observed for Western-based companies, but not for Eastern-based companies. In the latter case, no company category based on ownership concentration dominates the others, but we notice the high variations in standard deviations of ROA for all company categories between 2008 and 2016, maybe with the interesting exception of B-companies between 2010 and 2013.
Another result worth mentioning is the similar range of volatility for Western- and Eastern-based companies between 2008 and 2016, although there are notable differences between companies with various degrees of ownership concentration. As such, the range of volatilities across the years was approximately three times higher for Eastern companies with lower levels of ownership concentration compared to similar Western companies—12.362 against 3.823 for A companies and 8.531 against 3.422 for B companies—and almost two times higher for C and D companies—6.199 compared to 4.197, and 8.162 compared to 4.665, respectively. This suggests a more difficult recovery of Eastern companies with more dispersed ownership compared to their Western peers, based on a higher ROA instability between 2008 and 2016.
The distribution of ROA skewness between positive and negative values across the nine years included in our analysis is presented in
Table 7, while
Table A3 in the
Appendix shows skewness values for all samples and years. Of the 36 skewness values for each sample (nine years multiplied by 4 company categories), the overwhelming majority are negative (33 for Western-based companies and 30 for Eastern-based companies). This suggests, on one hand, that more companies had ROA higher than the mean for a majority of years for each company category, but also that companies with very small ROA values compared to the mean are present in almost all samples. When comparing the Western and Eastern samples, negative skewness is more present, particularly for companies with less concentrated ownership; on the other hand, Eastern companies with more concentrated ownership had seven years out of nine with negative skewness, compared to their Western counterparts, which might suggest a slimmer underperformance of the first.
Although dissimilarities between companies with different degrees of ownership concentration and origin are easily observable at the ROA level, we were interested in the statistical confirmation of these dissimilarities. Applying the t-test for differences in means between samples of companies with different degrees of ownership concentration—see results in
Table A4 in
Appendix—we find that companies with a low degree of ownership concentration (A-companies) had statistically different ROA means than companies with a high degree of ownership concentration (D-companies) in the sample of Western-based companies, for all years. Moreover, we also find statistically different ROA means between B and D companies for all years for Western-based companies (except for 2008). Significantly, the same results are not found in the case of Eastern-based companies, as no mean differences between the four categories of companies are statistically significant (except for 2010, when the difference between A and C companies is statistically significant). These results indicate that the higher mean ROA values of companies with more concentrated ownership (D and C) compared to those of companies with less concentrated ownership (A and B) are not the result of chance in the case of Western companies. On the other hand, ANOVA confirms that there are no significant differences in the performance of Eastern companies measured by ROA depending on their degree of ownership concentration.
As a complement to the t-test for differences in means, we implemented the Kolmogorov-Smirnoff (KS) two samples test (results of KS two samples tests for all financial indicators are available from authors.) to investigate whether companies with different degrees of ownership concentration have the same distribution of ROA at a 95% confidence level. For the Western sample, results indicate that ROA distributions are statistically significantly different for A against B companies (for 7 out of 9 years), for A against D companies (for all years) and for B against D companies (for 6 out of 9 years). On the other hand, ROA distributions for Eastern companies are not found statistically different depending on their ownership concentration level, which enforces the previous findings.
4.2. Analysis of Performance Based on Return on Equity (ROE)
The analysis of performance delineated by ROA is complemented by another frequently used financial indicator, return on equity (ROE), which reveals performance as through the shareholders’ eyes. In
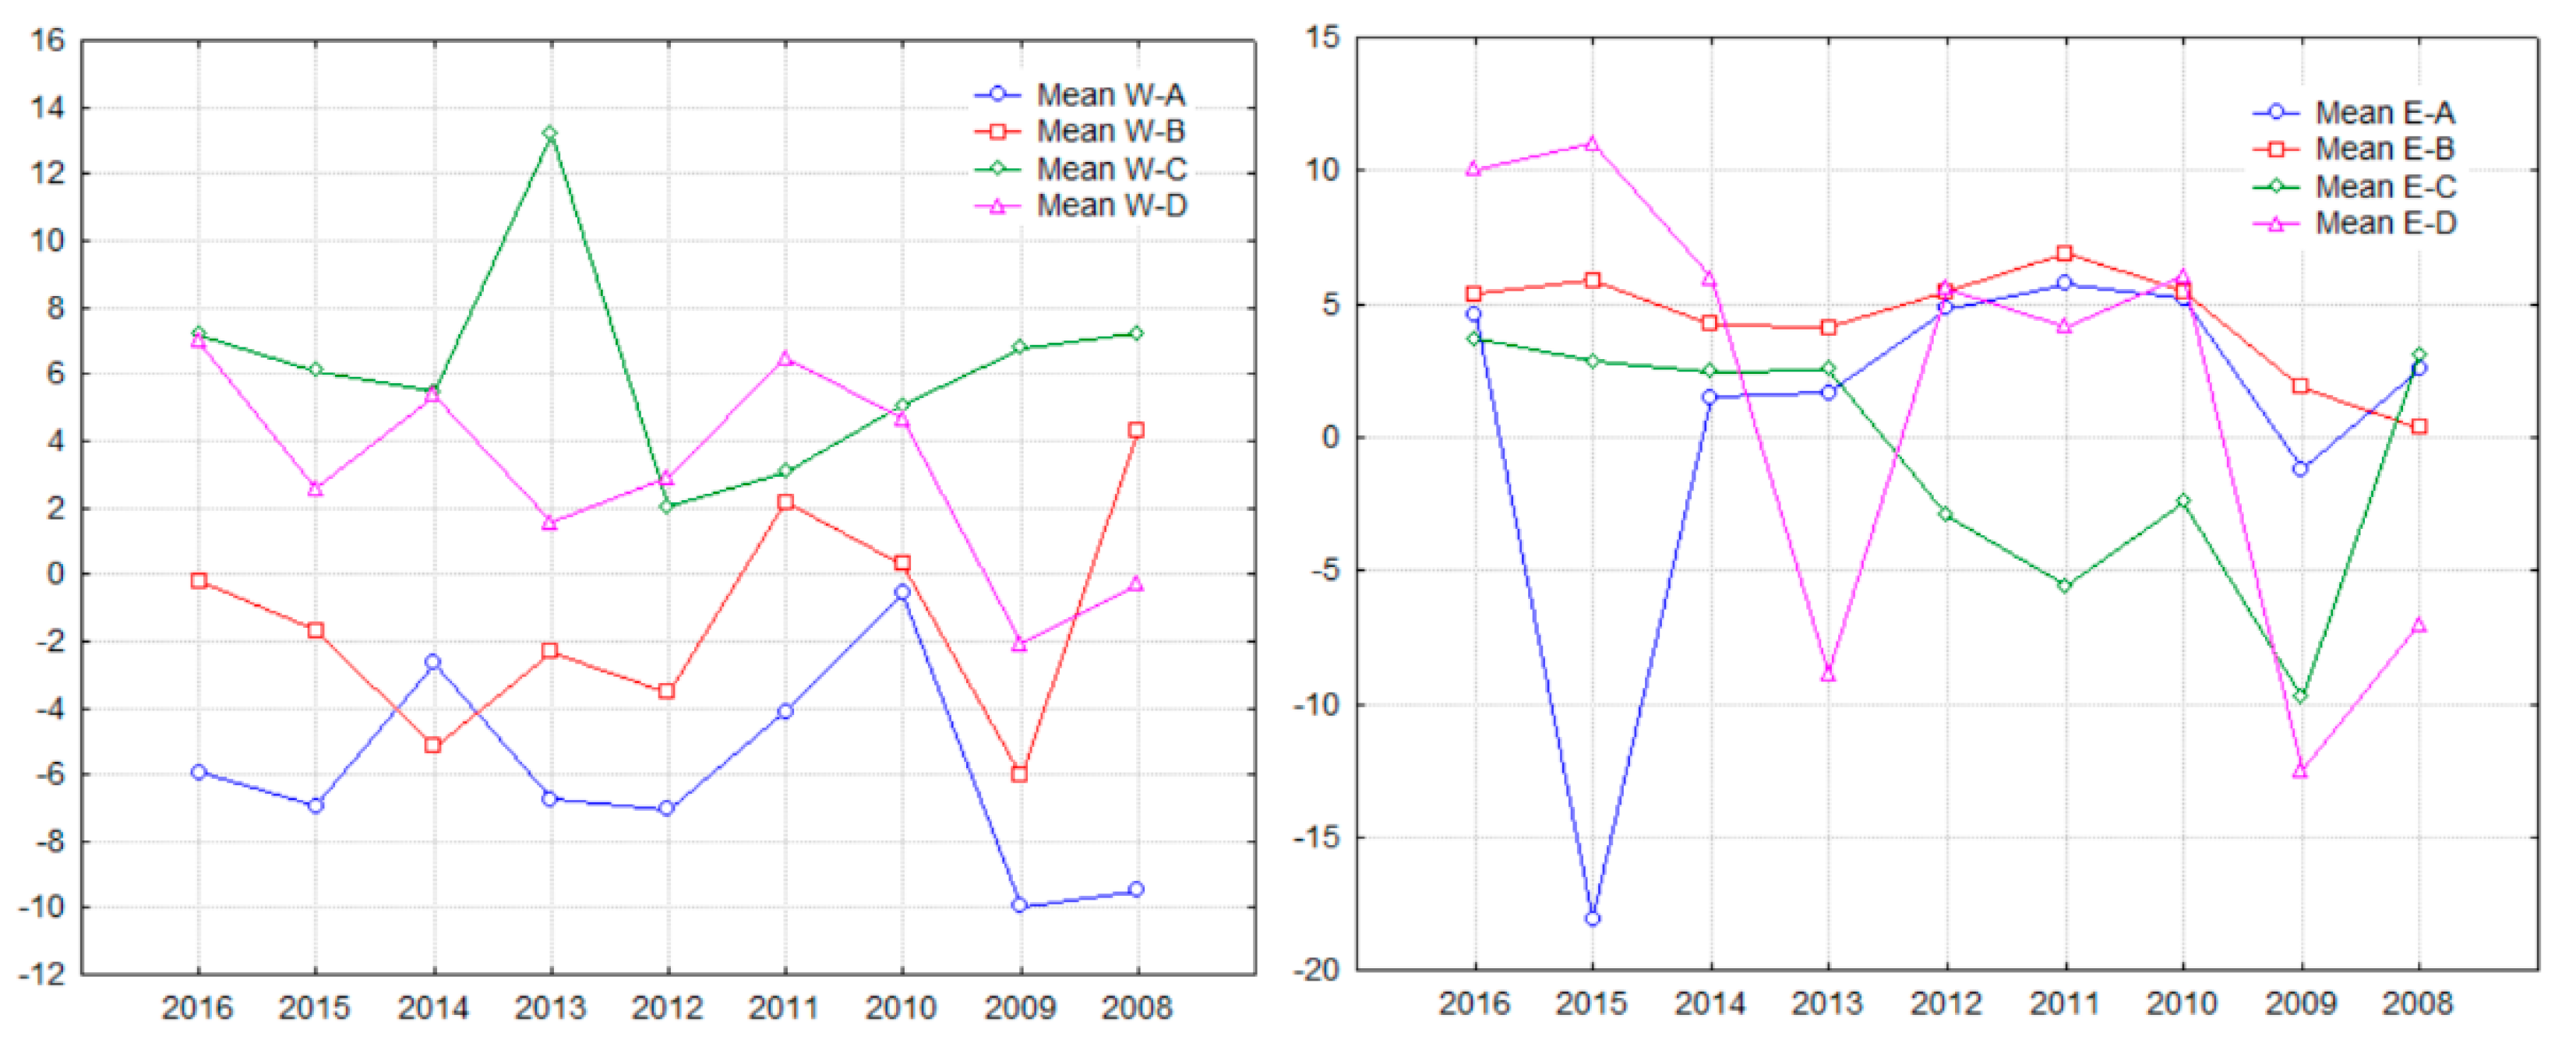
Table 8 we report the mean ROE for companies in our samples between 2008 and 2016. As in the case of ROA, we observe rather small values of ROE means over the years, although slightly higher than ROA—this is explained by the presence of debt in companies’ capital structure that generates higher ROE than ROA for a company. Mean ROEs are highly variable during the timeframe of our investigation; for the sample of Western-based companies, we see mean ROE between −9.47% and 13.18% and for the sample of Eastern-based companies we find mean ROE between −18.07% and 11.00%. As a general observation, Eastern-based companies enjoyed a lower number of negative ROE across the years (9 out of 36), while Western-based companies had 17 out of 36 negative mean ROE across the years. Another interesting result is that C-companies in the Western-based companies’ sample and B-companies in the Eastern sample had only positive mean ROE between 2008 and 2016, while D-companies in the Western-based companies sample had only one year with negative mean ROE (2009). On the other hand, A and B companies in the Western-based companies’ samples had mostly negative ROE across the years, but this result is not confirmed for A and B companies in the Eastern-based companies sample. Last, but not least, Eastern-based companies recorded better mean ROE than their Western peers for almost all years (for A- and B-companies), but C-companies from the Western part of EU enjoyed better mean ROE than companies from Eastern EU across the years.
The plots of ROE means—see
Figure 3—show, on one hand, the superior performance of C- and D-companies over B and mostly A-companies in the case of Western-based companies, particularly after 2009. This result indicates that ownership concentration was positively related to performance when all EU and Western companies are considered. All at once, the graph of ROE means for Eastern-based companies suggests smaller differences in mean ROE between the four categories of companies depending on their ownership concentration, with the notable exceptions of 2009 and 201. As in the case of ROA, the influence of ownership concentration on corporate performance is untraceable for Eastern companies, but we notice the high variability of mean ROE between 2014 and 2016 for both A and D companies.
Statistics on trends in mean ROE between 2008 and 2016 for companies in our samples are reported in
Table 9. Positive trends for mean ROE are found for both more concentrated companies and less concentrated companies in Western and Eastern samples; therefore, there is no clear conclusion to be drawn based on this result. At the same time, trend values are higher for C and D companies in the Eastern sample than in the Western one, which might indicate that these companies recovered faster in the Eastern EU than in the Western EU; on the other hand, A companies had a higher negative trend in Eastern EU, which means that their ROA, overall, became even worse than in the crisis years. This might be explained by the large volume of debt (including short-term debt) accumulated by Eastern-based EU companies in the turbulent years of the crisis and then recession. As in the case of ROA, trends are split in half between positive and negative in the Western sample, which indicates the lack of a sustained positive or negative performance of a specific company category. At the same time, as a confirmation of the previous statement referring to the recovery of Eastern companies, we notice that almost two-thirds of Eastern companies in the B, C and D categories had positive ROE trends.
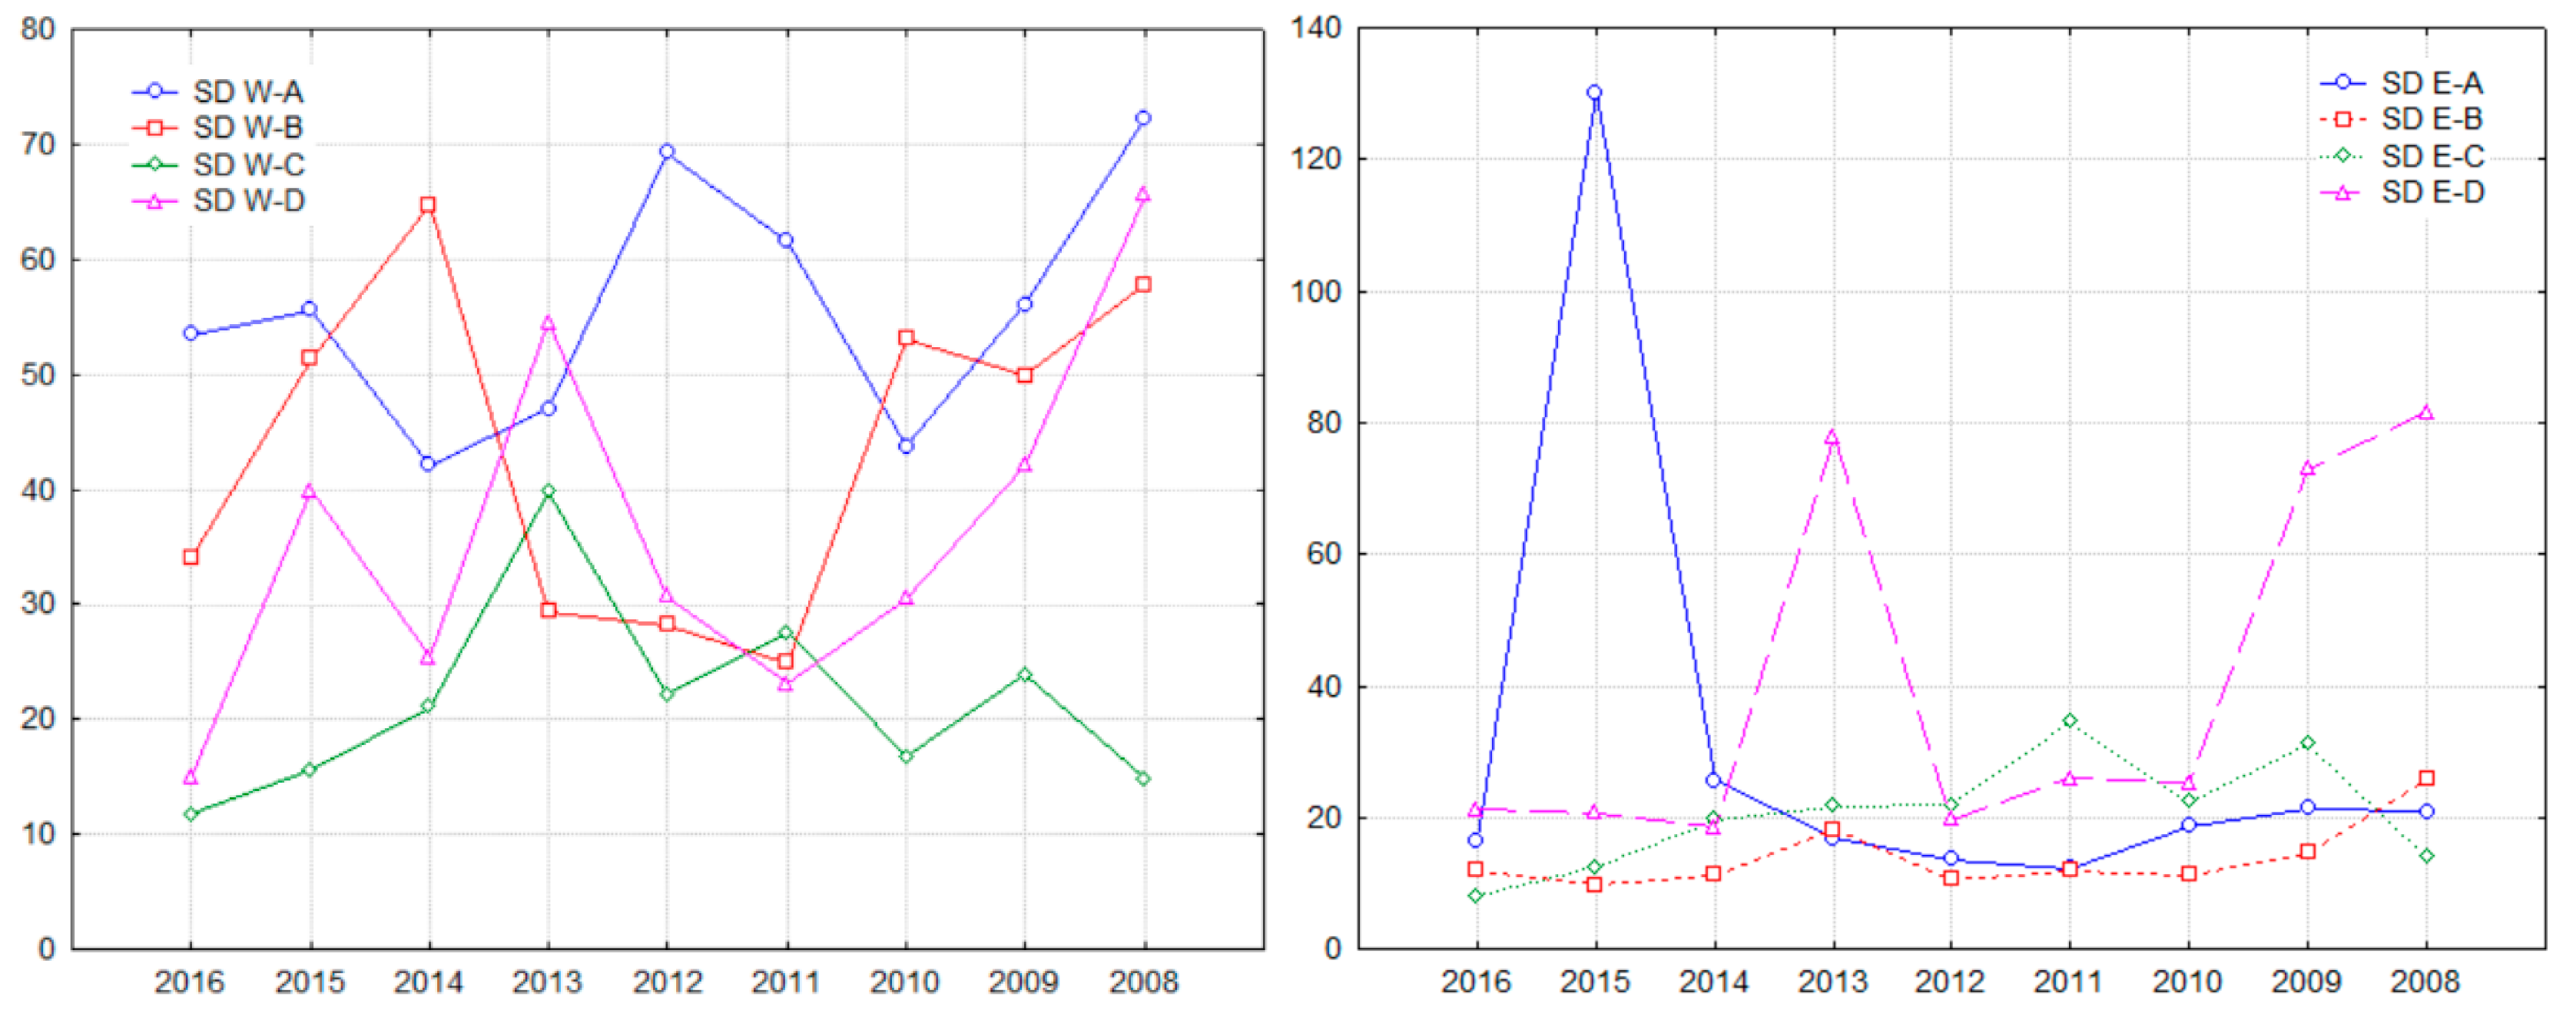
Mean ROE volatility patterns across the years and categories of companies—see
Figure 4 and
Table A5 in
Appendix—reveals thought-provoking results. First, mean ROE for A-companies generally displays the highest volatility in the sample of Western-based companies, but all categories of companies compete for high volatility across the years, maybe with the exception of C-companies. Second, ROE volatility is rather homogeneous for Eastern-based companies until 2014, but in 2015 ROE standard deviation increases significantly for A companies; interestingly, in 2016 ROE volatility drops to almost the same level for all companies. We thus partially confirm the results found in the case of ROA; for the Western sample, there is a rather negative correlation between ownership concentration and ROE volatility, but our results do not endorse the same finding for Eastern companies.
Table 10 shows the distribution of skewness for samples based on ROE. Also,
Table A6 in
Appendix presents the ROE distributions’ skewness values for all our samples and years. Companies’ distributions around mean ROE are largely negative—similar to ROA distributions, suggesting that ROA distributions largely impact ROE distributions—across years and company category, with no significant pattern in our view. This indicates left-skewed distributions for ROE and some abnormally low ROE values for each category of firms, regardless of their degree of ownership concentration, similar to ROA distributions.
The results of ANOVA and t-statistic applied to company categories based on ownership concentration, presented in
Table A7 in
Appendix, point towards statistically different mean ROE between A and D Western companies in seven out of nine years, and between B and D companies in four out of nine years. At the same time, no systematically statistically significant differences between A and B companies or B and C companies are found—t-statistics have values indicating significant differences in only a few years in our timeframe. As in the ROA case, no such statistically significant differences in mean ROE are found in the Eastern-based companies’ sample. These results point towards a positive correlation between ownership concentration and performance measured by ROE for companies from mature EU economies, but also indicate that the influence of ownership concentration on the performance of companies from newer and developing EU economies does not exist.
For what concerns the results of the KS two sample test, they confirm the findings when ROA was used as a performance indicator; as such, for Western-based companies, ROE distributions are different in a statistically significant way for A against D companies (for all years), for A against B companies (in six out of nine years) and also for B against D companies (in four out of nine years). At the same time, ROA distributions for Eastern-based companies indicate that companies cannot be differentiated on the basis of their ownership concentration when performance is at stake.
4.3. Analysis of Performance Based on Return on Invested Capital (ROIC)
Return on invested capital (ROIC) is the return that shows how well a company is using its available capital for investments, i.e., its equity and debt. This is one of the key ratios followed by capital market investors, along with ROA and ROE, as it provides them with needed insight into a company’s ability to generate operating or “core” income and profits from the used capital. The companies included in our two major samples (Western and Eastern EU companies) enjoyed various mean ROIC between 2008 and 2016, as shown in
Table 11, but the most important observation is that all categories of companies (depending on their origin and ownership concentration level), with only one exception (C-companies in the Eastern sample, for 2012) had positive ROIC for all years in our timeframe. At the same time, mean ROIC seems to have been highly variable from one year to the other; for Western-based companies between 0.13% and 12.19%, and for Eastern-based companies between −1.35% and 14.75%. At the same time, C-companies in Western EU countries enjoyed higher ROIC than their peers in Eastern EU countries in all years, but A and B Eastern-based companies performed better than their Western peers in all years. This might show a higher propensity towards investing in the Eastern part of the EU and a quicker recovery after the crisis, but might also be an effect of smaller average size of Eastern-based companies—this is connected to higher investment rates, as corporate finance theory and empirical evidences show [
82].
Figure 5 shows the graphical representation of results in
Table 11; the dominance of C and particularly D-companies over B and A-companies in the Western sample for all the years included in our analysis is clear, but also a fluctuating mean ROIC for all categories of companies, in both samples. On the other hand, the mean ROIC plot for Eastern-based companies shows a completely different landscape; in a similar fluctuating ROIC framework, no dominance of a specific company category over the others in terms of ownership concentration is observable—given the small size of the C-companies sample, it is prudent to not interpret ROIC values for these companies as necessarily showing an underperformance. This enforces the results obtained for ROA and ROE: companies with more concentrated ownership were able to generate superior performance in the years after the crisis and even during a crisis (the 2010–2011 sovereign debt crisis) compared to companies with more dispersed ownership, but only in mature EU economies. For the Eastern part of EU, such positive relationship between ownership concentration and performance is not observable.
Table 12 confirms EU companies’ difficulties in finding investment opportunities that generate interesting and growing ROIC after 2008, regardless of their origin countries. As such, with the exception of C and D companies, but only in the Western sample, all other categories of companies recorded negative trend values for mean ROIC after 2008. Moreover,
Table 12 also shows a different picture of trend distribution in ROIC terms compared to ROA and ROE among companies in our samples, as A, B and D companies have all higher percentages of companies with negative ROIC trends between 2008 and 2016 in the Western sample. Moreover, similar companies in the Eastern EU sample had a significantly higher percentage of companies with downward trends (60%, 56% and 58%, respectively), which is visible in the overall evolution of ROIC for these companies in
Figure 5. As for C-companies the percentage of companies with a positive trend is significantly higher compared to companies with downward trends for Western-based companies (64.86%), but in the Eastern sample, C-companies are equally divided between positive and negative trends.
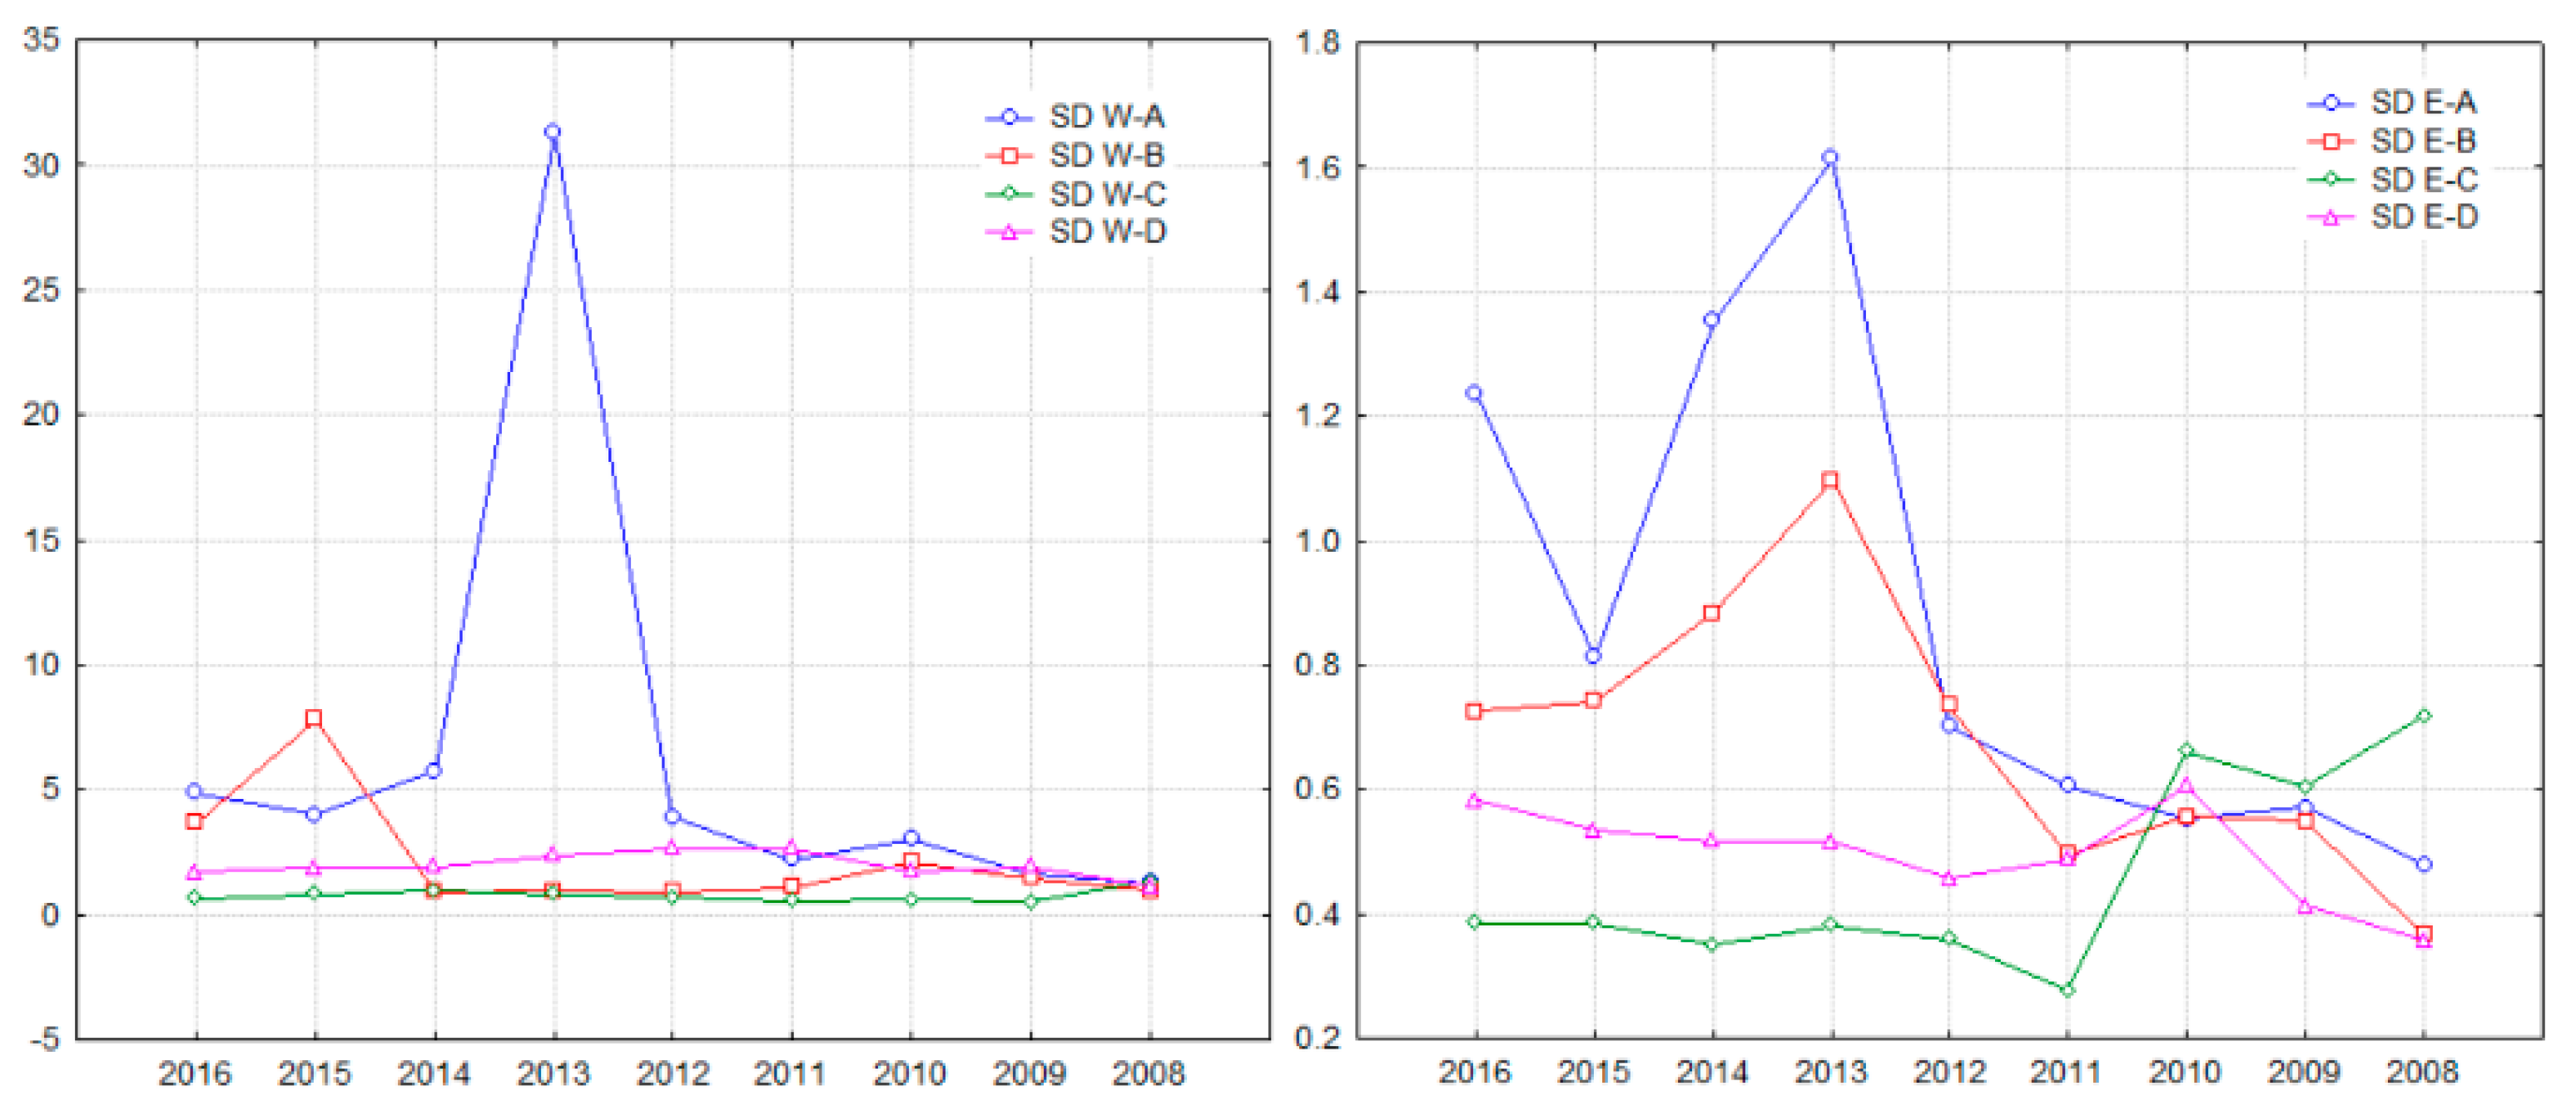
In volatility terms, ROIC patterns show one more time the West-East division observable before at the mean ROIC level.
Figure 6 illustrates the general higher ROIC volatility of A-companies over B, D and ultimately C-companies in the Western sample, but the same pattern is not observable for Eastern-based companies (standard deviation data is available in
Table A8 in
Appendix). Coupled with the results on mean ROIC values, we can imply that, overall, ROIC is more volatile across the companies included in the Western sample for companies with less concentrated ownership compared to companies with more concentrated ownership (observing A and D- companies). In the latter sample, though, ROIC volatility seems to have no connection to the companies’ degree of ownership concentration, but another observation is that standard deviations of ROIC over the years are themselves volatile. On the other hand, the range of ROIC standard deviations for Eastern-based companies is smaller compared to the range for Western-based and All EU companies, partially as a result of smaller samples of companies for all categories of companies. These results suggest that, collectively, companies from Eastern EU were not able to systematically identify attracting investment opportunities in the turbulent years after 2008, which made their recovery more difficult (as suggested by ROA and ROE patterns), regardless of their degree of corporate ownership.
The patterns in ROIC distributions’ skewness, as shown in
Table 13 and
Table A9 in
Appendix, are similar to ROA and ROE distributions, indicating mostly left-skewed distributions, with the marginal exceptions of B and D companies in the Eastern. The only negative skewness values of ROIC distributions for A-companies in the Western sample is also notable. These results confirm the previous findings on ROA and ROE distributions and accentuate businesses’ problems in recovering after 2008. Also, it seems that companies with less concentrated ownership have recorded more dispersed ROIC across the samples compared to companies with more concentrated ownership. This suggests that ownership concentration and a higher shareholder control over management was able to support a faster business recovery after 2008.
As in the case of ROA and ROE, the statistical testing of differences in mean ROIC between various categories of companies, whose results are presented in
Table A10 in the
Appendix, clearly indicate that A companies are different than D companies for all years in our analysis in the Western sample of companies, but this result is not confirmed for Eastern companies. Moreover, B and D companies seem to be noticeably differentiated in ROIC terms in most years (eight out of nine) in the same Western sample, but not in the Eastern sample. Similar to ROA and ROE, no consistent statistically different ROIC means are observable for A versus B, A versus C or B versus C companies, in all three samples. Again, the beneficial influence of ownership concentration over business performance is confirmed here; moreover, even for companies with a medium level of ownership concentration (B), the difference against companies with low levels of ownership concentration (D) is visible.
The KS two sample test for ROIC distributions’ dissimilarities applied to both Western and Eastern samples of companies confirms the results of the t-test for mean difference. There is a clear difference in ROIC distributions according to companies’ degree of corporate ownership for Western-based companies, as the KS test shows different ROIC distributions for A versus D companies (in five out of nine years), B versus D companies (in six out of nine years), but also in A versus B companies (in six out of nine years). This suggests that companies with lower degrees of ownership concentration, with higher mean ROIC over the years, are different from a statistical point of view compared to companies with lower degrees of ownership concentration and lower mean ROIC. At the same time, this result is not observable in the Eastern sample, which might indicate that ownership concentration is not a statistically significant differentiator of performance in terms of ROIC for these companies.
4.4. Analysis of Performance Based on Tobin’s Q (TQ)
The Tobin Q ratio, proposed by Tobin and Brainard [
83], is an indicator that sheds light on the capital market investors’ assessment of a company’s performance, thus departing from the accounting-based view offered by ROA, ROE or ROIC. TQ divides the market value of a company (or its market capitalization) by the replacement cost of company’s assets (typically the total value of company’s assets is used as an approximation of the assets’ replacement cost). The benchmark value for TQ is 1; a value below 1 means that the market value of company’s stock is lower than the replacement cost of its assets and is generally interpreted as an undervalued stock, typically prone to acquisition in the market. On the other hand, a TQ value above 1 points towards an overvalued stock, in whose case market investors put a higher price than the replacement cost of its assets; such companies attract investors towards the industries where they operate with the aim of gaining profits and, as a consequence, increased competition may reduce the stocks’ market value and also the TQ ratio value.
Mean TQ values, presented in
Table 14, show different pictures for companies in our samples between 2008 and 2016. First, mean TQ values are all below the benchmark value of 1 for Eastern-based companies, regardless of the ownership concentration level (with the minor exception of A-companies mean TQ in 2013), compared to Western-based companies, in whose case mean TQ has values above and below 1 over the years. Second, TQ values are below 1 even for Western-based companies in 2008, but, with the exception of C-companies, all other categories of companies have seen their TQ values improving until 2016. Third, the range of mean TQ is higher for Western companies’ samples compared to Eastern companies, indicating higher TQ variability for the former groups of companies—mean TQ varies between 0.57 and 3.02 for Western companies, but only between 0.41 and 1.05 for Eastern companies. Fourth, mean TQ values increase (as a trend) between 2008 and 2016 for companies in all samples, but this is not necessarily a surprising result, given the significant drop in stock prices as a result of the global financial crisis.
The plots of mean TQ in
Figure 7 offer a clear image of differences between companies depending on their degree of ownership concentration. Rather surprising, in the Western companies’ sample,
Figure 7 shows a clear dominance of A-companies over the other three categories of firms for all years between 2008 and 2016, but also a higher positive trend for A-companies. At the same time, A-companies show higher TQ values in the Eastern companies’ sample only after 2012, but this situation is preserved until 2016. Moreover, the ranking of companies based on their ownership concentration and mean TQ is to a large extent identical in both major samples (Western and Eastern): A-companies have the highest TQ means, followed by D, C and B-companies, but for Eastern-based companies, this ranking is observable only after 2013. These patterns show a negative influence of ownership concentration over market-based performances, particularly for Western companies, and seem to suggest that market investors value more companies with more dispersed shareholders. But this comes in contradiction to the results offered by accounting-based indicators of performance presented before (ROA, ROE and ROIC), which implies a decoupling of market assessment of performance from the accounting measurement of performance. This is not necessarily a surprising result, as existing empirical evidences support only to some extent the relationship between market-based performance and businesses fundamentals. Although Santos and Soukiazis [
84] find that American companies with a solid and good performance, both in terms of business and management quality—measured by return on assets, earnings per employee and earnings per share—are more likely to have higher price quality ratings in the US markets where they operate, it is well-known that a study by Fama and French [
85] has shown that size firm size and the ratio between book and market value are reliable predictors of stocks’ returns, and their ability to characterize the cross-section of stock returns in a sample of US firms is higher than of other accounting-based measures, such as leverage. More recently, Figelman [
86] suggested that market investors may not collectively recognize earnings’ manipulation by firms, as large companies with poor past returns and high levels of ROE significantly disappoint both the market and companies with poor past returns, but with low ROE. For the case of emerging Eastern European economies, Horobet and Belascu [
87] find that fundamental performance is positively linked to Romanian companies’ market performance but the influence may be observed only at the level of simpler indicators, such as stock returns, which might indicate a rather low financial maturity of investors present on the market and an inadequate adjustment of returns to the risk that may be detected from companies’ financial reports.
The results for trend values reported in
Table 15 support and enforce the previous findings. As evidenced by mean TQ values between 2008 and 2016, TQ trends for companies in all our samples are positive, indicating the overall growth of market capitalization after 2008. Interestingly, while Western companies with more concentrated ownership (D) recorded higher value of trends compared to companies with less concentrated ownership (A), in the Eastern EU, we note similar values of trends for A and D companies (around 0.4); this result suggests that market-based recovery was faster in the Western EU for companies with concentrated ownership, but in the Eastern part of EU, there seems to be no necessary link between TQ evolution and ownership concentration. Another interesting result that accompanies the positive trends is that, except for A-companies in the Eastern sample, a significant majority of companies, regardless of the sample, have seen their TQ values improving between 2008 and 2016, as indicated by the percentages for positive trends. The highest percentages of companies with positive trends belong to the A and D categories in the Western sample (71.46% and 71.38%, respectively), as well as to the C-category in the Eastern sample (71.43%). On the other hand, 54.55% of companies in the A category from the Eastern sample recorded negative trends in their TQ values.
For what concerns TQ volatility over time,
Figure 8 and
Table A11 in
Appendix show rather homogeneous companies from the TQ perspective in all categories in the Western samples, with the exception of A-category in 2013, but more heterogeneous groups of companies in the Eastern sample, particularly after 2012 and with a stronger point for A and B categories. Besides, TQ volatility indicates a clear ranking of companies based on their categories for the Eastern sample (TQ volatility increases from C to D, B and A companies), but given the rather similar TQ values for companies in the other two samples, such ranking is difficult to observe for them. Therefore, it is difficult to infer about any systematic link between TQ volatility and ownership concentration, regardless of the samples; still, it seems that, although companies with less concentrated ownership enjoyed higher mean TQ values after 2008, these means came together with a higher TQ dispersion across companies included in the samples.
Contrasting with previous indicators’ distributions, TQ distributions’ skewness are always positive, for all samples (based on companies’ home countries and their degree of ownership concentration)—see
Table 16 and
Table A12 in
Appendix. This result indicates only the presence of right-skewed distributions, as well as of companies with abnormally high TQ in all samples and years and highpoints the optimistic market valuation of all companies, with no link to ownership concentration.
Table A13 in the
Appendix shows the results of t-statistics for differences in means between various categories of companies differentiated by their ownership concentration. Here, we do not observe the clear-cut differentiation noticed in the similar tables for ROA, ROE or ROIC, with the rather soft exception of B- and D-companies, in whose case t-statistic values indicate significantly different means for four out of nine years (2011 to 2014), but only in the Western companies’ samples. In all the other cases, TQ means, although different by computation, are not statistically identified as being different. We may imply from here that, overall, market investors do not clearly differentiate between companies with higher or lower ownership concentration, although financial results indicate a superiority of more concentrated ownership businesses over the others.
Moreover, the KS two sample test for differences in TQ distributions indicates clear and statistically different dissimilar distributions for Western companies with lower versus higher degrees of ownership concentration, but not for Eastern-based companies. As such, the test identifies differences in TQ distributions between A and D, A and C, but also A and B companies (in all or almost all years), which seems to point toward the recognition of a negative ownership concentration influence on corporate performance by market investors, but only for Western-based companies.
The last point that deserves to be revealed regarding ownership concentration and companies’ recovery patters after 2008 is illustrated by the correlation between financial indicators’ values on a yearly basis (i.e., 2016 against 2015, 2015 against 2014, etc.).
Table 17 presents the average values of the Spearman correlation coefficients between 2008 and 2016; all values are positive, which suggests that, on average, better performance in a given year was followed by better performance in the subsequent year. On the other hand, we note higher values of correlations for companies with a lower degree of ownership concentration (A) compared to those with a higher degree of ownership concentration (D), but, interestingly, both of them are exceeded by correlations for C-companies (with a medium level of ownership concentration). Moreover, we observe the higher values of correlations for TQ compared to those for accounting-based measures of performance (ROA, ROE and ROIC), which confirms, in our view, the market investors’ optimism regarding all types of companies, without any link to ownership concentration.
5. Conclusions
Our research adds to the conflicting results of academic literature on the link between ownership concentration and corporate performance by proposing a straightforward but insightful manner of investigating the relationship between ownership concentration and corporate performance at the EU level; moreover, this relationship is studied for companies in the two different parts of the EU: The Western developed one and the Eastern developing one. The thorough statistical analysis undertaken has shown thought-provoking results that induce the conclusion that there is a clear division between Western and Eastern-based companies from the perspective of the connection between ownership concentration and performance, including here patterns of businesses’ recovery after the global financial crisis and the sovereign debt crisis.
When accounting-based measures are considered (ROA, ROE and ROIC), their mean values show high variability from one year to another, regardless of the origin-country of the companies and their degree of ownership concentration. At the same time, ownership concentration is a critical differentiator factor of performance when accounting-based indicators are used, but only when we analyze the All EU and Western samples; such differentiation is not statistically significant for Eastern-based companies. Thus, Western-based companies with a higher degree of ownership concentration (either high or medium-high) dominate companies with lower degrees of ownership concentration in terms of ROA, ROE and ROIC over the entire 2008–2016 period included in our analysis. Moreover, companies included in the high and medium-degree of ownership concentration samples display lower volatility of performance compared to companies with lower degrees of ownership concentration.
The results obtained in the case of Western-based companies for the link between ownership concentration and accounting-measured performance contradict the findings of Demsetz and Lehn [
22] that show a lack of a significant relationship between the degree of ownership concentration and accounting-measured profit rates for a large sample of 511 US companies, while firm size and profit rate instability are better explanatory variables of the variation in ownership structure. In the case of Swedish companies, Bergström and Rydqvist [
23] also shows that higher levels of ownership concentration are accompanied by higher firm size and lower levels of firm-specific risk. For the case of emerging countries, our results are not aligned with the findings of Wang and Shailer [
21] that identify a negative relation between ownership concentration and firm performance across countries, but also with those of Alouchna and Kaminsky [
70], which identify a negative correlation between ownership concentration by the majority shareholder and ROA and is seen as an expropriation rationale of blockholders. Moreover, Machek and Kubíček [
88] suggest that higher ownership concentration supports performance for companies from the Czech Republic, but only to a certain extent, and that performance is maximal when a controlling owner exists. At the same time, it should be noted that our study has not investigated the identity of owners as a determinant factor for business performance, but only the degree of ownership concentration; thus, our results are not directly contrastable against the few existing literature contributions for emerging economies.
Overall, ownership concentration has supported to some extent business recovery after the crisis, but this result is evidenced particularly for ROA—our results are thus in line with the literature on ownership concentration and performance during economic downturns. Thus, we support the conclusions of Saleh et al. [
73] for Australian firms’ performance patterns during the global financial crisis and those of Hanafi et al. [
74], identify a positive relationship between ownership concentration and business performance in the case of US companies during the 1997 and 2008 crises. These results may be explained by the higher commitment of more concentrated ownership companies to protecting their businesses and allocating capital to profitable investments during difficult times, which is also recognized by market investors.
When we switch the focus from accounting-based performance to market-assessed performance (by using Tobin Q as a performance measure), we see that market investors seem to place higher value on less concentrated ownership rather than higher ownership concentration. Moreover, this market “myopia” is disconnected from business fundamentals (as reflected in ROA, ROE and ROIC), as Tobin Q is on average growing trends for all companies (regardless of their origin and/or ownership concentration). From here, one may imply that market investors are preoccupied only about the future of these companies (and this is correct), but also that they do not acknowledge the role of ownership concentration (either beneficial of detrimental) for performance assessment, not even in developing economies; thus, our results seem to contradict the conclusions of Claessens and Yurtoglu [
69], indicating that better corporate frameworks are not necessarily reflected in the superior performance of companies from emerging economies.
Our research certainly has limits; one of the most important resides in the use of independence indicators as a measure of ownership concentration, given the large samples generated based on the definition of these indicators. At the same time, the paper should be regarded as a starting point towards describing and understanding the intricate relationship between ownership concentration and corporate performance within the European Union and to showing that the developed and emerging regions of the EU might display contrasting features in terms of this relationship. Thus, the simple, but not simplistic division between Western and Eastern companies, accompanied by consistent statistical testing, is able to offer a wider perspective on corporate performance. This research deserves to be continued by a more thorough investigation at the corporate level by taking into account the major investor’s identity, business size, sectoral idiosyncrasies and specific origin countries. Moreover, more sophisticated models that address the connection between ownership concentration and performance may be used with the goal of clarifying our results and of offering supplementary insight.


