Article

A Comprehensive and Integrated Stochastic-Fuzzy Method for Sustainability Assessment in the Malaysian Food Manufacturing Industry

1
Department of Manufacturing and Industrial Engineering, Faculty of Mechanical Engineering, Universiti Teknologi Malaysia, 81310 UTM Skudai, Malaysia
2
School of Mechanical and Manufacturing Engineering, National University of Sciences and Technology, 44000 Islamabad, Pakistan
3
Department of Mathematical Sciences, Universiti Teknologi Malaysia, 81310 UTM Skudai, Malaysia
*
Author to whom correspondence should be addressed.
Sustainability 2019, 11(4), 948; https://doi.org/10.3390/su11040948
Submission received: 28 December 2018 / Revised: 28 January 2019 / Accepted: 28 January 2019 / Published: 13 February 2019
(This article belongs to the Section Sustainable Urban and Rural Development)

Abstract

:
Manufacturing activities carry significant burdens for all three dimensions of sustainability, i.e., environment, economy and society. However, most of the available sustainability assessment methods for manufacturing are based on environmental concerns only. Moreover, it is hard to find a sustainability assessment method that considers both stochastic and fuzzy uncertainties concurrently and a comprehensive set of weighted and applicable indicators. Thus, the main purpose of this paper was to develop and test an integrated sustainability assessment method that included both stochastic and fuzzy uncertainties. Both quantitative and qualitative, and weighted sustainability indicators for the Malaysian food manufacturing industry needed to be considered, with reliable assessment results. In order to achieve the objective, the Monte Carlo simulation and fuzzy logic approaches were employed. An overall unit-less sustainability index was calculated to evaluate the current sustainability level. This method was demonstrated using a real-world case study of a Malaysian food manufacturing company. The results highlighted and traced the company-wide major low and high performing areas for all three dimensions of sustainability. The results unveiled that the case company could improve its sustainability performance more effectively by decreasing the amount of air emissions, polluted wastewater, etc., and improving the working conditions. This would enable the practitioners and decision-makers to allocate resources accordingly and more efficiently. Finally, the developed method was validated and the implications and conclusions of the research were presented.

1. Introduction

Sustainable manufacturing concept and practice are becoming increasingly a topic of significant interest globally. The need for sustainable manufacturing has become crucial due to the fact that manufacturing activities consume a large amount of energy and natural resources [1,2], produce considerable emissions to air and land and deteriorate the earth’s carrying capacity [3], while having significant implications for the society and economy. More specifically, the expanding food manufacturing industry due to the rapid growth in world population and changing lifestyles, results in the consumption of global resources at a faster pace [4]. The food sector contributes more than 25% of greenhouse gas (GHG) emissions alone [5,6] and is responsible for a large share of water withdrawal [7,8]. Moreover, food manufacturing also produces a significant amount of solid waste, wastewater, etc., [9]. In addition, the food manufacturing industry normally provides high-calorie and unfavorable nutritions in processed food which have potential harmful effects on eating and drinking behaviors [10]. In short, food manufacturing (processing and packaging) is critical from a sustainability viewpoint, especially in recent times when the world is facing global issues of environmental degradation, fragile and volatile economy and food security and safety.
To respond to this situation, sustainable food manufacturing has become a major concern and priority. In order to improve sustainability performance and green perception, assessment is an essential process [11,12,13,14]. An assessment and reassessment of how food manufacturing activities are undertaken is necessary to take on the challenges of sustainability while mitigating water usage, energy consumption and negative social and economic impacts. However, although food manufacturing contributes significantly to sustainability related burdens, it has not been given due attention by previous research from sustainability assessment and improvement viewpoints, especially in developing countries [15]. The major focus of sustainability related research has been on metal manufacturing, building and construction, chemical processing, etc.
The focus of previous sustainability assessment methods and studies in manufacturing remained mainly on environmental concerns alone [16,17,18,19]. However, the triple-bottom line (TBL) concept of sustainability [20,21] requires manufacturing industries to consider all three aspects (environment, economy and society) of sustainability comprehensively. Most of the time, sustainability assessment efforts in food manufacturing were limited to life cycle assessment or energy analysis [8,22,23,24]. Very few studies were based on the TBL concept. Recently, Ali et al. [25] tried to include other dimensions of sustainability for food manufacturing; however, their research was limited to environmental and economic impacts only, while the social aspect was overlooked.
Currently available sustainability assessment methods face various challenges, which resultantly hinder their practical application. For example, most of the sustainability assessment methods are based on quantitative indicators only, whereas qualitative indicators are overlooked because of various reasons [26,27]. Moreover, the unavailability of applicable and measurable indicators dissuades practitioners to assess sustainability performance. Instead of having generic and overall indicators, applicable and weighted sustainability indicators need to be used for specific industries [15,28,29,30]. This would give more standardized, precise and comparable sustainability evaluation [31,32,33,34,35].
Optimal sustainability related decisions can only be made when both types of fuzzy and stochastic uncertainties are included in one assessment method. Fuzziness (imprecise information) and randomness (stochastic variability) are the two main sources of uncertainties in the real world, which are also associated with sustainability assessment problems. However, overall, many sustainability assessment methods have simply overlooked both fuzzy and stochastic uncertainties. Even in a recent study [36], uncertainties associated with the data for sustainability assessment were ignored. Among other relevant methods, life cycle sustainability assessment (LCSA) by United Nations Environment Programme (UNEP)/Society of Environmental Toxicology and Chemistry (SETAC) [37] is an important method for TBL based assessment. However, LCSA is an impact assessment method, just like life cycle assessment (LCA) [38]. LCSA is based on general guidelines and there is a need to develop a comprehensive and weighted set of indicators. Additionally, from economic and social viewpoints, the impact categories and how to measure them have yet to be agreed upon [38]. Moreover, the concept of stochastic and fuzzy uncertainties is also missing in LCSA.
The above mentioned research gaps and discussion highlight the need for the development of a TBL-based comprehensive and integrated sustainability performance assessment method that integrates both stochastic and fuzzy uncertainties, while considering weighted and applicable sustainability indicators. Thus, this novel study provides contributions in various aspects. Theoretically, it would answer the research question of how to integrate stochastic and fuzzy uncertainties in a sustainability assessment method. It would also demonstrate how to include and analyze qualitative and quantitative indicators concurrently. This would help to further improve the capabilities of sustainability assessment methods. Practically, by demonstrating the application of this method in the Malaysian food manufacturing industry, it is expected to increase sustainability assessment efforts in a developing country like Malaysia, and may eventually improve its sustainability performance. Currently, the Malaysian food manufacturing industry lags behind in applying sustainability practices in its operations [39,40].
To achieve the objective of developing an integrated sustainability assessment method, the Monte Carlo simulation and fuzzy logic approaches were used simultaneously. Fuzzy logic was used for qualitative indicators because it is suitable to address linguistic variables when evaluating sustainability. However, fuzzy logic is unable to address the dynamic and probabilistic nature of quantitative variables. Thus, Monte Carlo simulation was utilized for quantitative indicators to solve this problem. The Crystal Ball software for Monte Carlo simulation and the Fuzzy Logic toolbox of Matlab (R2015b) were used. In order to show the applicability of the developed method, a case study was done in the Malaysian food manufacturing industry. Real data were collected from a case company and the developed method was applied to assess its sustainability performance. After this, the method was validated for its robustness and the results obtained were analyzed and discussed.
The rest of this article is arranged as follows. Section 2 presents the background and some general concepts, and the developed method is described in Section 3. The application of the method in a case study along with the results are presented in Section 4. Section 5 provides an analysis and discussion. Validation of the method is presented in Section 6. Section 7 outlines various implications for practitioners and researchers, and important conclusions are provided in Section 8.

2. Background and General Concepts

As discussed earlier, the main objective of this article was to develop and test a comprehensive and integrated sustainability performance assessment method that is based on stochastic and fuzzy approaches. Thus, this section briefly describes the concept of sustainability assessment along with Monte Carlo simulation and fuzzy logic.

2.1. Sustainability Assessment

In simple words, sustainability assessment can be defined as the process that evaluates the implications of an initiative on sustainability [41] and directs decision-making towards sustainability [20,42]. It is being increasingly seen as an important tool to aid in the shift towards sustainability [15,43,44,45]. The objective of sustainability assessment is to ensure that products, processes, industries, activities, etc., make an optimal contribution to sustainable development [46]. In this respect, sustainability assessment would ensure and improve the sustainability performance of manufacturing activities.
In order to perform a sustainability assessment, various indicators [47,48] are utilized to give values to the dimensions of sustainability [49]. Moreover, sustainability assessment can be undertaken at different levels and boundaries. From a manufacturing viewpoint, the plant/factory level assessment (including all manufacturing processes) gains more importance as it directly leads to energy uptake and emission, etc., and helps in internal decision-making for improving sustainability performance more effectively [15,50]. Currently, sustainability assessment based on the TBL concept is quite challenging when all three dimensions of sustainability are considered in a comprehensive way [51].

2.2. Monte Carlo Simulation

One of the most straightforward and important stochastic modeling techniques is Monte Carlo simulation. It is a computational method for generating probability distributions of variables that depend on other variables or parameters represented as probability distributions [52]. Theoretically, this method is grounded on an entirely random process and it has been proven statistically that with enough sampling iterations, one can accurately generate output realization distributions [53,54]. In this research, the Monte Carlo method was used because of its several advantages over other techniques (probabilistic programming, etc.). For example, it is simple to be implemented and no mathematical equation is needed to describe the behavior of a system.
In general, the Monte Carlo simulation involves various steps. Firstly, the selection of a range or distribution (e.g. uniform, lognormal, triangular, etc.) for a variable is done. In the second step, the samples are generated from the range or distribution specified earlier. Next, based on the mean or variance, the uncertainty is analyzed. After a sufficiently large number of simulations, the distribution function of the output can be determined. Various studies found that 1000 simulations are sufficient for proper analysis and for delivering a stable output [54,55,56]. More information on the theory of Monte Carlo simulation and how it works can be found in the literature [52,57,58]. The Monte Carlo approach has been used in other research areas. For example, it was used for water quality related risk assessment [59], air quality and risk assessment [53], health related risk modeling [60,61], etc. However, its application in sustainability assessment was normally limited to environmental analysis or sometimes to cost analysis only [62,63,64].

2.3. Fuzzy Logic

Fuzzy logic, as a scientific tool, helps to address deficiencies inherent in binary logic and handle uncertainties in real-life situations. It has the capabilities of human logical thinking, which make it as a natural choice or tool for sustainability assessment [65]. Moreover, fuzzy logic can handle various number of qualitative indicators. This makes the sustainability assessment more comprehensive. Due to these advantages and characteristics, fuzzy logic was used in this research to address fuzzy uncertainties.
In fuzzy logic, the truth of a statement is supposed to be a matter of degree, and linguistic variables (e.g. very poor, poor, average, good and very good) are used to address the degree of imprecision. A fuzzy system contains a rule base and a reasoning algorithm, which are used to process fuzzy input values to a crisp output value. Knowledge is represented by IF–THEN linguistic rules. Using the procedure developed by Mamdani and Assilian, three steps are taken to create a rule-based fuzzy system: (1) fuzzification—using membership functions to graphically describe a situation; (2) rule evaluation—application of fuzzy rules by the combination of two sub-processes: inference and composition based on given fuzzy rules; and (3) defuzzification—obtaining crisp or actual results [53,65]. Fuzzy logic has been used in various sustainability assessment studies [65,66,67]. However, considering sustainability as a fuzzy concept only is not adequate. Sustainability related decision-making using either the fuzzy or stochastic approach solely may lead to potential shortcomings and sub-optimal decisions. The integrated usage of stochastic and fuzzy approaches is hard to be found for sustainability assessment purposes, especially in manufacturing. Thus, the proposed method is aimed to capture stochastic as well as fuzzy uncertainties in sustainability assessment. This is elaborated more in the next section.

3. The Proposed Method

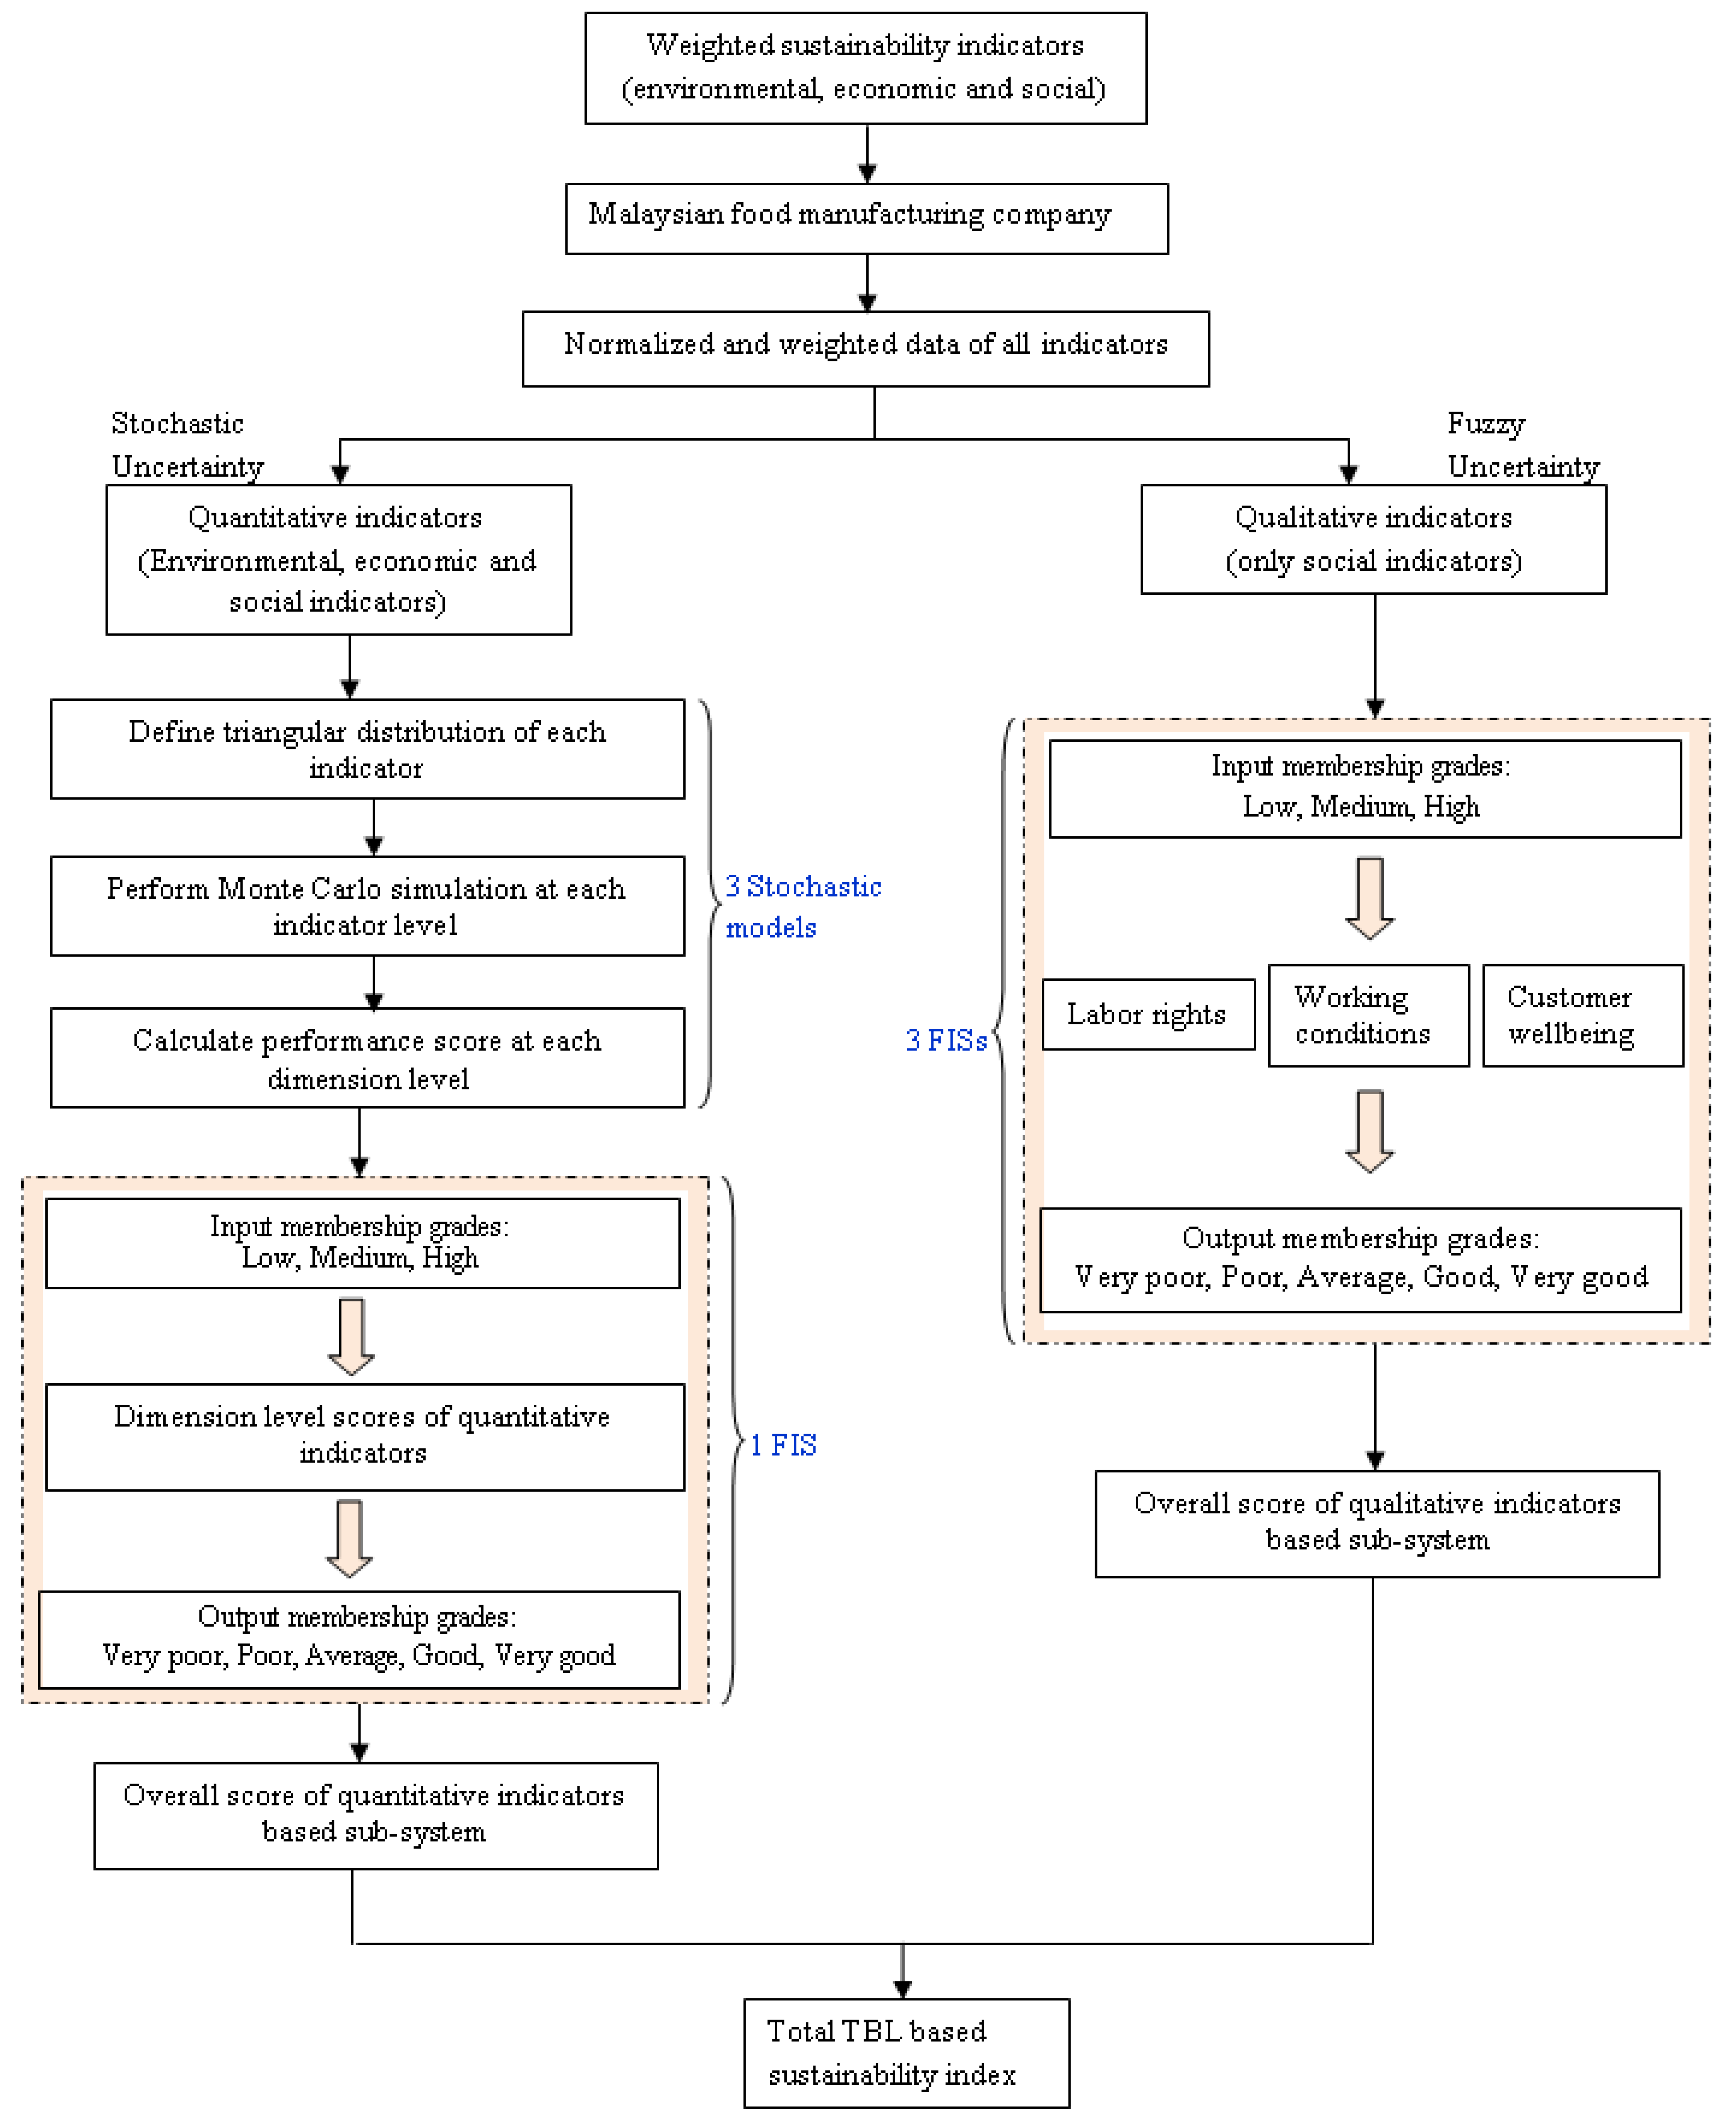
The basic modeling components of the proposed method are shown in Figure 1. Overall, in order to capture stochastic and fuzzy uncertainties, the method was based on both types of quantitative and qualitative indicators. The quantitative indicators (environmental, economic and social indicators) were treated as stochastic variables, whereas the qualitative indicators (social indicators) were analyzed as fuzzy variables. For simplicity purposes, the method was divided into two sub-systems (quantitative indicators based sub-system and qualitative indicators based sub-system). The method used the fuzzy logic approach for the qualitative indicators based sub-system. The quantitative indicators based sub-system was analyzed based on Monte Carlo simulation first, and then followed by fuzzy logic. The TBL based total sustainability index was grounded on the weighted contribution of each sub-system.
At the outset, using Monte Carlo simulation requires input information to be specified; however, in many real-world applications, the available information is imprecise and scarcely accessible. In such situations, when there are very limited sample data for an uncertain parameter, the triangular distribution is used, where it is based on knowledge of the minimum, maximum and most likely modal values [68,69,70]. Since in this study, the possible ranges of industry data were used for the indicators, it seemed reasonable to use the triangular distribution. The minimum, most likely and maximum values were used to infer the lower bounds, modes and upper bounds of the triangular distributions.
The quantitative indicators were directly measured based on their measuring units, whereas the qualitative indicators were recorded based on linguistic measures, using a Likert scale from 1 to 5 [71]. The qualitative indicators were processed by using fuzzy models or Fuzzy Inference Systems (FISs). The triangular membership function was used in the fuzzy models because it is the simplest and most commonly used membership function owing to its ability to be adapted into various assessments [65,72,73]. The Mamdani method was used as the fuzzy model and the centroid method was utilized as the defuzzification approach. The Mamdani-type FIS was used because it is widely accepted and provides more consistent results [74,75]. Moreover, the selection of the centroid defuzzification method was based on its superior results and steady-state performance [76,77]. Briefly, the proposed sustainability assessment method is presented below as a set of steps:
Step 1: As the first step, the goal and scope of the study were defined and the system boundary was specified. The goal and scope were identified at the earliest stage of the evaluation process. In this research, the goal was to develop a method for assessing the sustainability performance of a plant/factory in the Malaysian food manufacturing industry. The scope included the system boundary (either cradle-to-gate, cradle-to-grave, gate-to-grave or gate-to-gate). The extent of the system boundary depended on the goal of the study.
Step 2: This stage was related to the identification and selection of applicable sustainability indicators and their relative weights from the viewpoint of the Malaysian food manufacturing industry. Normally, previous sustainability-related research used a limited number of indicators for ease and simplicity purposes. In contrast, this research was based on a comprehensive set of 57 sustainability indicators. The weighted and applicable indicators that were specifically developed for the Malaysian food manufacturing industry were used. These indicators were first extracted from the literature and then refined and finalized for this specific industry using the Delphi method while engaging various experts from academia, research center and industry. These indicators were reported in [78]. The weights of the indicators were calculated based on the applicability scores recommended by the experts [78]. In addition, a positive or negative sign (+ or −) was assigned to each indicator based on its direction of impact on sustainability performance. In other words, if the objective is to increase an indicator’s value, its sign is positive (+); otherwise, its sign is negative (−).
Step 3: The selection of the food manufacturing company was primarily based on the size of the company, and its willingness to participate and share the related data for analysis purposes. As the aim was to develop an applicable and practicable method, Small and Medium Enterprises (SMEs) were chosen for initial demonstration. This was done because SMEs generally find it difficult to cope with emerging challenges due to their financial, technical and other constraints. Thus, in a sense, it could help food manufacturing SMEs in Malaysia.
Step 4: The data were collected from the case study company and they were normalized and weighted for each indicator. Due to different measuring units of different indicators, they could not be processed directly. The data were normalized from 0 to 1 to solve this problem. Two formulas were used; one for indicators with a positive sign (+) and another for indicators with a negative sign (−) [79]. Equation (1) shows the calculation to normalize scores for positive indicators, and Equation (2) is for negative indicators. The normalized score x ˜ m n was calculated using c n + as the maximum score and c n as the minimum score among the three-point data ( f m n 1 , f m n 2 , f m n 3 ). As depicted in Equation (3), the normalized score was simply multiplied by the weight ( w n ) of the respective indicator to get the normalized weighted score ( c ˜ m n ) of that indicator:
x ˜ m n = ( f m n 1 c n + ,   f m n 2 c n + ,   f m n 3 c n + )
x ˜ m n = ( c n f m n 3 ,   c n f m n 2 ,   c n f m n 1 )
c ˜ m n = w n . x ˜ m n
For qualitative indicators, in order to get a single real value ( P ( m ˜ ) ) based on three fuzzy estimates, the graded mean integration representation method [80] was used. The formula is given in Equation (4):
P ( m ˜ ) = 1 6 ( a + 4 b + c )
Step 5: This step was about the assessment of the qualitative indicators based sub-system. There were nine social indicators in the qualitative indicators based sub-system under three aspect categories (labor rights, working conditions and customer wellbeing). The fuzzy logic approach was used, and thus, three FISs (one for each aspect category) were designed for the qualitative indicators. In order to develop the FISs, three degrees of triangular membership functions were used for the input variables; low (L), medium (M) and high (H). Three degrees were employed, because they were simple and also commonly used in engineering and management problems. As for the output, five degrees of triangular membership functions were used; very poor (VP), poor (P), average (A), good (G) and very good (VG). Five degrees were proposed to obtain a more accurate result with lower complexity. The fuzzy membership grades (degrees) for the input and output variables are presented in Table 1 and Table 2, respectively. Equation (5) was used to calculate the number of rules required in each FIS:
R = n v
where n represents the number of fuzzy membership grades for input variables, v is the number of input variables (indicators) for each aspect category and R stands for the number of rules needed. The labor rights category was based on three indicators, thus, the rule base comprised 27 rules. The second aspect category (working conditions) consisted of only two indicators, thus, nine rules were used. There were four indicators in the customer wellbeing category, and thus, it required 81 rules. All the rules were connected by using the ‘AND’ operator. The defuzzified value generated by each FIS was used as the score of each aspect category. These scores were summed up to obtain the overall score for the qualitative indicators based sub-system.
Step 6: The quantitative indicators based sub-system was analyzed using two approaches: firstly, the Monte Carlo simulation was used to address the stochastic uncertainties and then fuzzy logic to cope with the directions of impact of sustainability dimensions. The values of the quantitative indicators were stochastic, and therefore, it was important to simulate their performance. The three-point data were used to represent the triangular distributions. Simulation was performed 1000 times at each indicator level (19 environmental, 14 economic and 15 social indicators) [54,55,56]. The dimension level performance was calculated by adding/subtracting (based on the impact direction of an indicator) the average simulated scores of all quantitative indicators in each dimension. In this way, the environmental, economic and social (with stochastic indicators) dimensions were assigned a score based on the stochastic analysis.
The dimension level scores obtained through stochastic simulation were used to develop another FIS in order to get the overall score for the quantitative indicators based sub-system. Actually, the dimension level scores based on Monte Carlo simulation were not having the same direction of impact on sustainability performance. Since there are more indicators with a negative sign in the environmental and economic dimensions, a lower score means better performance for these two dimensions of sustainability. However, in the case of the social dimension, a higher score is better. Thus, in order to solve this problem, another FIS was designed. The same number of triangular membership functions with the same range, as mentioned in Step 5 were defined for the variables. There were three variables (three sustainability dimensions), which required 27 rules to describe the problem fully. However, because of the direction of impact of the environmental and economic dimensions, different membership grades (Table 3) were designed for these two dimensions.
Step 7: The overall TBL-based sustainability index was calculated based on the scores received in the previous two steps. The weighted scores of both the sub-systems (qualitative indicators based and quantitative indicators based sub-systems) were summed up to get the total TBL sustainability index of the overall system. Based on this final sustainability index, the food manufacturing company’s sustainability performance could be categorized into one of the five levels given in Table 4.

4. Case Study

In order to demonstrate the usefulness of the developed method, it was tested through a case study in a Malaysian food manufacturing company. The company’s name is not disclosed for anonymity purposes, and thus, is simply denoted as “ABC Company”. It is an independent small sized food manufacturing factory, located in Penang, Malaysia. The company is famous for frozen Halal meatballs and it was established in 1997. The production factory consists of various sophisticated food manufacturing machineries, while strictly observing the Halal and hygienic food manufacturing practices. The meatballs are made up of beef mince mixed with beef fat, flour and herbs and spices consisting mainly of salt, pepper, sodium compound, onion and garlic. This mixture is formed into small ball-shaped patties and the patties are fully cooked in boiling water. The finished products are pre-cooled and then blast-frozen or stored in a cold room. The meatballs are packed in small packages first that are further put into reusable crates or cartons based on customer demand.
The system boundary for sustainability assessment was gate-to-gate in this case study. The gate-to-gate boundary starts from the receiving of raw materials and includes manufacturing and packaging processes in a factory [15]. This boundary was selected to perform a detailed analysis of the food factory and to support internal decision-making. Thus, other life cycle phases, such as preprocessing, usage, etc., were not included.

4.1. Data Collection

Since the system boundary was gate-to-gate in this research, input and output data were collected only for manufacturing and packaging activities which were happening inside the food factory. Data related to other life cycle phases, such as pre-processing, transportation, usage, etc., were not collected as they were beyond the scope of this study. The company provided monthly, weekly or daily basis data and these were converted to ‘per product’ data for simplicity and comparison purposes. Data used in this study were gathered through site visits and face-to-face interviews with the production manager. As mentioned earlier, data for the quantitative indicators were measured based on their measuring units, whereas the qualitative indicators were recorded in terms of linguistic measures which were based on a Likert scale from 1 to 5 [71]. These linguistic measures and their corresponding values are given in Table 5.

4.2. Normalization and Weighting of the Data

Normalization was done using Equations (1) and (2). An indicator’s weight was multiplied with its normalized value to obtain its normalized weighted value (Equation (3)). Table 6, Table 7 and Table 8 show the data for the quantitative indicators and Table 9 presents the qualitative indicators’ data for the case company. For the qualitative indic±ators, a single real value ( P ( m ˜ ) ) was calculated using Equation (4).

4.3. Assessment of Qualitative Indicators based Sub-System

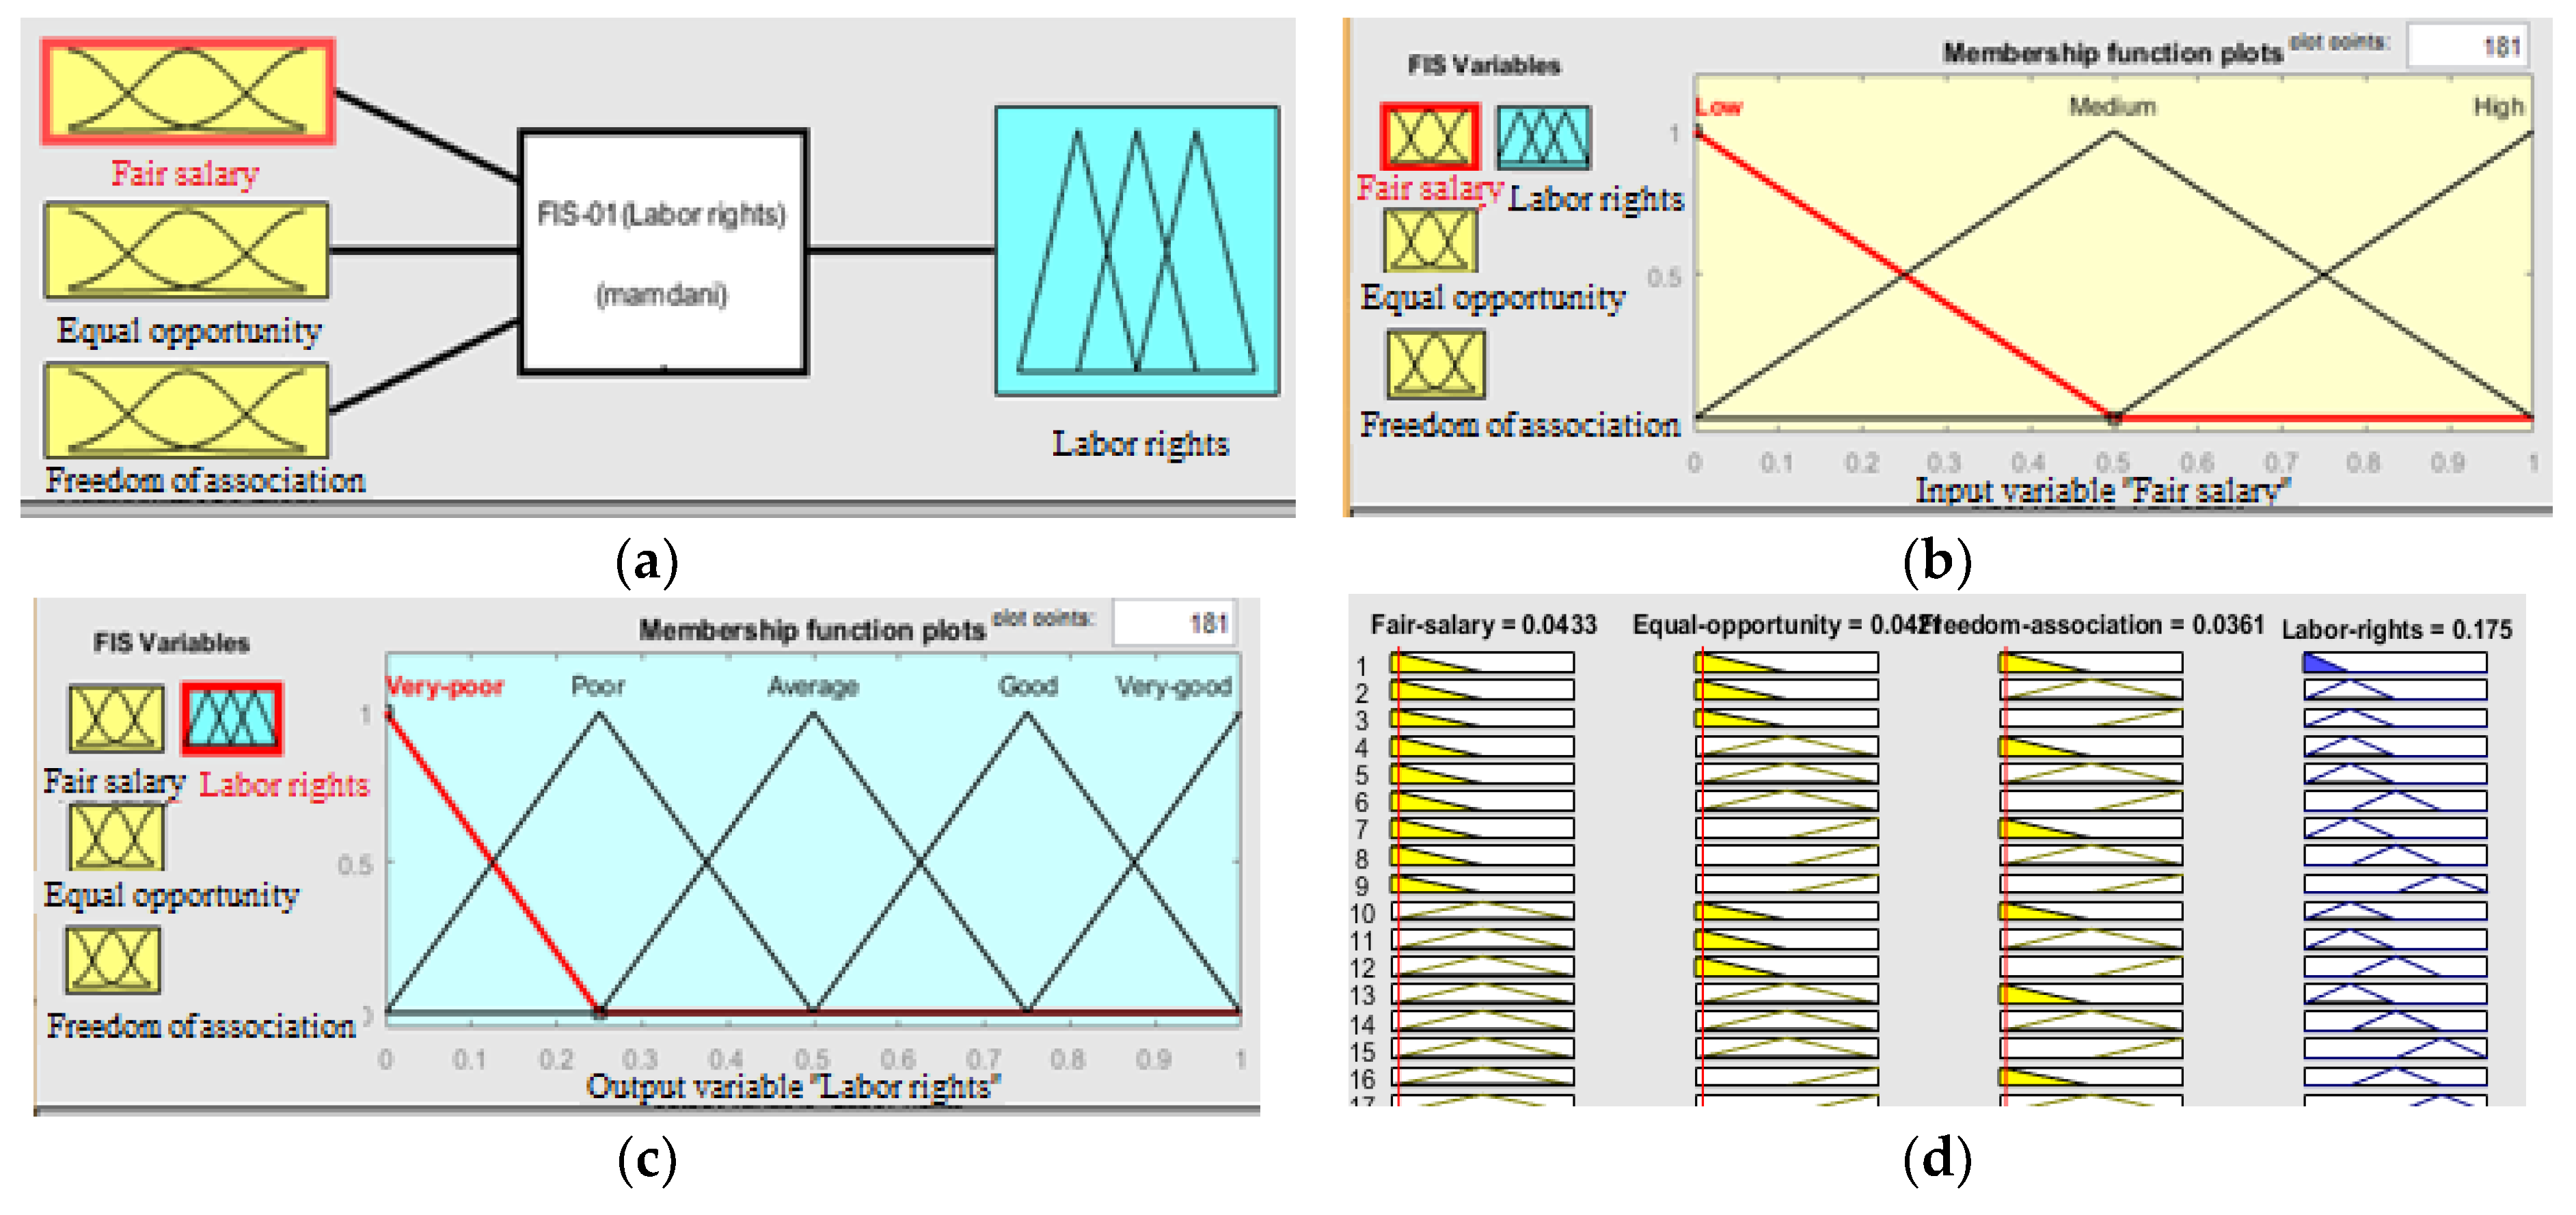
As described in detail in Section 3, the qualitative indicators were evaluated through the fuzzy logic approach. The fuzzy membership grades and linguistic terms as presented in Table 1 and Table 2 were used for the input and output variables. A fuzzy rule base was constructed at each aspect category level (labor rights, working conditions, and customer wellbeing) and three FISs were created. The fuzzy logic toolbox of Matlab software was used as a simulator. Figure 2 presents a final configuration example of the Mamdani-type FISs.
The grades of membership functions were used to create the rules. Some examples of rules from the rule bases are presented in Table 10.

Performance of Qualitative Indicators Based Sub-System

After running the FISs, the defuzzified scores were obtained at each aspect category level. Table 11 presents the performance score based on qualitative indicators for each aspect category.
The overall performance of the qualitative indicators based sub-system was calculated by adding up the scores of all three aspect categories. These values were directly summed up because all the aspect categories were having the same direction of impact on sustainability. The performance score of the qualitative indicators based sub-system was 0.518.

4.4. Assessment of Quantitative Indicators Based Sub-System

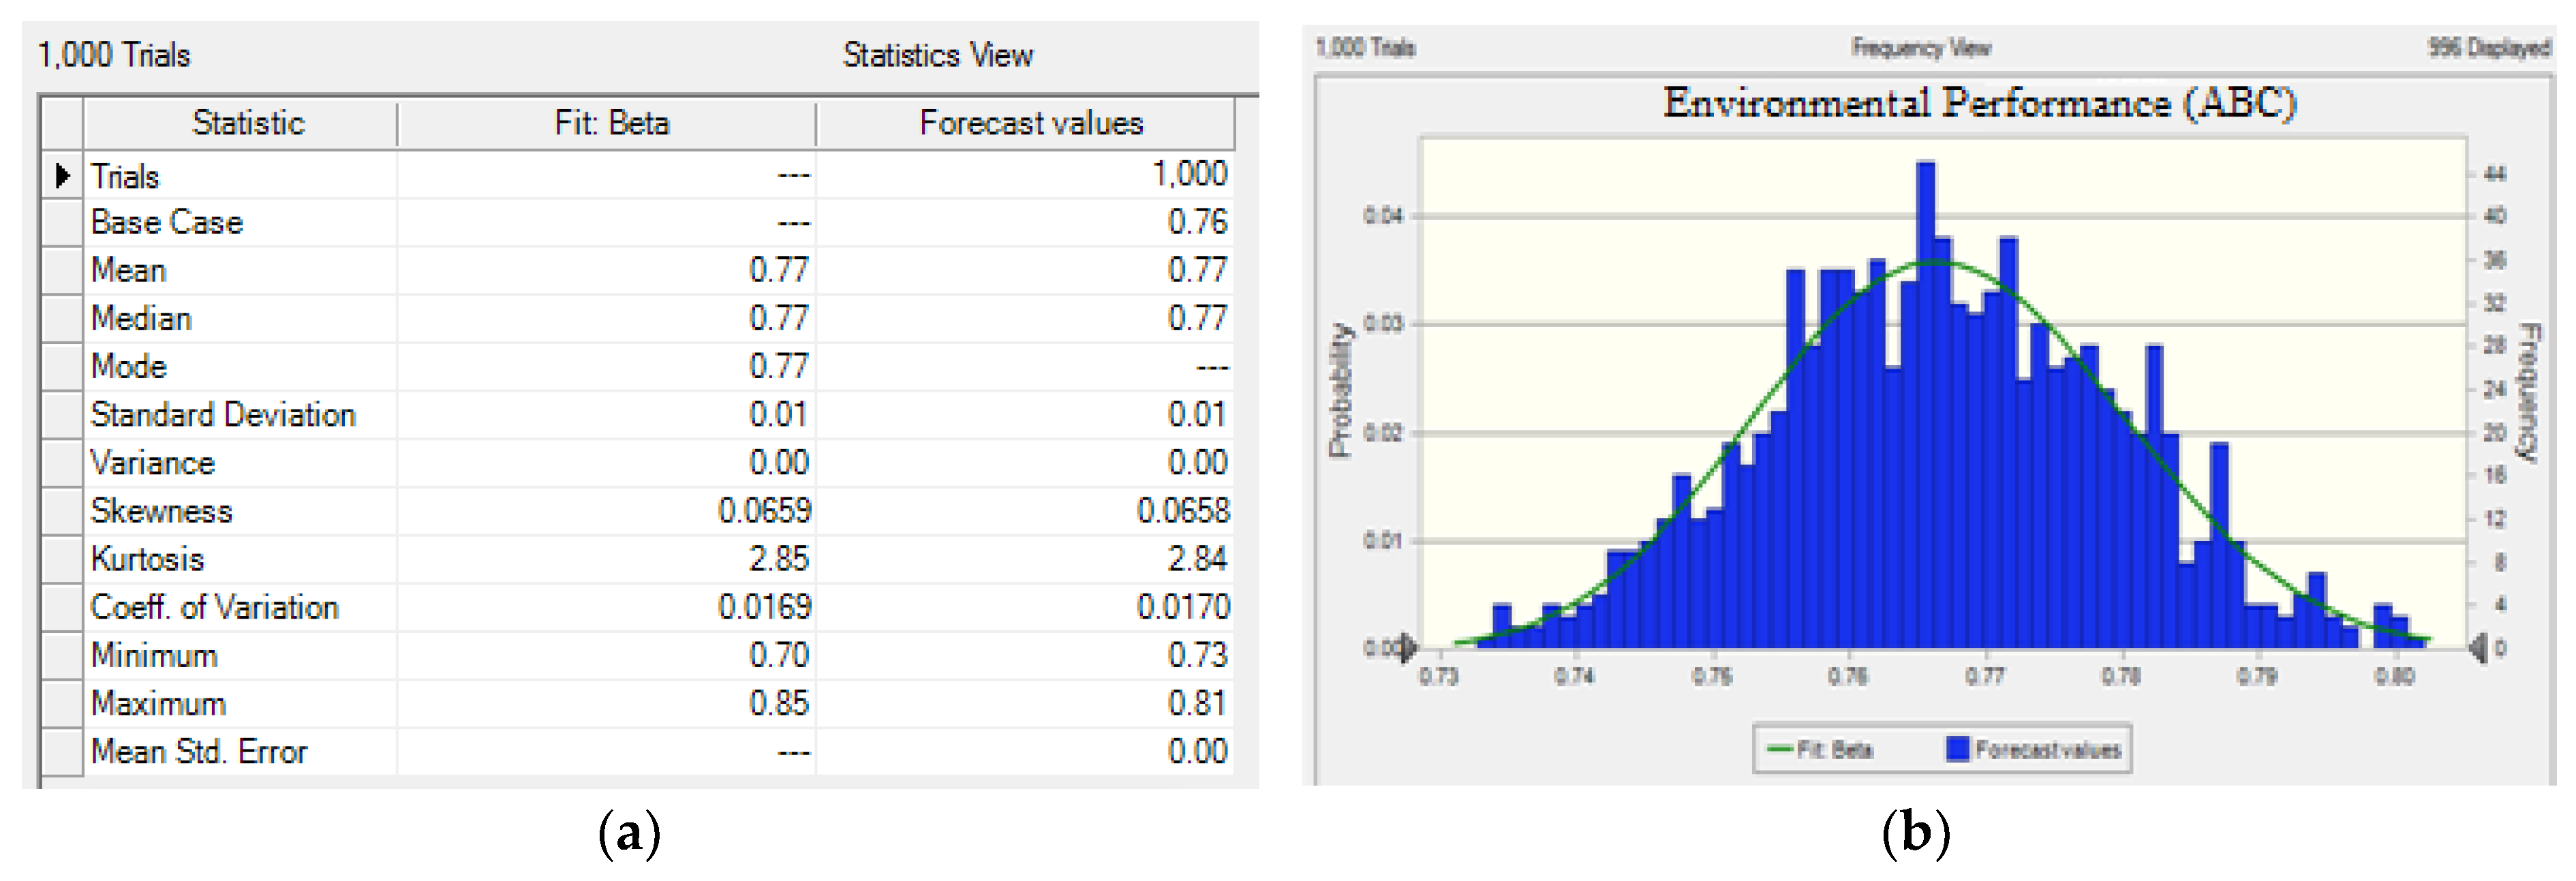
As mentioned earlier, the quantitative indicators were first processed through Monte Carlo simulation and then fuzzy logic. Using triangular distributions and three-point normalized and weighted data, the Monte Carlo simulation was performed 1000 times at each indicator level. The average simulated scores of indicators were added up to get the dimension level performance. For example, there were 19 environmental indicators, thus, the simulation was performed for all 19 indicators and then the average simulated scores of indicators were summed up to obtain the environmental performance. The same procedure was followed for the other two dimensions. Figure 3 shows the stochastic simulation outputs in pictorial forms.

Performance of Quantitative Indicators Based Sub-System

The performance of each sustainability dimension, i.e., environmental, economic and social was generated based on the average simulated scores of quantitative indicators in the respective dimension. The scores for all three dimensions are presented in Table 12.
The dimension level performance scores of quantitative indicators were used to construct another FIS in order to get a score for the quantitative indicators based sub-system. As mentioned earlier, FIS was employed to solve the problem of different directions of impact of sustainability dimensions. The overall performance score of the quantitative indicators based sub-system generated by the FIS was 0.404.

4.5. Total TBL Based Sustainability Index

The total TBL based sustainability index was calculated by adding up the weighted scores of the two sub-systems: qualitative indicators based sub-system and quantitative indicators based sub-system. The total sustainability index shows the weighted contribution of each sub-system. The weights of the quantitative indicators based sub-system (0.837) and qualitative indicators based sub-system (0.163) were calculated based on the indicators’ weights in each sub-system, as given in [78]. Table 13 shows the total sustainability index of the case company.
As already mentioned, the sustainability performance was indexed between 0 and 1. Five ranges were defined in order to categorize the sustainability performance as given in Table 4. For example, if the index is between the range of 0.0–0.19, then the performance is considered very poor. The total sustainability index of the case company was 0.42 which fell into the “Average” sustainability performance range.

5. Discussion and Analysis

This section presents a useful analysis and discussion of the results. These results were discussed with respect to the outputs of the fuzzy and stochastic models, total sustainability index and contribution to uncertainty.
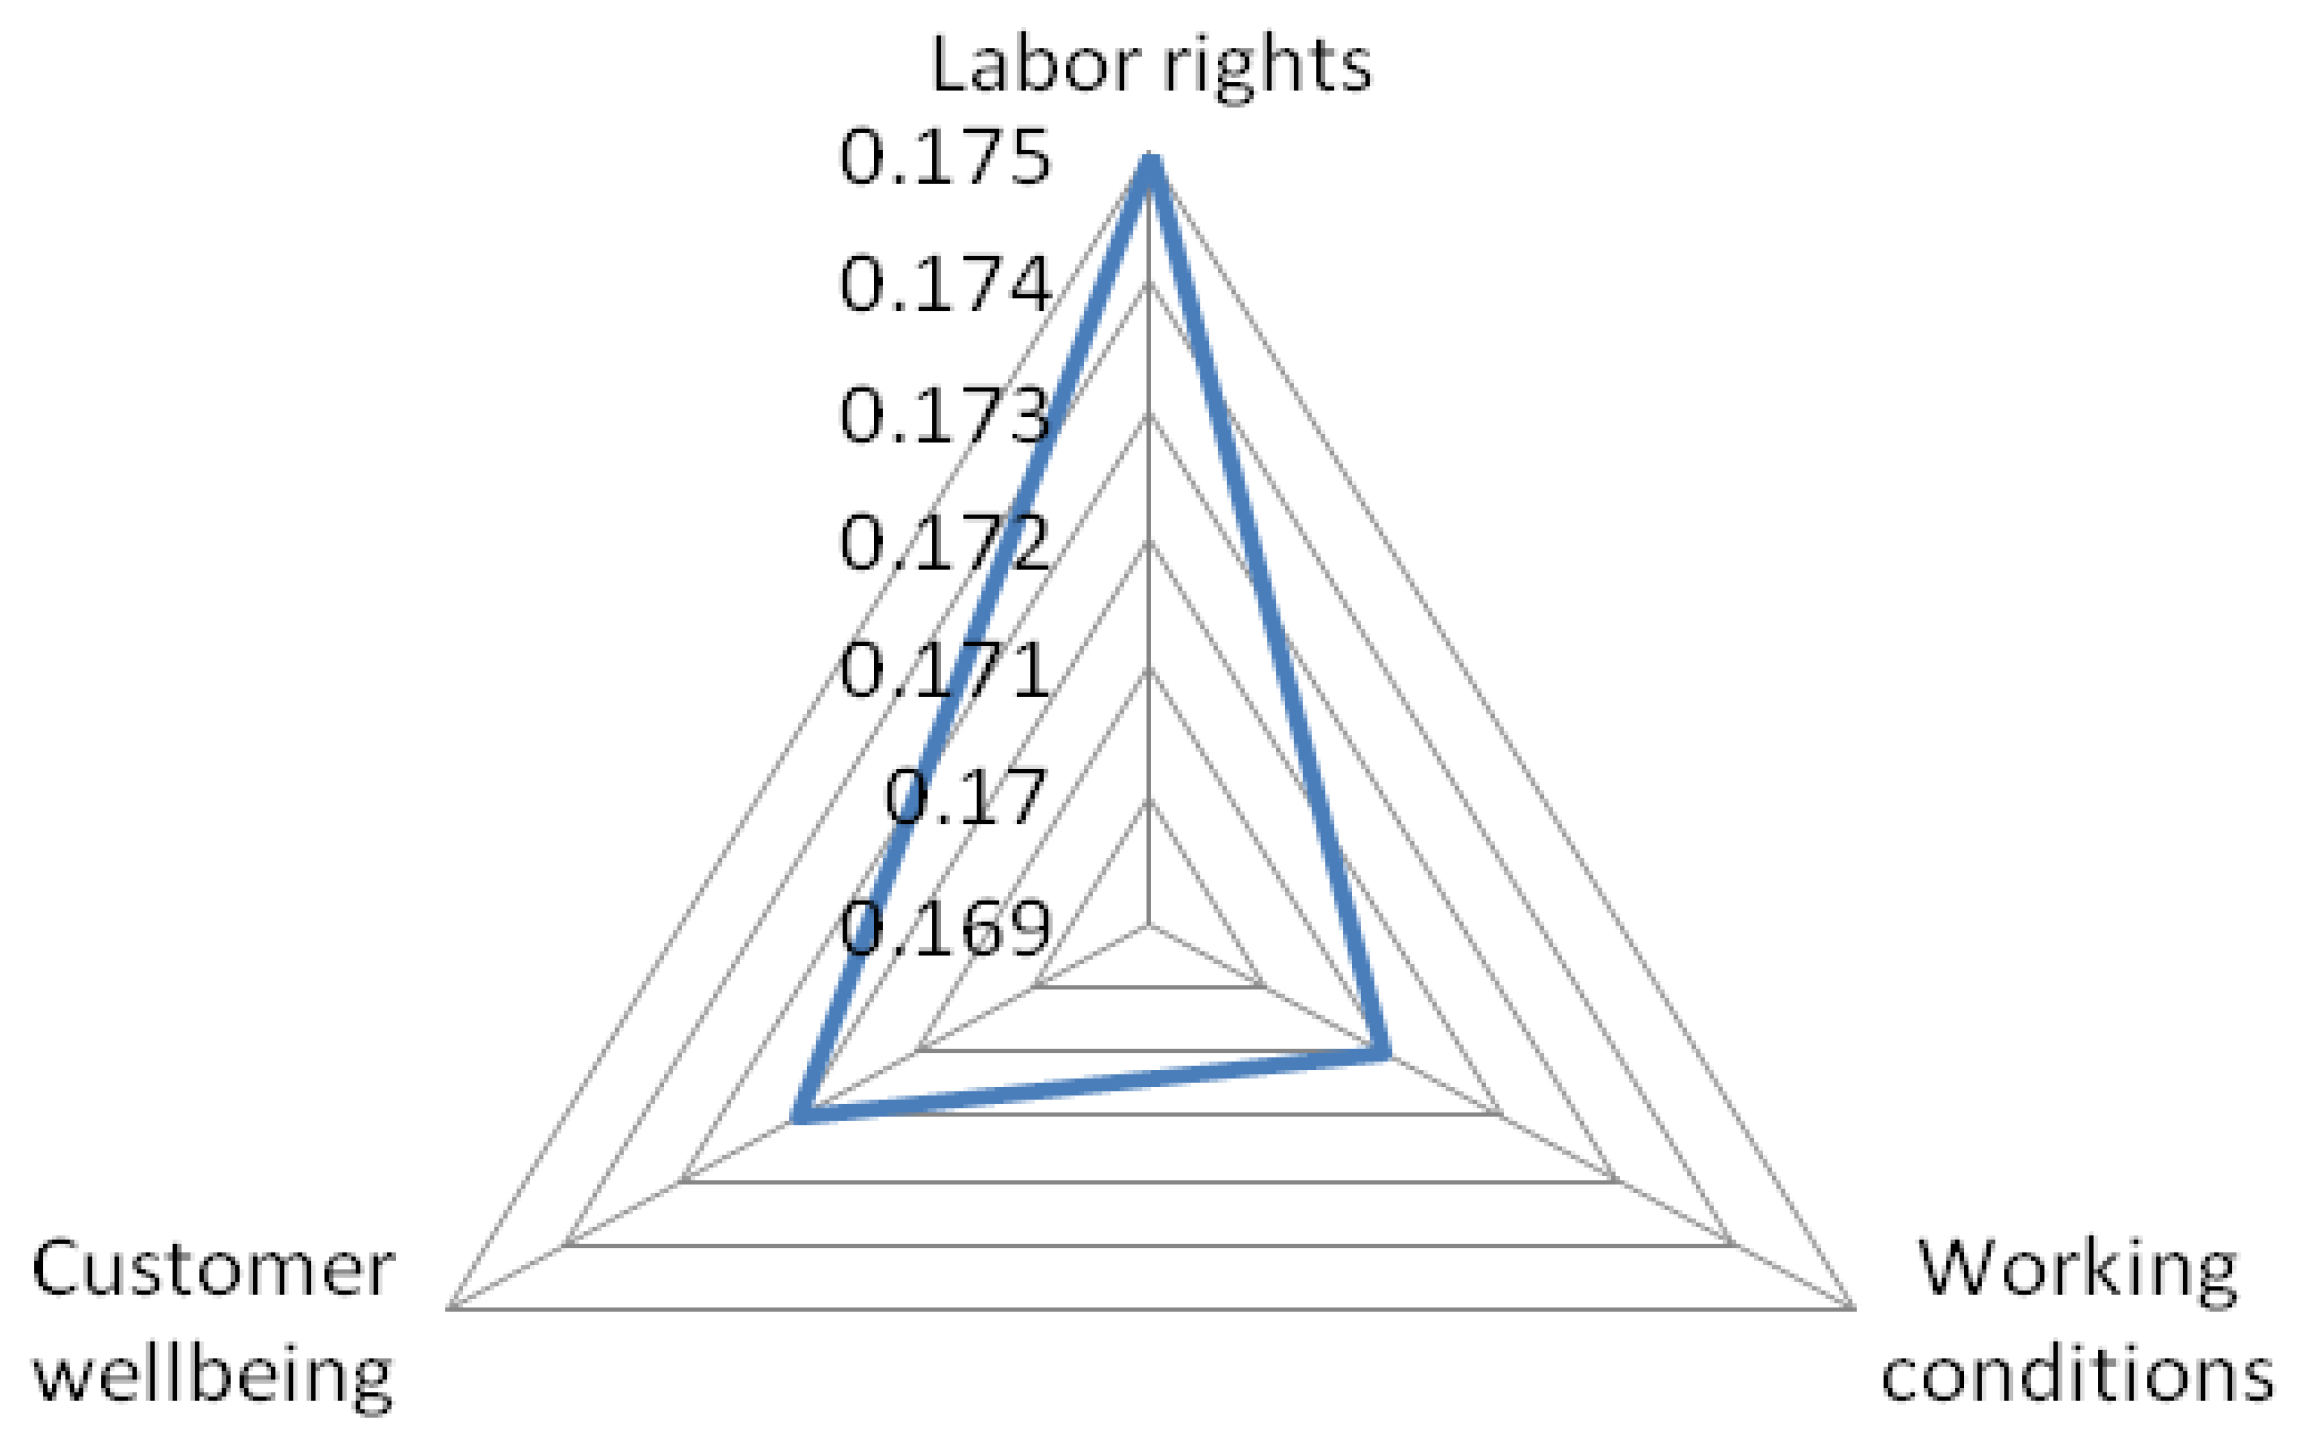
For the qualitative indicators, as depicted in Figure 4, the aspect category of labor rights was comparatively performing better with a score of 0.175. It was followed by customer wellbeing (0.172) and working conditions (0.171). Based on the direction of impact, higher scores of these aspect categories mean better performance. Comparatively, the better score of the labor rights aspect category could be attributed mainly to the better performance of the case company with respect to fair salary, equal opportunity and freedom of association. In comparison, the working conditions aspect category showed lower performance which was based on decent working hours and decent workload. Grounded on these findings, the case company might increase its sustainability performance by putting more efforts and resources to improve the situations of decent working hours and decent workload. Overall, no aspect category scored 0.2 or higher and this showed that various opportunities exist for improvement. In the same way, the results of the stochastic models could also be analyzed.
For dimension level analysis, both scores pertaining to the social dimension (quantitative indicators with 0.16 and qualitative indicators with 0.518) were added, just for comparison purposes. At the dimension level, as discussed earlier, a lower score of the environmental and economic dimensions, and a higher score of the social dimension represent better performance. From the results, comparatively, the social dimension with a score of 0.678 (by adding 0.16 and 0.518) was performing better. Between the economic and environmental dimensions, the former showed relatively better performance (0.43) than the latter (0.77). The poorer score of the environmental dimension might be attributed to the considerable amount of air emissions and polluted wastewater coming out from the case company. With respect to the economic dimension, the profit based indicators have better scores than the cost related indicators.
The total TBL sustainability index (0.42) marked the case company’s performance as average. Nevertheless, the company’s performance was still far from the ideal sustainability level. In other words, there were various challenges to cope with and different opportunities to improve its sustainability performance. For example, the performance could be improved by focusing more on the low performing sustainability areas.
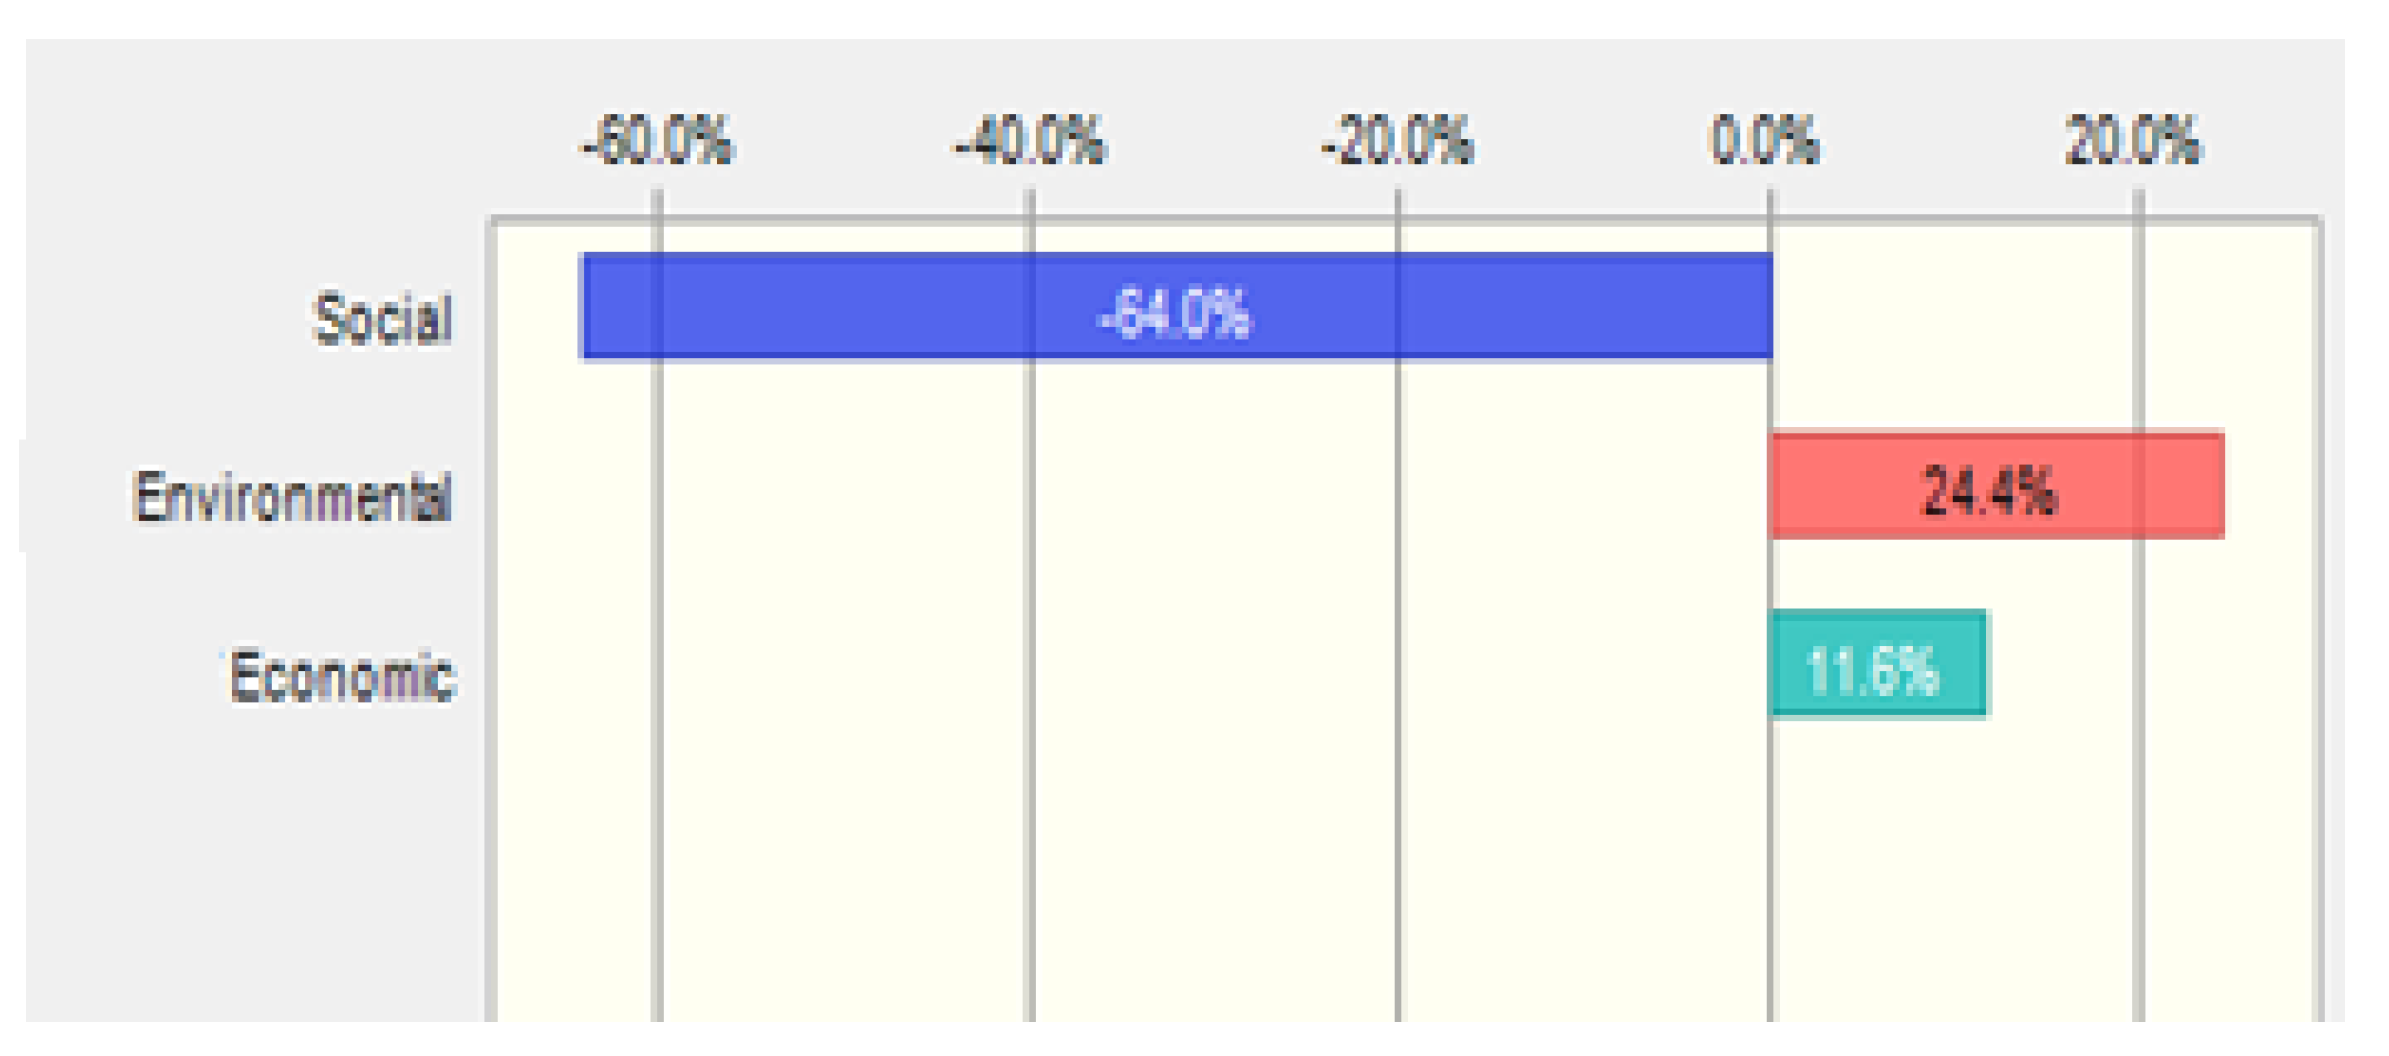
In addition, reducing uncertainties in the input variables is desirable for effective sustainability assessment. Theoretically, less uncertainties lead to more reliable probabilistic estimates. However, generally reducing uncertainty in any input variable will not necessarily result in the same magnitude of refinement in the output [81]. An analysis was presented to show how much each sustainability dimension contributed to the uncertainty or variability of the output using the Crystal Ball software.
The results of the analysis (Figure 5) showed that the social dimension contributed more to the output variance for the case company. It was followed by the environmental and economic dimensions of sustainability. In this way, the overall variability can be better and effectively reduced by focusing more efforts on the social dimension of sustainability.

6. Validation

Validation was performed to check the robustness of the developed method. In order to achieve this, instead of performing Monte Carlo simulation at each indicator level, it was done directly at each dimension level. In this regard, a cumulative distribution was calculated for each dimension before conducting the simulation. The cumulative distribution of each dimension was aggregated from the individual triangular distributions of the indicators in the respective dimension. The simulation was run 1000 times for each of the dimensions and the validation results were compared with the previous results. Figure 6 presents the dimension level simulation outputs.

Validation Results and Discussion

The new scores calculated for each dimension after conducting the simulation in a different way (simulation at the dimension level) are presented in Table 14. The analysis showed that there was only a difference of 0.01 in the environmental and economic performances, when the results in Table 12 and Table 14 were compared. However, there was no difference in the performance of the social dimension. Overall, there was a difference of 0.01 in the total TBL sustainability index. These findings showed an insignificant difference and confirmed the robustness and reliability of the proposed method for sustainability assessment.

7. Implications

This novel research has various important implications. Firstly, it discussed the development and demonstration of a comprehensive and integrated sustainability assessment method. This new method integrates stochastic and fuzzy approaches in order to deal with uncertainties in a comprehensive way. This integration, which was overlooked in previous methods, has made sustainability assessment more precise and realistic. The proposed method is equally useful for practitioners as well as researchers. Practically, the method has been demonstrated and tested via a case study in the Malaysian food manufacturing industry. Practitioners could employ this method to evaluate and track their company’s sustainability level and performance over time. Researchers could also use it to assess and compare the sustainability performance of food manufacturing activities.
In addition, keeping in view the constraints of resources, some companies are involved in the assessment of only one dimension of sustainability (for example, environmental). This method could also be used individually if separate assessment of one dimension is required. However, at a later stage, such companies might apply all the dimensions in order to have a comprehensive performance evaluation.
Last but not least, this study has shown the important utilization of Monte Carlo simulation and fuzzy logic for sustainability assessment purposes. It could guide researchers on how these two approaches are utilized and integrated to produce useful and reliable assessment results.

8. Conclusions

Current sustainability assessment studies face various challenges. The problems are related to the usage of an applicable, weighted and comprehensive set of sustainability indicators, analysis and quantification of stochastic and fuzzy uncertainties simultaneously, inclusion of the TBL concept of sustainability, assessment of sustainability in developing countries where limited databases and resources are available, etc. There is a need for the development of a new sustainability assessment method that can overcome the deficiencies of previous approaches. Thus, the main objective of this article was to develop and test a comprehensive and integrated stochastic-fuzzy sustainability assessment method. In this regard, Monte Carlo simulation and fuzzy logic were used in an integrated way to address the stochastic and fuzzy uncertainties. The proposed method combined the benefits of Monte Carlo simulation with the advantages of fuzzy inference.
Based on the weighted and comprehensive nature of its indicators, this method helps to provide more reliable and precise results. A real-world case study dealing with sustainability assessment of a Malaysian food manufacturing company was conducted to test the applicability and functionality of the proposed method. The case company showed an average sustainability performance with a total TBL based sustainability index of 0.42. The results revealed that, along with other measures, the sustainability performance of the case company might be improved more effectively by decreasing the amount of air emissions, polluted wastewater, etc., and improving the working conditions. In essence, the results showed that the developed method is useful for evaluating sustainability performance in terms of a total sustainability index within a system containing complicated uncertainties.
Apart from its advantages, this research had its own limitations. Firstly, only one case study was reported in this research. More studies in the future will confirm the usability of the developed method. Secondly, the case study was based on a gate-to-gate system boundary for assessment purposes. Future work could assess the sustainability level of food manufacturing activities by covering the supply chain stages or increasing the assessment boundary.
Author Contributions

Overall, all authors contributed to writing, revising and approving the final manuscript.

Funding

This research was partly funded by the National University of Sciences and Technology (NUST), Islamabad, Pakistan.

Acknowledgments

The authors are indebted and thankful to the case company for sharing its data and participating in this study. The authors are also grateful to the Ministry of Higher Education (MOHE) and Universiti Teknologi Malaysia (UTM) (Vote Number: 4F840) for supporting this research.

Conflicts of Interest

The authors declare no conflict of interest.

References

  1. Linke, B.S.; Corman, G.J.; Dornfeld, D.A.; Tönissen, S. Sustainability indicators for discrete manufacturing processes applied to grinding technology. J. Manuf. Syst. 2013, 32, 556–563. [Google Scholar] [CrossRef] [Green Version]
  2. Kishawy, H.; Hegab, H.; Saad, E. Design for Sustainable Manufacturing: Approach, Implementation, and Assessment. Sustainability 2018, 10, 3604. [Google Scholar] [CrossRef]
  3. Egilmez, G.; Kucukvar, M.; Tatari, O. Sustainability assessment of US manufacturing sectors: An economic input output-based frontier approach. J. Clean. Prod. 2013, 53, 91–102. [Google Scholar] [CrossRef]
  4. Sellahewa, J.; Martindale, W. The impact of food processing on the sustainability of the food supply chain. In Delivering Food Security with Supply Chain Led Innovations: Understanding Supply Chains, Providing Food Security, Delivering Choice; Martindale, W., Ed.; Association of Applied Biologists: Egham, UK, 2010; pp. 91–97. [Google Scholar]
  5. Tilman, D.; Clark, M. Global diets link environmental sustainability and human health. Nature 2014, 515, 518–522. [Google Scholar] [CrossRef] [PubMed]
  6. Solazzo, R.; Donati, M.; Tomasi, L.; Arfini, F. How effective is greening policy in reducing GHG emissions from agriculture? Evidence from Italy. Sci. Total Environ. 2016, 573, 1115–1124. [Google Scholar] [CrossRef] [PubMed]
  7. Moss, B. Water pollution by agriculture. Philos. Trans. R. Soc. B Biol. Sci. 2008, 363, 659–666. [Google Scholar] [CrossRef] [PubMed] [Green Version]
  8. Recanati, F.; Marveggio, D.; Dotelli, G. From beans to bar: A life cycle assessment towards sustainable chocolate supply chain. Sci. Total Environ. 2018, 613–614, 1013–1023. [Google Scholar] [CrossRef] [PubMed]
  9. Liguori, R.; Amore, A.; Faraco, V. Waste valorization by biotechnological conversion into added value products. Appl. Microbiol. Biotechnol. 2013, 97, 6129–6147. [Google Scholar] [CrossRef]
  10. Monteiro, C.A.; Levy, R.B.; Claro, R.M.; de Castro, I.R.R.; Cannon, G. Increasing consumption of ultra-processed foods and likely impact on human health: Evidence from Brazil. Public Health Nutr. 2010, 14, 5–13. [Google Scholar] [CrossRef]
  11. Jayal, A.; Badurdeen, F.; Dillon, O.; Jawahir, I. Sustainable manufacturing: Modeling and optimization challenges at the product, process and system levels. CIRP J. Manuf. Sci. Technol. 2010, 2, 144–152. [Google Scholar] [CrossRef]
  12. Rosen, M.A.; Kishawy, H.A. Sustainable manufacturing and design: Concepts, practices and needs. Sustainability 2012, 4, 154–174. [Google Scholar] [CrossRef]
  13. Van Passel, S. Food miles to assess sustainability: A revision. Sustain. Dev. 2013, 21, 1–17. [Google Scholar] [CrossRef]
  14. Hosseinpour, A.; Peng, Q.; Gu, P. A benchmark-based method for sustainable product design. Benchmark. Int. J. 2015, 22, 643–664. [Google Scholar] [CrossRef]
  15. Ahmad, S.; Wong, K.Y. Sustainability assessment in the manufacturing industry: A review of recent studies. Benchmark. Int. J. 2018, 26, 3162–3179. [Google Scholar] [CrossRef]
  16. Hermann, B.; Kroeze, C.; Jawjit, W. Assessing environmental performance by combining life cycle assessment, multi-criteria analysis and environmental performance indicators. J. Clean. Prod. 2007, 15, 1787–1796. [Google Scholar] [CrossRef] [Green Version]
  17. Seuring, S.; Müller, M. From a literature review to a conceptual framework for sustainable supply chain management. J. Clean. Prod. 2008, 16, 1699–1710. [Google Scholar] [CrossRef]
  18. Vinodh, S.; Jayakrishna, K.; Joy, D. Environmental impact assessment of an automotive component using eco-indicator and CML methodologies. Clean Technol. Environ. Policy 2012, 14, 333–344. [Google Scholar] [CrossRef]
  19. Mohanty, R.; Prakash, A. Green supply chain management practices in India: A confirmatory empirical study. Prod. Manuf. Res. 2014, 2, 438–456. [Google Scholar] [CrossRef]
  20. Hacking, T.; Guthrie, P. A framework for clarifying the meaning of Triple Bottom-Line, Integrated, and Sustainability Assessment. Environ. Impact Assess. Rev. 2008, 28, 73–89. [Google Scholar] [CrossRef]
  21. Hall, T.J. The triple bottom line: What is it and how does it work? Indiana Bus. Rev. 2011, 86, 4–8. [Google Scholar]
  22. Mogensen, L.; Hermansen, J.E.; Halberg, N.; Dalgaard, R.; Vis, J.; Smith, B.G. Life cycle assessment across the food supply chain. In Sustainability in the Food Industry; Baldwin, C.J., Ed.; John Wiley & Sons: Hoboken, NJ, USA, 2009; pp. 115–144. [Google Scholar]
  23. De Vries, M.; de Boer, I.J. Comparing environmental impacts for livestock products: A review of life cycle assessments. Livest. Sci. 2010, 128, 1–11. [Google Scholar] [CrossRef]
  24. Cerutti, A.K.; Beccaro, G.L.; Bruun, S.; Bosco, S.; Donno, D.; Notarnicola, B.; Bounous, G. Life cycle assessment application in the fruit sector: State of the art and recommendations for environmental declarations of fruit products. J. Clean. Prod. 2014, 73, 125–135. [Google Scholar] [CrossRef]
  25. Ali, B.M.; van Zanten, H.H.; Berentsen, P.; Bastiaansen, J.W.; Bikker, P.; Lansink, A.O. Environmental and economic impacts of using co-products in the diets of finishing pigs in Brazil. J. Clean. Prod. 2017, 162, 247–259. [Google Scholar] [CrossRef]
  26. Scerri, A.; James, P. Accounting for sustainability: Combining qualitative and quantitative research in developing ‘indicators’ of sustainability. Int. J. Soc. Res. Methodol. 2010, 13, 41–53. [Google Scholar] [CrossRef]
  27. Chen, W.; Holden, N.M. Social life cycle assessment of average Irish dairy farm. Int. J. Life Cycle Assess. 2017, 22, 1459–1472. [Google Scholar] [CrossRef]
  28. Quyên, Đ.T.N. Developing university governance indicators and their weighting system using a modified Delphi method. Procedia-Soc. Behav. Sci. 2014, 141, 828–833. [Google Scholar] [CrossRef]
  29. Hsu, C.-H.; Chang, A.-Y.; Luo, W. Identifying key performance factors for sustainability development of SMEs–integrating QFD and fuzzy MADM methods. J. Clean. Prod. 2017, 161, 629–645. [Google Scholar] [CrossRef]
  30. Hegab, H.; Darras, B.; Kishawy, H. Towards sustainability assessment of machining processes. J. Clean. Prod. 2018, 170, 694–703. [Google Scholar] [CrossRef]
  31. Böhringer, C.; Jochem, P.E. Measuring the immeasurable—A survey of sustainability indices. Ecol. Econ. 2007, 63, 1–8. [Google Scholar] [CrossRef]
  32. Zhang, X.; Lu, T.; Shuaib, M.; Rotella, G.; Huang, A.; Feng, S.; Rouch, K.; Badurdeen, F.; Jawahir, I. A metrics-based methodology for establishing product sustainability index (ProdSI) for manufactured products. In Leveraging Technology for a Sustainable World; Linke, B.S., Ed.; Springer: Berlin/Heidelberg, Germany, 2012; pp. 435–441. [Google Scholar]
  33. Zhang, H.; Haapala, K.R. Integrating sustainable manufacturing assessment into decision making for a production work cell. J. Clean. Prod. 2015, 105, 52–63. [Google Scholar] [CrossRef]
  34. Ocampo, L.A.; Clark, E.E.; Promentilla, M.A.B. Computing sustainable manufacturing index with fuzzy analytic hierarchy process. Int. J. Sustain. Eng. 2016, 9, 305–314. [Google Scholar] [CrossRef]
  35. Wang, J.; Wang, Y.; Sun, Y.; Tingley, D.D.; Zhang, Y. Life cycle sustainability assessment of fly ash concrete structures. Renew. Sustain. Energy Rev. 2017, 80, 1162–1174. [Google Scholar] [CrossRef]
  36. Darmawan, M.A.; Widhiarti, R.P.; Teniwut, Y.K. Green productivity improvement and sustainability assessment of the motorcycle tire production process: A case study. J. Clean. Prod. 2018, 191, 273–282. [Google Scholar]
  37. UNEP/SETAC. Towards a Life Cycle Sustainability Assessment—Making Informed Choices on Products; United Nations Environment Programme (UNEP)–Society of Environmental Toxicology and Chemistry (SETAC) Life Cycle Initiative: Paris, France, 2011. [Google Scholar]
  38. Valdivia, S.; Ugaya, C.M.; Hildenbrand, J.; Traverso, M.; Mazijn, B.; Sonnemann, G. A UNEP/SETAC approach towards a life cycle sustainability assessment—Our contribution to Rio+ 20. Int. J. Life Cycle Assess. 2013, 18, 1673–1685. [Google Scholar] [CrossRef]
  39. Hasnan, N.N.; Aziz, N.A.; Zulkifli, N.; Taip, F.S. Food factory design: Reality and challenges faced by Malaysian SMEs. Agric. Agric. Sci. Procedia 2014, 2, 328–336. [Google Scholar] [CrossRef]
  40. Ahmad, S.; Wong, K.Y.; Elahi, H. Sustainability Assessment and Analysis of Malaysian Food Manufacturing Sector—A Move Towards Sustainable Development. Adv. Sci. Lett. 2017, 23, 8942–8946. [Google Scholar] [CrossRef]
  41. Pope, J.; Annandale, D.; Morrison-Saunders, A. Conceptualising sustainability assessment. Environ. Impact Assess. Rev. 2004, 24, 595–616. [Google Scholar] [CrossRef] [Green Version]
  42. Bond, A.J.; Morrison-Saunders, A. Re-evaluating sustainability assessment: Aligning the vision and the practice. Environ. Impact Assess. Rev. 2011, 31, 1–7. [Google Scholar] [CrossRef]
  43. Singh, R.K.; Murty, H.R.; Gupta, S.K.; Dikshit, A. An overview of sustainability assessment methodologies. Ecol. Indic. 2012, 15, 281–299. [Google Scholar] [CrossRef]
  44. Nzila, C.; Dewulf, J.; Spanjers, H.; Tuigong, D.; Kiriamiti, H.; Van Langenhove, H. Multi criteria sustainability assessment of biogas production in Kenya. Appl. Energy 2012, 93, 496–506. [Google Scholar] [CrossRef]
  45. Vinodh, S.; Jayakrishna, K.; Kumar, V.; Dutta, R. Development of decision support system for sustainability evaluation: A case study. Clean Technol. Environ. Policy 2014, 16, 163–174. [Google Scholar] [CrossRef]
  46. Verheem, R.; Tonk, J. Strategic environmental assessment: One concept, multiple forms. Impact Assess. Proj. Apprais. 2000, 18, 177–182. [Google Scholar] [CrossRef]
  47. Waas, T.; Hugé, J.; Block, T.; Wright, T.; Benitez-Capistros, F.; Verbruggen, A. Sustainability assessment and indicators: Tools in a decision-making strategy for sustainable development. Sustainability 2014, 6, 5512–5534. [Google Scholar] [CrossRef]
  48. Ahmad, S.; Wong, K.Y.; Rajoo, S. Sustainability indicators for manufacturing sectors: A literature survey and maturity analysis from the triple-bottom line perspective. J. Manuf. Technol. Manag. 2018. [Google Scholar] [CrossRef]
  49. Bond, A.; Morrison-Saunders, A. Challenges in determining the effectiveness of sustainability assessment. In Sustainability Assessment: Pluralism, Practice and Progress (Natural and Built Environment Series); Bond, A., Morrison-Saunders, A., Howitt, R., Eds.; Routledge, Taylor & Francis Group: London, UK, 2013; pp. 37–50. [Google Scholar]
  50. Vimal, K.; Vinodh, S.; Muralidharan, R. An approach for evaluation of process sustainability using multi-grade fuzzy method. Int. J. Sustain. Eng. 2015, 8, 40–54. [Google Scholar] [CrossRef]
  51. Ahi, P.; Searcy, C. Assessing sustainability in the supply chain: A triple bottom line approach. Appl. Math. Model. 2015, 39, 2882–2896. [Google Scholar] [CrossRef]
  52. Rubinstein, R.Y.; Kroese, D.P. Simulation and the Monte Carlo Method; John Wiley & Sons: New York, NY, USA, 2007. [Google Scholar]
  53. Ping, J.; Chen, B.; Husain, T. Risk assessment of ambient air quality by stochastic-based fuzzy approaches. Environ. Eng. Sci. 2010, 27, 233–246. [Google Scholar] [CrossRef]
  54. Subagadis, Y.H.; Schütze, N.; Grundmann, J. A fuzzy-stochastic modeling approach for multiple criteria decision analysis of coupled groundwater-agricultural systems. Water Resour. Manag. 2016, 30, 2075–2095. [Google Scholar] [CrossRef]
  55. Hsu, T.-H.; Pan, F.F. Application of Monte Carlo AHP in ranking dental quality attributes. Expert Syst. Appl. 2009, 36, 2310–2316. [Google Scholar] [CrossRef]
  56. Wang, N.; Chang, Y.-C.; El-Sheikh, A.A. Monte Carlo simulation approach to life cycle cost management. Struct. Infrastruct. Eng. 2012, 8, 739–746. [Google Scholar] [CrossRef]
  57. Robert, C.; Casella, G. Monte Carlo Statistical Methods; Springer Science & Business Media: London, UK, 2013. [Google Scholar]
  58. Aguado, S.; Pérez, P.; Albajez, J.; Velázquez, J.; Santolaria, J. Monte Carlo method to machine tool uncertainty evaluation. Procedia Manuf. 2017, 13, 585–592. [Google Scholar] [CrossRef]
  59. Ocampo-Duque, W.; Osorio, C.; Piamba, C.; Schuhmacher, M.; Domingo, J.L. Water quality analysis in rivers with non-parametric probability distributions and fuzzy inference systems: Application to the Cauca River, Colombia. Environ. Int. 2013, 52, 17–28. [Google Scholar] [CrossRef] [PubMed]
  60. Yang, A.; Huang, G.; Qin, X. An integrated simulation-assessment approach for evaluating health risks of groundwater contamination under multiple uncertainties. Water Resour. Manag. 2010, 24, 3349–3369. [Google Scholar] [CrossRef]
  61. Kentel, E.; Aral, M. Probabilistic-fuzzy health risk modeling. Stoch. Environ. Res. Risk Assess. 2004, 18, 324–338. [Google Scholar] [CrossRef]
  62. McCleese, D.L.; LaPuma, P.T. Using Monte Carlo simulation in life cycle assessment for electric and internal combustion vehicles. Int. J. Life Cycle Assess. 2002, 7, 230–236. [Google Scholar] [CrossRef]
  63. Sonnemann, G.W.; Schuhmacher, M.; Castells, F. Uncertainty assessment by a Monte Carlo simulation in a life cycle inventory of electricity produced by a waste incinerator. J. Clean. Prod. 2003, 11, 279–292. [Google Scholar] [CrossRef]
  64. Dorini, G.; Kapelan, Z.; Azapagic, A. Managing uncertainty in multiple-criteria decision making related to sustainability assessment. Clean Technol. Environ. Policy 2011, 13, 133–139. [Google Scholar] [CrossRef]
  65. Phillis, Y.A.; Andriantiatsaholiniaina, L.A. Sustainability: An ill-defined concept and its assessment using fuzzy logic. Ecol. Econ. 2001, 37, 435–456. [Google Scholar] [CrossRef]
  66. Mahmood, S.; Hemdi, A.R.; Mat Saman, M.Z.; Mohd Yusof, N. Graphical user interface for assessing sustainability by using fuzzy logic: A case study on hollow fiber membrane module. J. Teknol. (Sci. Eng.) 2015, 76, 207–220. [Google Scholar] [CrossRef]
  67. Ghadimi, P.; Azadnia, A.H.; Yusof, N.M.; Saman, M.Z.M. A weighted fuzzy approach for product sustainability assessment: A case study in automotive industry. J. Clean. Prod. 2012, 33, 10–21. [Google Scholar] [CrossRef]
  68. Wu, F.-C.; Tsang, Y.-P. Second-order Monte Carlo uncertainty/variability analysis using correlated model parameters: Application to salmonid embryo survival risk assessment. Ecol. Model. 2004, 177, 393–414. [Google Scholar] [CrossRef]
  69. Verbeeck, H.; Samson, R.; Verdonck, F.; Lemeur, R. Parameter sensitivity and uncertainty of the forest carbon flux model FORUG: A Monte Carlo analysis. Tree Physiol. 2006, 26, 807–817. [Google Scholar] [CrossRef] [PubMed]
  70. Suiran, Y.; Jing, T. Economic, energy and environmental evaluation of biomass-based fuel ethanol projects based on life cycle assessment and simulations. Appl. Energy 2009, 86, S178–S188. [Google Scholar]
  71. Behrouzi, F.; Wong, K.Y. An integrated stochastic-fuzzy modeling approach for supply chain leanness evaluation. Int. J. Adv. Manuf. Technol. 2013, 68, 1677–1696. [Google Scholar] [CrossRef]
  72. Abele, E.; Anderl, R.; Birkhofer, H. Environmentally-Friendly Product Development: Methods and Tools; Springer: Berlin/Heidelberg, Germany, 2005. [Google Scholar]
  73. Cornelissen, A.; van den Berg, J.; Koops, W.; Grossman, M.; Udo, H. Assessment of the contribution of sustainability indicators to sustainable development: A novel approach using fuzzy set theory. Agric. Ecosyst. Environ. 2001, 86, 173–185. [Google Scholar] [CrossRef]
  74. Hamam, A.; Georganas, N.D. A comparison of Mamdani and Sugeno fuzzy inference systems for evaluating the quality of experience of Hapto-Audio-Visual applications. In Proceedings of the IEEE International Workshop on Haptic Audio visual Environments and Games Proceedings, Ottawa, ON, Canada, 18–19 October 2008; pp. 87–92. [Google Scholar]
  75. Wang, Y.; Chen, Y. A comparison of Mamdani and Sugeno fuzzy inference systems for traffic flow prediction. J. Comput. 2014, 9, 12–21. [Google Scholar] [CrossRef]
  76. Scharf, E. The application of a fuzzy controller to the control of a multi-degree-freedom robot arm. In Industrial Applications of Fuzzy Control; North-Holland: Amsterdam, The Netherlands, 1985. [Google Scholar]
  77. Mogharreban, N.; Dilalla, L. Comparison of defuzzification techniques for analysis of non-interval data. In Proceedings of the Annual Conference of the North American Fuzzy Information Processing Society—NAFIPS, Montreal, QC, Canada, 3–6 June 2006; pp. 257–260. [Google Scholar]
  78. Ahmad, S. Development of Weighted Triple-Bottom Line Sustainability Indicators for the Malaysian Food Manufacturing Industry Using the Delphi Method; Research Report; Universiti Teknologi Malaysia: Skudai, Malaysia, 2018. [Google Scholar]
  79. Pask, F.; Lake, P.; Yang, A.; Tokos, H.; Sadhukhan, J. Sustainability indicators for industrial ovens and assessment using Fuzzy set theory and Monte Carlo simulation. J. Clean. Prod. 2017, 140, 1217–1225. [Google Scholar] [CrossRef]
  80. Chen, S.-H.; Hsieh, C.H. Graded mean representation of generalized fuzzy numbers. J. Chin. Fuzzy Syst. Assoc. 1999, 5, 1–7. [Google Scholar]
  81. Schuhmacher, M.; Meneses, M.; Xifró, A.; Domingo, J.L. The use of Monte-Carlo simulation techniques for risk assessment: Study of a municipal waste incinerator. Chemosphere 2001, 43, 787–799. [Google Scholar] [CrossRef]
Figure 1. Flow chart of the proposed integrated stochastic-fuzzy sustainability assessment method.
Sustainability 11 00948 g001
Figure 2. Fuzzy modeling and assessment (a) Fuzzy Interference System (FIS) model in Matlab; (b) Membership functions of input variable; (c) Membership functions of output variable; (d) Rule-based evaluation.
Sustainability 11 00948 g002
Figure 3. Simulation outputs (based on indicator level) (a) Simulated environmental performance; (b) Distribution fitting of performance outputs.
Sustainability 11 00948 g003
Figure 4. Aspect category performance based on qualitative indicators.
Sustainability 11 00948 g004
Figure 5. Contribution of each dimension to uncertainty.
Sustainability 11 00948 g005
Figure 6. Simulation outputs (based on dimension level): (a) simulated environmental performance; (b) distribution fitting of performance outputs.
Sustainability 11 00948 g006
Table 1. Fuzzy membership grades for input variables.
NumberMembership GradesDescription
10.0 0.0 0.5Low
20.0 0.5 1.0Medium
30.5 1.0 1.0High
Table 2. Fuzzy membership grades for output variables.
NumberMembership GradesDescription
10.00.00.25Very poor
20.00.250.50Poor
30.250.500.75Average
40.500.751.0Good
50.751.01.0Very good
Table 3. Fuzzy membership grades for environmental and economic dimensions.
NumberMembership GradesDescription
10.0 0.0 0.5High
20.0 0.5 1.0Medium
30.5 1.0 1.0Low
Table 4. Overall triple-bottom line (TBL) based sustainability performance levels.
NumberIndex RangeDescription
10.0–0.19Very poor
20.2–0.39Poor
30.4–0.59Average
40.6–0.79Good
50.8–1.00Very good
Table 5. Linguistic variables and their values for qualitative indicators.
NumberLinguistic VariableMeasuring Scale
1Very low (VL)1
2Low (L)2
3Medium (M)3
4High (H)4
5Very high (VH)5
Table 6. Environmental inventory data.
Aspect CategoryIndicatorsMeasuring UnitsIndicators’ ID±Indicators’ Scores C n + C n Normalized ScoresIndicators’ WeightsNormalized Weighted Scores
Min.Most LikelyMax.Min.Most LikelyMax.Min.Most LikelyMax.
Material usedRaw materialsgEnv-1101010151020n/a10100.9900.99510.06200.06140.06170.0620
Primary packaging materials (cans, containers, bottles, etc.)gEnv-2456n/a40.6670.810.05710.03810.04570.0571
Secondary packaging materials (cardboards, boxes, etc.)gEnv-3252830n/a250.8330.89310.05710.04760.05100.0571
Biodegradable packaging materialsgEnv-4+10142020n/a0.50.710.04410.02200.03080.0441
Energy usedFuel (diesel, petrol, etc.)LEnv-5000n/a00000.0522000
Natural gasKgEnv-60.80.850.9n/a0.80.8890.94110.04410.03920.04150.0441
ElectricitykWhEnv-70.040.0430.048n/a0.040.8330.93010.06360.05300.05920.0636
Water usedWater (used in processes)LEnv-80.20.30.5n/a0.20.40.66710.05870.02350.03920.0587
Water (used in products)LEnv-90.10.120.14n/a0.10.7140.83310.04410.03150.03670.0441
Chemical usedCleaning and washing chemicals (sodium hypochlorite, detergents, etc.)KgEnv-100.40.50.6n/a0.40.6670.810.05220.03480.04180.0522
Preservatives and conditioners (benzoates, emulsifiers, anti-foaming agents, etc.)KgEnv-1133.54n/a30.750.85710.05710.04280.04890.0571
Air emissionsCarbon dioxide (CO2)KgEnv-126.236.637n/a6.230.890.94010.05220.04650.04910.0522
Carbon monoxide (CO)KgEnv-130.00590.00630.0066n/a0.00590.8940.93710.04730.04230.04430.0473
Sulfur oxides (SOX)KgEnv-140.00590.00630.0066n/a0.00590.8940.93710.04410.03940.04130.0441
WastewaterChemical oxygen demand (COD)mg/LEnv-15155001650017353n/a15500.8930.93910.05060.04520.04750.0506
Biological oxygen demand (BOD)mg/LEnv-16170018502033n/a17000.8360.91910.04890.04090.04500.0489
Suspended solidmg/LEnv-17450048005030n/a45000.8950.937510.04890.04380.04590.0489
Solid wasteBiodegradable waste (food remains, cardboards, etc.)gEnv-18346n/a30.50.7510.05550.02770.04160.0555
Non-biodegradable waste (plastic, tin, etc.)gEnv-194.556.5n/a4.50.6920.910.06040.04180.05430.0604
Table 7. Economic inventory data.
Aspect CategoryIndicatorsMeasuring UnitsIndicators’ ID±Indicators’ Scores C n + C n Normalized ScoresIndicators’ WeightsNormalized Weighted Scores
Min.Most LikelyMax.Min.Most LikelyMax.Min.Most LikelyMax.
CostRaw materialsMYREco-1101111.5n/a100.8700.90910.08080.07020.07340.0808
Packaging materialsMYREco-20.210.230.26n/a0.210.8080.91310.07860.06350.07180.0786
Fixed assets (buildings, machines, equipment, etc.) depreciationMYREco-32.22.32.5n/a2.20.880.95710.05900.05200.05650.0590
LaborMYREco-422.22.3n/a20.86960.909110.07440.06470.06760.0744
MaintenanceMYREco-50.40.50.6n/a0.40.66670.810.07010.04680.05610.0701
Environmental fines (for pollutants, etc.)MYREco-6000n/a00000.0680000
Utility (water, electricity, etc.)MYREco-70.710.80.83n/a0.710.85540.887510.08080.06910.07170.0808
Defective productsMYREco-80.080.090.1n/a0.080.80.888910.06800.05440.06050.0680
Research and developmentMYREco-90.110.130.14n/a0.110.78570.846210.07650.06010.06470.0765
TrainingMYREco-100.0050.0060.007n/a0.0050.71430.833410.06110.04360.05090.0611
Advertisement and promotionMYREco-110.140.20.27n/a0.140.51850.710.06380.03310.04460.0638
ProfitRevenueMYREco-12+20.52121.521.5n/a0.95350.976710.07650.07300.07470.0765
ProfitMYREco-13+55.566n/a0.83330.916710.07650.06380.07010.0765
Subsidy or tax relief from governmentMYREco-14+0.110.130.140.14n/a0.78570.928610.06590.05180.06120.0659
MYR = Malaysian Ringgit.
Table 8. Social inventory data for quantitative indicators.
Aspect CategoryIndicatorsMeasuring UnitsIndicators’ ID±Indicators’ Scores C n + C n Normalized ScoresIndicators’ WeightsNormalized Weighted Scores
Min.Most LikelyMax.Min.Most LikelyMax.Min.Most LikelyMax.
Labor wellbeingTraining and developmentNumber of workers given trainingsSoc-S-1+4555n/a0.8110.04650.03720.04650.0465
Occupational health and safety (OHS)Number of workers involved in OHS related incidentsSoc-S-2123n/a10.3330.510.04400.01460.02200.0440
Health insuranceNumber of workers having insurance provided by the companySoc-S-3+4555n/a0.8110.03640.02920.03640.0364
Reward and appreciationNumber of workers given reward and appreciationSoc-S-4+4555n/a0.8110.04310.03450.04310.0431
Labor satisfactionTurnoverNumber of workersSoc-S-5112n/a10.5110.04610.02300.04610.0461
AbsenteeismNumber of working daysSoc-S-6112n/a10.5110.04270.02140.04270.0427
Customer satisfactionCustomer complaintsNumber of complaintsSoc-S-7123n/a10.3330.510.03520.01170.01760.0352
Regular customersNumber of customersSoc-S-8+13152222n/a0.5910.68210.03770.02230.02570.0377
Community and society wellbeingEfforts against corruptionNumber of programs organizedSoc-S-9+0111n/a0110.037700.03770.0377
Efforts to reduce health, safety and environmental hazardsNumber of programs organizedSoc-S-10+0111n/a0110.047700.04770.0477
Efforts to promote religious and ethnic harmonyNumber of programs organizedSoc-S-11+0111n/a0110.039000.03900.0390
Local employmentNumber of workersSoc-S-12+4555n/a0.8110.04270.03420.04270.0427
Engagement with community (knowledge transfer programs, product development programs, etc.)Number of programs organizedSoc-S-13+1133n/a0.3330.33310.04650.01550.01550.0465
Community and society satisfactionCommunity complaintsNumber of complaintsSoc-S-14112n/a10.5110.03640.01820.03640.0364
Community complimentsNumber of complimentsSoc-S-15+2355n/a0.40.610.03300.01320.01980.0330
Table 9. Social inventory data for qualitative indicators.
Aspect CategoryIndicatorsMeasuring UnitsIndicators’ ID±Indicators’ Scores C n + C n Normalized ScoresIndicators’ WeightsNormalized Weighted ScoresSingle Value
Min.Most LikelyMax.Min.Most LikelyMax.Min.Most LikelyMax.
Labor rightsFair salaryVL to VHSoc-F-1+3444n/a0.75110.04520.03390.04520.04520.0433
Equal opportunity or non-discriminationVL to VHSoc-F-2+3444n/a0.75110.04400.03300.04400.04400.0421
Freedom of associationVL to VHSoc-F-3+3444n/a0.75110.03770.02830.03770.03770.0361
Working conditionsDecent working hours (compliance with regulations)VL to VHSoc-F-4+2344n/a0.50.7510.04650.02320.03490.04650.0349
Decent workload (compliance with regulations)VL to VHSoc-F-5+2444n/a0.5110.04400.02200.04400.04400.0403
Customer wellbeingHalal foodVL to VHSoc-F-6+3555n/a0.6110.04240.02540.04240.04240.0396
Safe foodVL to VHSoc-F-7+3555n/a0.6110.04400.02640.04400.04400.0410
Fat/sugar/salt free or organic food optionsVL to VHSoc-F-8+2333n/a0.667110.03640.02430.03640.03640.0344
Labeling (sources, calories, nutrients, ingredients, instructions, etc.)VL to VHSoc-F-9+3444n/a0.75110.04520.03390.04520.04520.0433
VL to VH = Very Low to Very High; n/a = not applicable.
Table 10. Examples of rules for the fuzzy models.
Rules
If (Fair salary is low) and (Equal opportunity or non-discrimination is low) and (Freedom of association is low) then (Labor rights are very poor)
If (Fair salary is low) and (Equal opportunity or non-discrimination is low) and (Freedom of association is medium) then (Labor rights are poor)
If (Fair salary is low) and (Equal opportunity or non-discrimination is medium) and (Freedom of association is high) then (Labor rights are average)
If (Decent working hours are low) and (Decent workload is high) then (Working conditions are average)
If (Decent working hours are medium) and (Decent workload is high) then (Working conditions are good)
If (Decent working hours are high) and (Decent workload is high) then (Working conditions are very good)
If (Halal food is low) and (Safe food is low) and (Fat/sugar/salt free or organic food options are medium) and (Labeling is medium) then (Customer wellbeing is poor)
If (Halal food is low) and (Safe food is low) and (Fat/sugar/salt free or organic food options are high) and (Labeling is high) then (Customer wellbeing is average)
If (Halal food is low) and (Safe food is high) and (Fat/sugar/salt free or organic food options are high) and (Labeling is medium) then (Customer wellbeing is good)
Table 11. Aspect category performance based on FISs.
NumberAspect CategoryScore
1Labor rights0.175
2Working conditions0.171
3Customer wellbeing0.172
Table 12. Dimension level performance based on Monte Carlo simulation.
NumberSustainability dimensionScore
1Environmental0.77
2Economic0.43
3Social0.16
Table 13. Total TBL based sustainability index.
Sub-System Name.Modeling ApproachModel NameModel ScoreSub-System Level ScoreWeightTotal TBL Sustainability Index
Qualitative indicators based sub-systemFuzzy logic
(three models)
Labor rights0.1750.5180.1630.42
Working conditions0.171
Customer wellbeing0.172
Quantitative indicators based sub-systemMonte Carlo simulation
(three models)
Environmental0.770.4040.837
Economic0.43
Social0.16
Table 14. Dimension level performance based on the validation approach.
NumberSustainability dimensionScore
1Environmental0.76
2Economic0.42
3Social0.16