1. Introduction
The sustainable development of mineral resources globally has become an important focus area of contemporary research. In Korea, not only have overseas resources been developed, but abandoned mines have been reopened, improvements have been made to the ore recovery of currently operational mines, and technology for the selective mining of high-grade ores has been developed. Mining advancement requires not only the development of technology to increase productivity and maximize efficiency in mining work, but also the effective safety management of mines to prevent mining damage and hazards, such as subsidence.
Stability evaluation methods that may be utilized include safety management of mines, rock mass classification, safety factor analysis using empirical methods, surveying methods utilizing sensors, and numerical analysis. With the recent advancement in optical technologies, three-dimensional (3D) surveying techniques, such as 3D laser scanning and stereo photogrammetry methods, have been introduced to the mining industry and utilized actively in studies on stability evaluation.
Light detection and ranging (LiDAR), a type of 3D laser scanner, is employed in surveying equipment that emits light and measures the reflecting and returning light. LiDAR, as 3D point cloud data can be easily acquired, has been utilized rapidly and widely in various sectors, including civil engineering, construction, aviation, archeology, geology, and the game and movie industries. In the rock engineering field, LiDAR has been employed for studies on the evaluation of joint roughness [
1,
2,
3,
4], trace sampling of joints [
5,
6,
7], analysis of joint orientation [
8], analysis of slope stability [
9,
10], analysis of rockfall and toppling [
11,
12], analysis of blasting over-break [
13,
14], and geometry research of underground mines [
15]. The utilization of LiDAR is expected to increase in the future in study fields that require quantitative analysis.
In this study, surveying was conducted using LiDAR to evaluate the stability of the safety pillar and stope in a mine where the hybrid room-and-pillar mining method was used, and the results were utilized directly to perform 3D stability analysis.
2. Overview of the Field
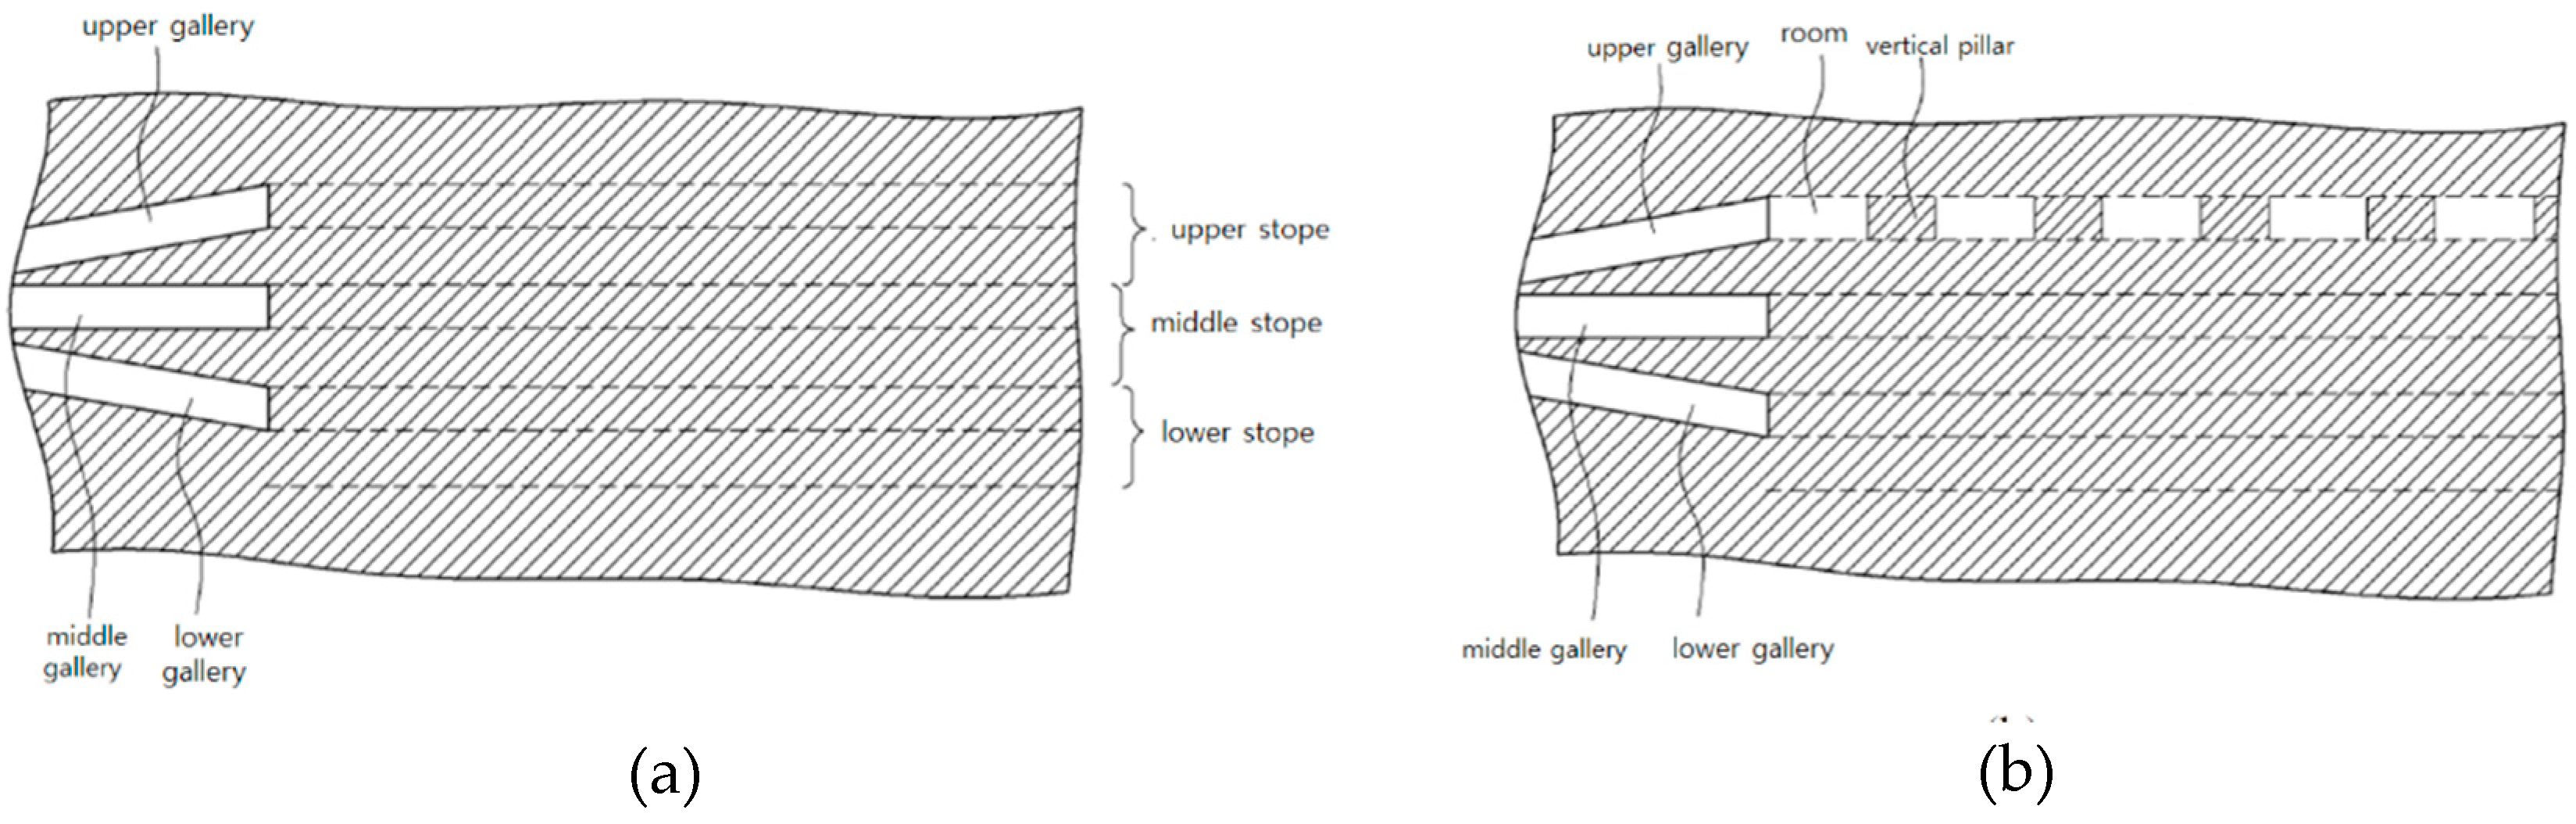
The target mine in this study, the Daesung MDI Donghae limestone mine, is located at Donghae-si, Gangwon-do, South Korea. Here, a test section of a horizontal cross-section (50 m × 50 m) around the Lv540 stope was excavated and mining work was conducted using the hybrid room-and-pillar mining method. This method is used to maximize ore recovery by collecting ores while ensuring the stability of stope using horizontal and vertical safety pillars. As shown in
Figure 1, this mining method consists of a number of distinct steps: a step for gallery excavation (
Figure 1a), a step for opening the upper stope (
Figure 1b), a step for opening a middle stope (
Figure 1c), a step for an additional opening for the upper stope (
Figure 1d), a step for opening the lower stope (
Figure 1e), and a step for an additional opening for the lower stope (
Figure 1f). The mining method applies the opening order while considering the stability of the pillar, according to the field circumstances. To ensure the stability of a large vertical safety pillar and stope during mining work, the ores have to be recovered safely from the horizontal safety pillar. In order to do this, it is important that the center axis and the volume of the vertical safety pillar in the lower parts match those in the upper parts.
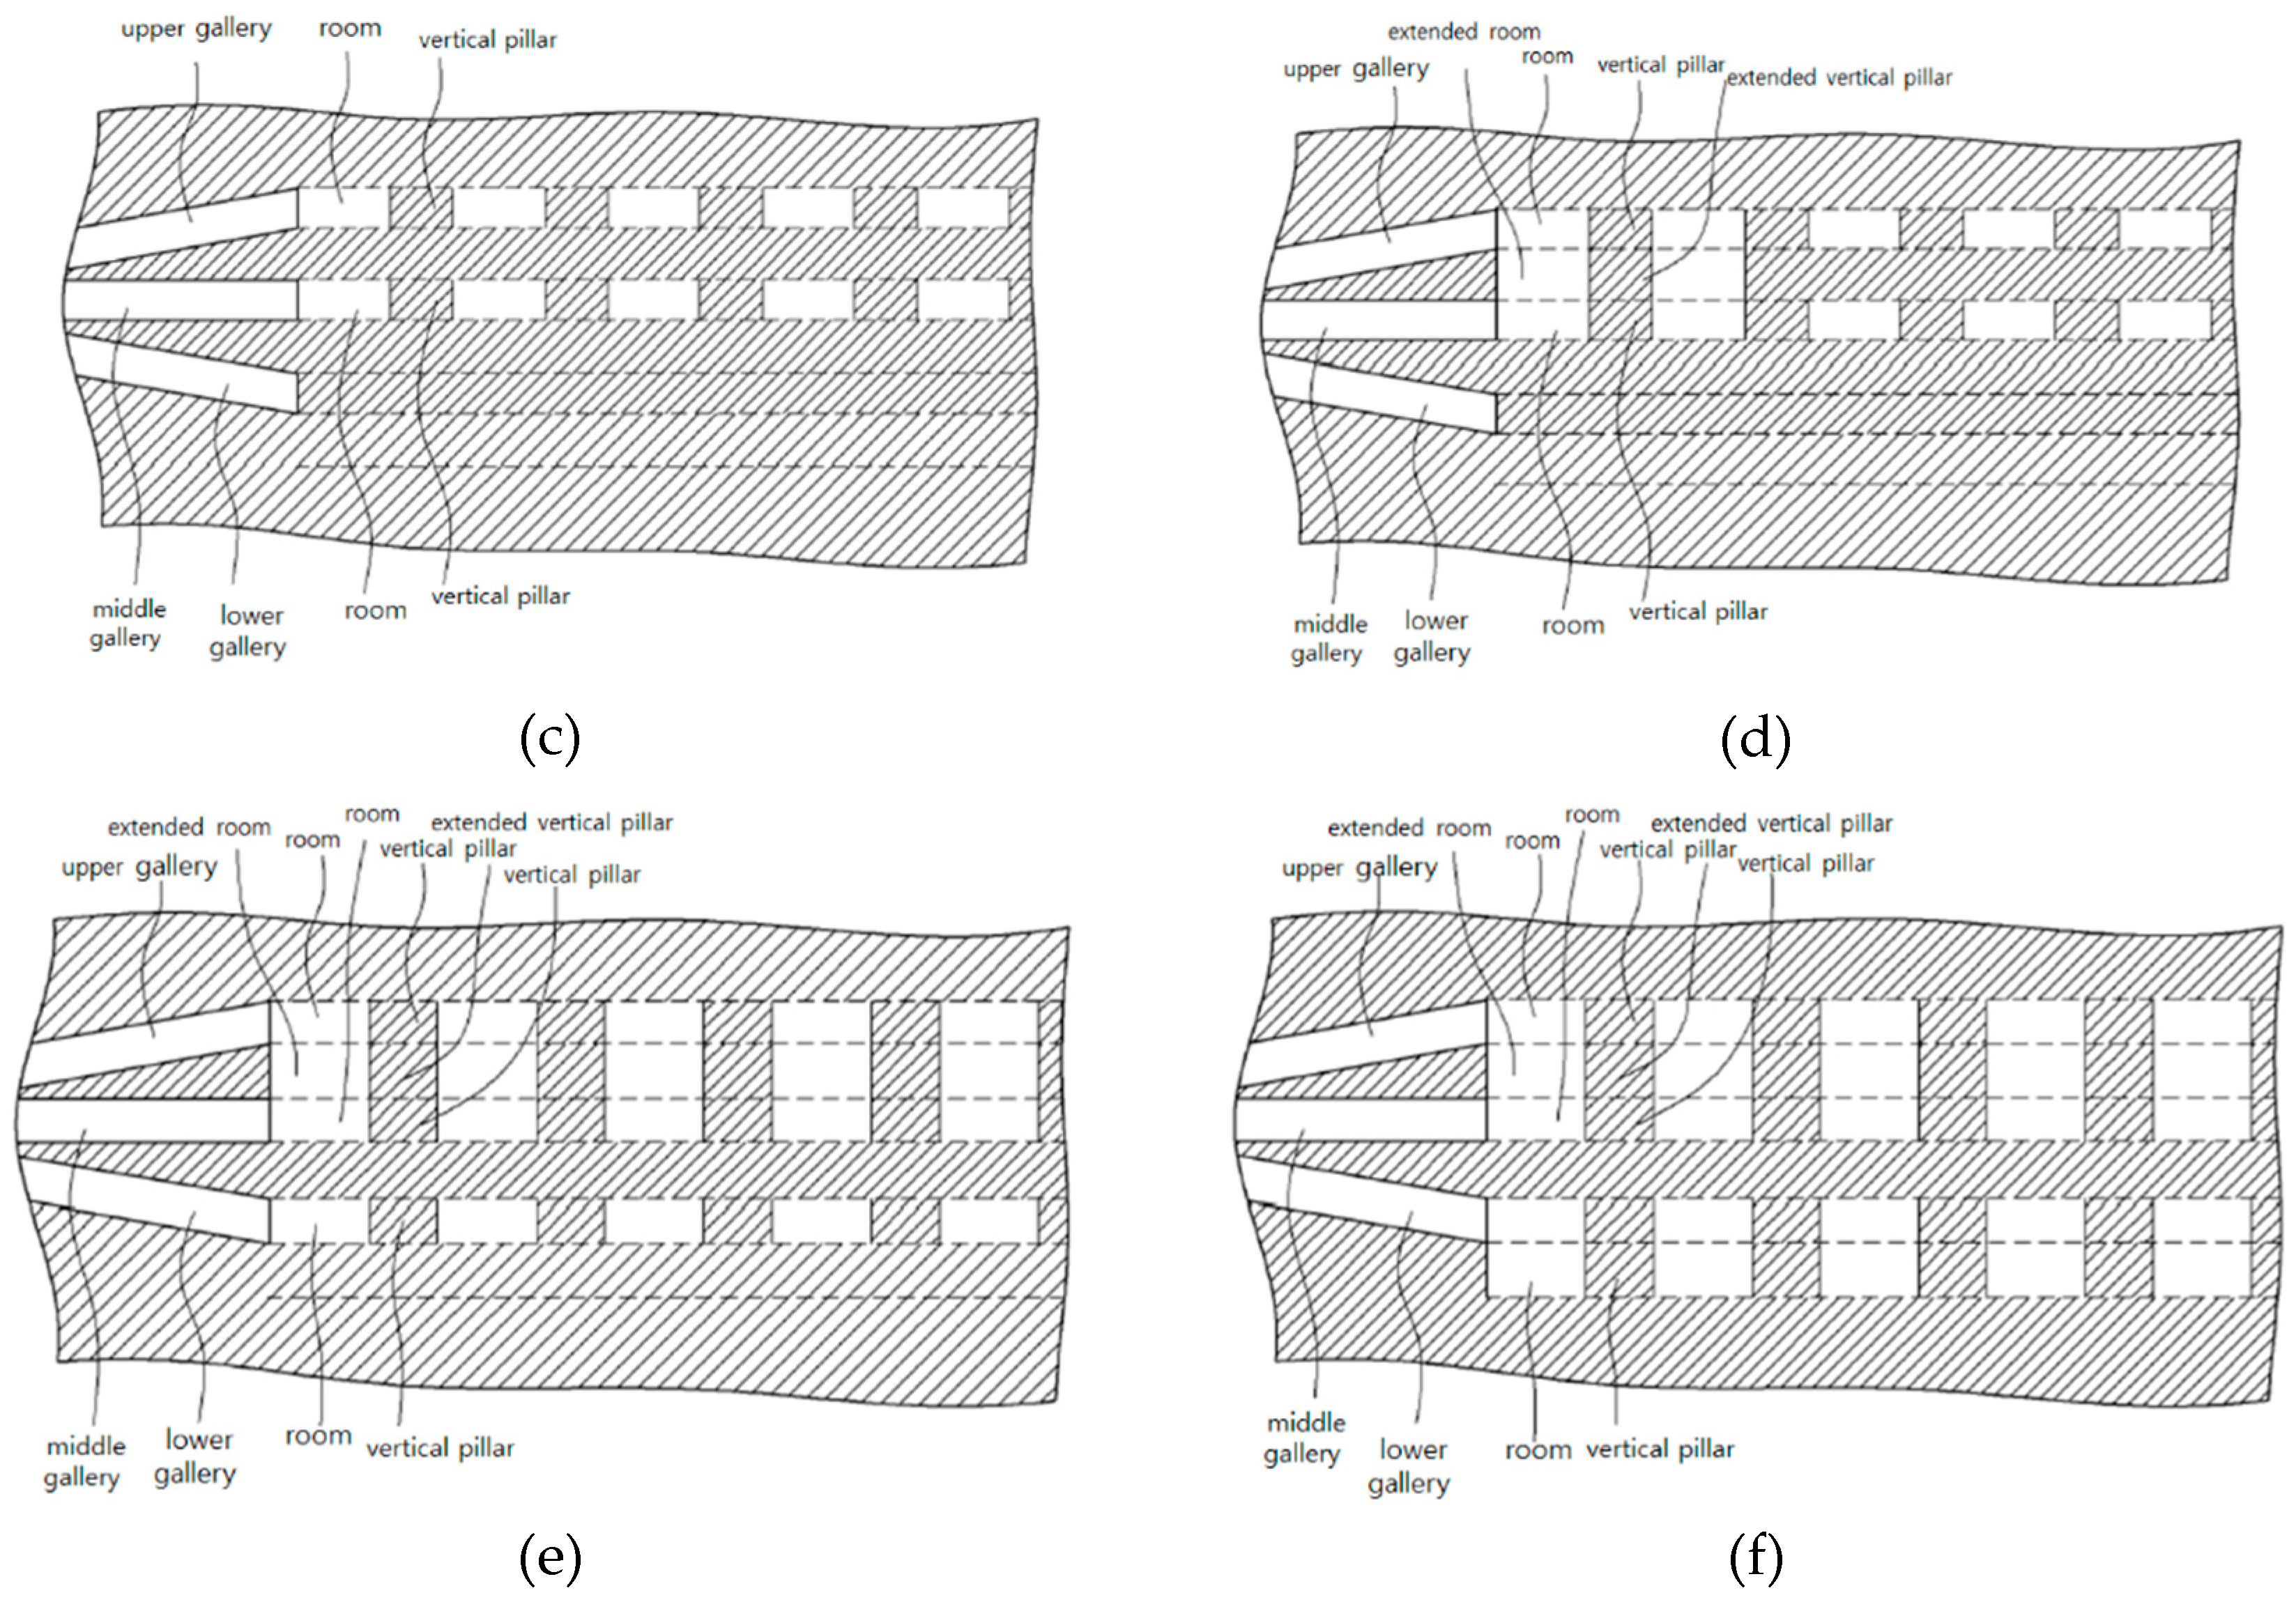
The site survey was conducted after mining ores using a general room-and-pillar mining method at the Lv520 and Lv540 stopes, as shown in
Figure 2a, and then recovering ores from the horizontal safety pillar at a rate of approximately 40%. The site survey was undertaken due to an additional opening of the upper stope (
Figure 1d). As verified in the planning cross-section in
Figure 2b, a vertical safety pillar whose volume was 10 m × 10 m × 7 m (width, length, and height, respectively) was formed in each of the stopes. Once the 8 m thick horizontal safety pillars were all recovered, a large vertical safety pillar, 10 m × 10 m × 22 m, was left to support the upper level.
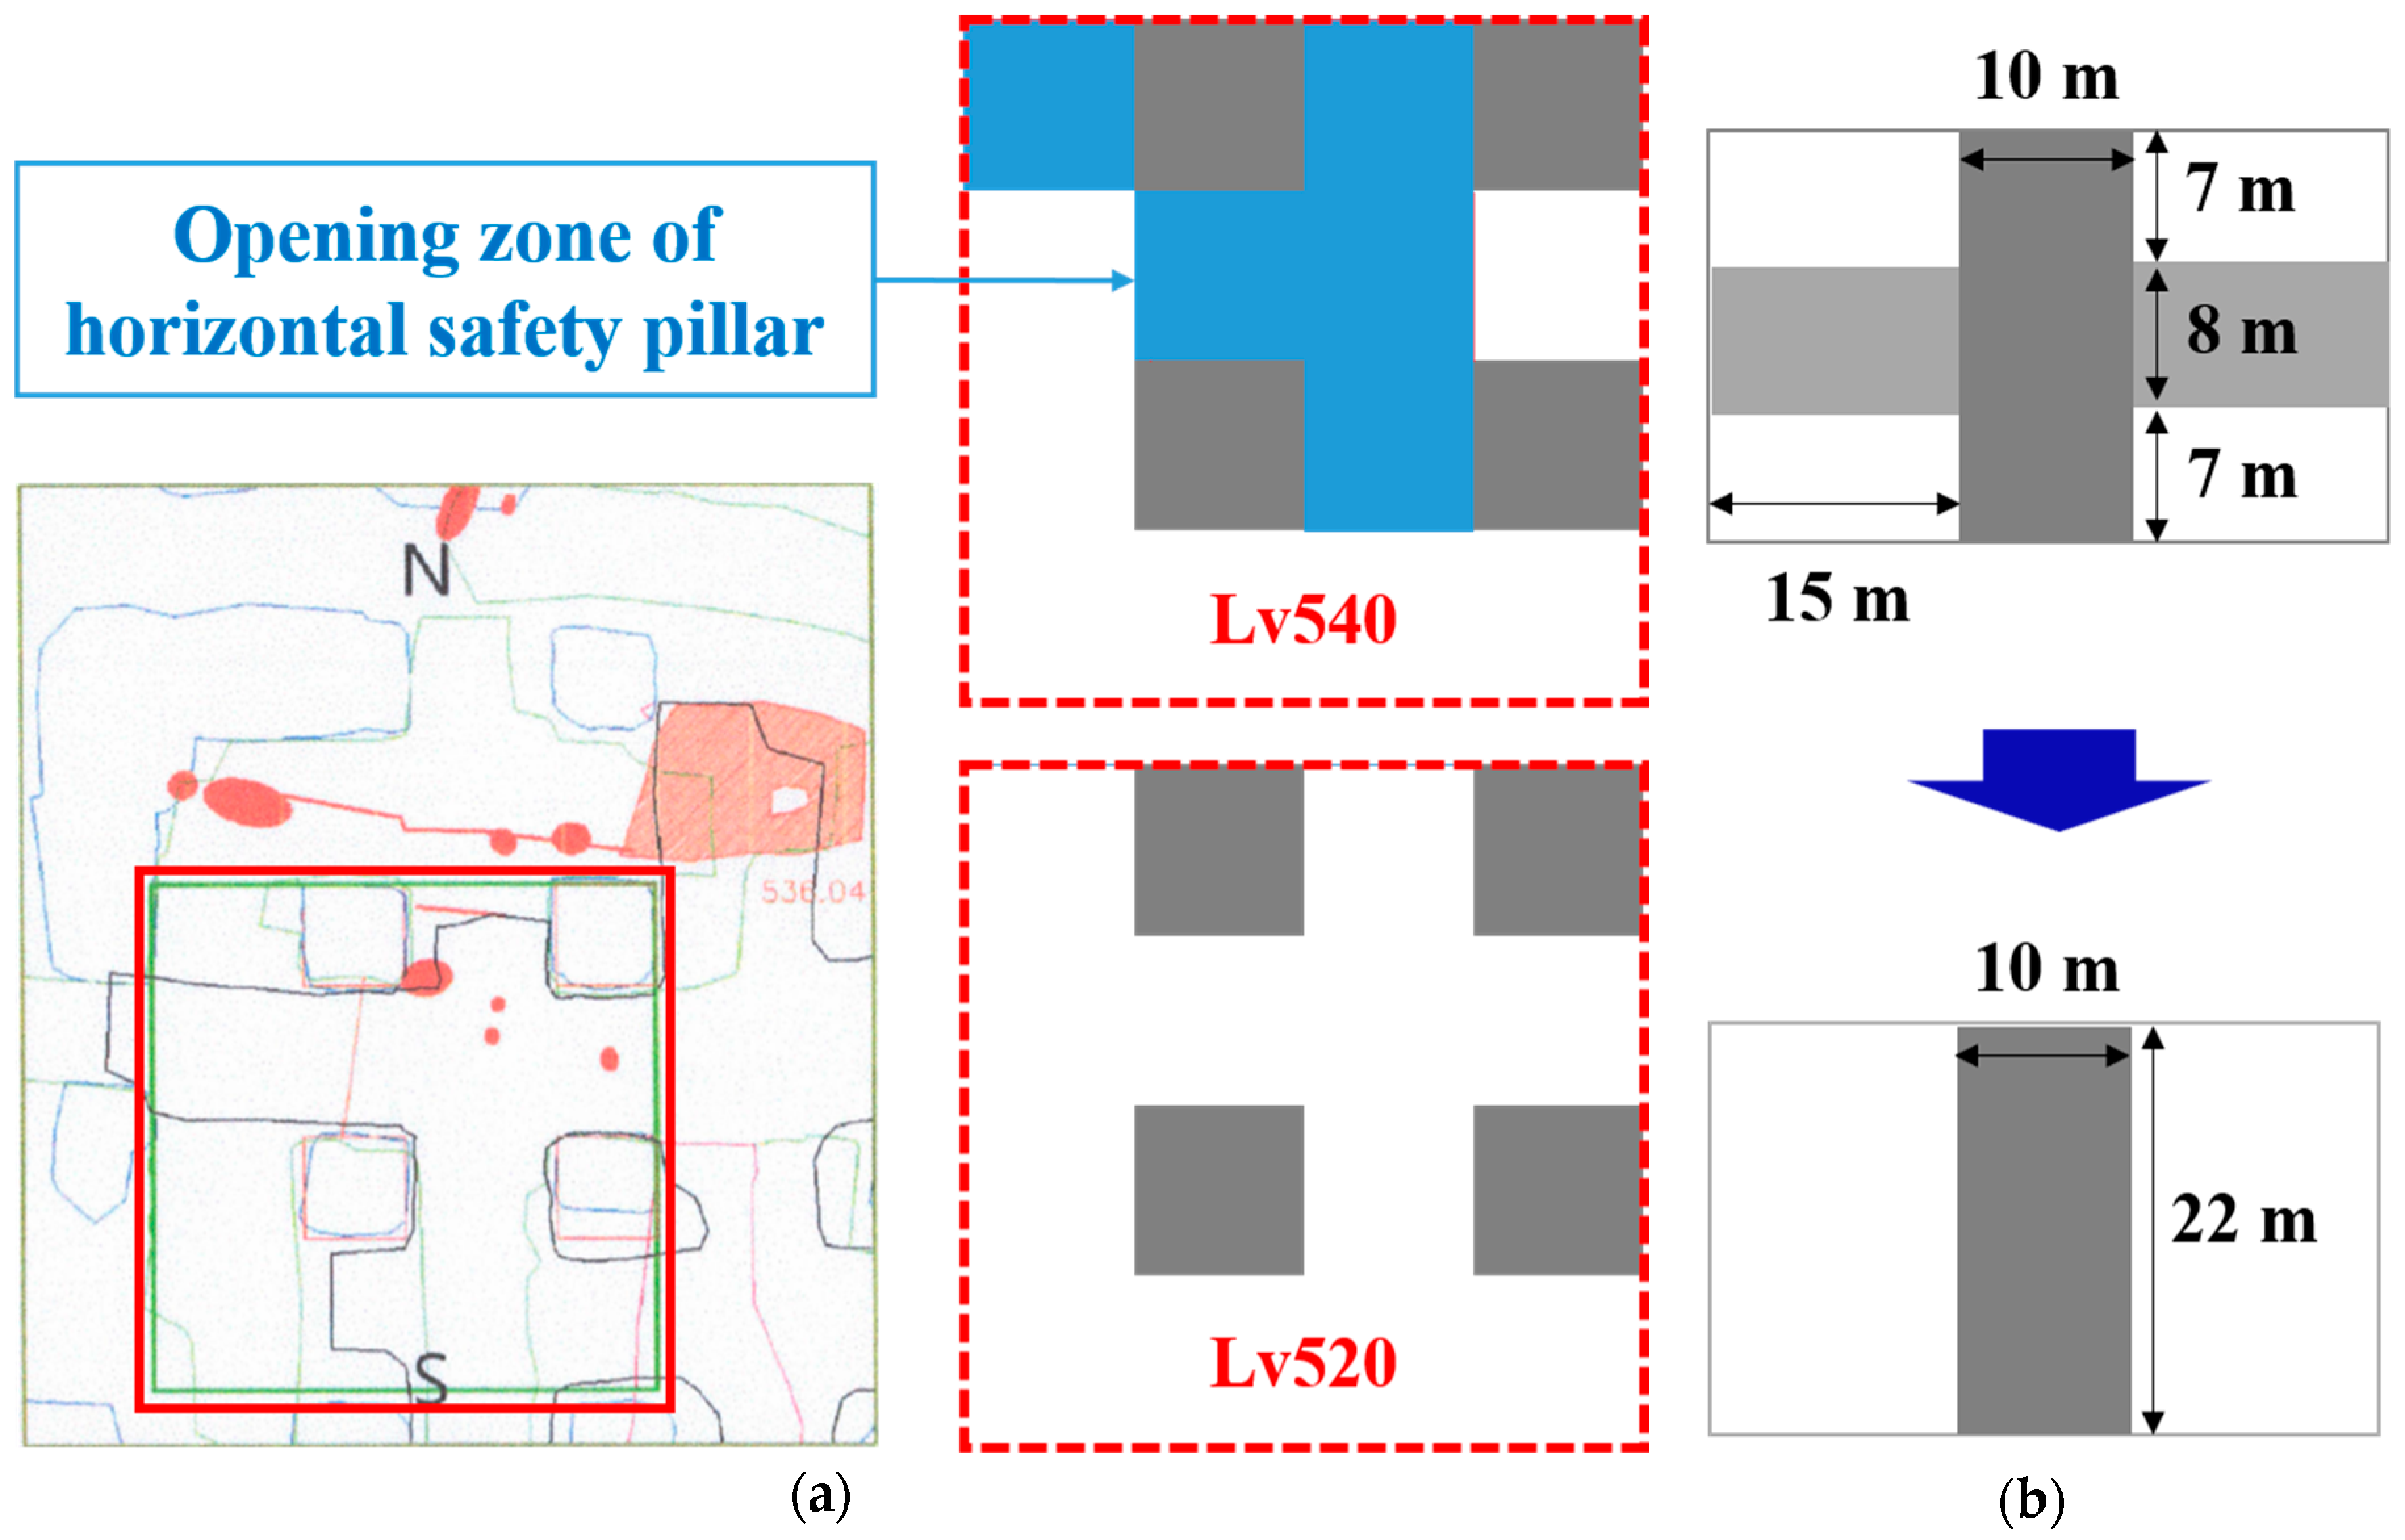
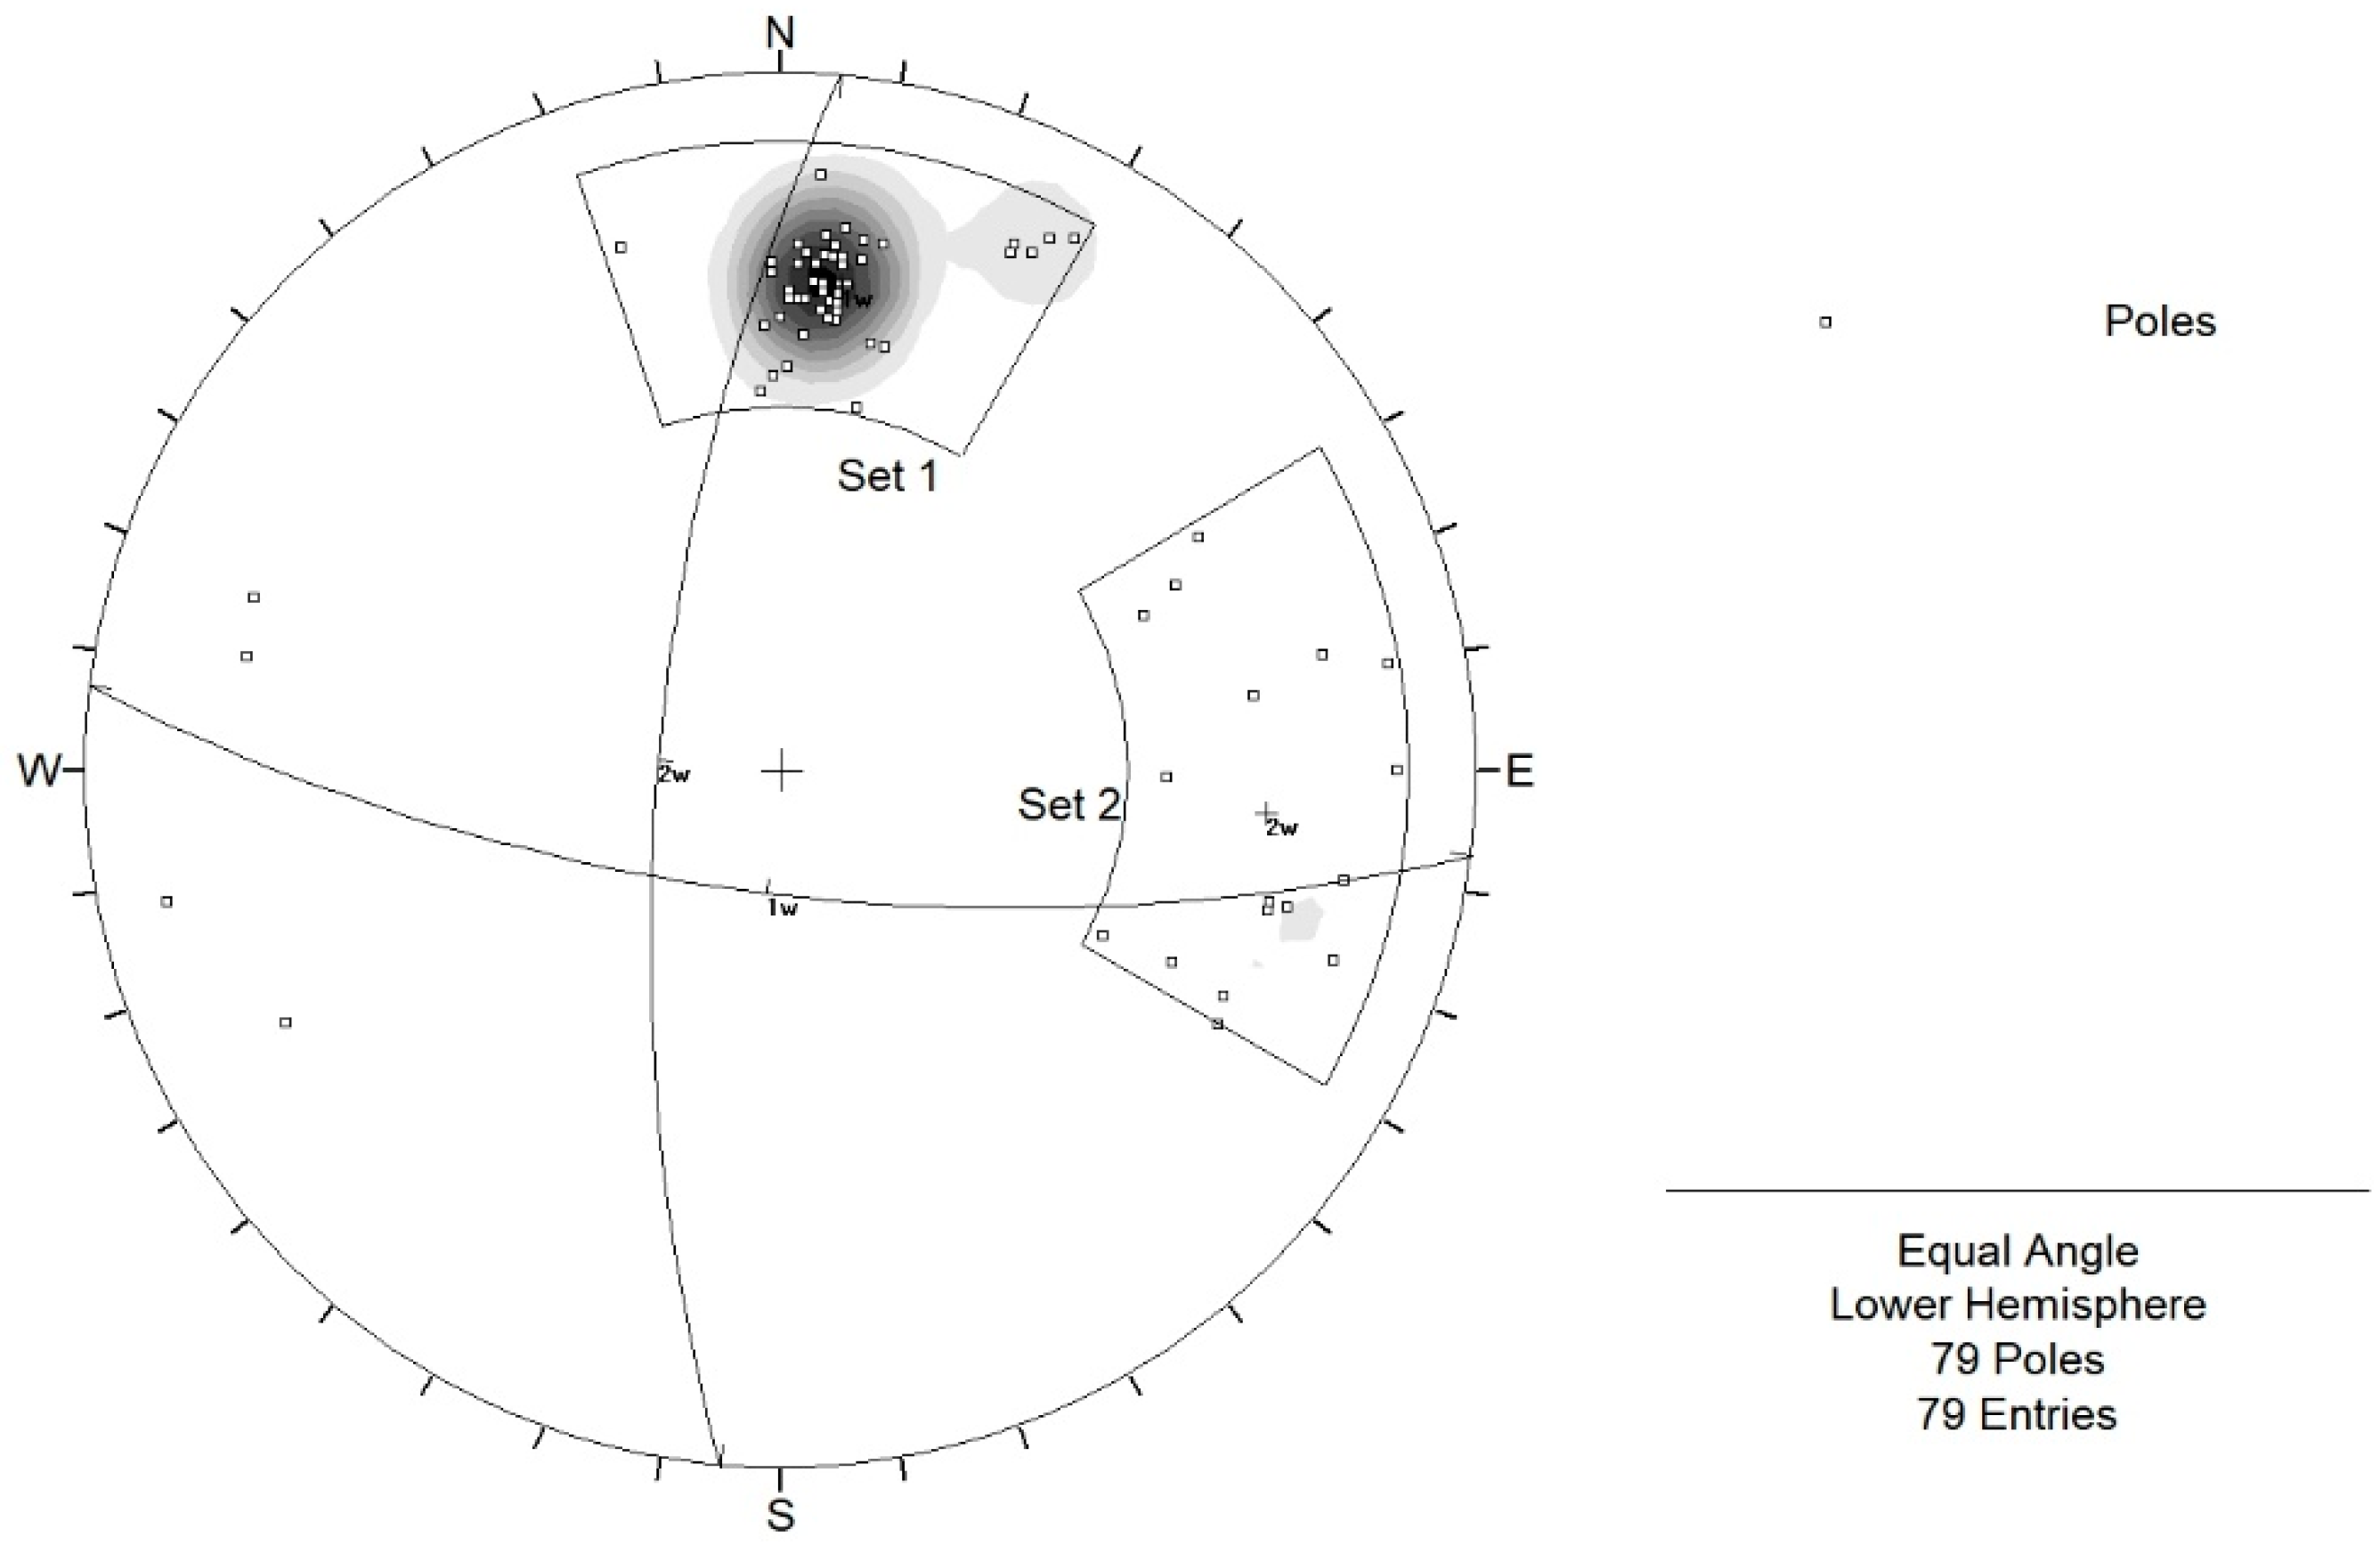
The survey results of the orientation of the joint showed that the dip direction/dip of joint set 1 distributed over the study target area was 186/71, and the dip direction/dip of joint set 2 was 272/69. Joint sets 1 and 2 were distributed as they crossed in the study target area (
Figure 3). Since these two joints may act as unstable factors for the stability of the large vertical safety pillar meant to support the hanging-wall block, a comprehensive stability analysis of stopes was necessary.
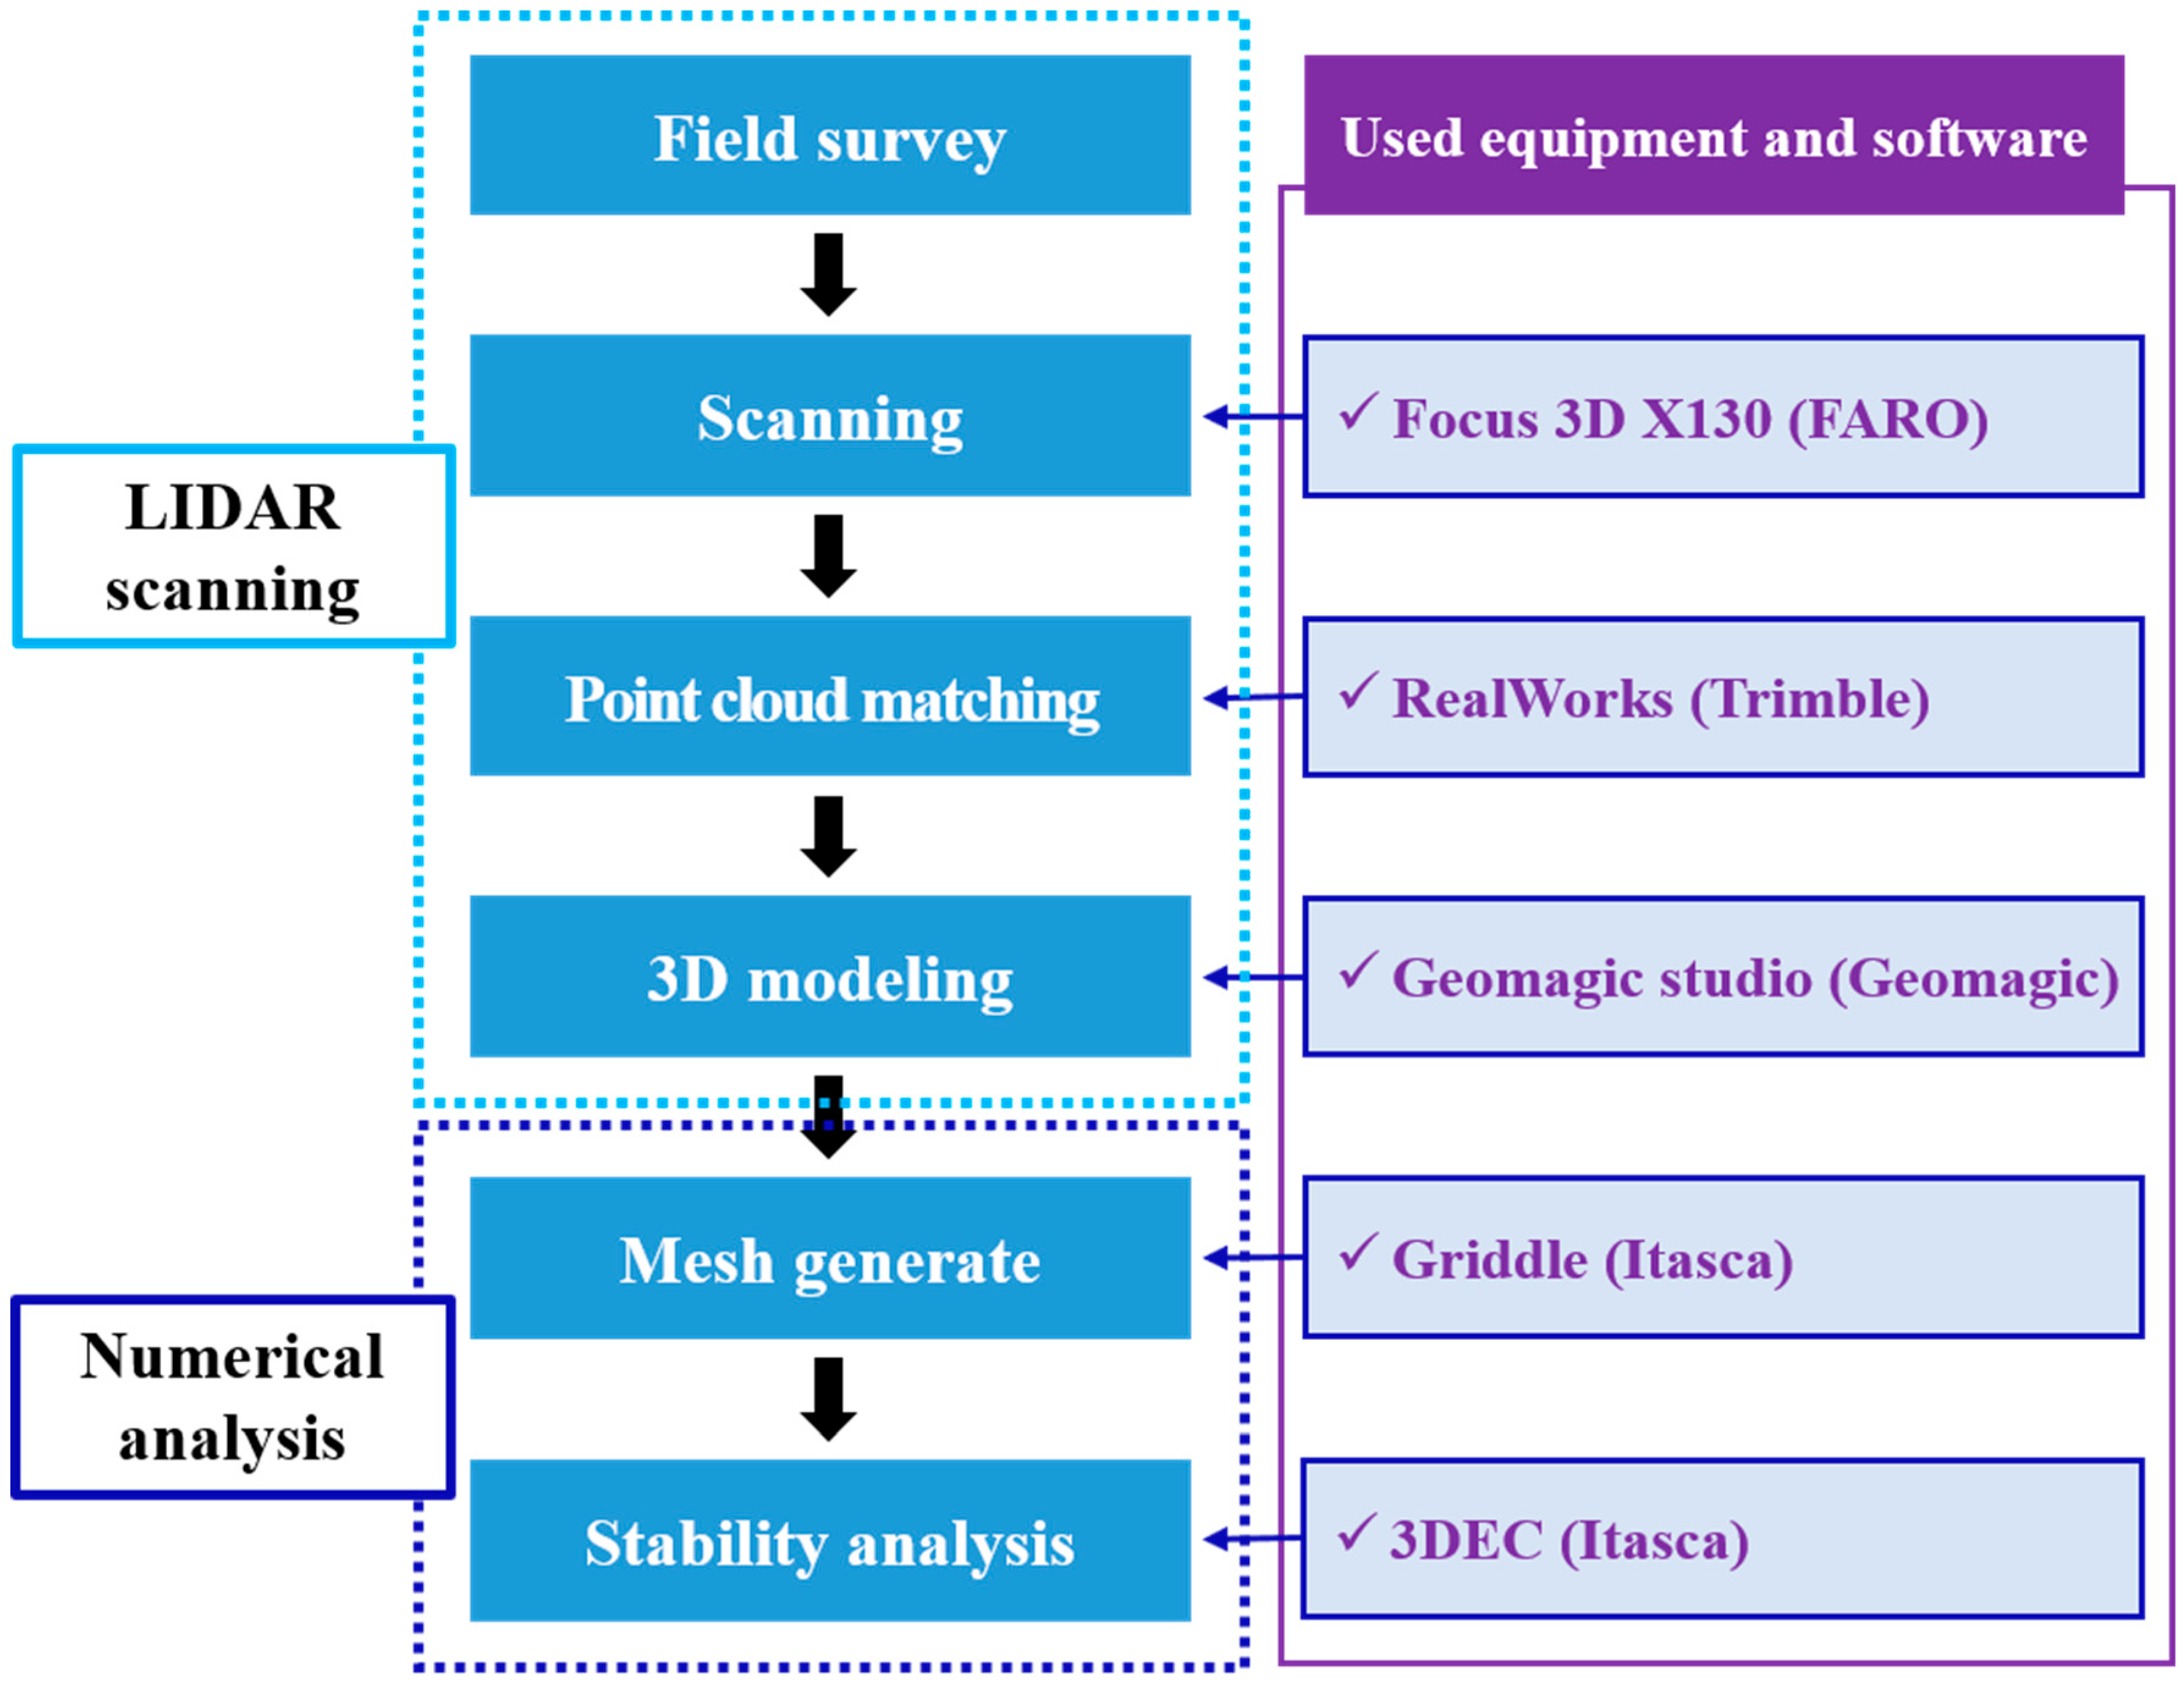
This study conducted 3D surveying and discontinuum numerical analysis, using LiDAR through the study method shown in
Figure 4. LiDAR was used in order to analyze the stability of the stope and the vertical safety pillar formed in the upper and lower levels of the stope at the time when the site investigation was conducted.
3. 3D Surveying of Stope Utilizing LiDAR
Surveying work was conducted to acquire 3D point cloud data about the stope and vertical safety pillar. The continuous surface model was created using point cloud data, and analyses of cross-sections and volumes of the mining area and vertical safety pillar were conducted using this model.
3.1. Principle of LiDAR Measurement
LiDAR measures the distance something is located away from the measurement equipment by emitting light and measuring the reflecting and returning light accurately. A total station, which is surveying equipment that uses a laser, measures a distance at a single point, one point at a time, whereas LiDAR has the advantage of quickly acquiring multiple points using a mirror that rotates rapidly [
8].
LiDAR measurement is divided into time of flight (ToF) and phase shift (PS) modes. The principle of the ToF mode is to measure distance by measuring the reflection time of a laser pulse signal from an object to a receiver within the measurement range. The principle of the PS mode is to calculate time and distance by measuring the phase component difference in signals reflected from the object within the measurement range, after radiating a laser beam that is continuously modulated to a specific frequency. In this study, PS mode was used in considering the volume and precision of the stope.
Table 1 shows the specification of Faro Focus3D X130.
3.2. Surveying Work and Point Cloud Data Matching
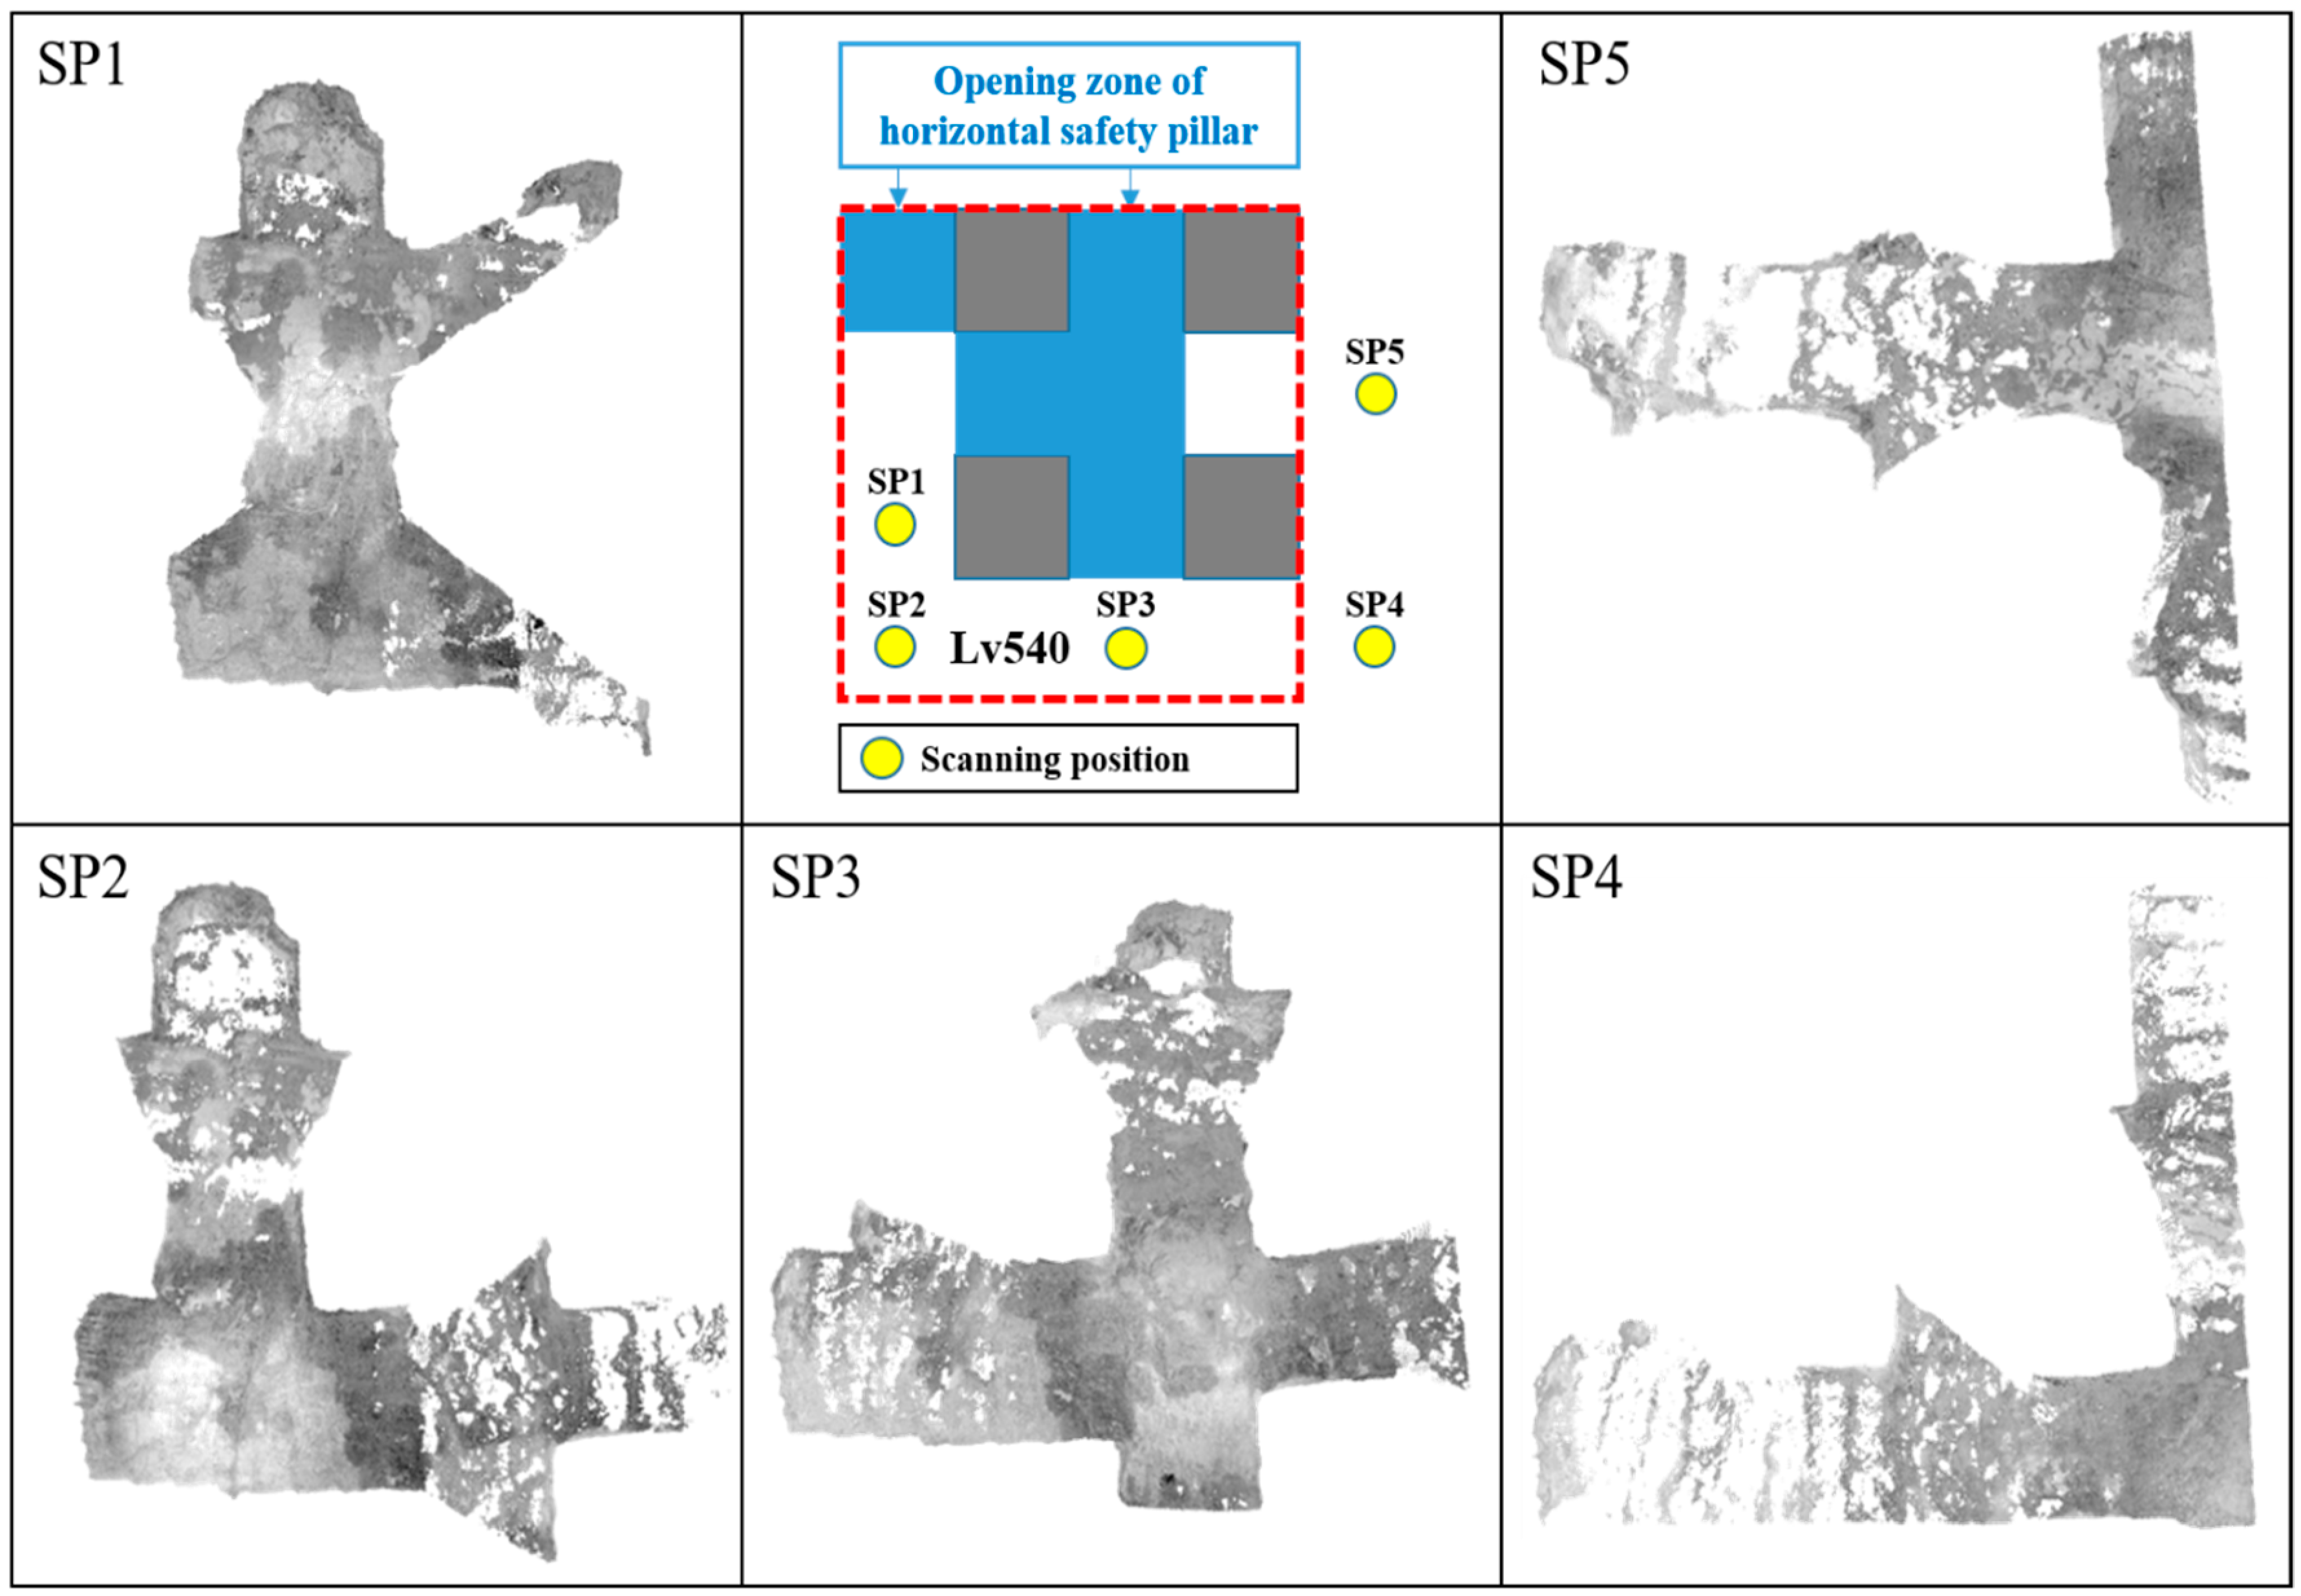
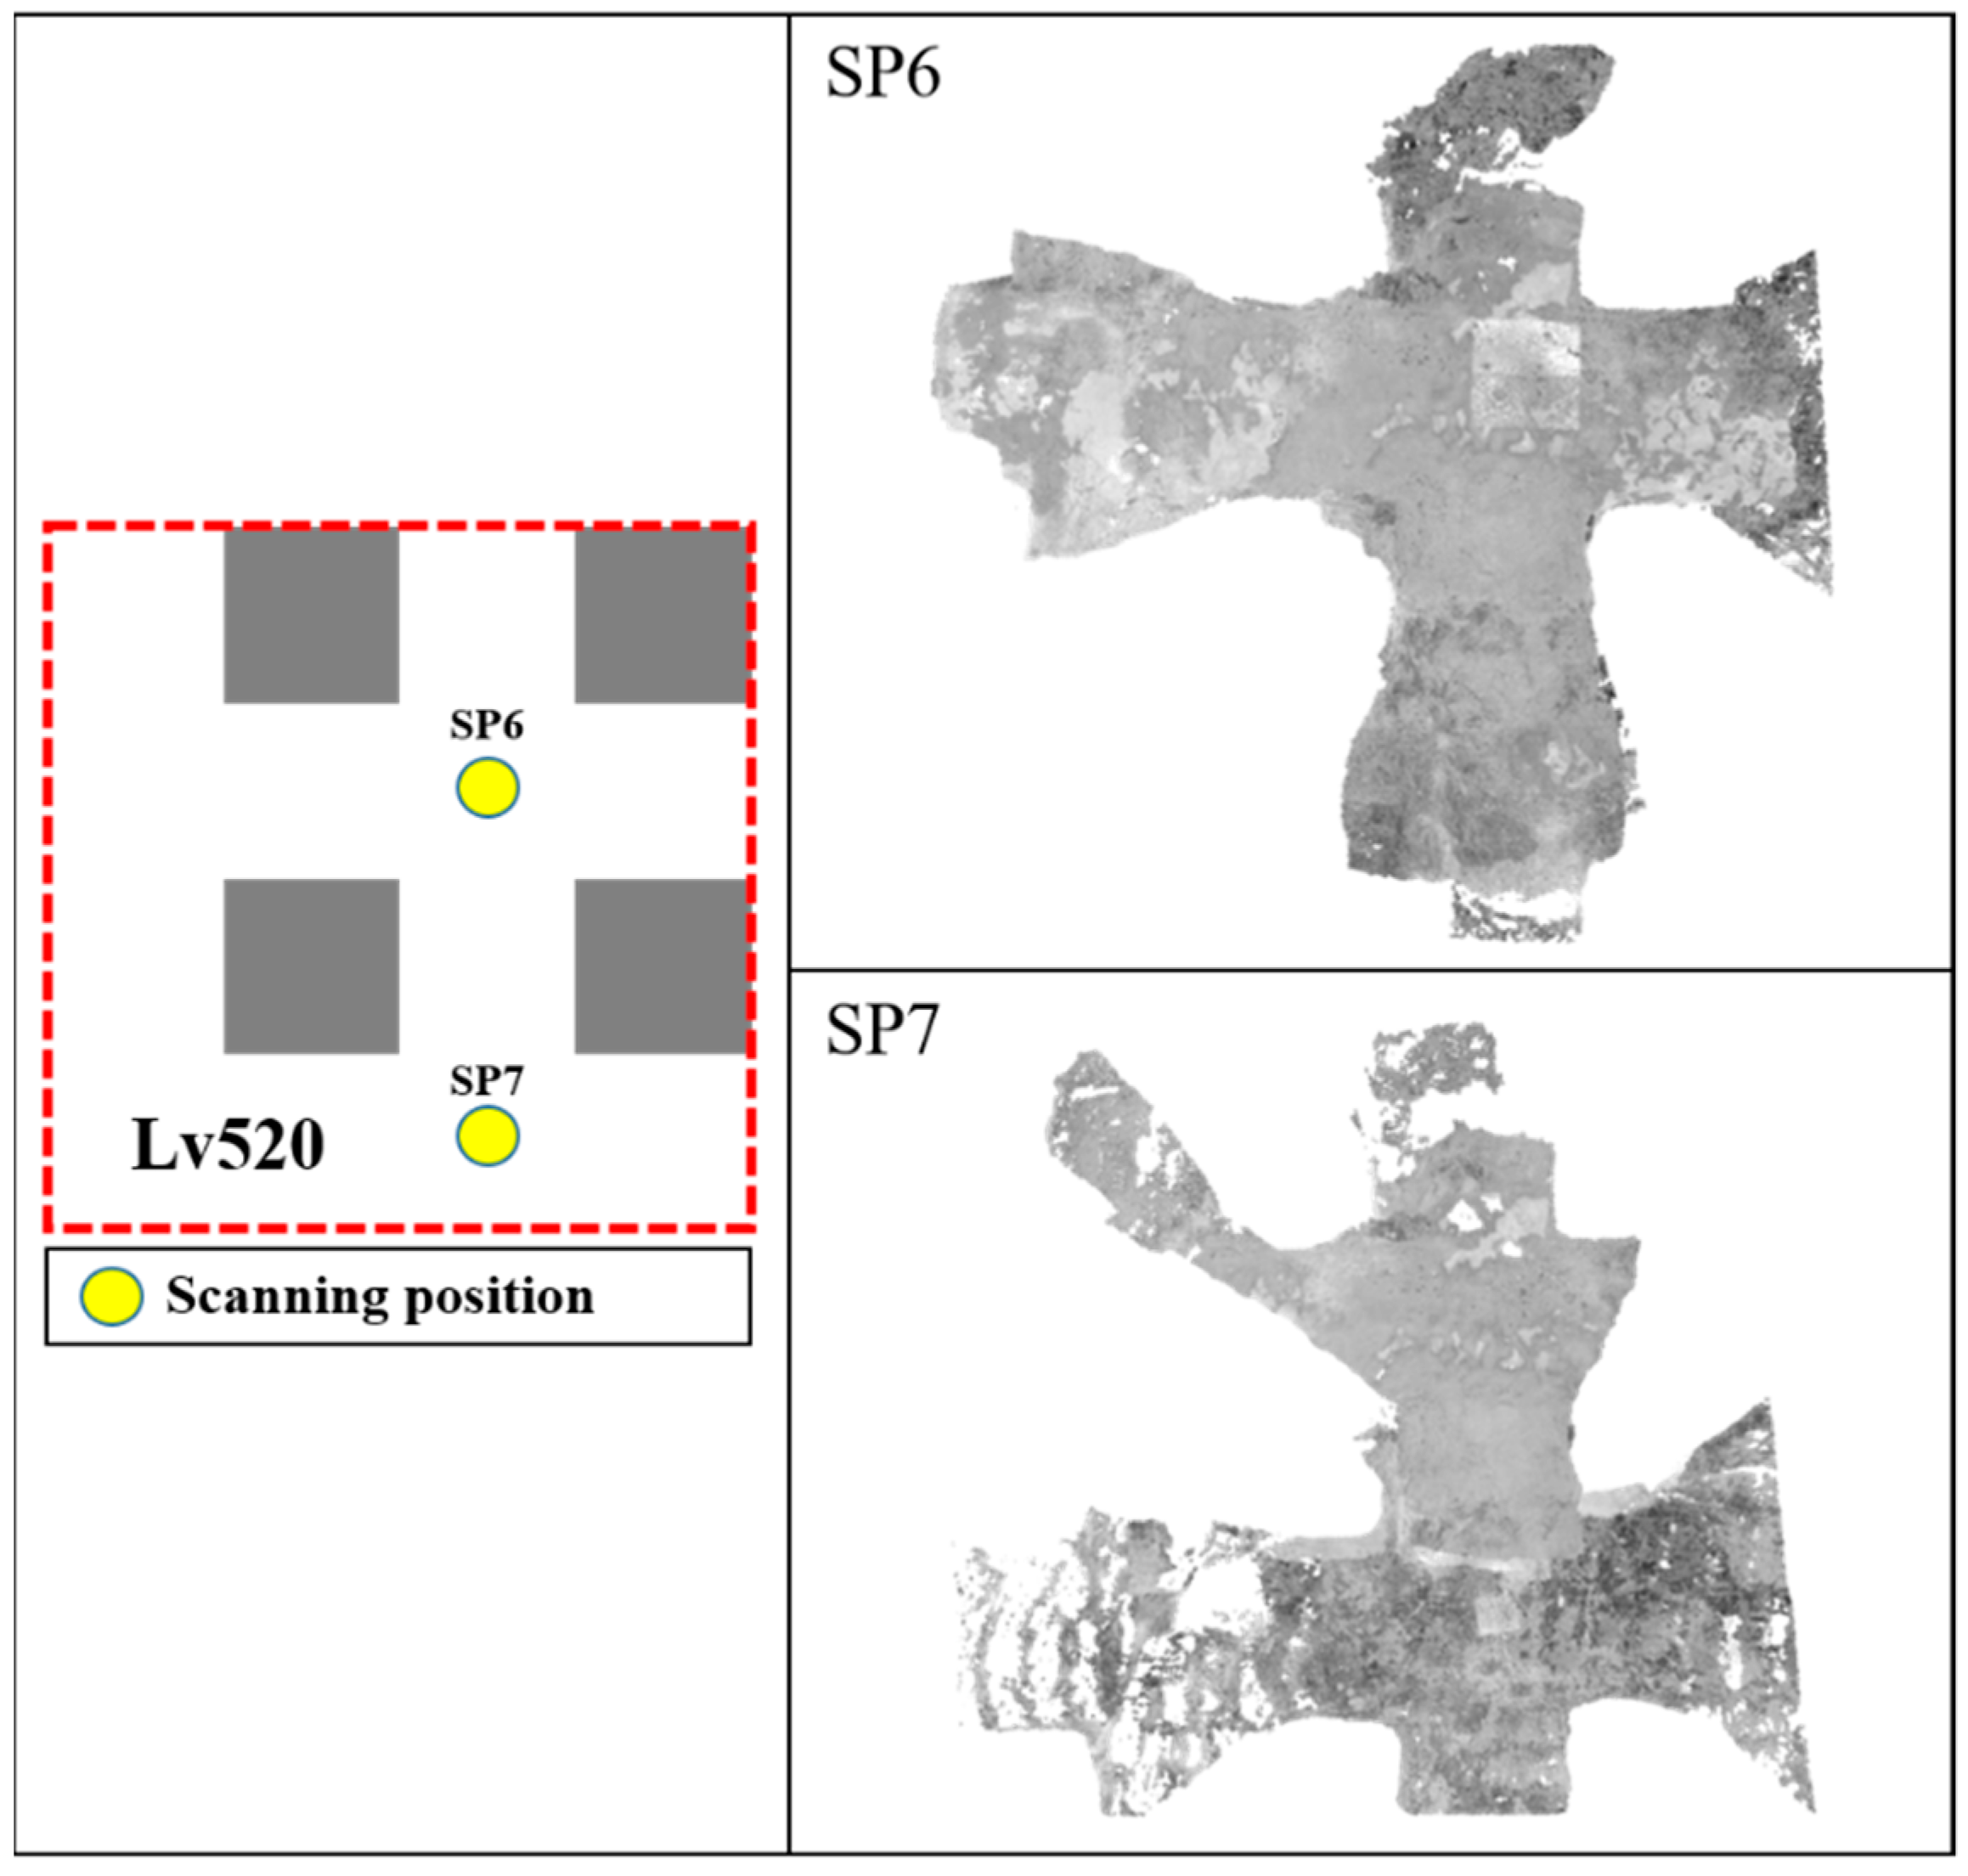
Considering the site accessibility and point cloud data overlap, five points were selected in the Lv540 stope to conduct surveying work. However, surveying work was only conducted at two points in the Lv520 stope, as due to the recovery work of the horizontal safety pillar in the west area, crushed stones were piled up making this area inaccessible. The LiDAR measurement angle was set to the maximum to reduce measurement error due to obstacles or dust at each position during the measurement [
17].
Figure 5 shows the point cloud data acquired at each position in the Lv540 stope.
Figure 6 shows the point cloud data acquired at each position in the Lv520 stope. Various methods were available to achieve this, including coded target matching, manual matching by setting an arbitrary feature point, automatic matching through software for statistical processing of all point cloud data, and smart matching, all of which could have been employed. The smart matching technique was selected to sequentially match the point cloud data acquired at each of the measurement positions. The point cloud data acquired at SP1 to SP5 shown in
Figure 5, at each position in the Lv540 stope, were matched sequentially. Later, the point cloud data acquired at SP6 and SP7 shown in
Figure 6, at each position in the Lv520 stope, were matched sequentially. The matching precision in each stage was above 98%.
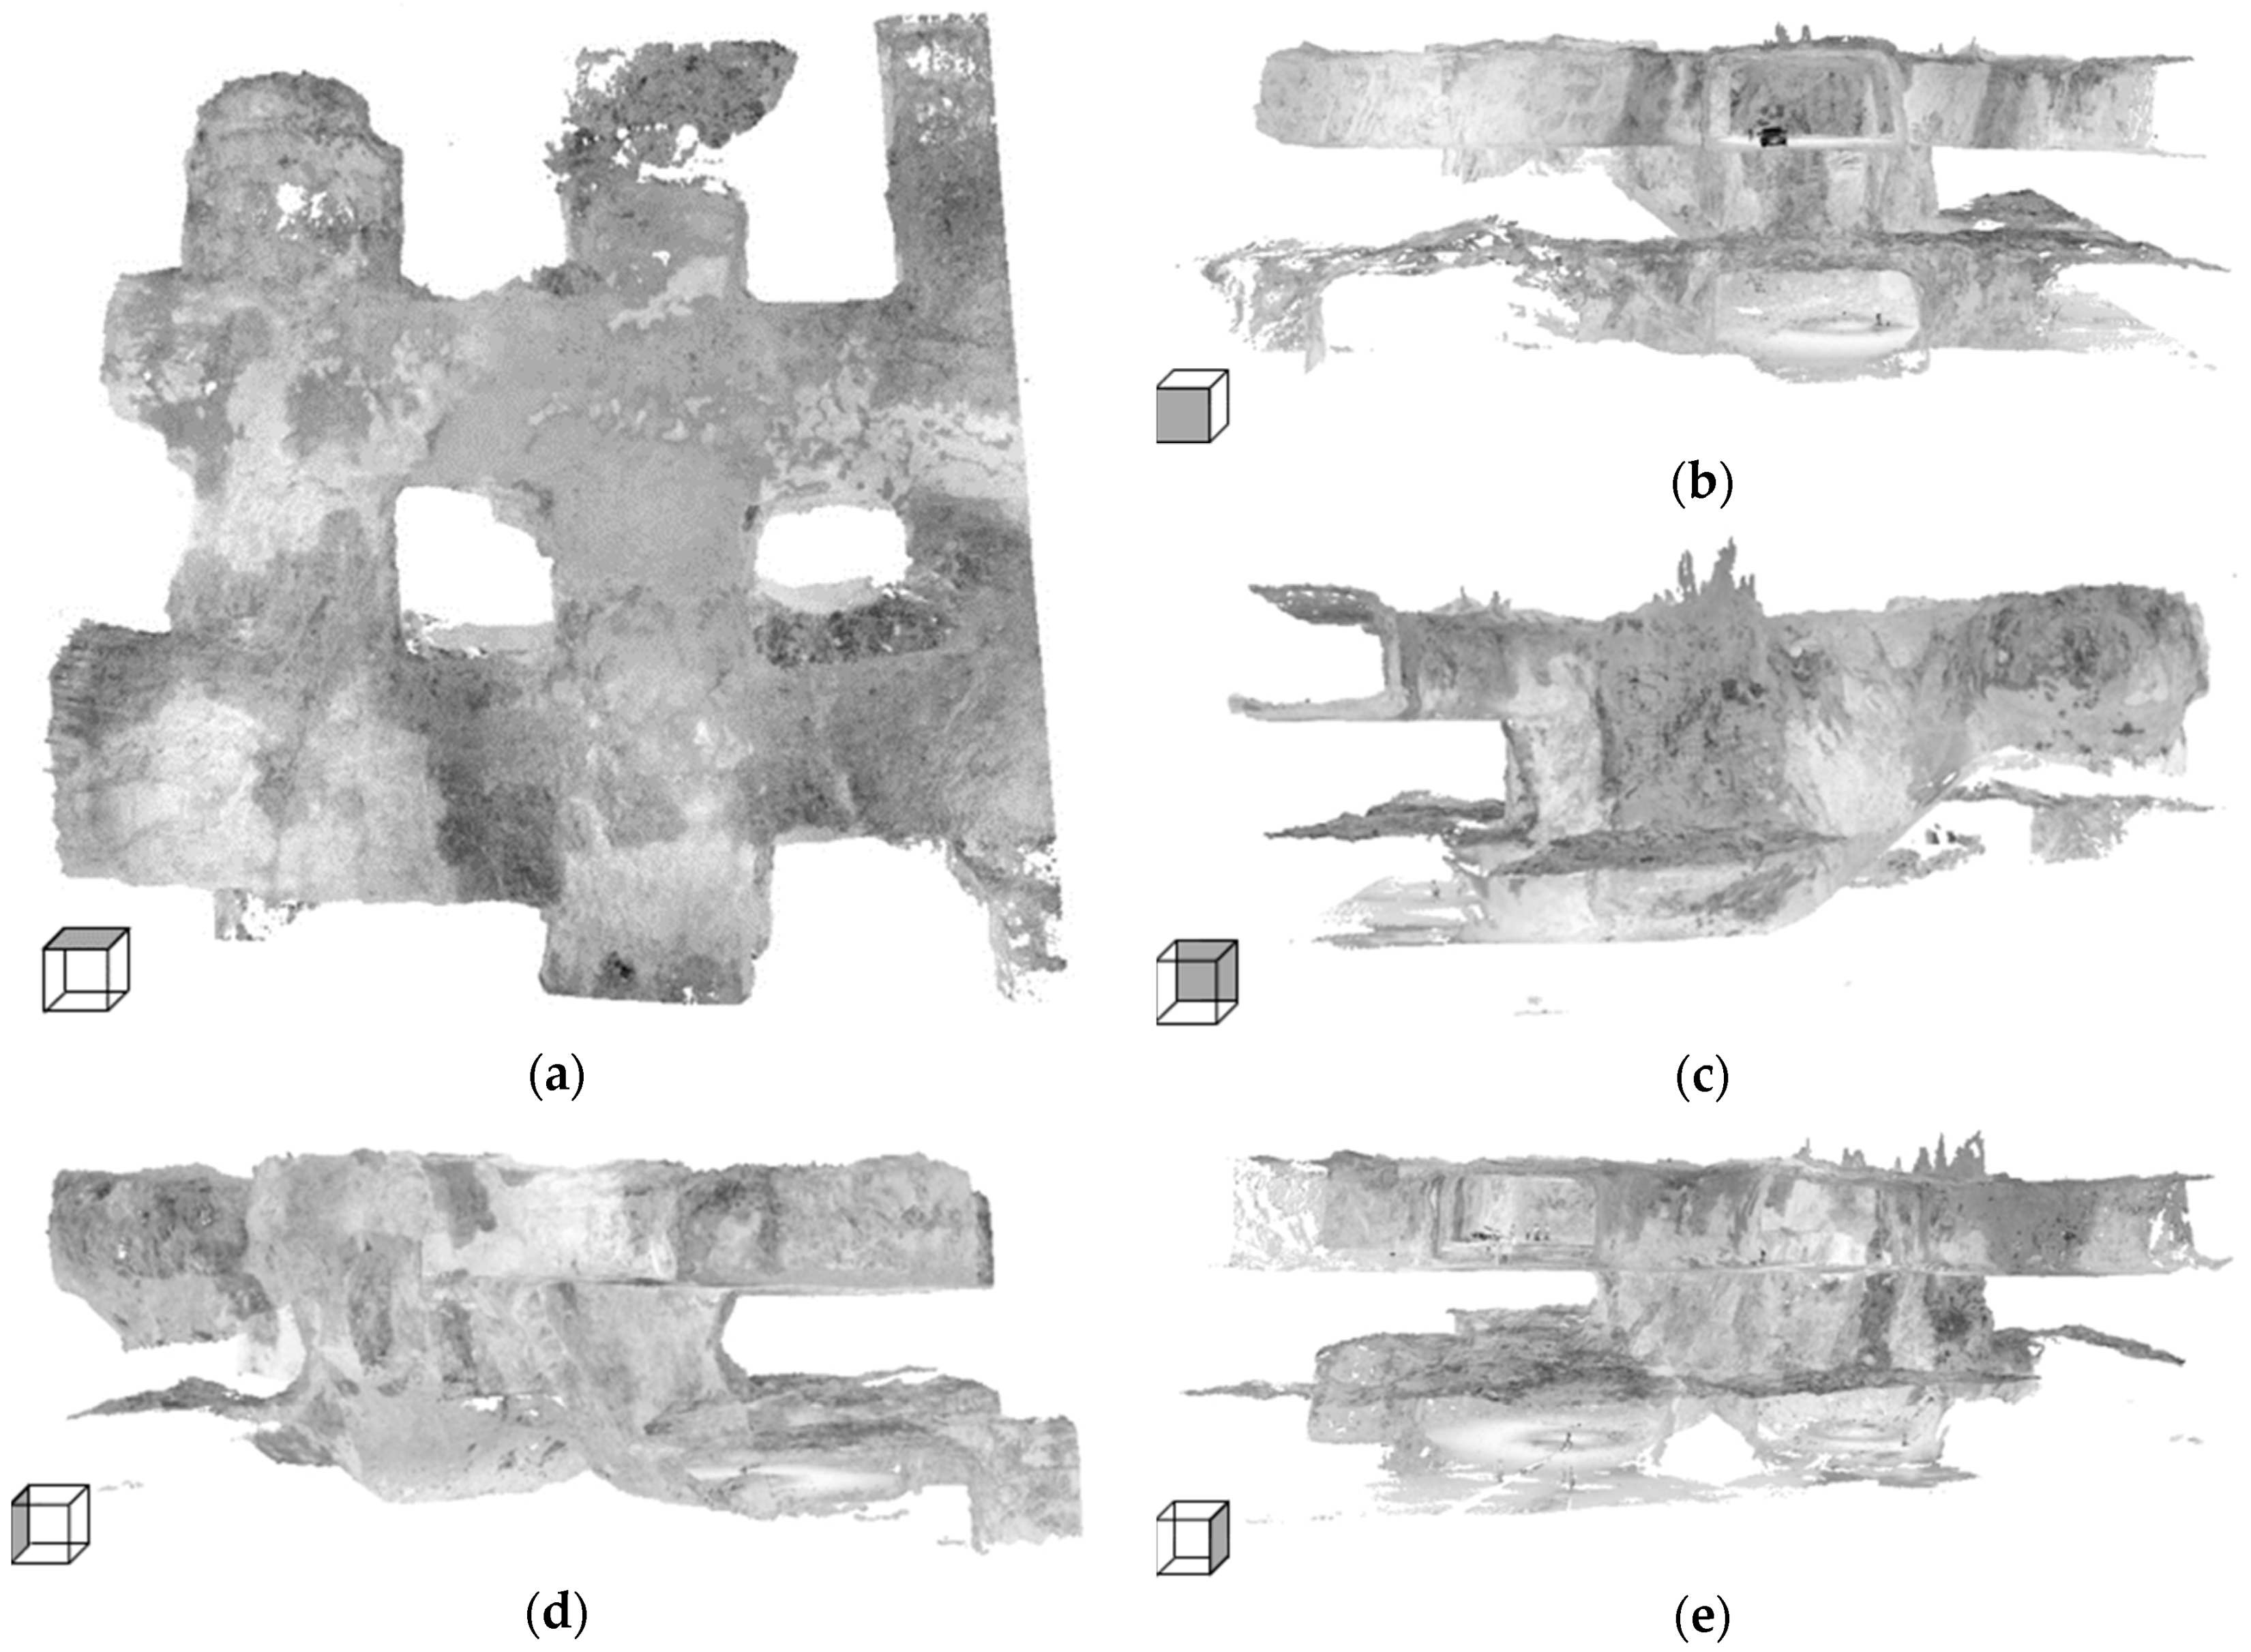
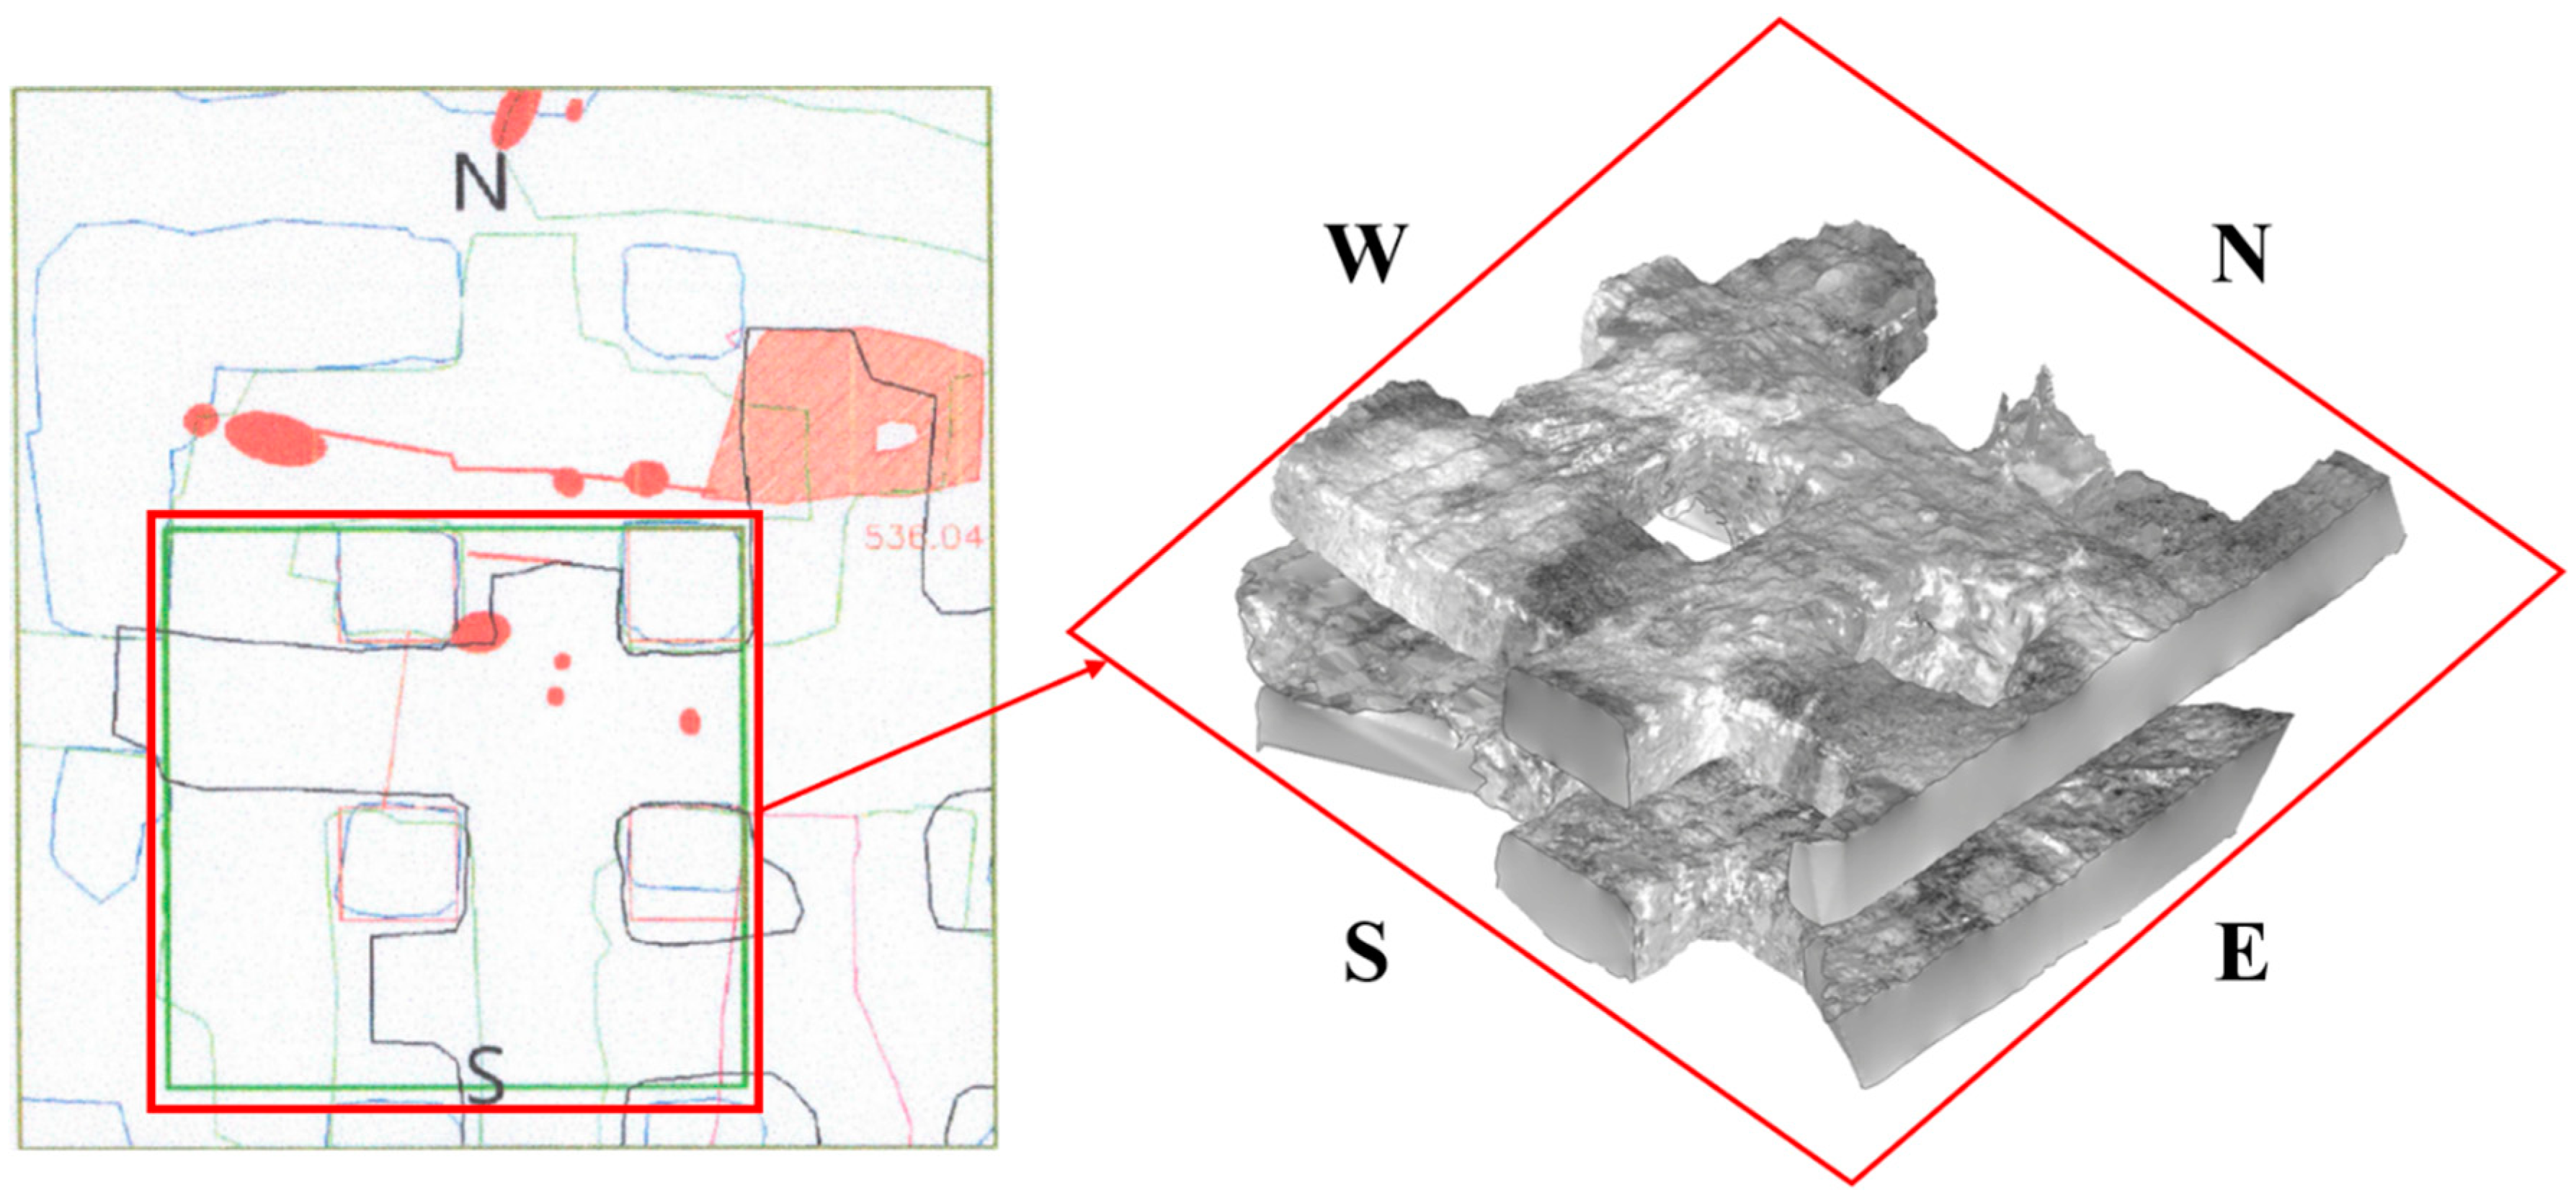
Figure 7 shows the 3D image of the point cloud data matched sequentially from SP1 to SP7 by smart matching method.
3.3. Analysis of Surveying Results
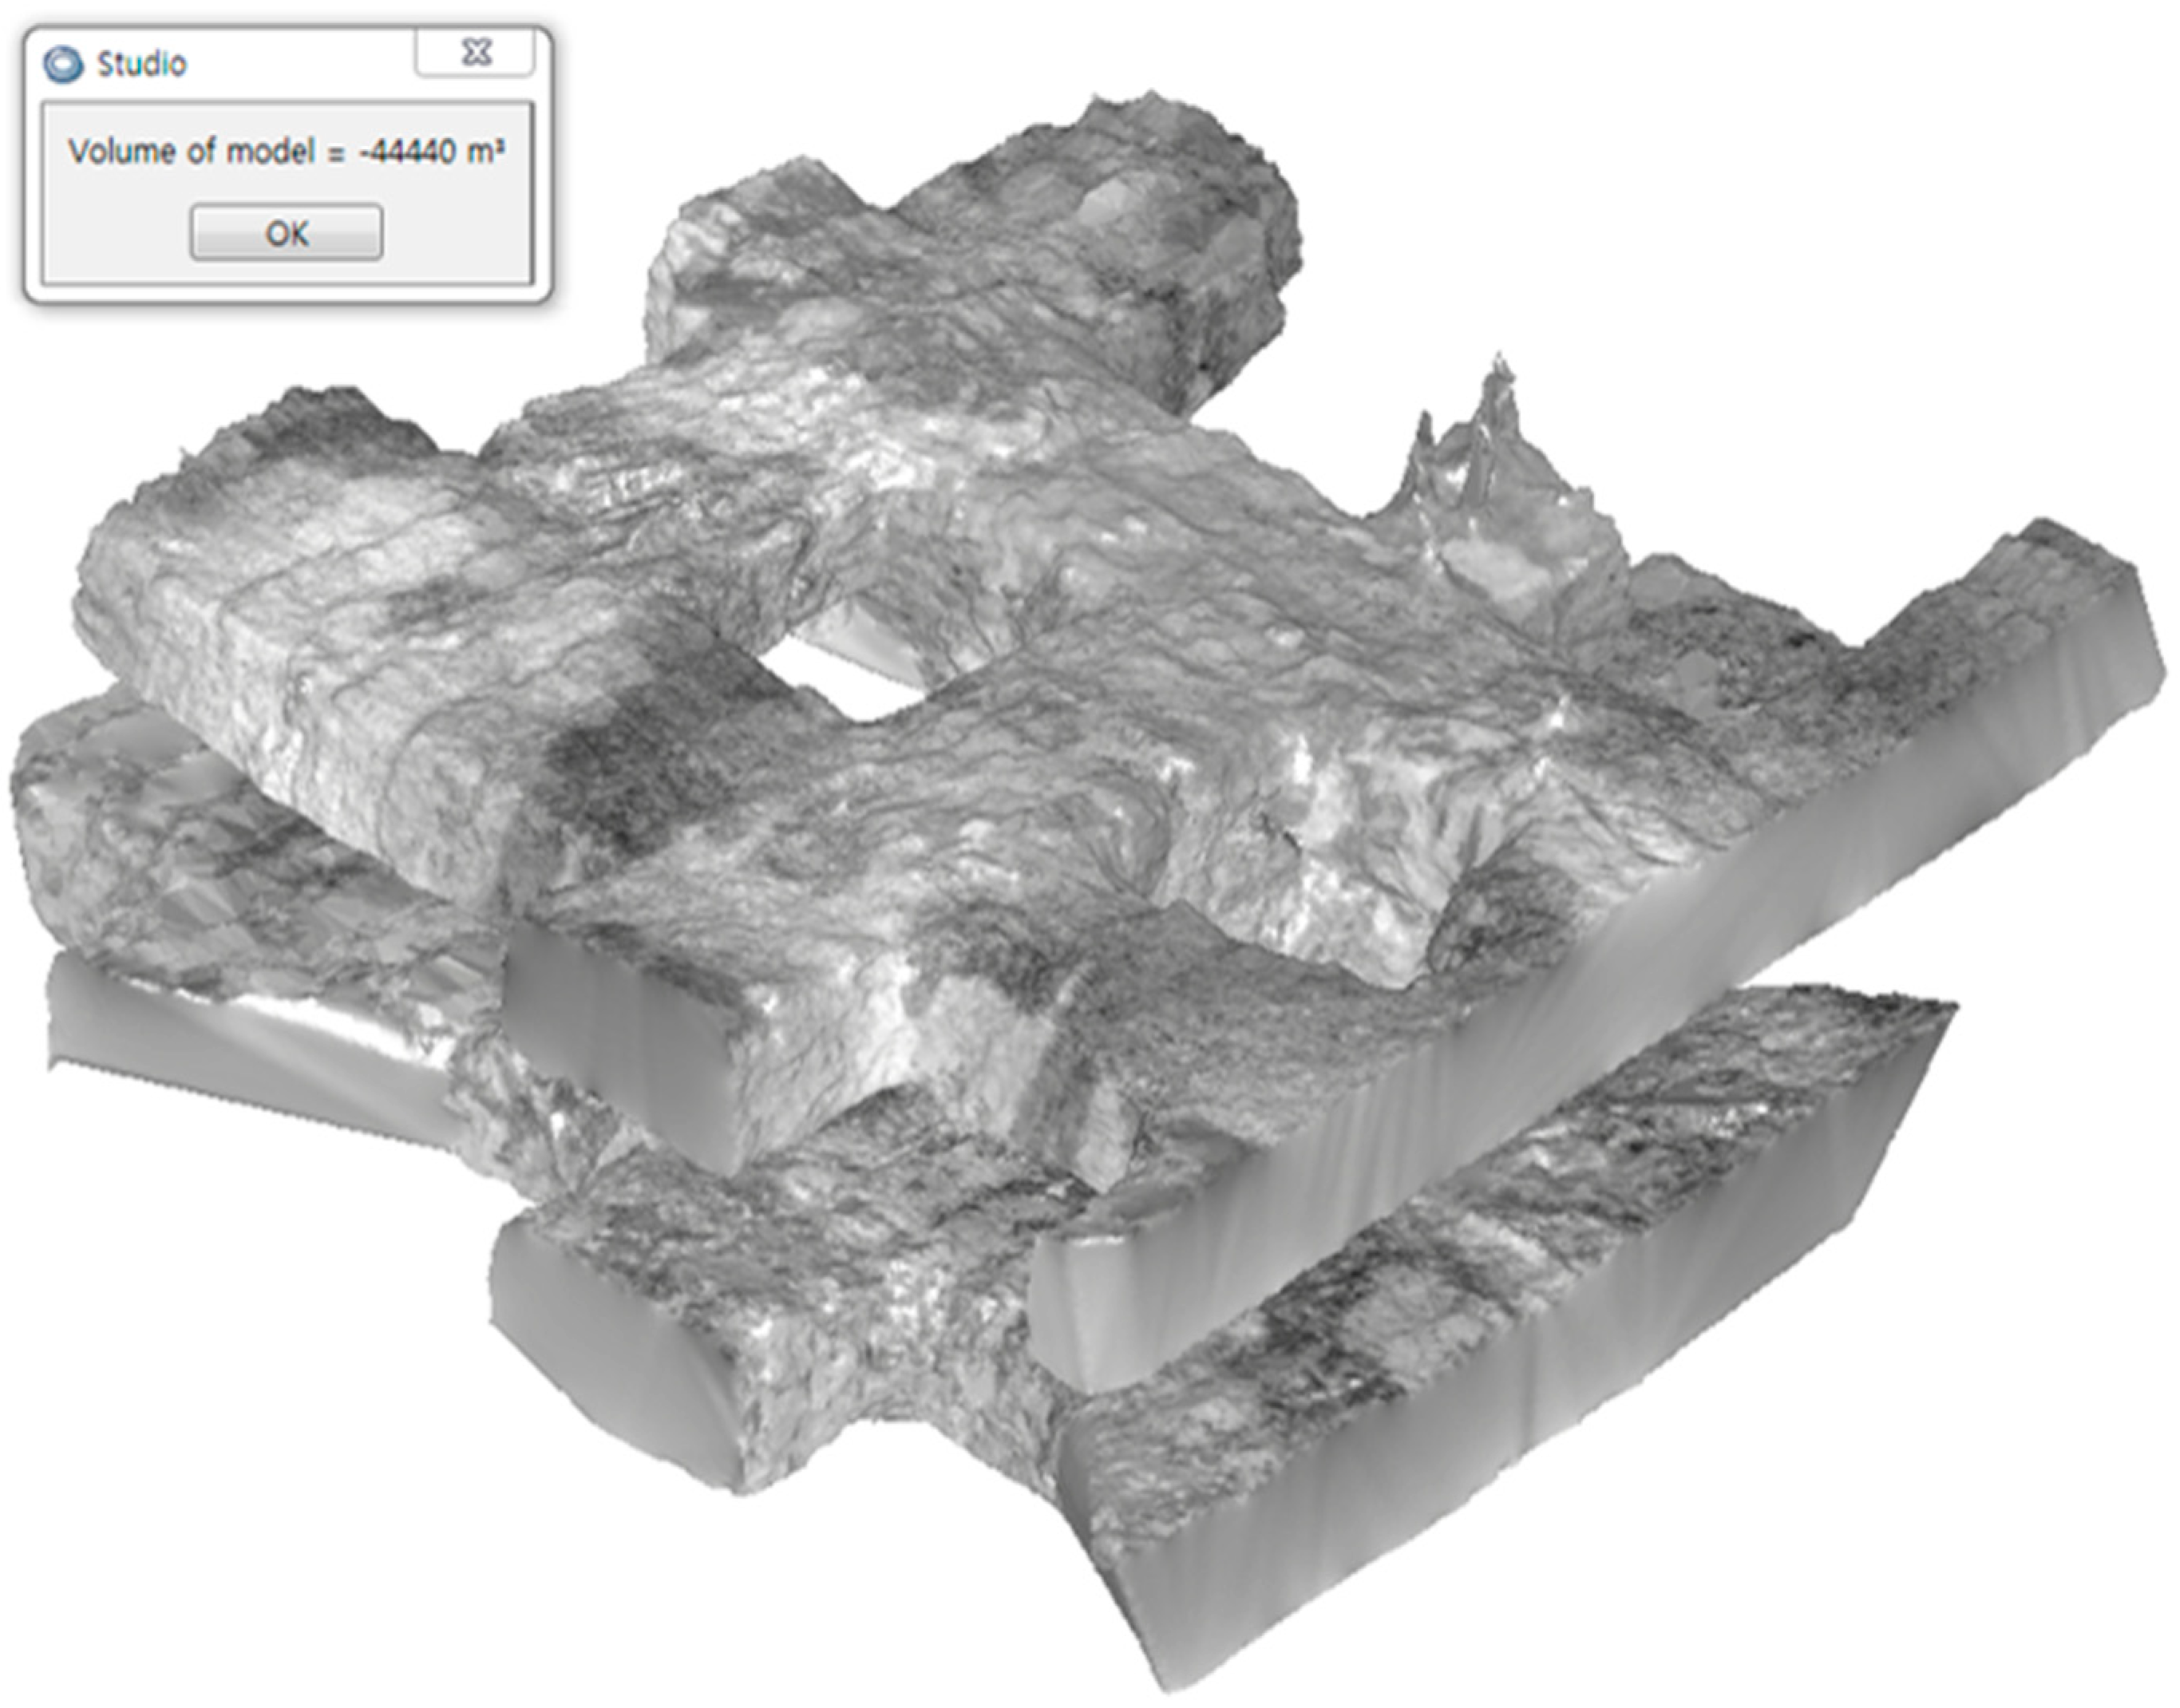
Figure 8 shows the model by which the matched point cloud data was converted to a 3D solid image that indicated a mining area in the stope during the site investigation. This 3D solid image was made using the automatic TIN mesh generation option of the Geomagic studio software. The volume analysis results revealed the total volume of the mining area to be 44,400 m
3. Thus, at the time of the site investigation, the mining quantity could be estimated at 119,800 tons, considering that the unit weight of limestone was 2.7 ton/m
3 (
Figure 9).
3.3.1. Cross-Section Analysis
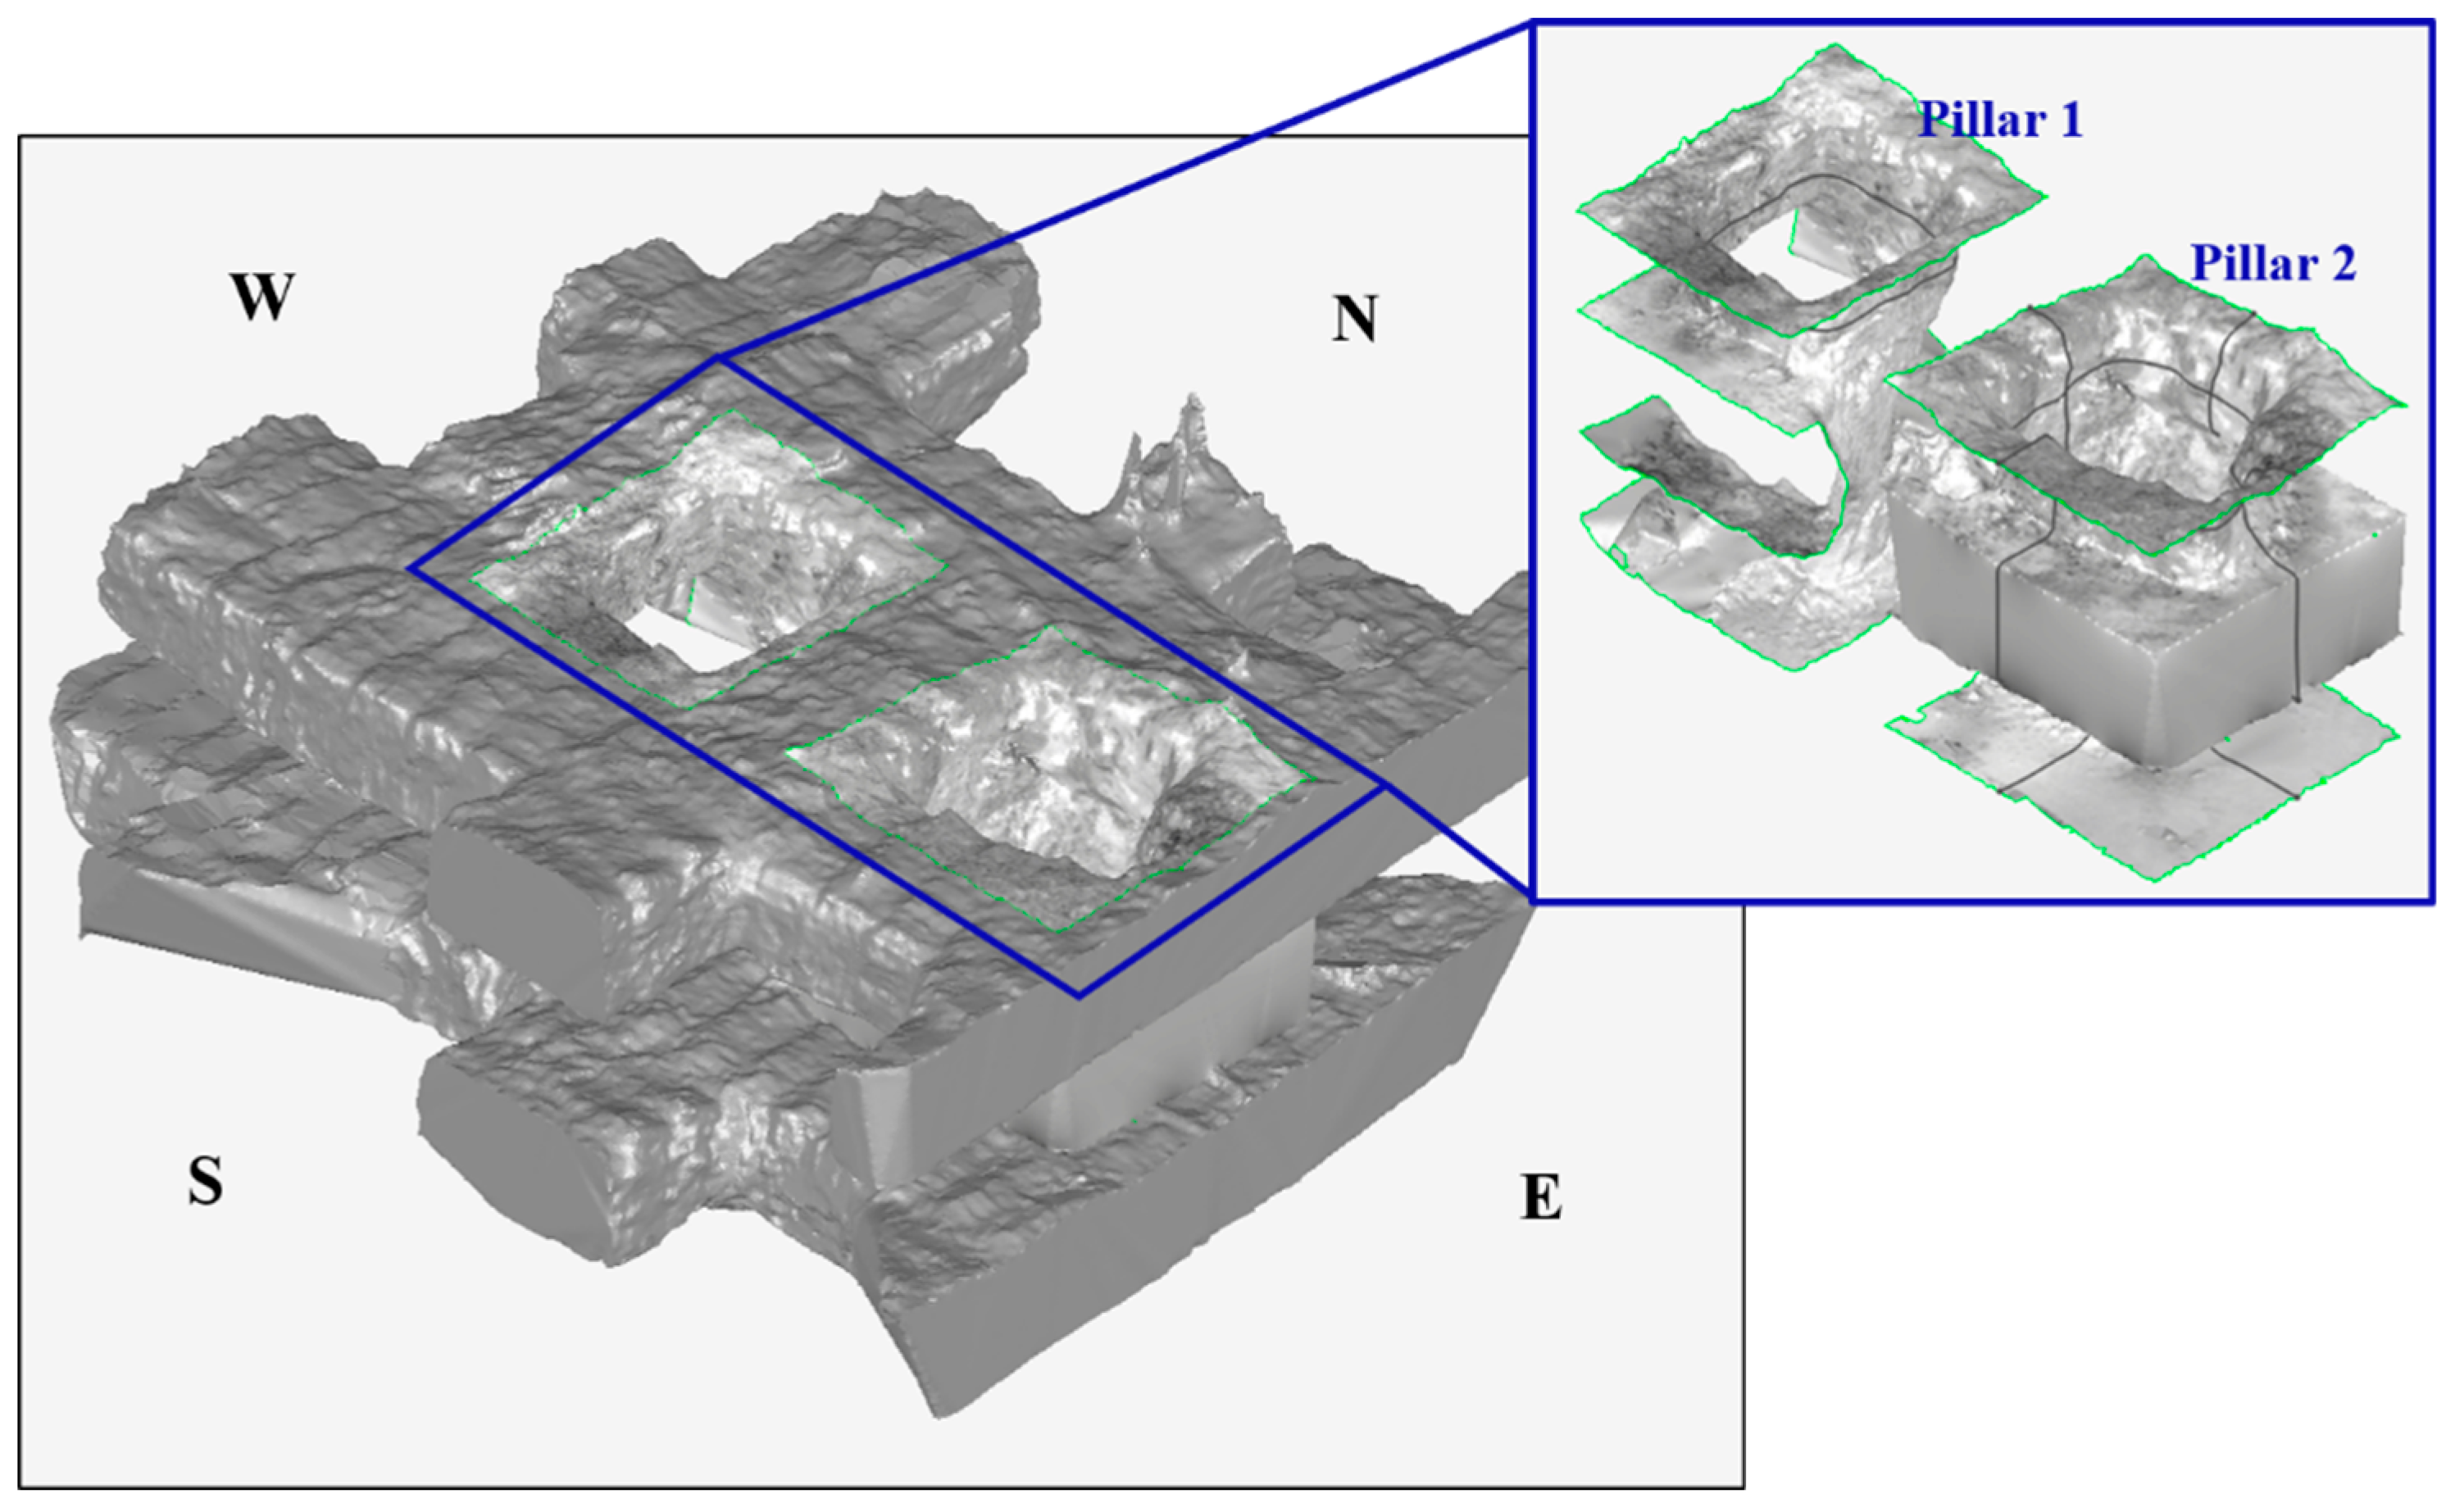
The 3D solid model was employed for length surveying and a cross-section analysis of the area where a 22-m-high vertical safety pillar would later be formed. Once the mining work in the test area was complete, a total of four vertical safety pillars were left in the stope. However, the surveying work was conducted when the final excavation faces of the No. 1 vertical safety pillar (Pillar 1) and No. 2 vertical safety pillar (Pillar 2) were about 80% formed, as shown in
Figure 10. Thus, the cross-section analysis was based on these two vertical safety pillars.
Because crushed stones were piled up in the west area of the Lv520 stope due to the recovery work on the horizontal safety pillar, it was not accessible, so accurate surveying work could not be performed in that area. Thus, for the analysis of Pillar 1, cross-section analysis was conducted at the Lv540 stope area. For the analysis of Pillar 2, both cross-section and longitudinal section analyses were conducted around the vertical safety pillars formed at the Lv520 and Lv540 stopes. The shapes of cross-section and longitudinal section were extracted using Geomagic studio software for section analysis. The measurement module of software was used for the length and area analysis of each section.
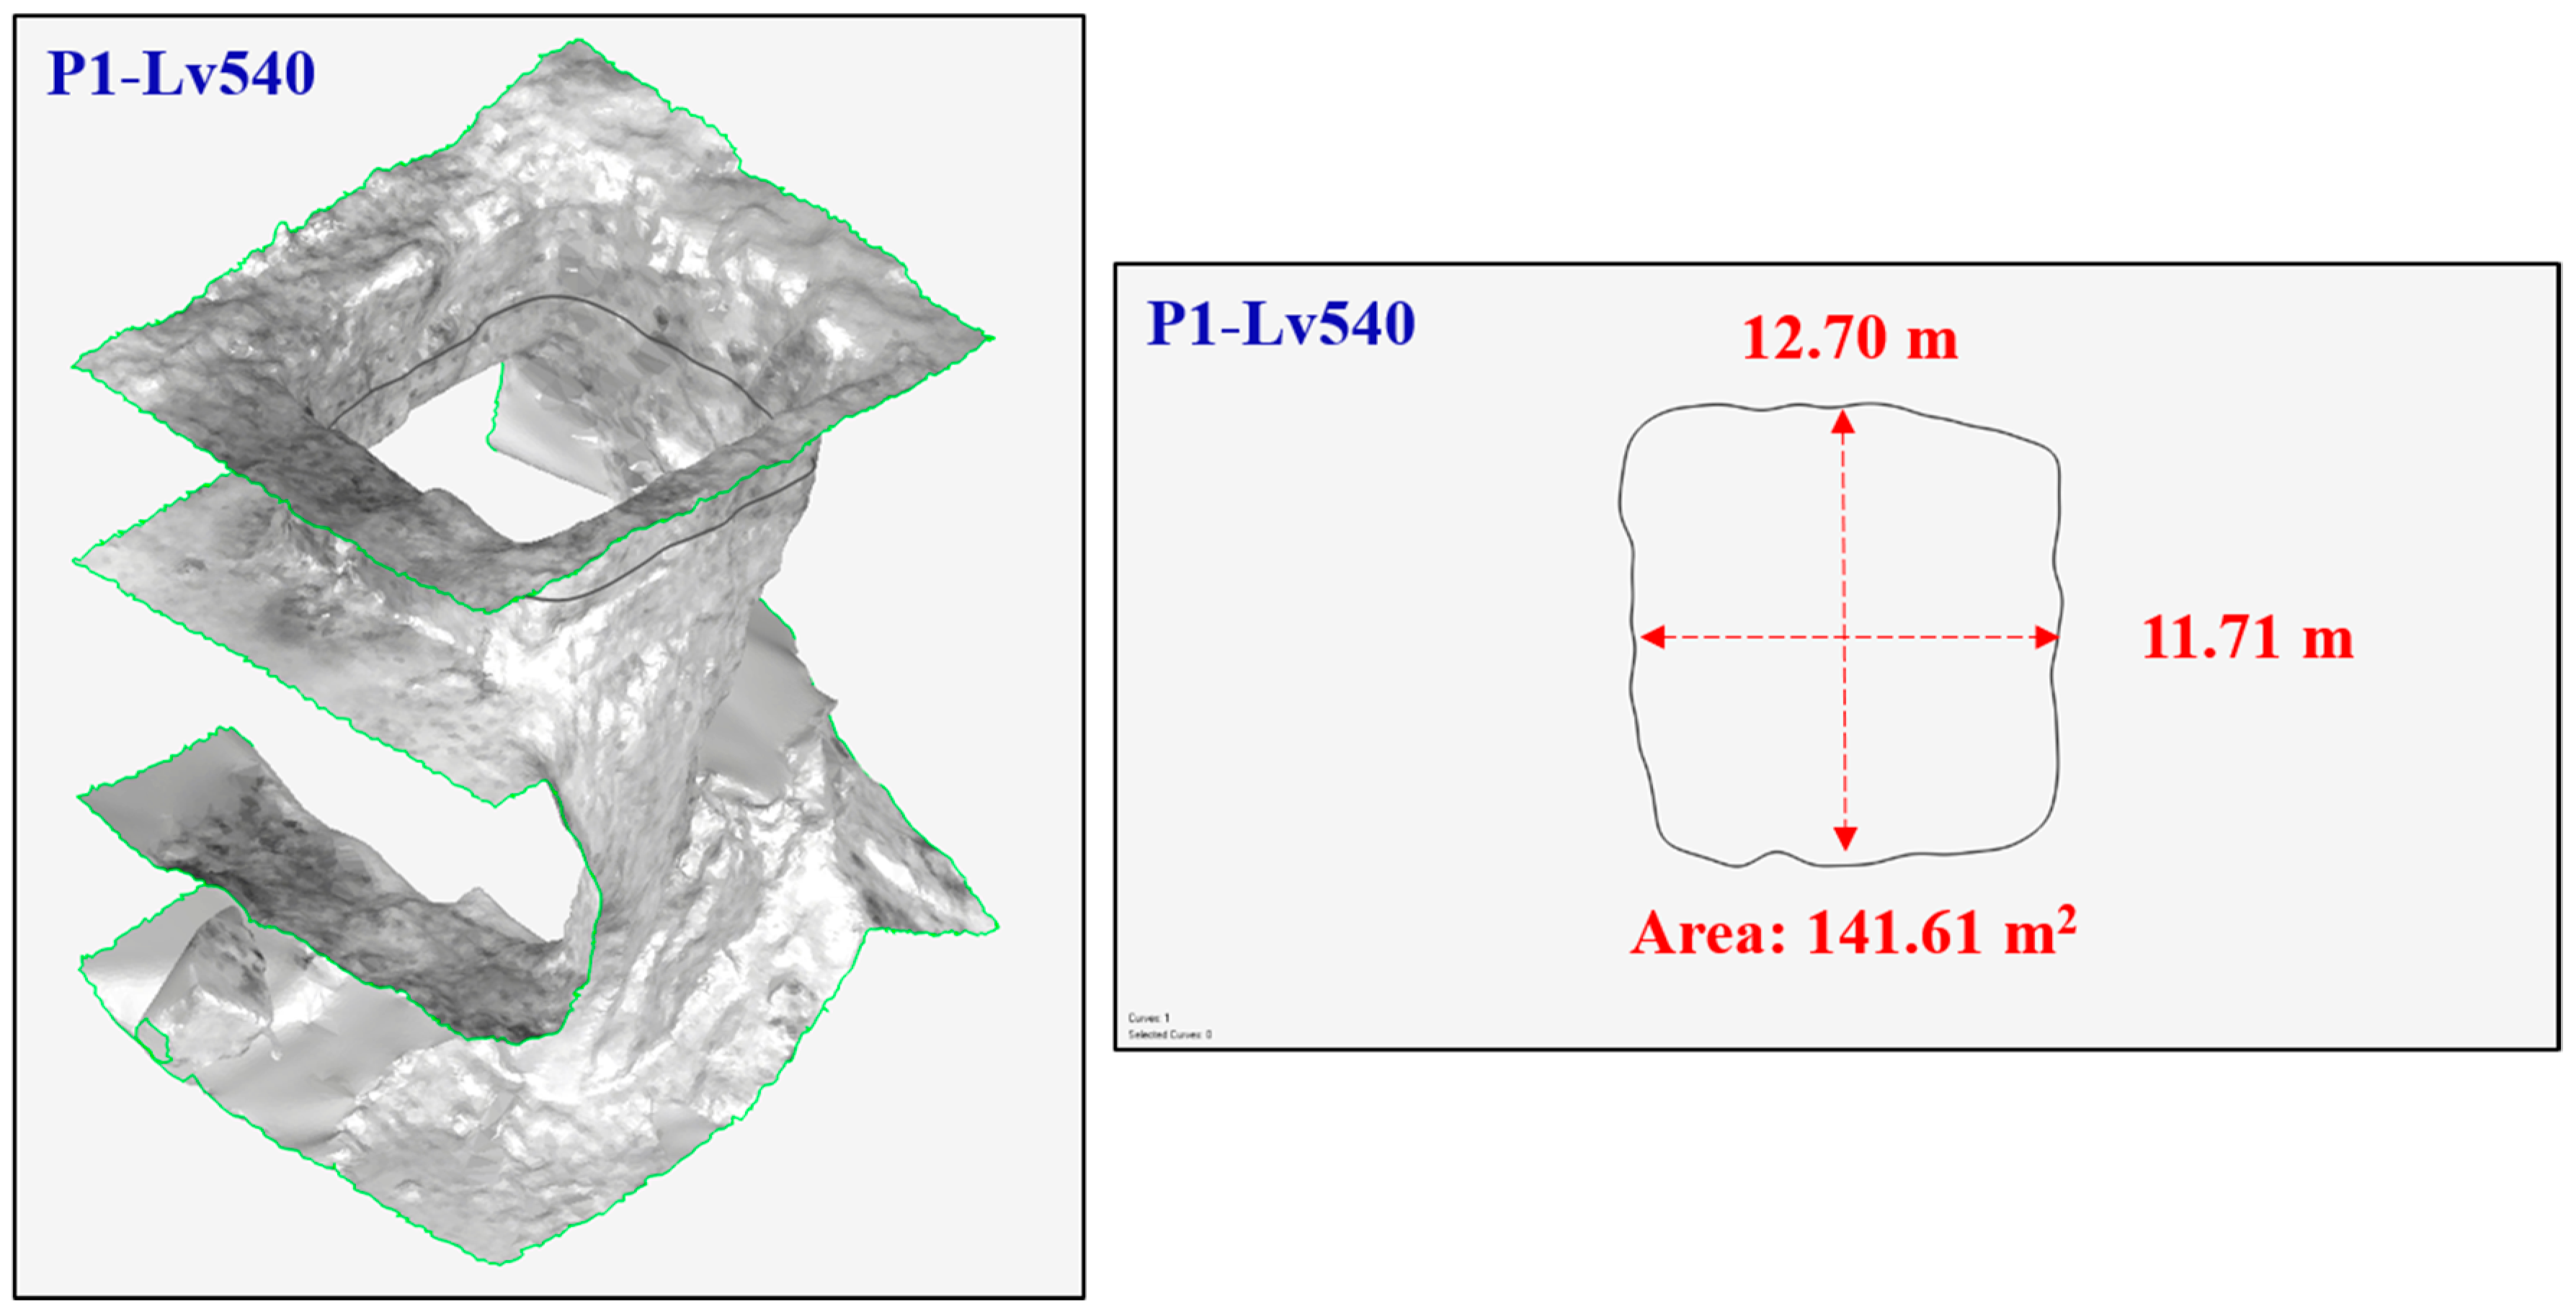
The cross-section analysis results for Pillar 2 indicated that the dimensions of the cross-section of Pillar 1 formed in the Lv540 stope were 11.71 m wide and 12.70 m long, with an area of approximately 141.61 m
2 (
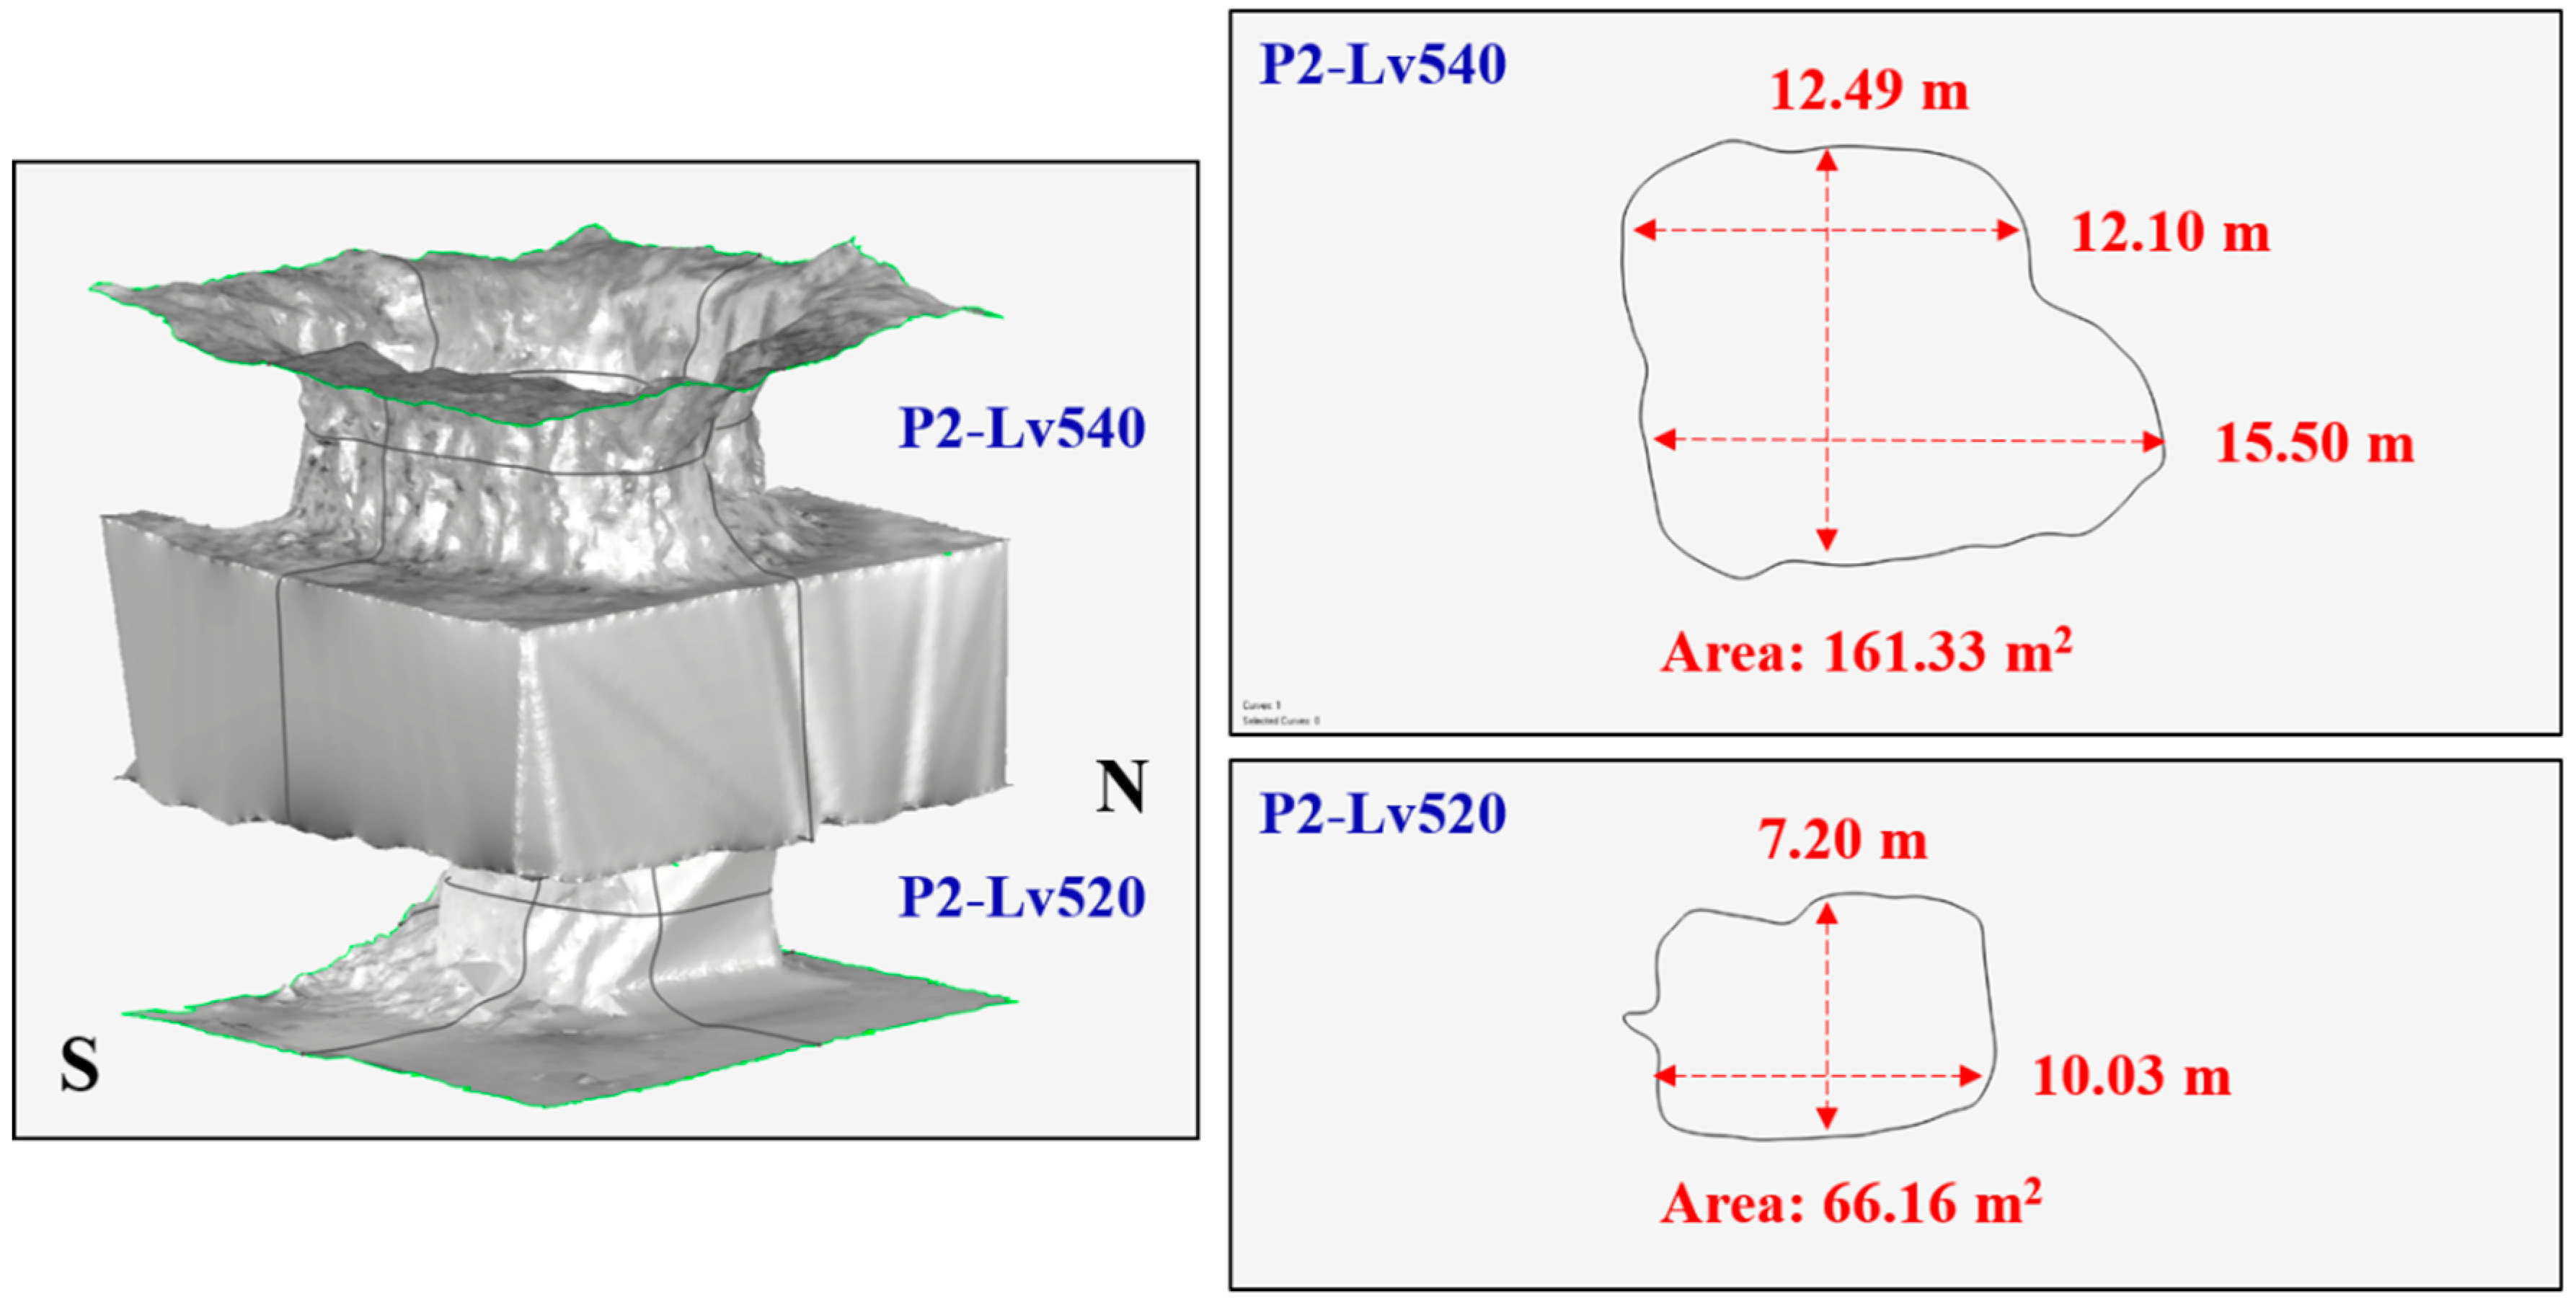
Figure 11). The shape of Pillar 2 formed in the Lv540 stope was more irregular than that of Pillar 1, with dimensions of 12.10 m to 15.50 m wide and 12.49 m long, and an area of approximately 161.33 m
2 (
Figure 12). By contrast, the cross-section area of Pillar 2 formed in the Lv520 stope was 66.16 m
2, smaller than that of the vertical safety pillar in the Lv540 stope by 95.17 m
2.
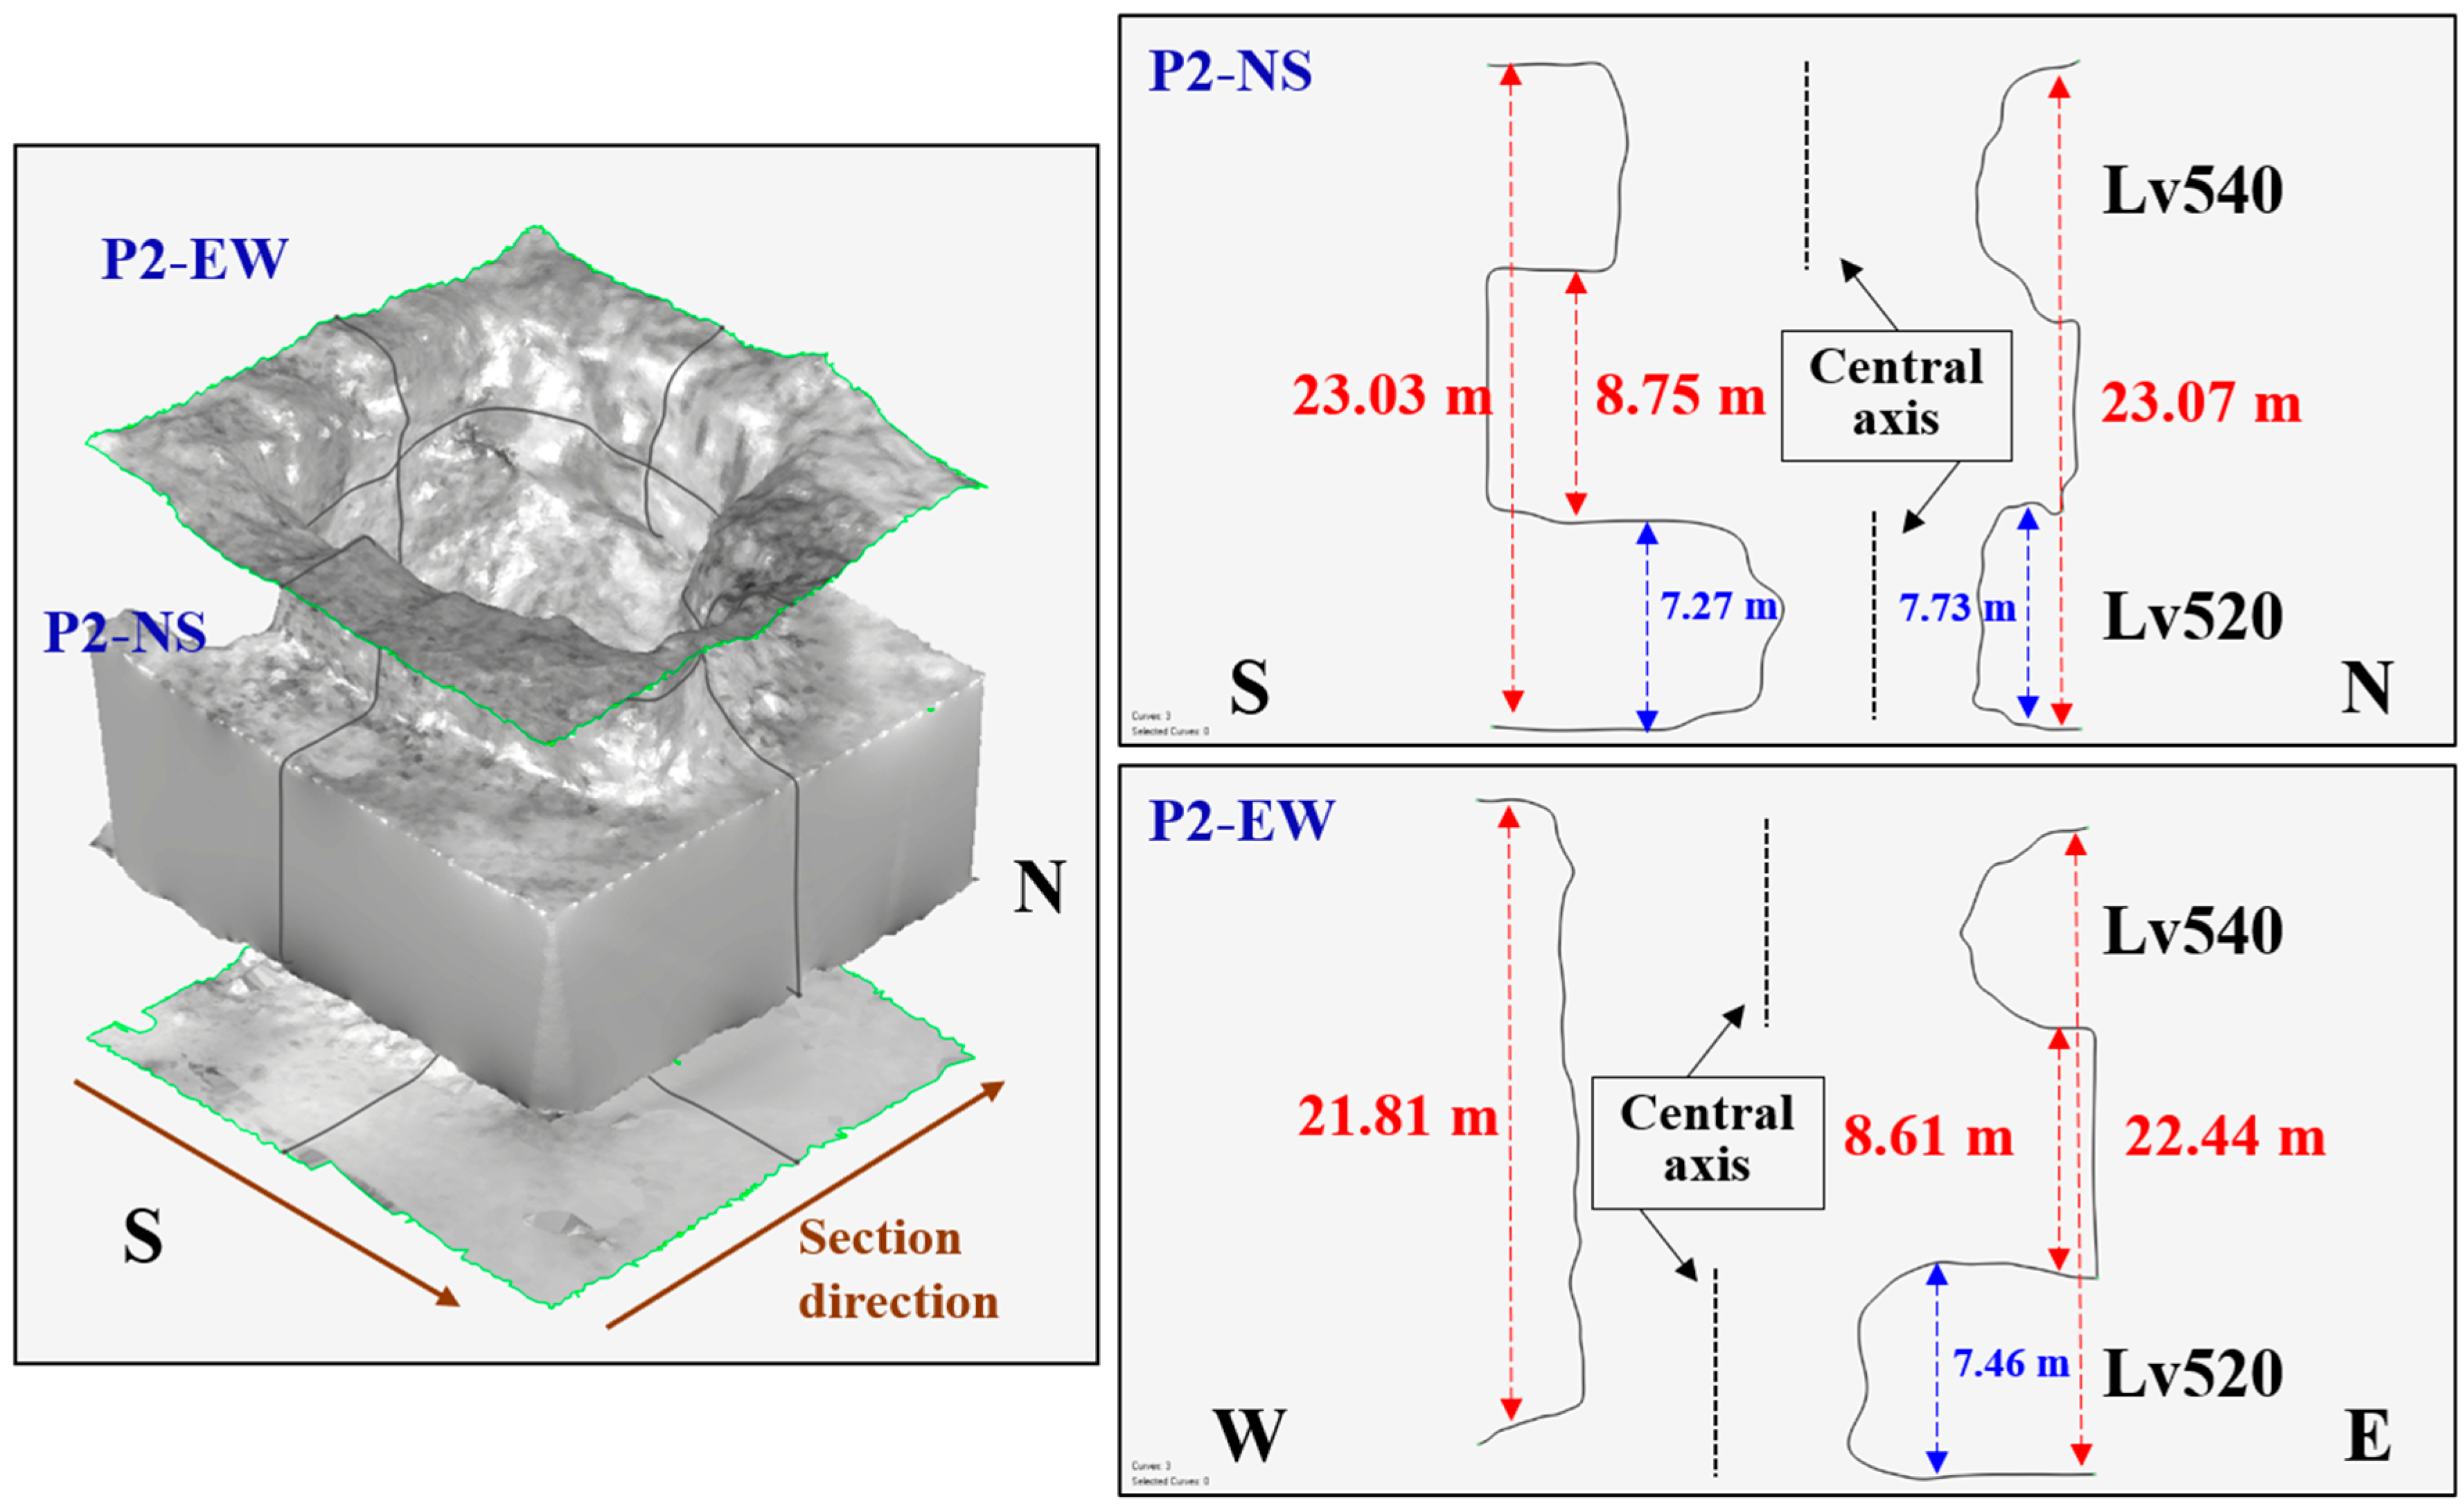
The analysis results for the longitudinal section of Pillar 2 showed that the height of the vertical safety pillar was about 22.00 m in the P2-NS cross-section and approximately 23 m at the P2-EW cross-section, and its average height was approximately 22.50 m (
Figure 13).
The above cross-section analysis results and design data of the hybrid room-and-pillar mining method were compared and analyzed. The cross-section area of the vertical safety pillar was designed to be 10 m wide and 10 m long (giving an area of 100 m2), but the actual cross-section area of the vertical safety pillar formed in the stope was in the range of 66.16 m2 to 161.33 m2.
The results of the analysis verified that over-break and under-break areas were present locally in the vertical safety pillar formed in the stope. In addition, not only was the cross-section area of the vertical safety pillar formed in the Lv520 stope smaller than that of the vertical safety pillar formed in the Lv540 stope, but the center axis of the vertical safety pillar deviated to the north west (
Figure 12 and
Figure 13).
This was due to the geological factor being the same as the joint distributed around the vertical safety pillar. As steep dip joints over 70° were distributed in the stope, the over-break area deviated to the south east due to separation behavior, such as the sliding of the joint, rather than the rock-crushing effects of blasting force.
3.3.2. Analysis of Orientation of the Joint
The site investigation of the joints was conducted only at the lower section of the vertical safety pillar, which was easily accessible. In contrast, the site investigation was not conducted at inaccessible areas, such as the areas where the horizontal safety pillar was recovered and where the 22 m high excavation face was formed. To overcome this site investigation challenge, a Realworks software-embedded joint orientation analysis module and a 3D point cloud were used to perform accurate and in-depth analysis of the orientation of the joints distributed around the entire stope.
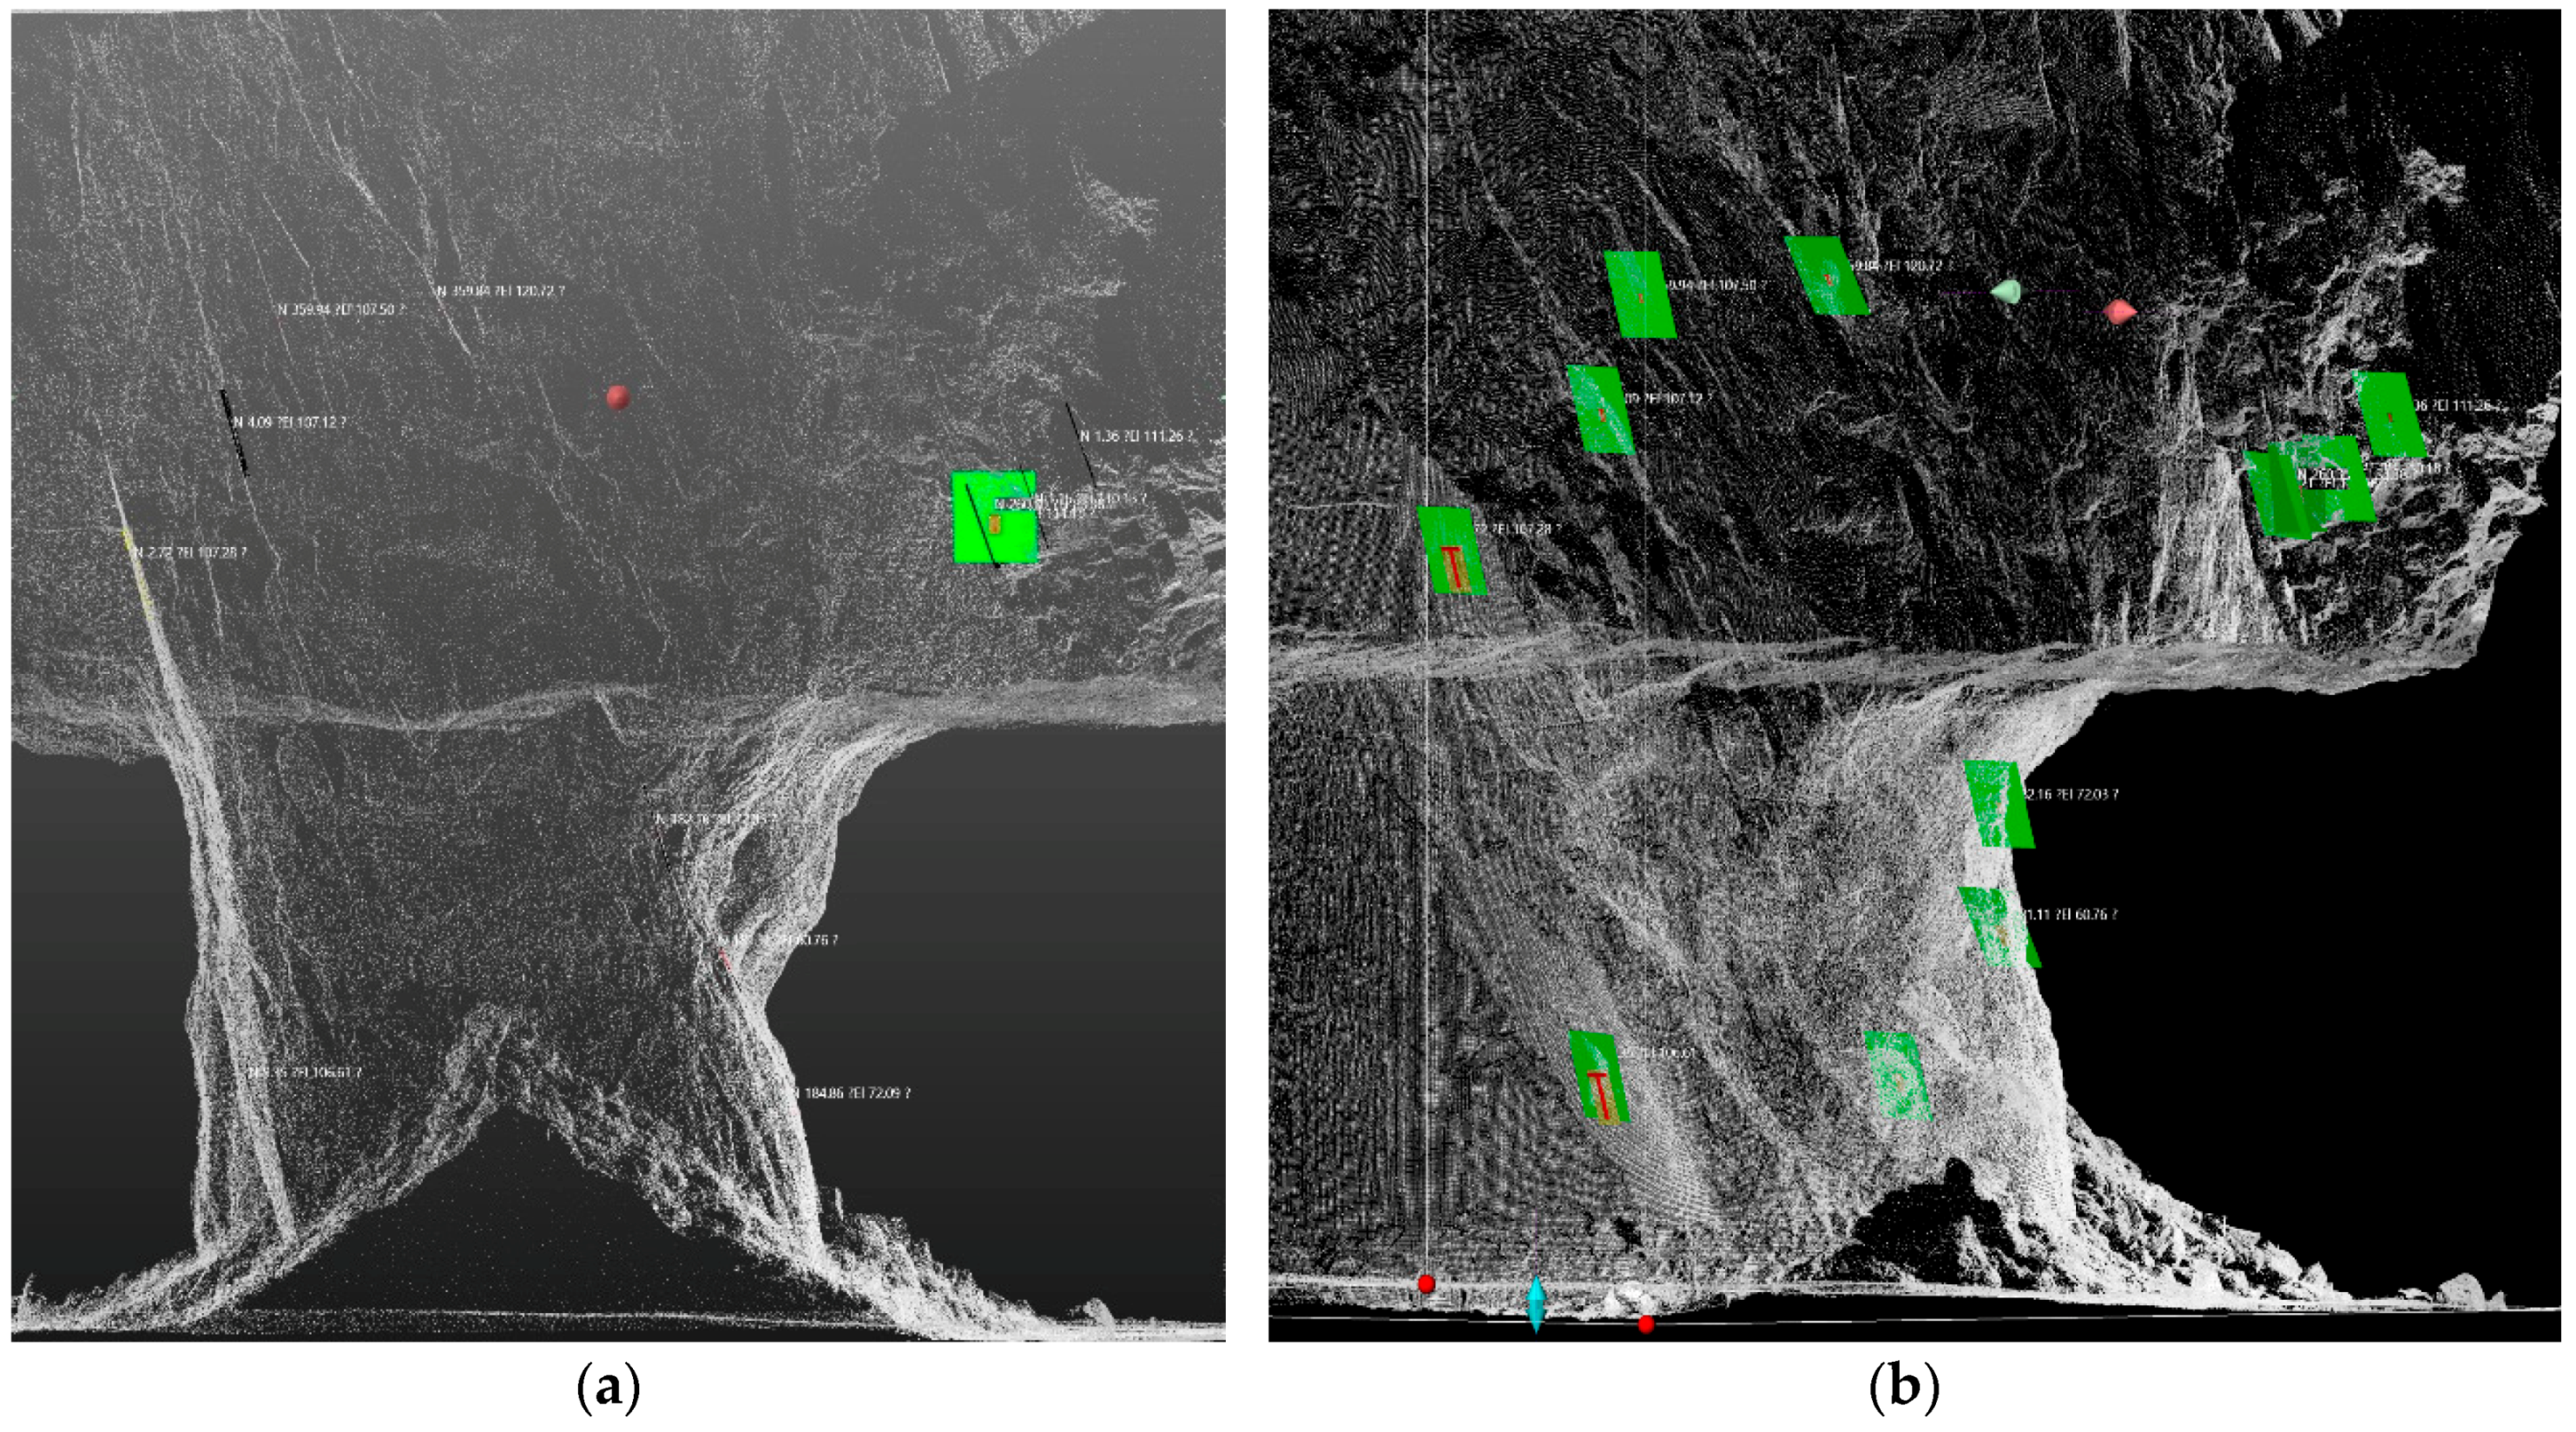
Figure 14 and
Figure 15 shows the 3D point cloud image of the second vertical safety pillar in the Lv520 stope and the orientation of the joints extracted from the image. Using this method, data on 79 joints with distinctive orientation were extracted from the entire stope area.
The analysis results on the orientation of the joints showed that the dip direction/dip of joint set 1 was 185/70 and that of set 2 was 277/70.
As verified from cross-section analysis and orientation analysis results in
Figure 14, the over-break occurred in the vertical safety pillar in the Lv520 stope. This over-break was concentrated in a southerly direction because the separation behavior of joint surface was caused by the effect of joint set 1 and blasting work.
Permanent support and reinforcement work are generally not conducted in the stope due to the characteristics of mine sites. The hybrid room-and-pillar mining method was pilot-operated to improve ore recovery in the stope in the test area. Thus, reinforcement work was already conducted with shotcrete and rockbolt at the vertical safety pillar and roofs to ensure the safety of workers and external visitors who visited the test area for research purposes.
Currently, no unstable factors were found during the mining phase. However, the center axes of Pillar 2 formed in the Lv540 and Lv520 stopes were not matched, and the cross-section areas differed. In addition, steep dip joints that could affect the stability of the vertical safety pillar were distributed. As such, stability analysis would be necessary for safer mining work.
4. Discontinuum Numerical Analysis for Stability Analysis in the Stope
Safety diagnosis and reinforcement measures are necessary to ensure stability in the vertical safety pillar during the mining period. This study performed 3D discontinuum numerical analysis, utilizing 3D point cloud data acquired at the site, to analyze the stability of the stope.
4.1. Numerical Analysis Model
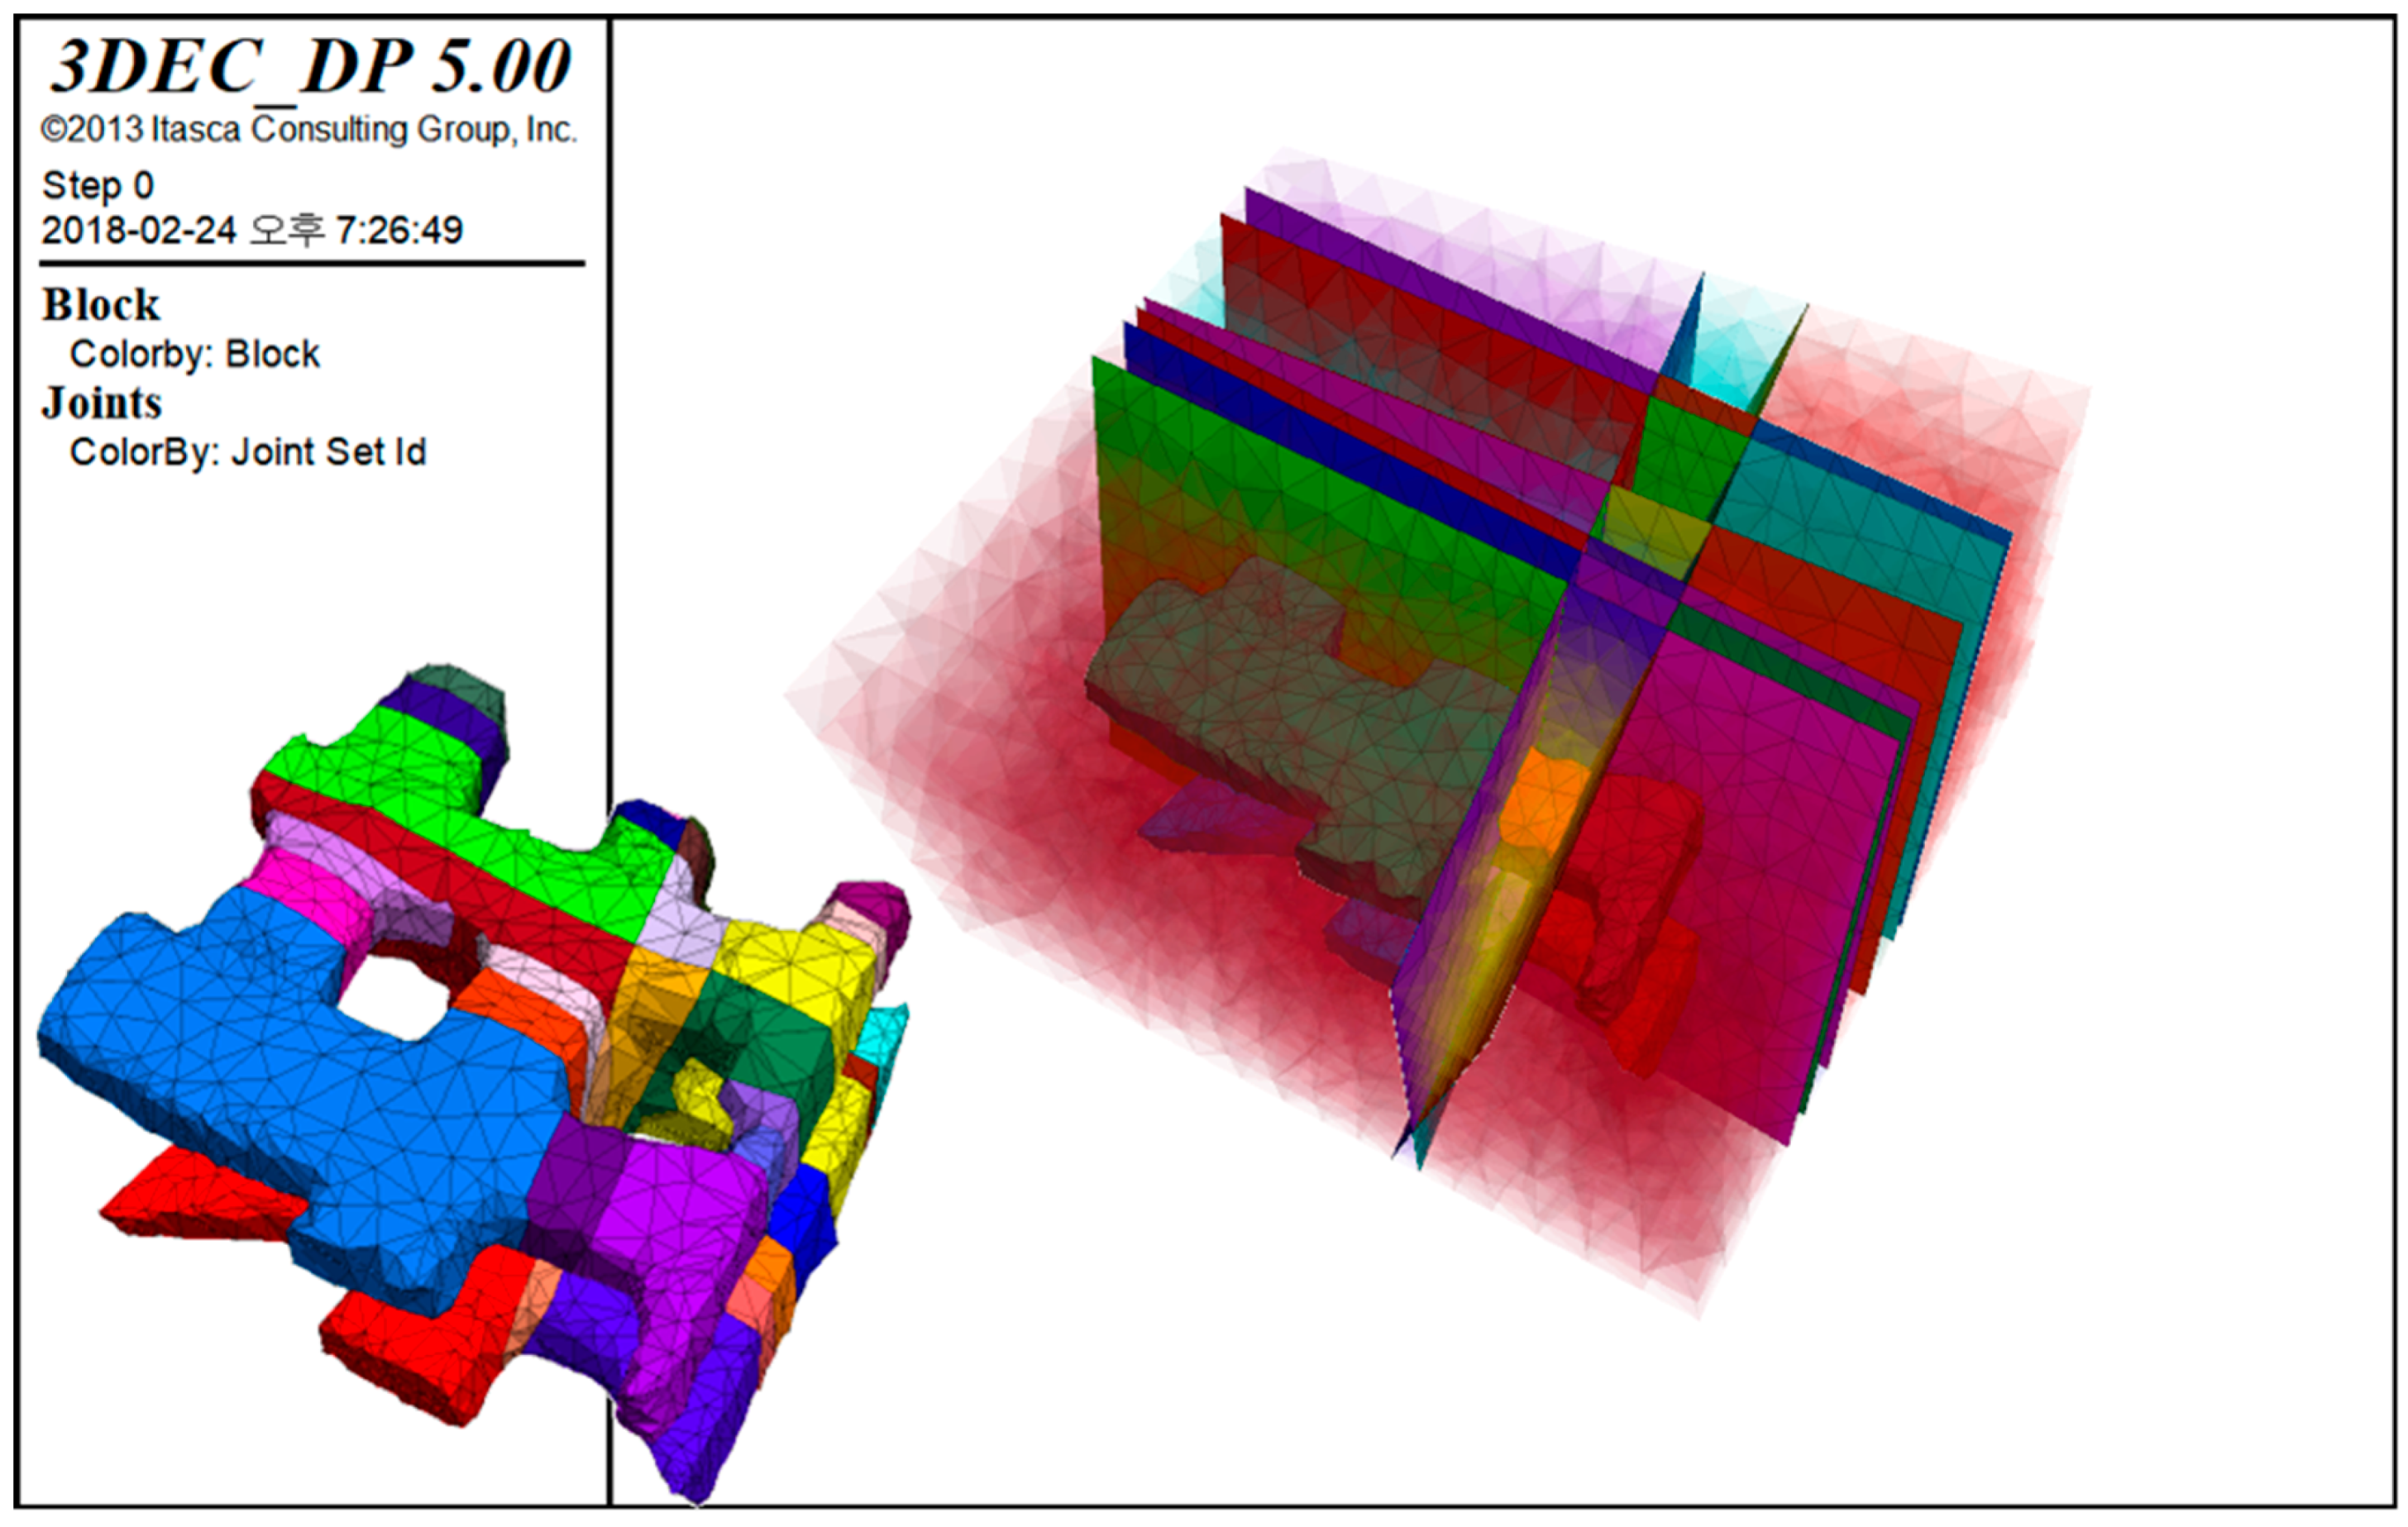
The numerical analysis model consisted of 3D block models created in the 3DEC software package using 3D point cloud data and used the Griddle software package to reflect the actual shape of the stope. In addition, the boundary of the model was set to 100 m × 80 m × 40 m (width × length × height, respectively), considering the boundary effect of the 3D block model and mean depth of the test area, as shown in
Figure 16.
The joint expressed in the analysis model simulated the actual joint distributed in the vertical safety pillar. To improve the efficiency of the numerical analysis, a total of eight joints with distinctive orientation were chosen from joint sets 1 and 2. These were created on the basis of the center coordinate where the orientation analysis was complete. To generate input data for numerical analysis, a ground integer set was calculated based on the indoor rock property test, and site investigation data were utilized (
Table 2 and
Table 3).
4.2. Numerical Analysis Results
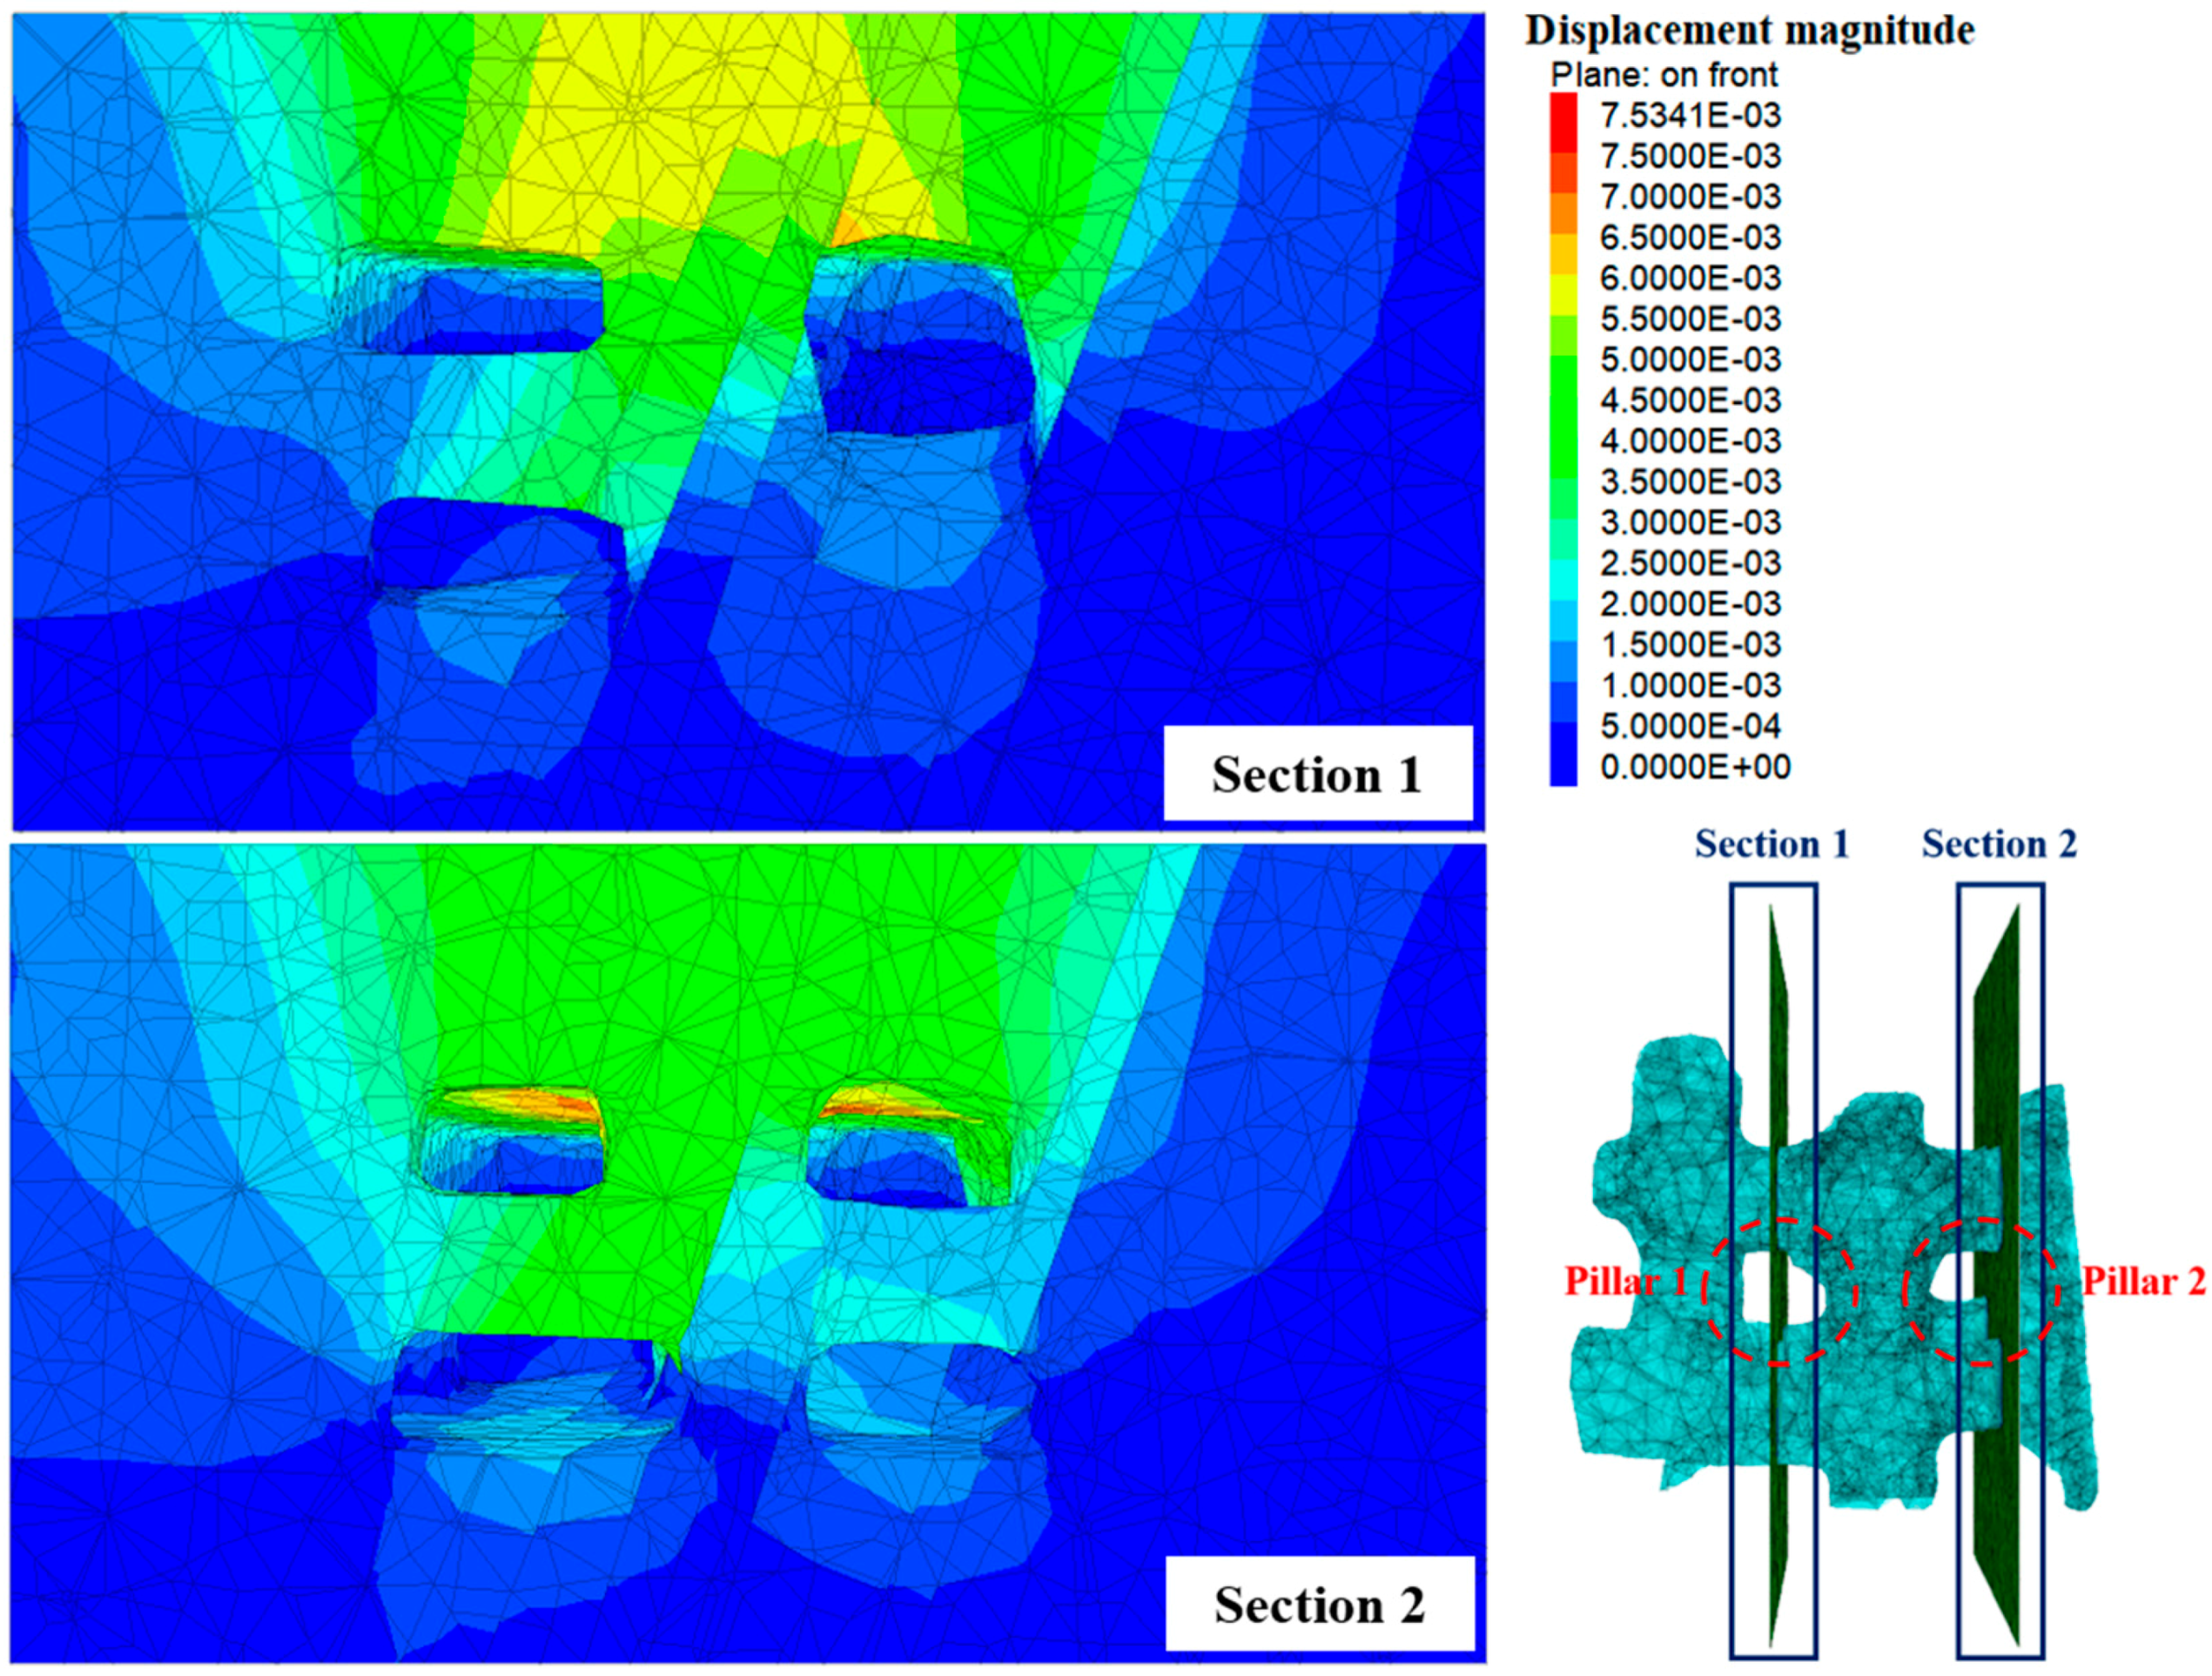
The stability analysis was conducted based on the vertical safety pillar, and an additional stability investigation was conducted for areas that posed a risk of instability.
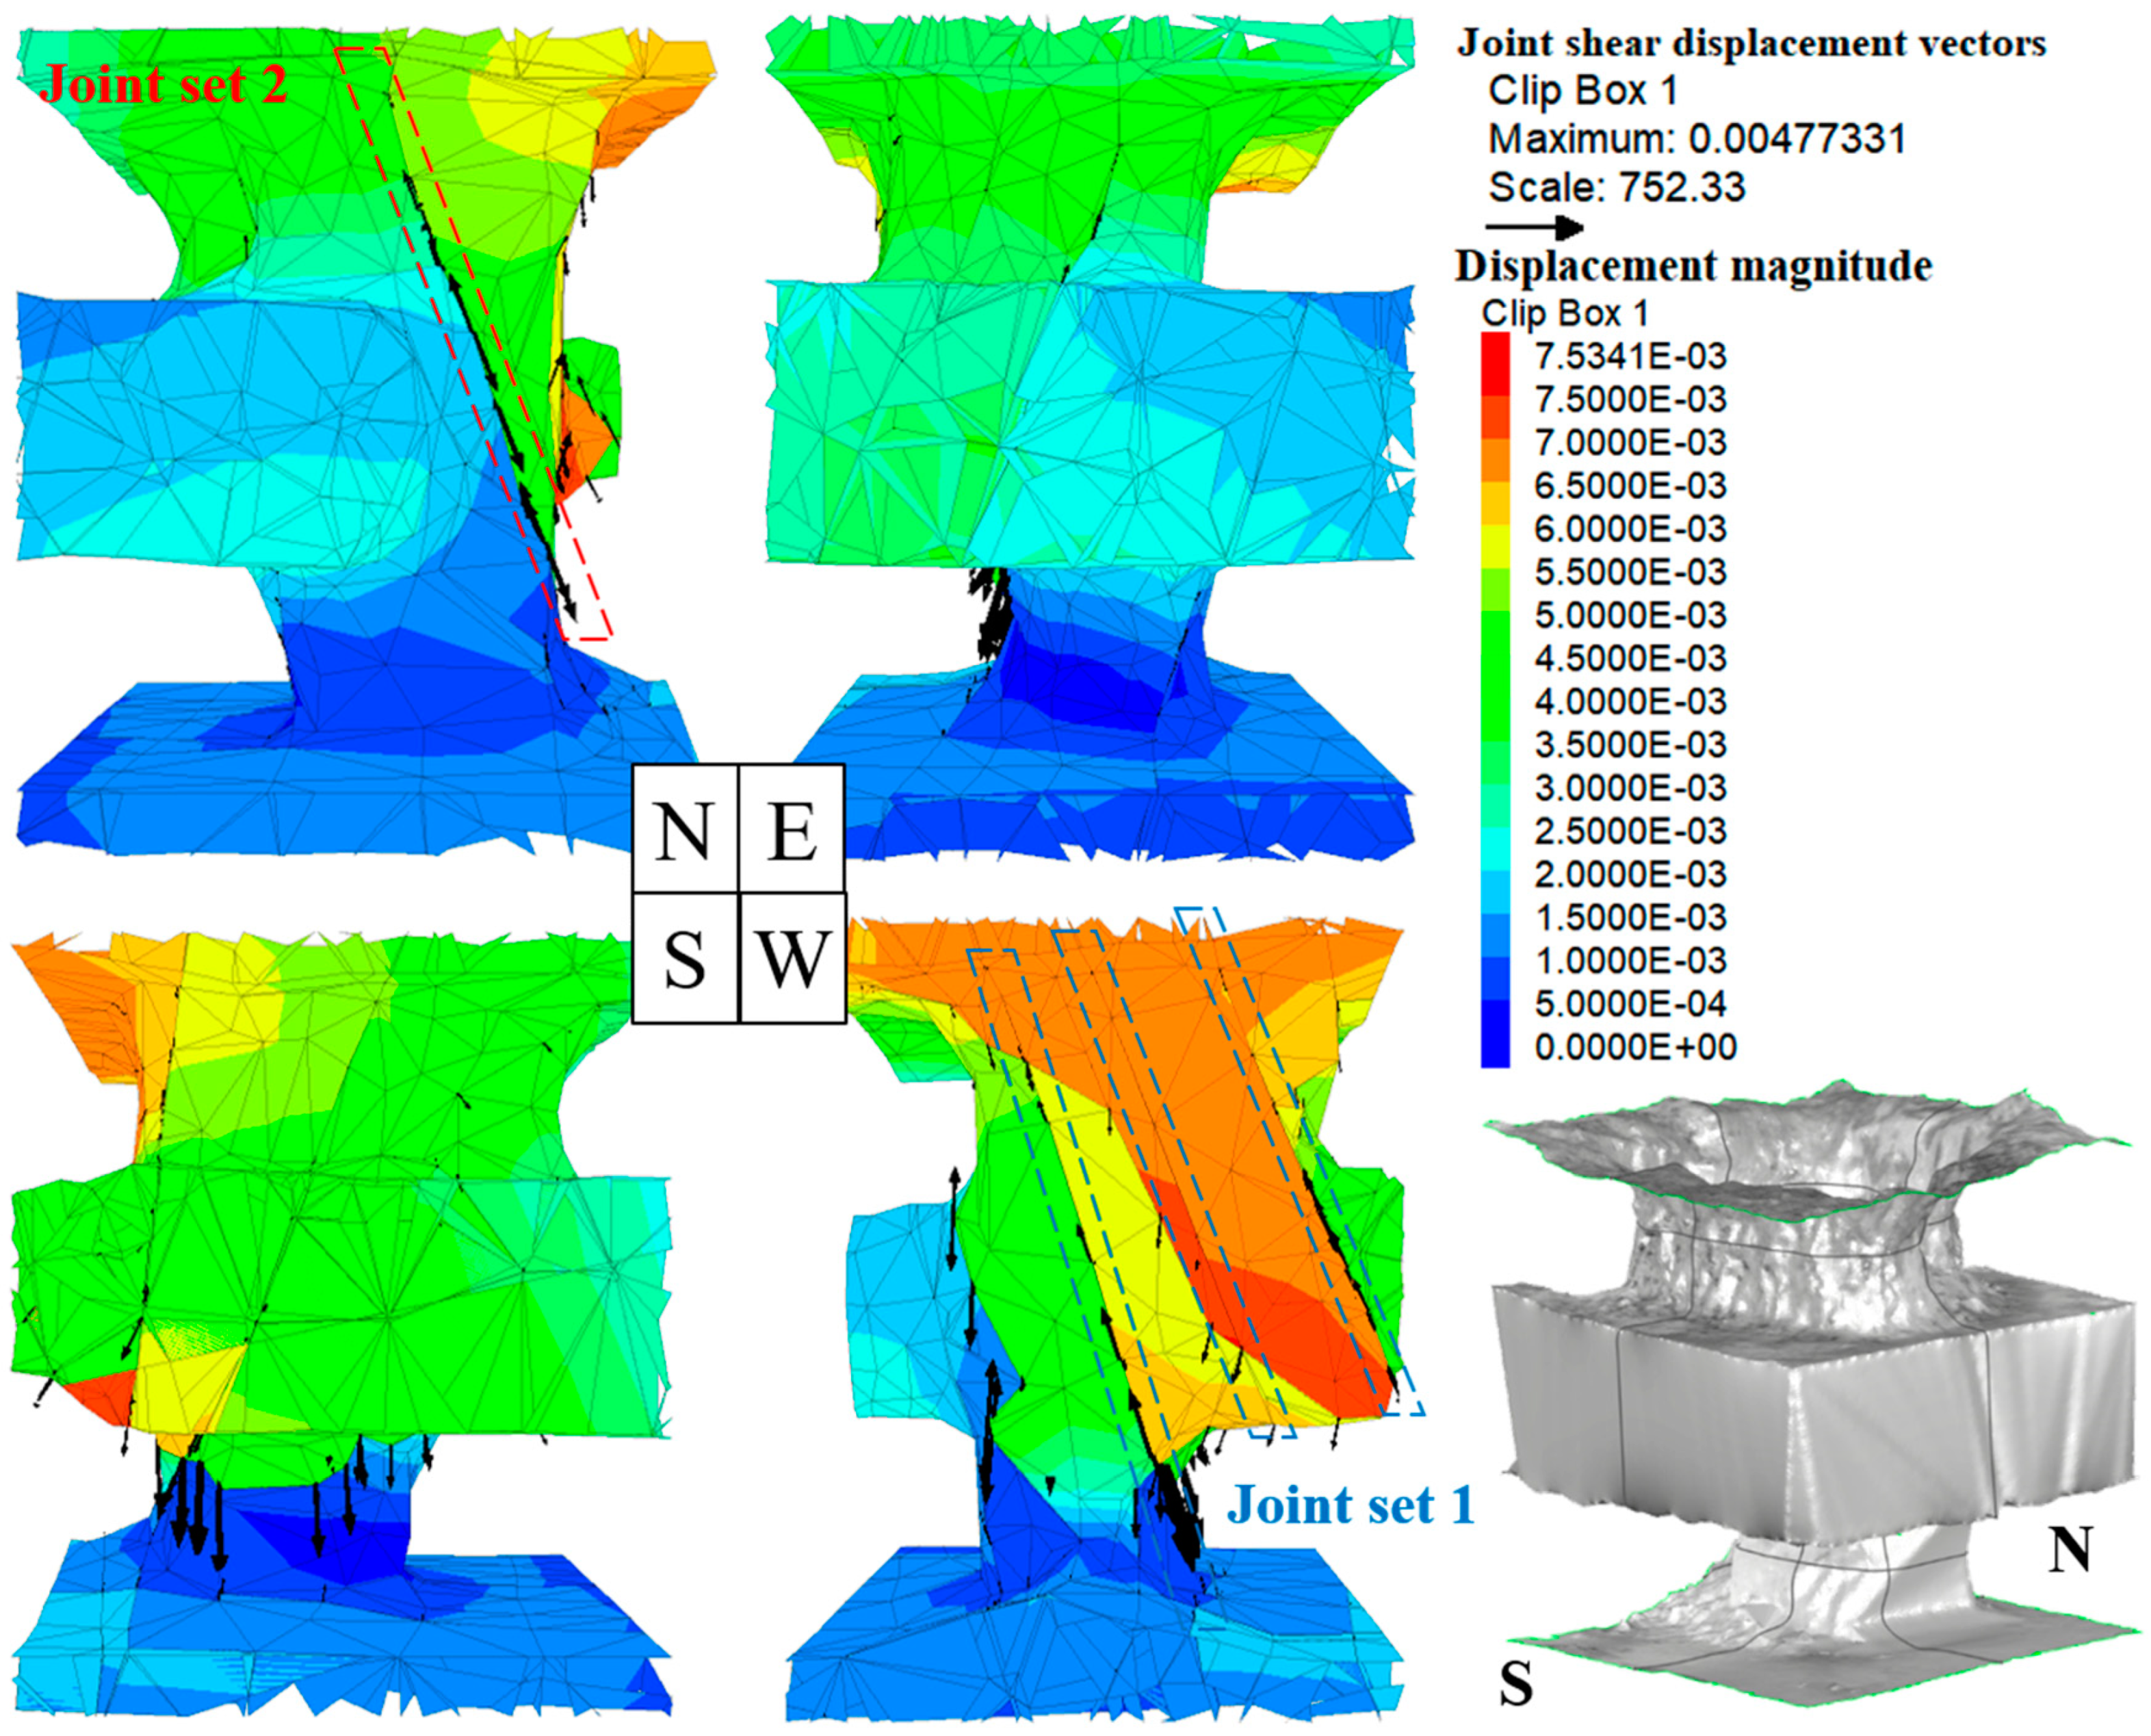
Figure 17 shows the distribution diagram of the displacement occurrence, displayed on the basis of the center cross-section of the vertical safety pillar. Maximum displacement occurred in the stope at approximately 7 mm. The maximum displacement that occurred in Pillar 2 was a southerly shear displacement of up to 5 mm, a dip direction for joint set 1 and, in the westerly direction, a dip direction for joint set 2 (
Figure 18). However, since the displacement that occurred was relatively small, no significant stability problems would be expected currently in the stope and vertical safety pillar during the mining phase.
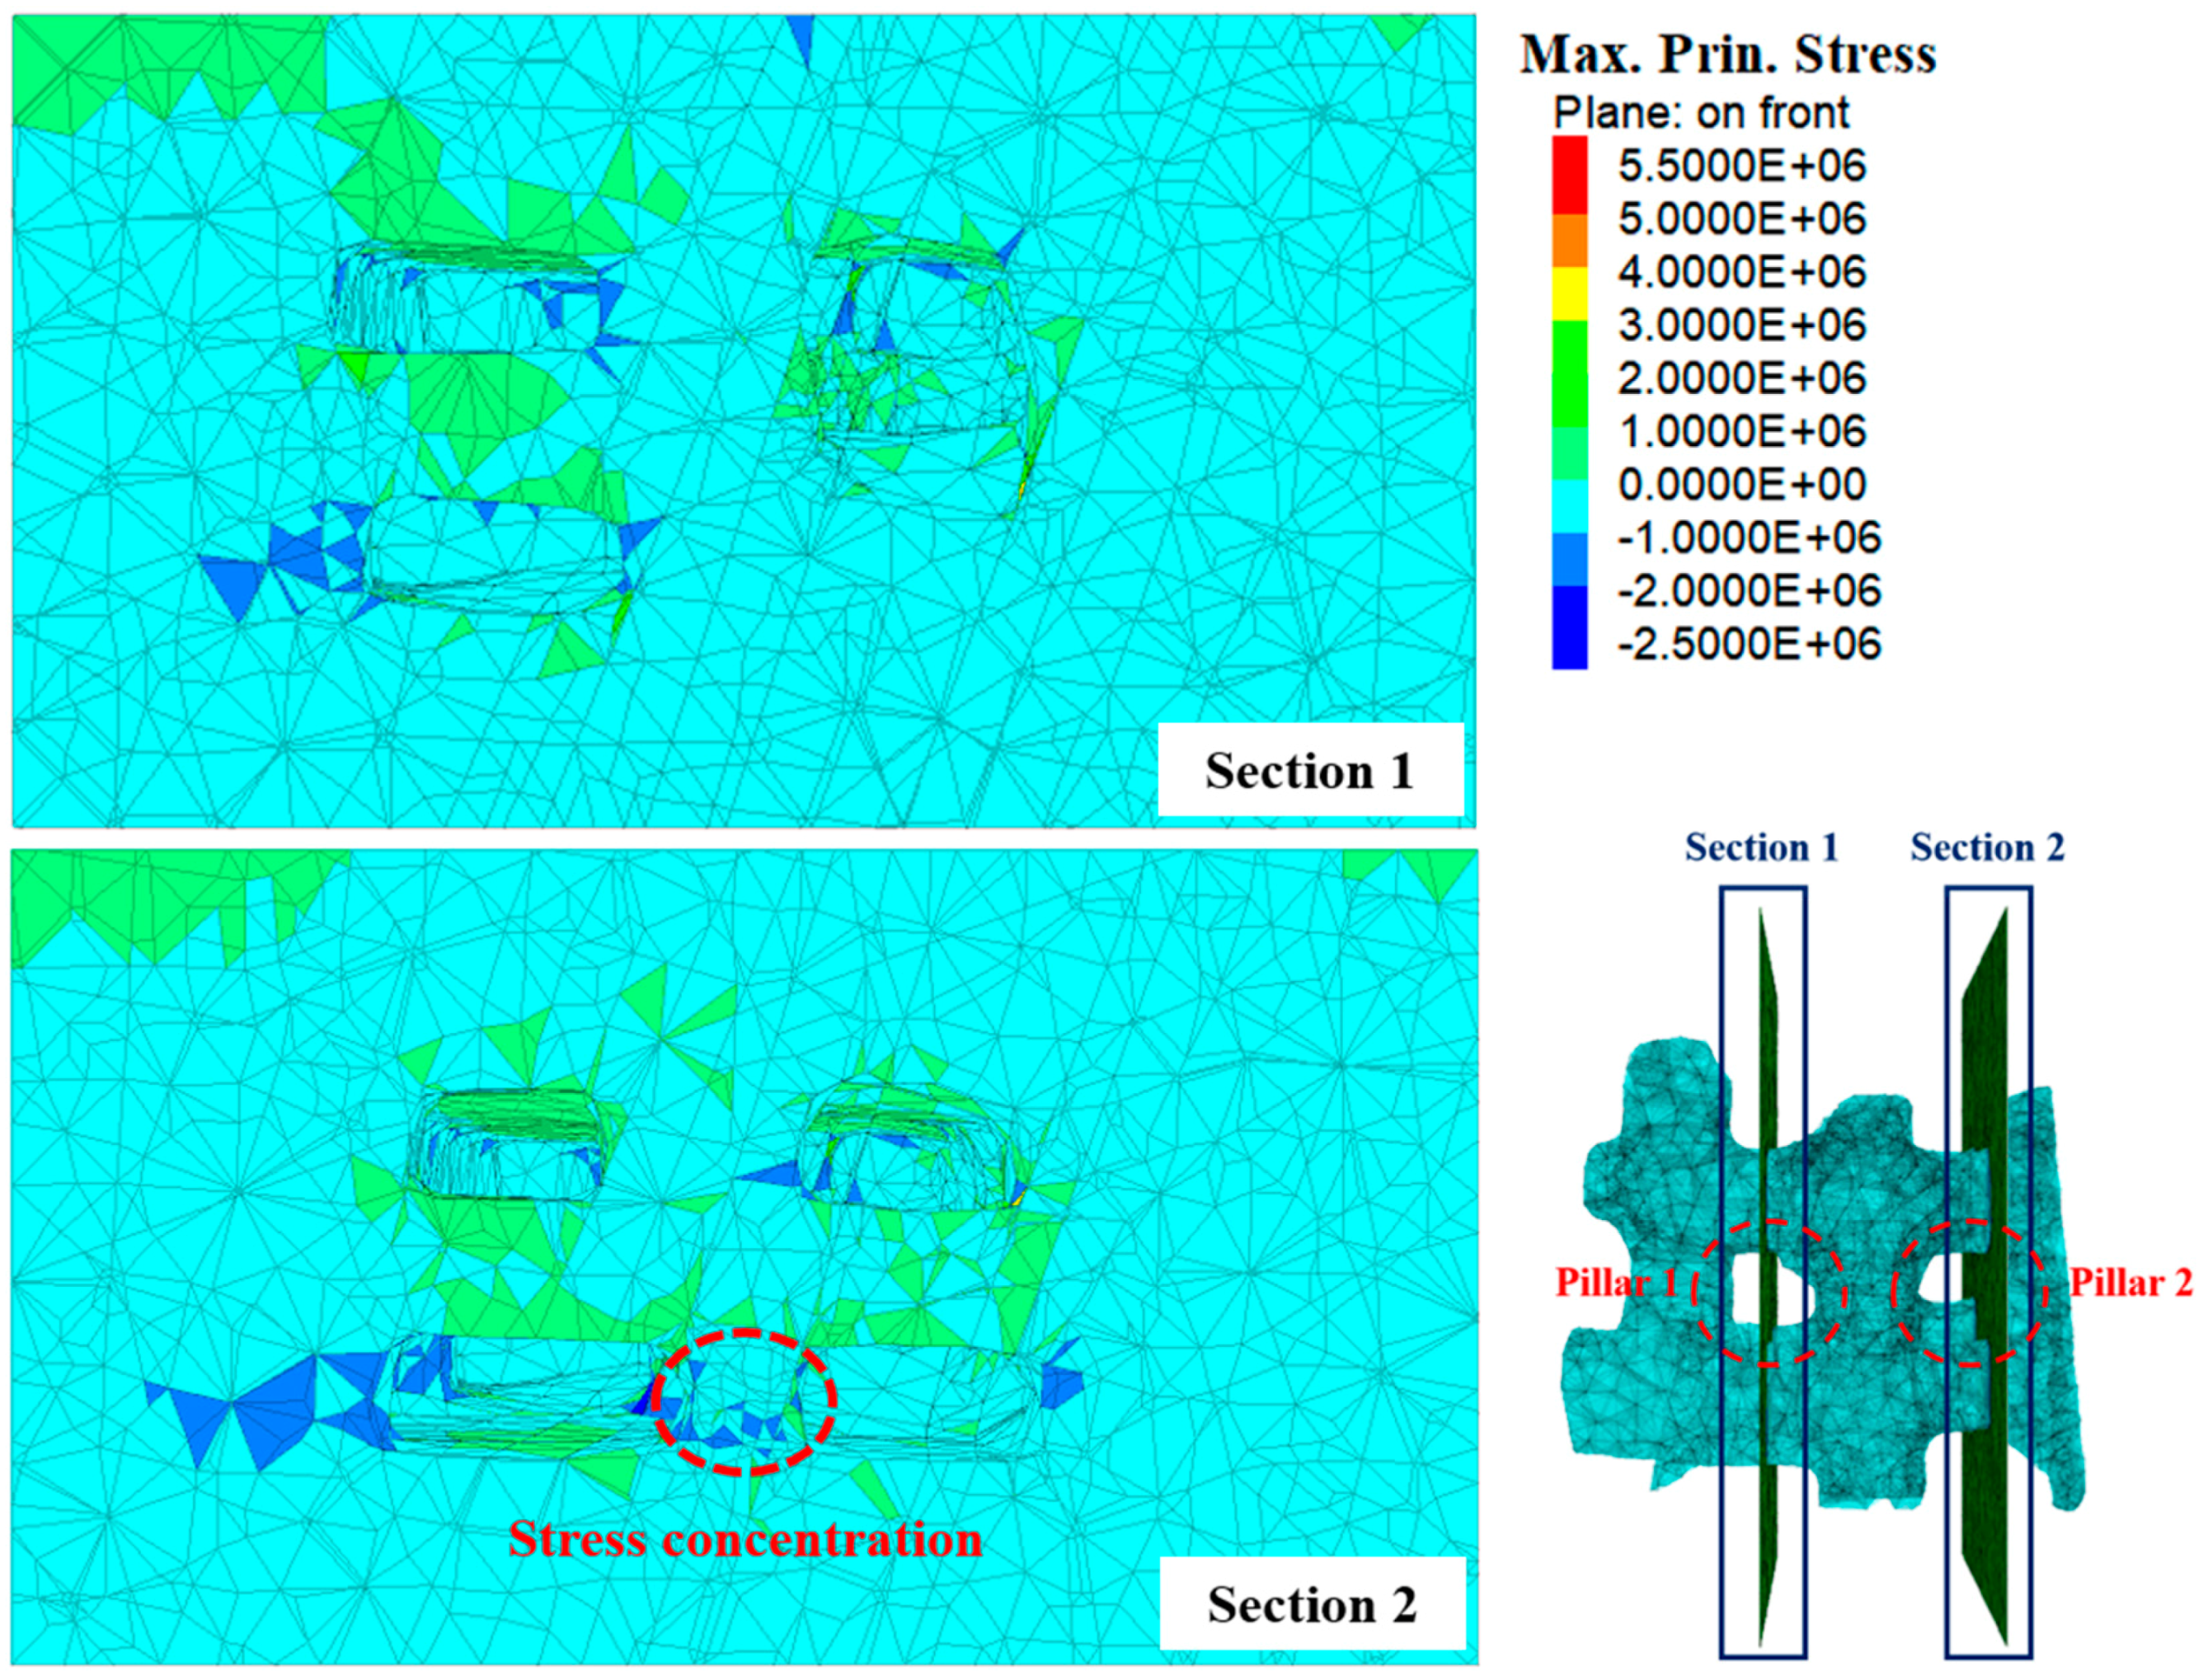
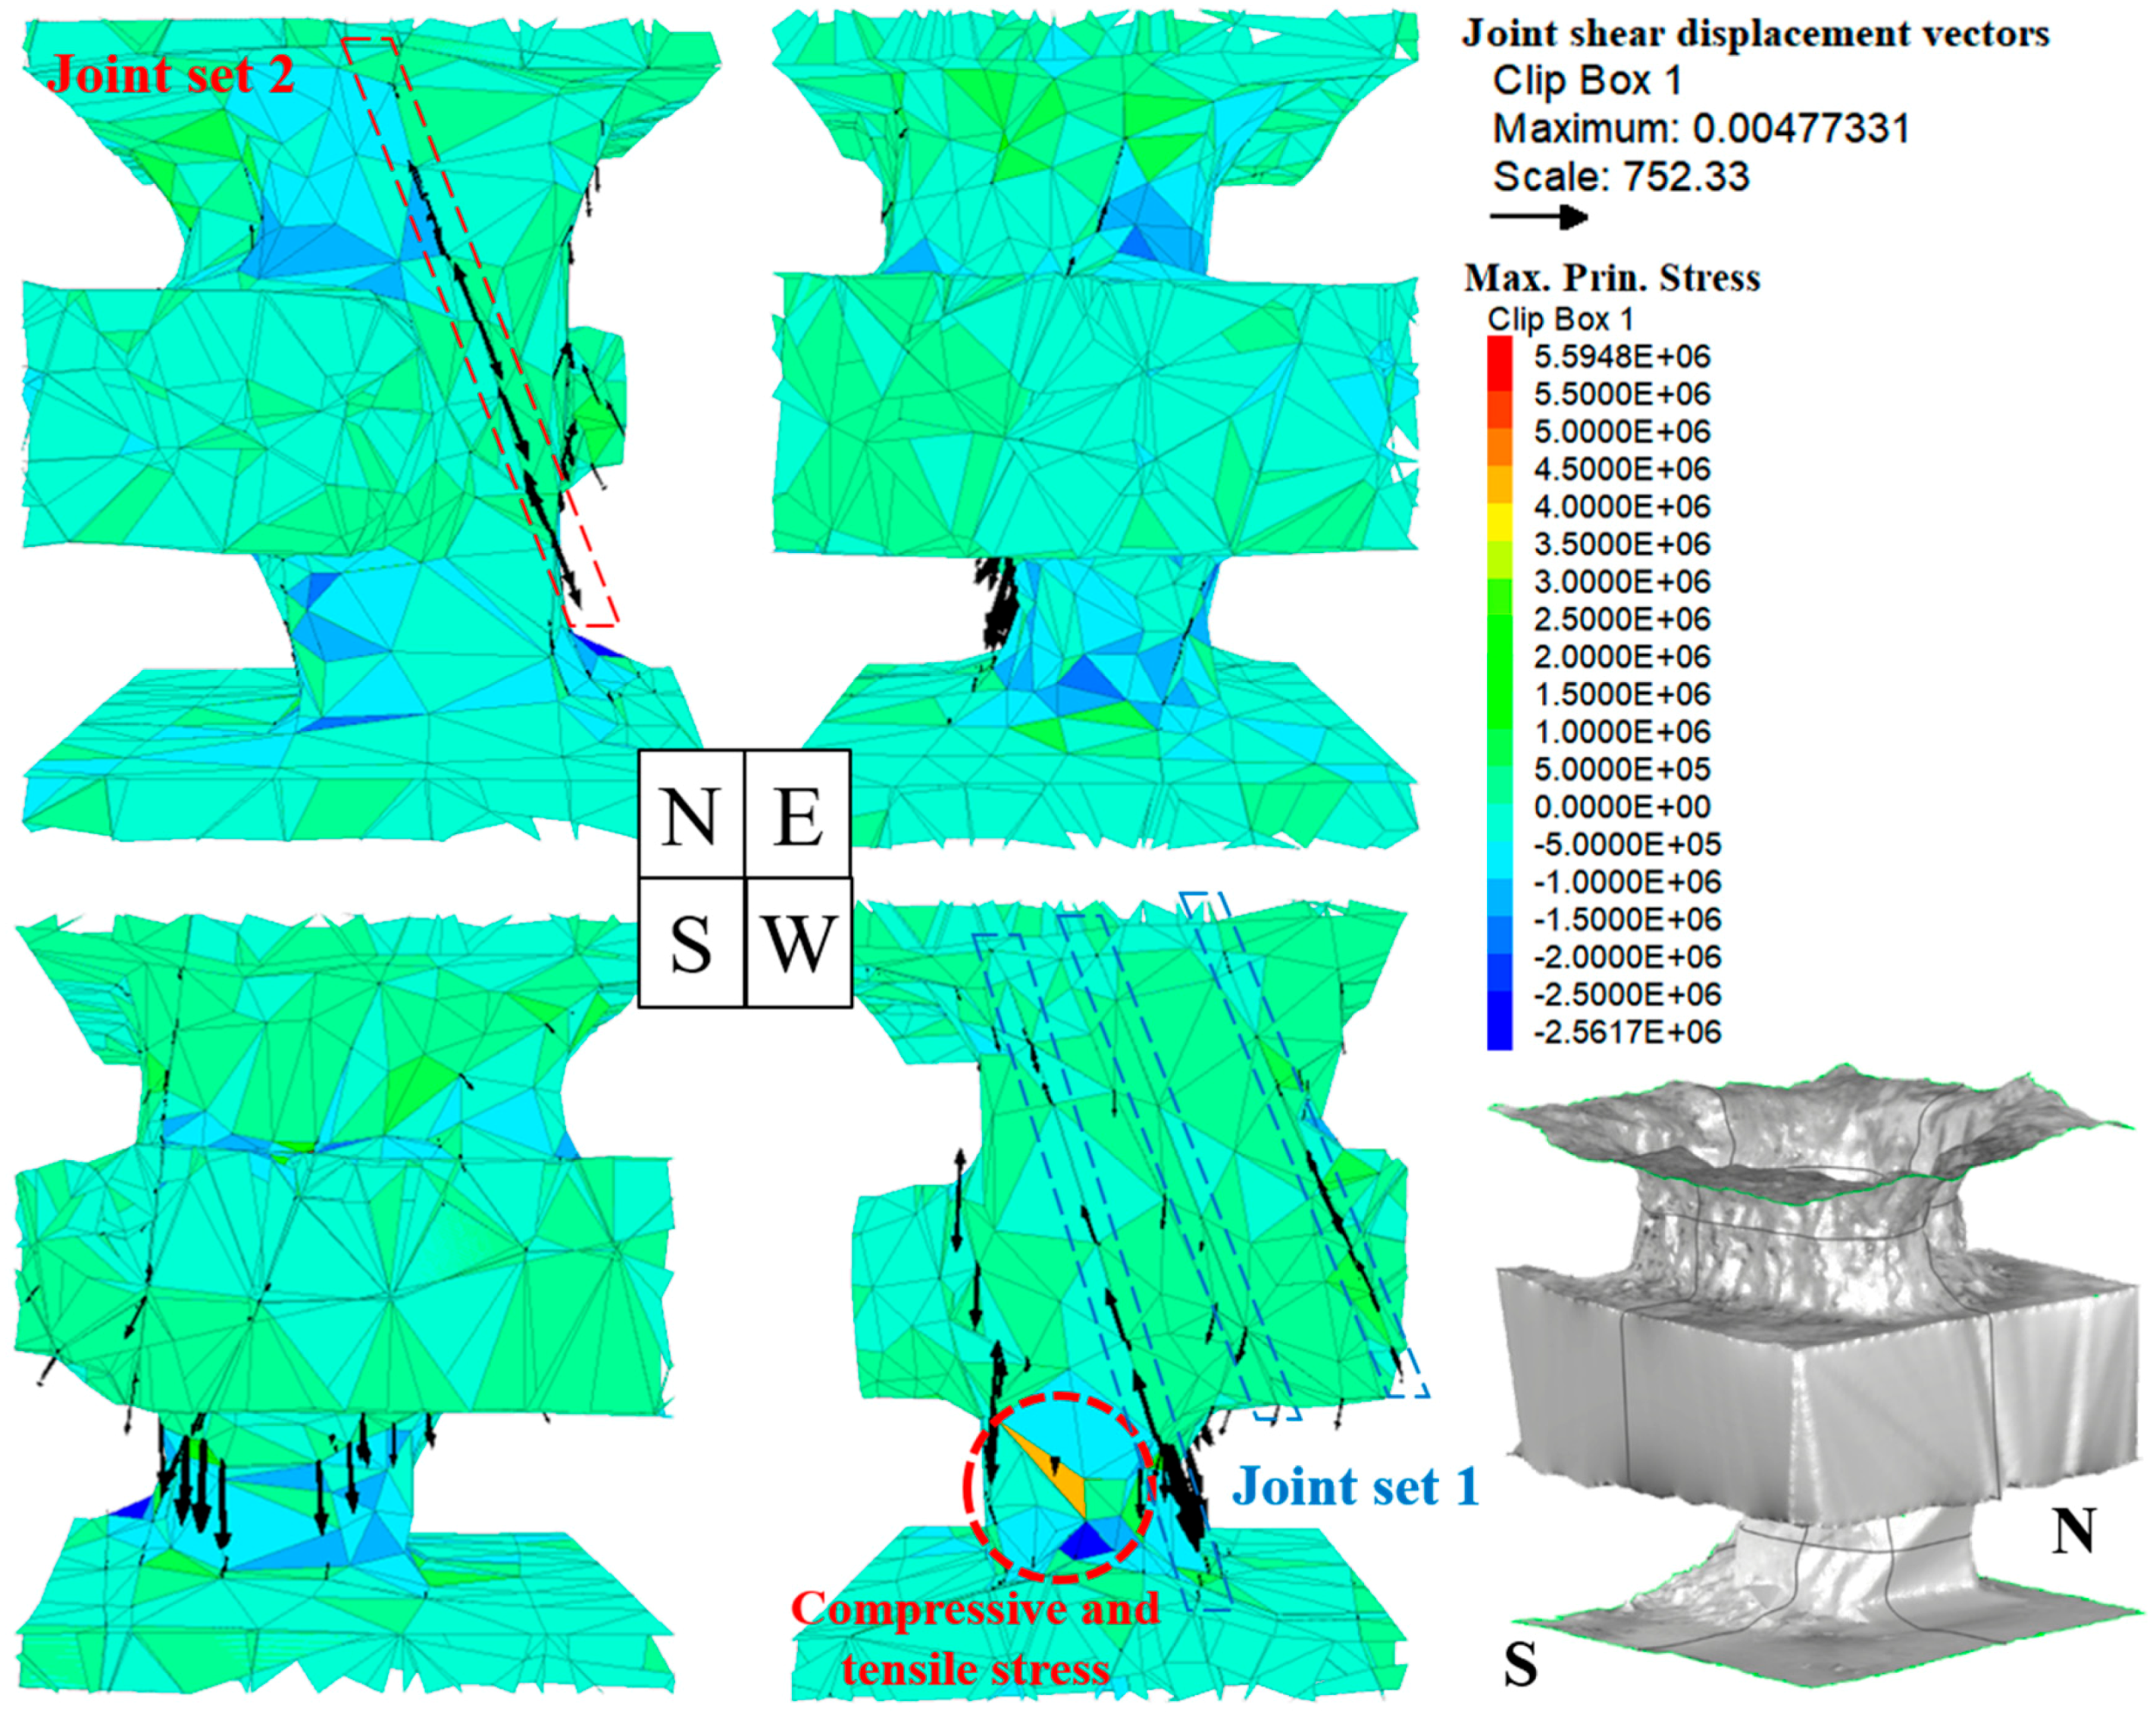
The analysis results for the maximum principal stress showed that a stress concentration section of about 1.0 MPa was present in Pillar 2 in the Lv520 stope, as verified in
Section 2 of
Figure 19. The stress concentration phenomenon was investigated in each direction, and the results showed that the tensile stress at a level of 1.0 MPa seemed concentrated locally in the northerly, southerly, and easterly directions of the pillar. In addition, compressive stress at a level of 4.0 MPa and tensile stress at a level of 2.0 MPa were also generated in the lower end portion in the westerly direction of the pillar (
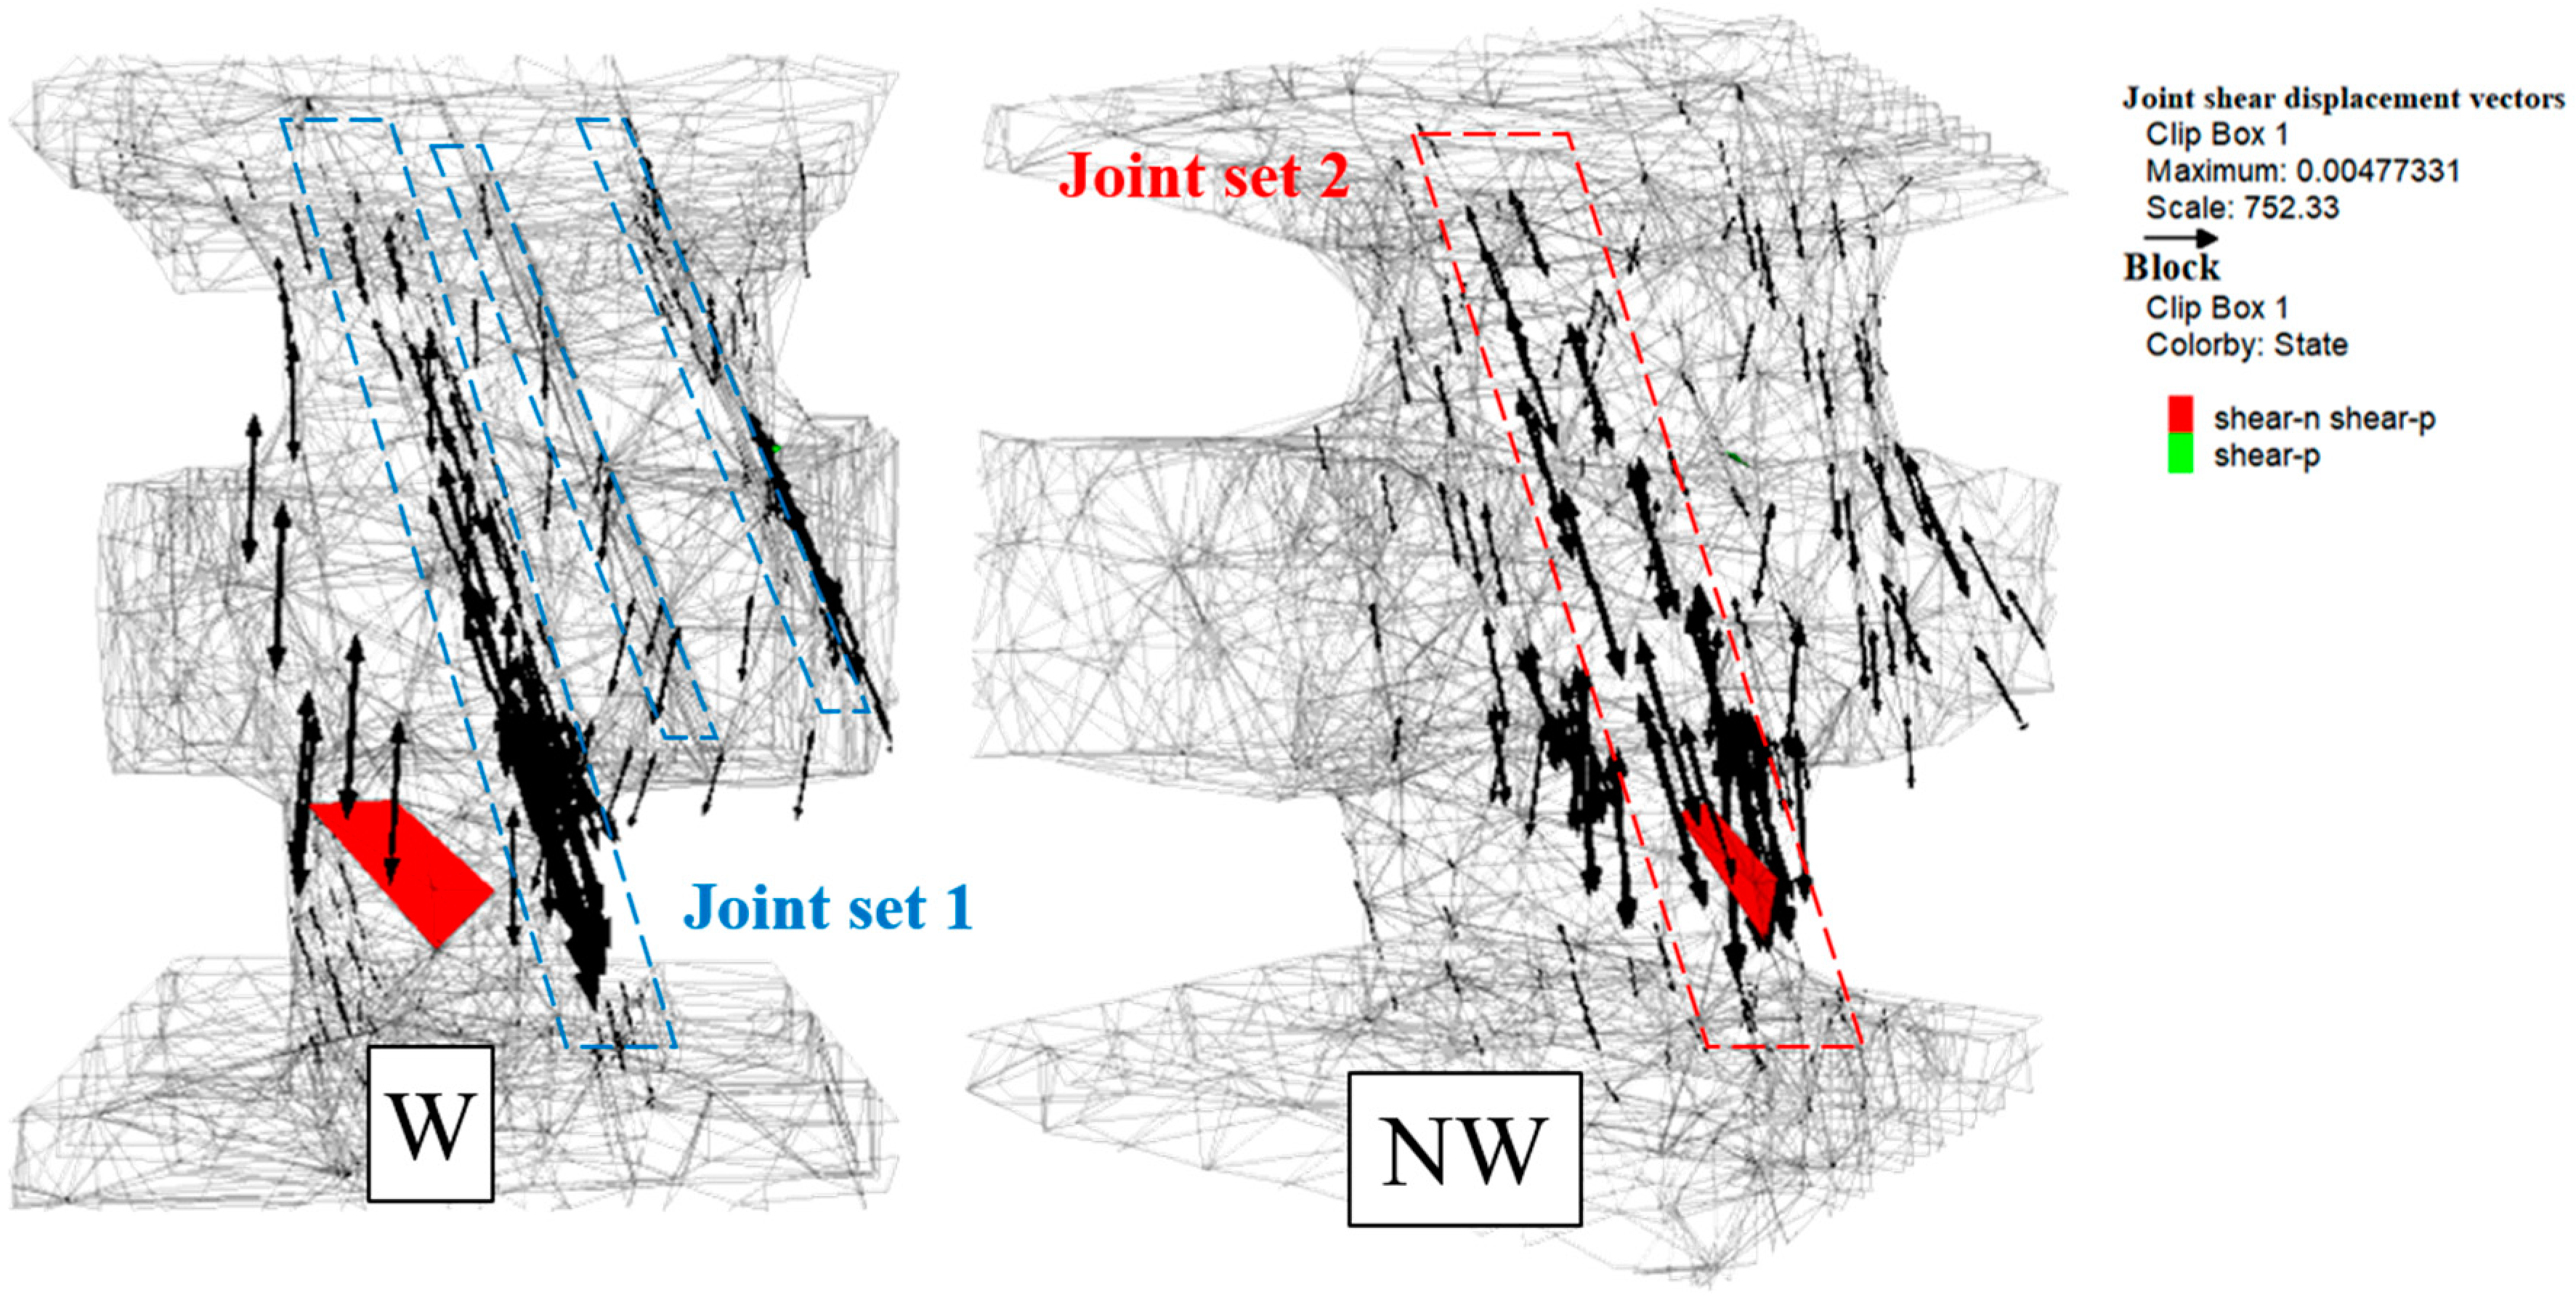
Figure 20). Furthermore, a shear failure pattern was verified due to stress concentration at the lower end portion of the vertical safety pillar, as shown in
Figure 21. This was because the confining stress was released by the recovery work of the horizontal safety pillar which restrained joint set 2. As a result, the supported load of the vertical safety pillar was increased, thereby generating shear displacement along the dip direction of joint set 2.
Accordingly, the vertical safety pillar was unstable due to joint set 2. However, since the cross-section area of the vertical safety pillar in the Lv520 stope was smaller than that of the Lv540 stope and the center axis of the pillar deviated towards the north west, as verified in the cross-section analysis results, the effect of joint set 1 could not be overlooked if the rest of the horizontal safety pillar would be recovered later.
Currently, it seemed that the overall stability of the stope had no problems. However, since stress concentration and shear failure were present in the vertical safety pillar of the Lv520 stope, it was necessary to have a mining plan that would ensure stability during the recovery of the remaining horizontal safety pillar.
5. The Safety Factor of the Vertical Safety Pillar
The site investigation results showed that instability in the stope was not verified for the current excavation phase. However, if the horizontal safety pillar were to be recovered later, it could cause instability. Thus, taking a conservative stance, the safety factor of the vertical safety pillar was investigated.
The safety factor of Pillar 2 in the Lv520 stope was analyzed using the results derived from empirical equations proposed by previous researchers.
First, the safety factor in the empirical equations is the ratio between pillar strength and average pillar stress, which can be calculated using Equation (1). A number of empirical equations were proposed by previous researchers to calculate pillar strength. This study employed those proposed by Greenwald et al. [
18] (Equation (2)) and Holland and Gaddy [
19] (Equation (3)) to calculate pillar strength. The average pillar stress was calculated from the theoretical equation (Equation (4)) of the tributary area.
Here, is the safety factor, is the pillar strength, is the average pillar stress, is the coefficient due to critical strength, is the pillar height, is the pillar width, is the uniaxial compressive strength, is the diameter of the sample, is the unit weight, is the depth, and is the width of the gallery.
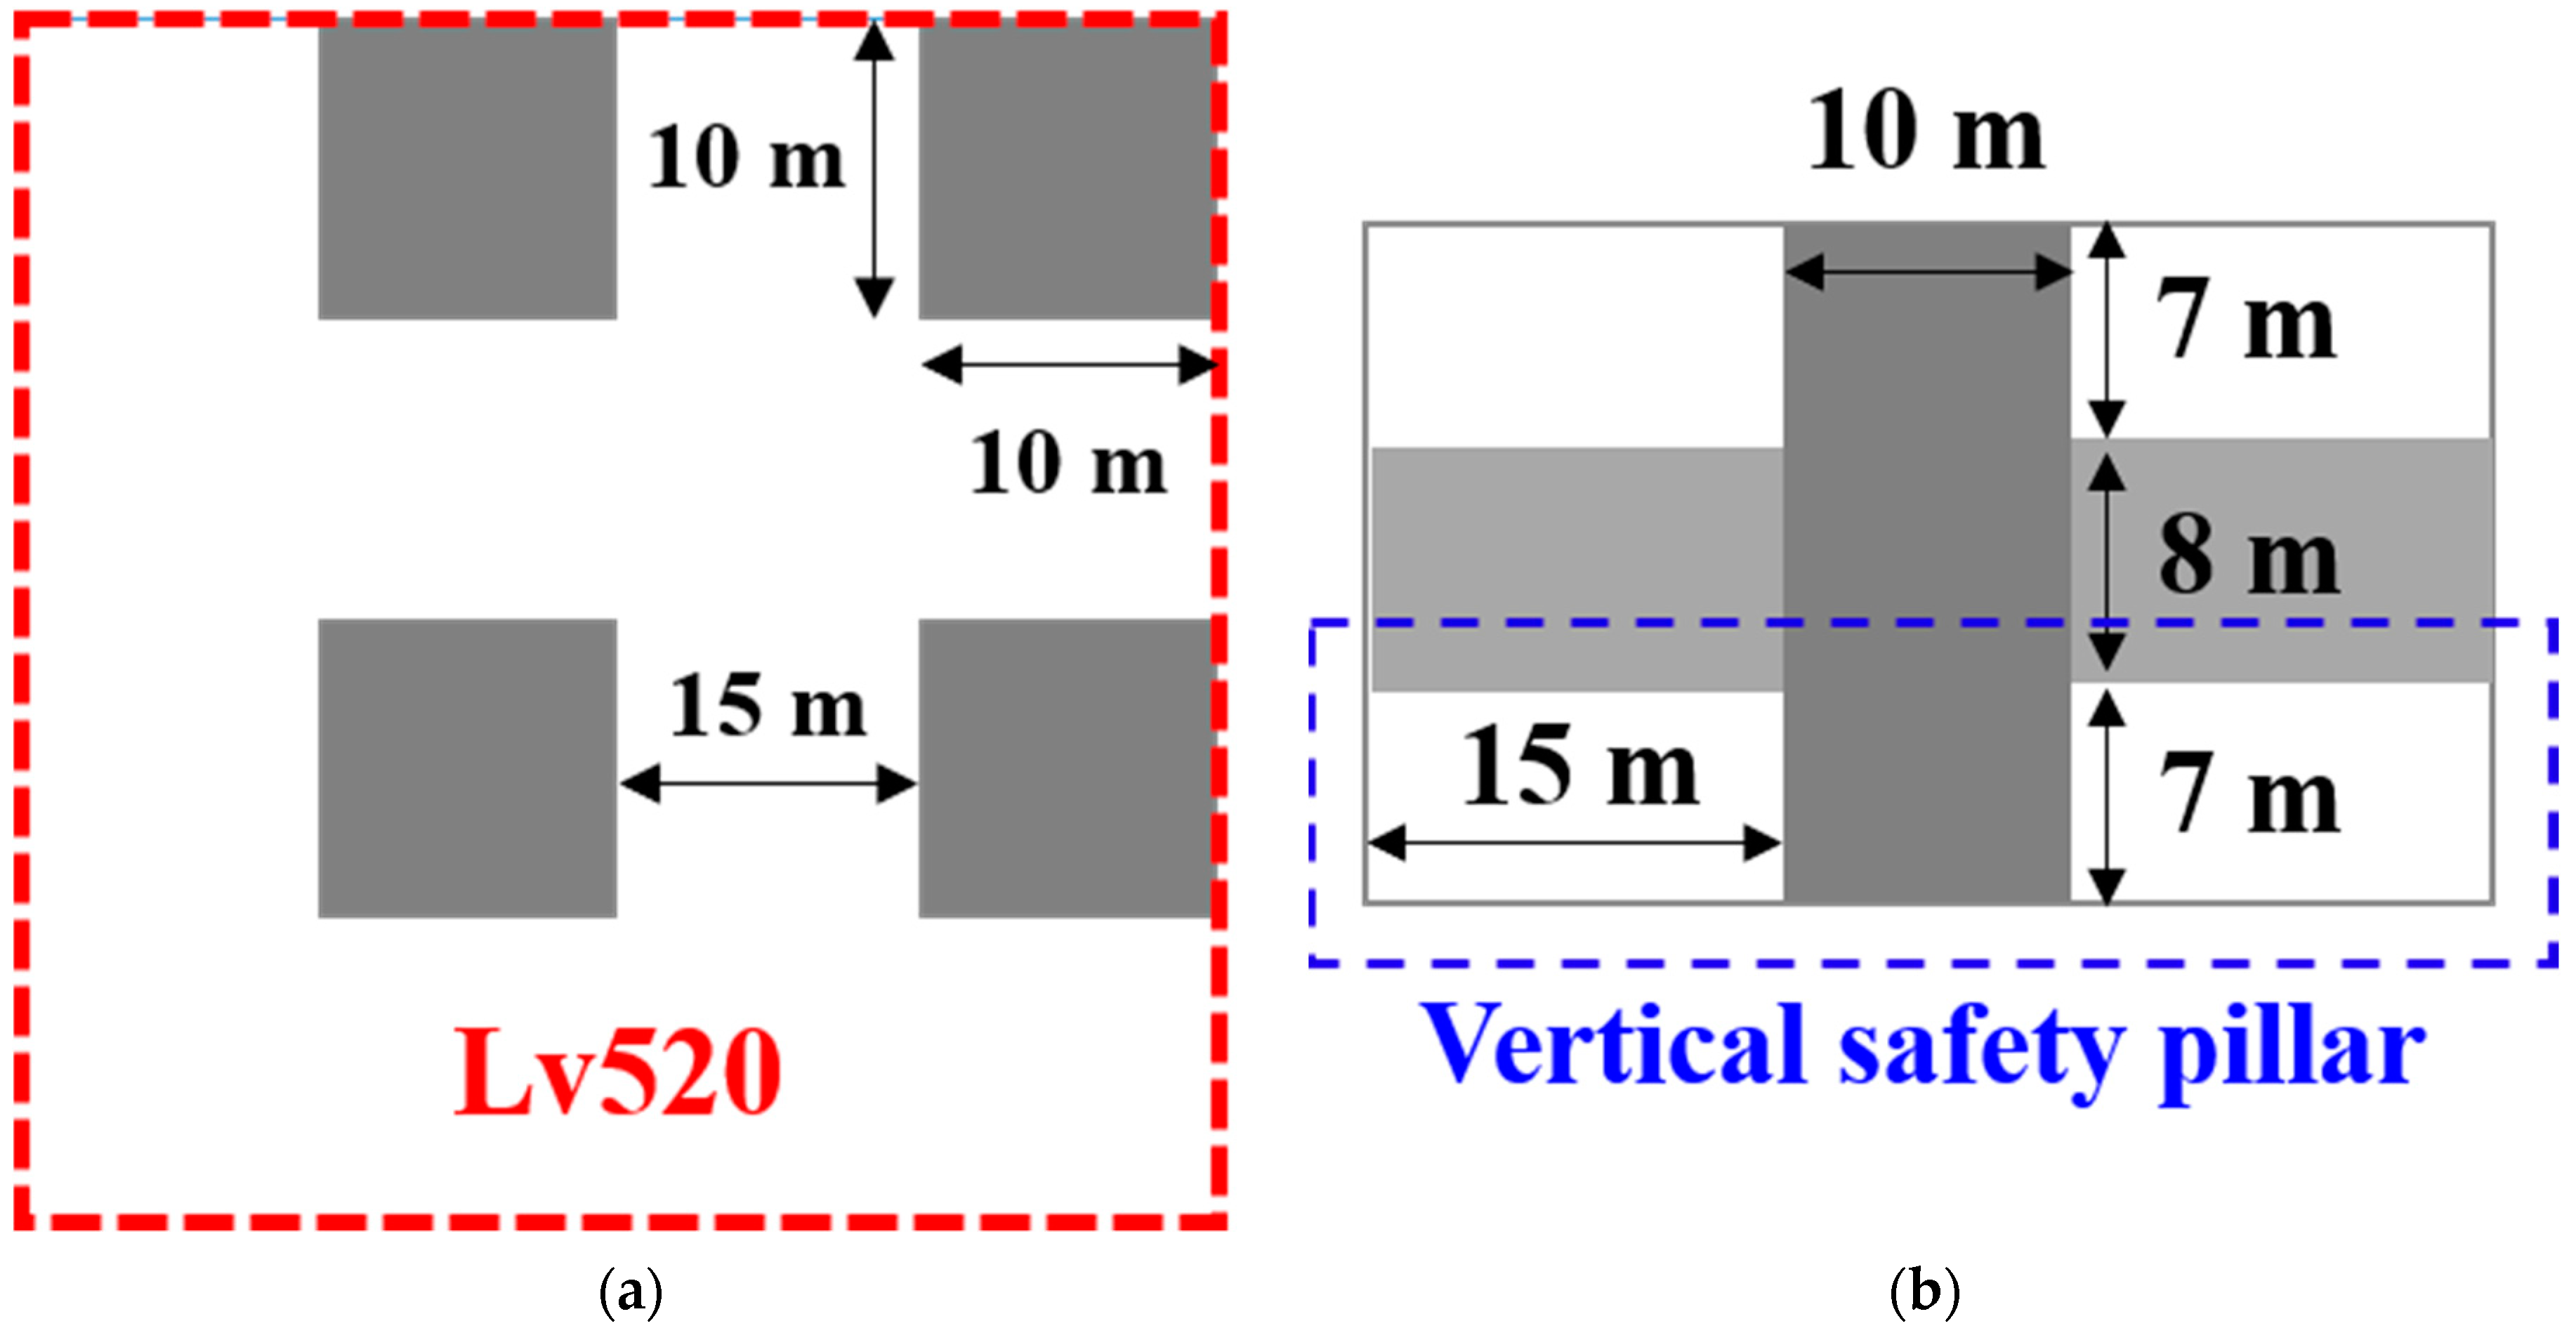
The safety factor was calculated based on the planned cross-section at the mining planning phase, and the cross-section was measured using LiDAR at the actual stope (
Figure 22 and
Figure 23, respectively). For the calculation of the safety factor, the state prior to the recovery of the horizontal safety pillar was considered to calculate the average pillar stress. In addition, an irregular cross-section shape of the pillar was assumed to be a square cross-section shape to calculate the pillar width. The pillar width, as reverse-calculated from the cross-section area, was 8.13 m. The tributary area was calculated by measuring the distance from the center of the vertical safety pillar to its neighboring pillar, as shown in
Figure 23a. The average width of the gallery was calculated from the difference in the pillar width, and the reverse-calculated distance from the tributary area was 15.37 m. For the pillar height, the measured values in each of the directions was averaged and found to be 7.49 m. This value was then applied and used in the calculation of the safety factor.
The safety factor that was analyzed via the previously mentioned empirical equations proposed by Greenwald et al. [
18] and by Holland and Gaddy [
19], obtained values of 2.0 and 2.2 at the planned cross-section, and 1.3 and 1.4 at the measured cross-section, respectively (
Table 4). According to Esterhuizen et al. [
20], the stability of the stope during the mining period has no problems if the safety factor is 1.5 or greater. Based on the analysis results, the safety factor of the stope at the time of the mining plan was within a safe level. However, as the cross-section area of the pillar became smaller and the width of the gallery increased due to the mining work, the safety factor was reduced to 1.5 or less.
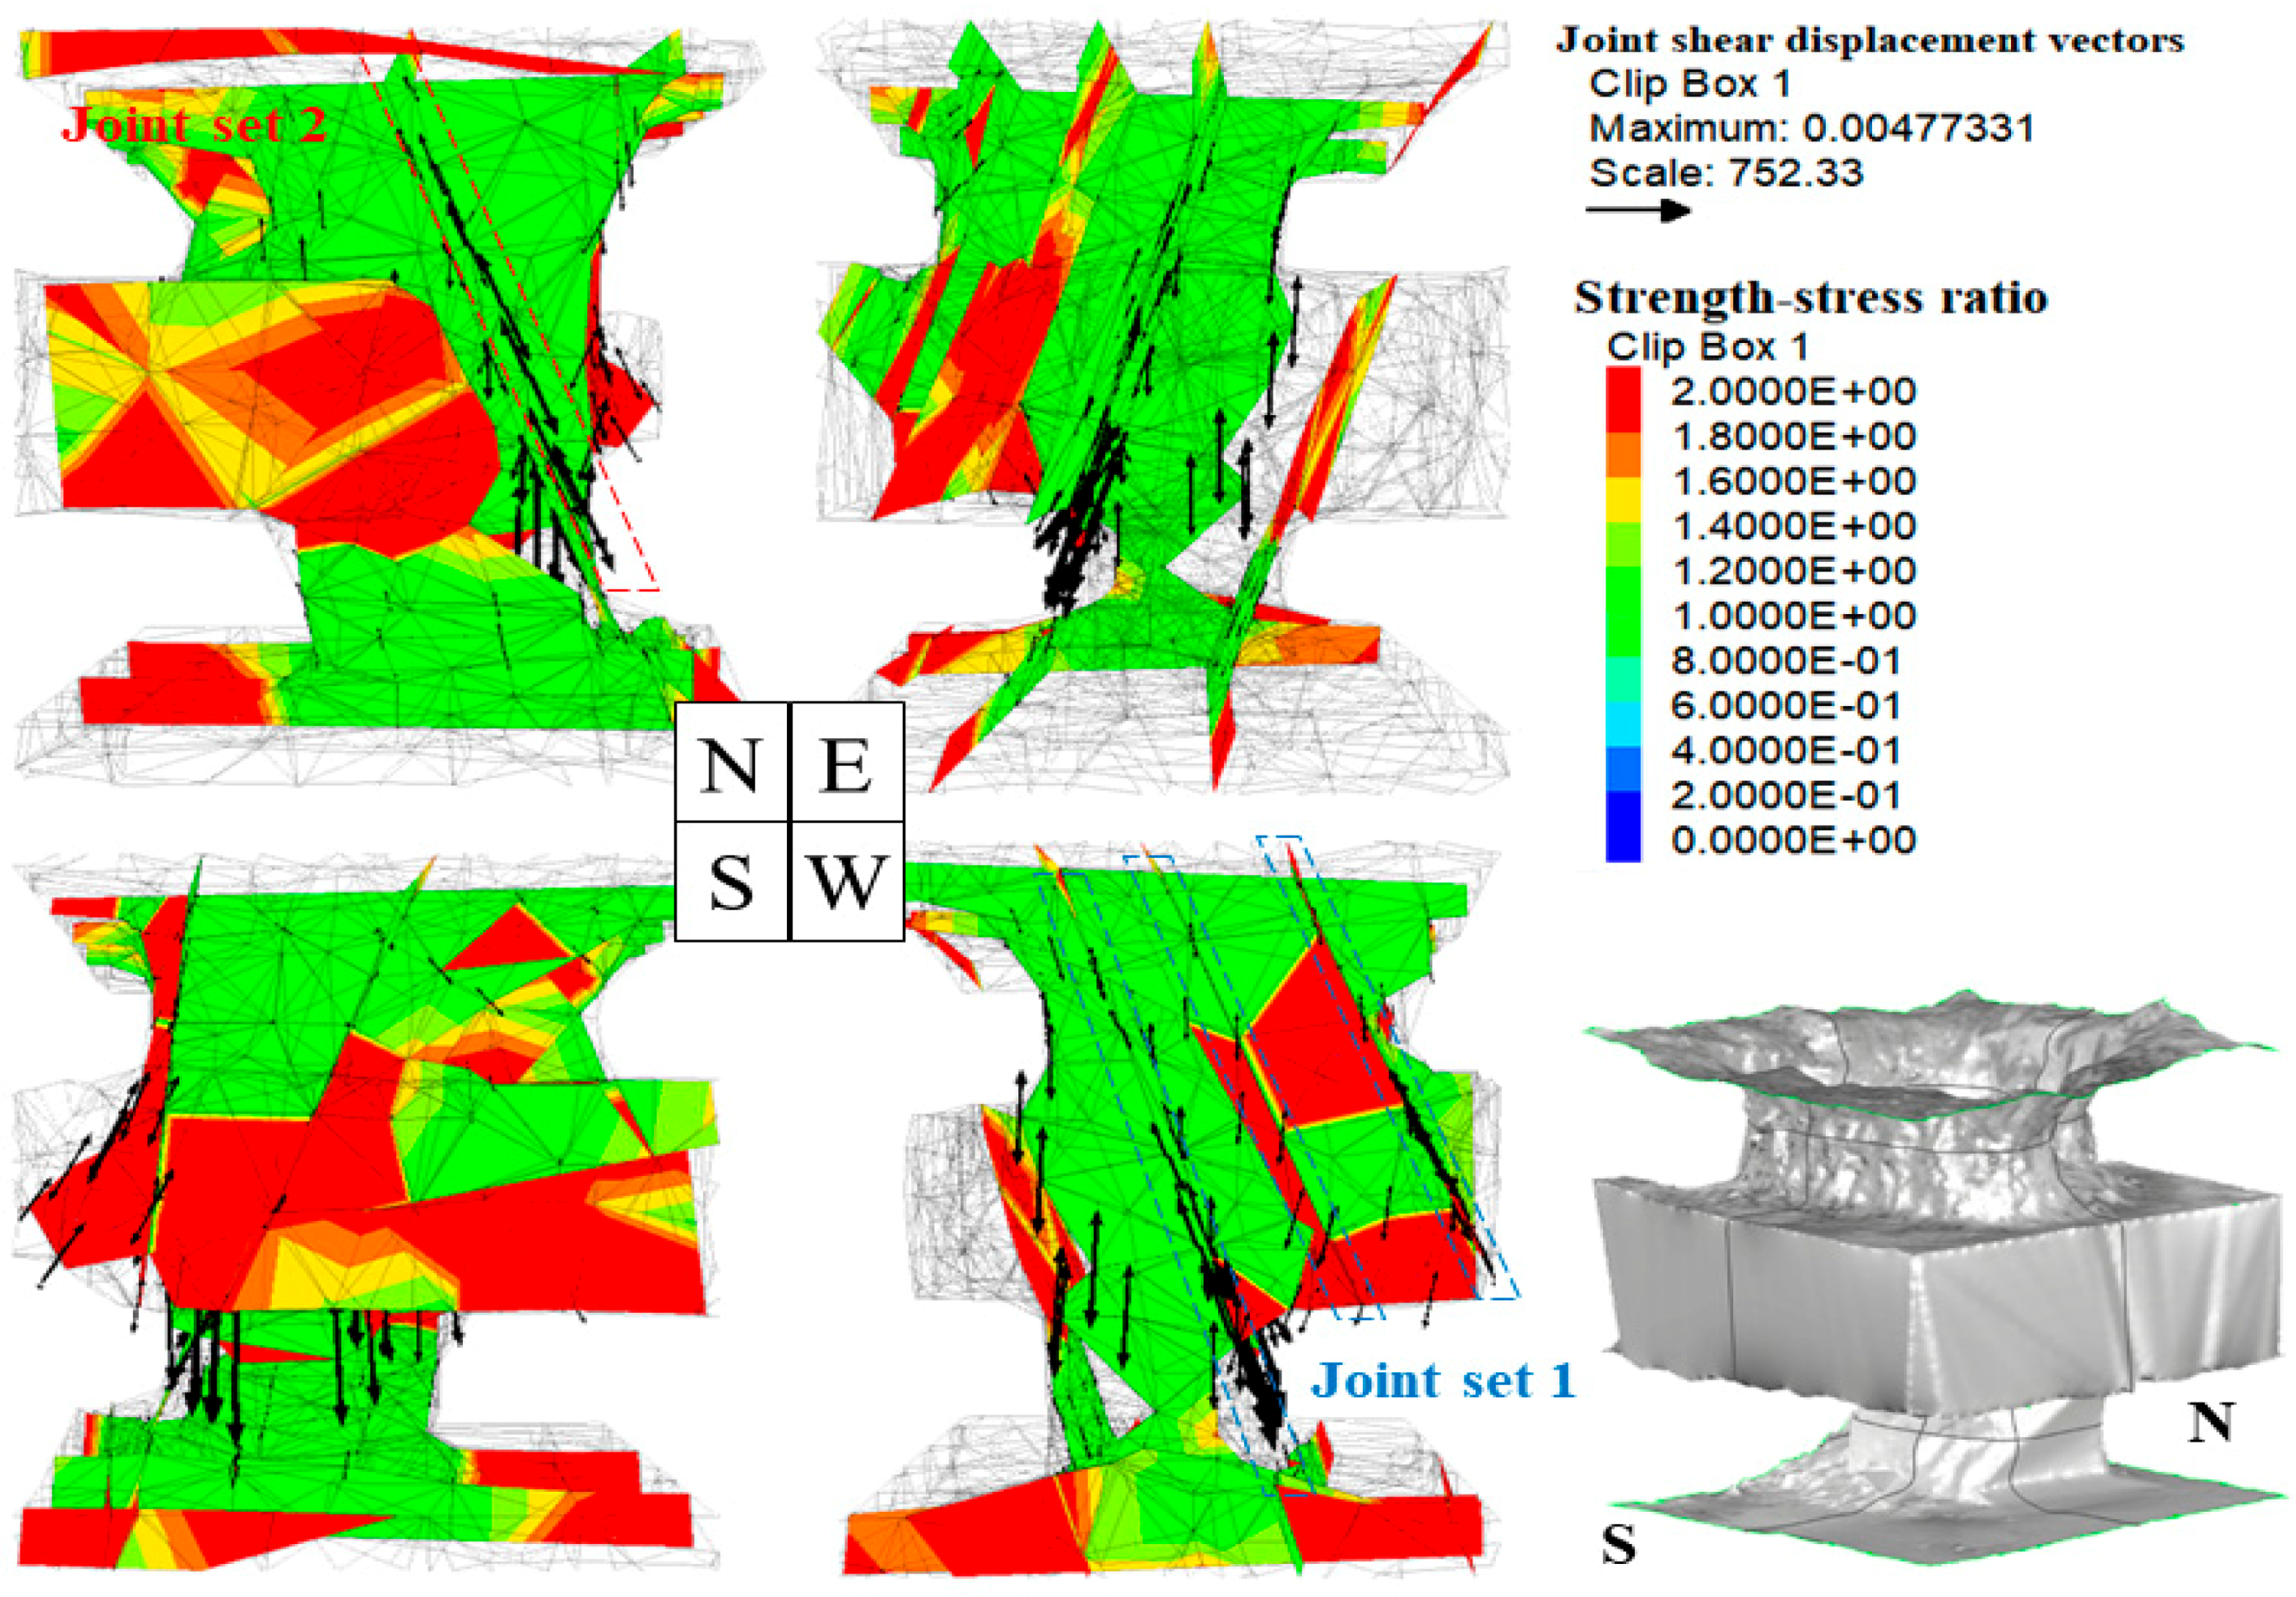
As aforementioned, the safety factor analyzed with the measured cross-section was somewhat unstable. Whether or not this instability also occurred in the numerical analysis that utilized the actual measured data was checked. The safety factor was defined as the ratio of shear stress to the shear strength of the joint, as presented in Equation (5), and the safety factor of Pillar 2 was investigated using this equation:
Here, refers to the maximum shear stress that can incur shear failure, assuming that the minimum effective stress applied to the element is ; refers to the amount of shear stress applied to the actual element, meaning that the safety factor indicates the possibility of shear failure if it is less than 1.0.
Figure 24 shows the results, which display the ratio of the maximum shear stress with regards to the shear strength of the joint formed in Pillar 2. This figure shows that the safety factor of joint set 2 formed in the vertical safety pillar is 1.0 overall, and the safety factor of joint set 1 is greater than 2.0 overall, although falling below this in some sections. In summary, Pillar 2 was unstable due to joint set 2, which was shown to be relatively vulnerable.
6. Conclusions
This study conducted 3D surveying and 3D discontinuum numerical analysis using LiDAR to analyze the stability of stopes where the hybrid room-and-pillar mining method was applied. The 3D point cloud data acquired at seven points in the Lv520 and Lv540 stopes were utilized as foundational data to construct a cross-section analysis and numerical analysis model of the vertical safety pillar.
The cross-section analyses were conducted on an area where a large-scale, 22 m high vertical safety pillar would be formed. The cross-section area of Pillar 1 located on the west side of the stope was 141.61 m2 in the Lv540 stope, and that of Pillar 2 located on the east side was 66.16 m2 in the Lv520 stope and 161.33 m2 in the Lv540 stope. When the analyzed cross-section area of each of the vertical safety pillars was compared with the actual designed cross-section area of 100 m2, over-break and under-break were present locally in the vertical safety pillar formed in the stope.
The cross-section area of Pillar 2 formed in the Lv520 stope was smaller than that formed in the Lv540 by 95.17 m2, and the center axis of the pillar deviated to the northwest.
The results of 3D discontinuum numerical analysis showed that compressive stress at a level of 4 MPa and tensile stress at a level of 2 MPa were concentrated to the west of Pillar 2 in the Lv520 stope. This was because the confining stress was released by the recovery work of the horizontal safety pillar which restrained joint set 2. As a result, the supported load of the vertical safety pillar was increased, thereby generating shear displacement along the dip direction of joint set 2.
The safety factor of Pillar 2 in the Lv520 stope was analyzed using the results of the empirical equations proposed by Greenwald et al. [
18] and Holland and Gaddy [
19], as well as the results of the numerical analysis. The safety factor values calculated by via the empirical equation were 2.0 and 2.2 at the planned cross-section, and 1.3 and 1.4 at the measured cross-section, respectively. The safety factor of joint set 2, which affected the shear behavior of Pillar 2 that was calculated in the numerical analysis results, was found to be 1.0.
The actual stope shape-reflected safety factor analysis, or the safety factor analysis results using the measured cross-section and numerical analysis results, was verified as unstable based on a score of 1.5, the safety factor criterion proposed by Esterhuizen et al. [
20]. If the horizontal safety pillar was to be recovered without additional reinforcement work, it would cause stability problems due to an increase in the supported load and separation behavior of joint sets 1 and 2 in Pillar 2 in the Lv520 stope.
Because reinforcement work was conducted using shotcrete and rockbolt at the actual site, the instability displayed in the numerical analysis was not verified. The results of this study are expected to be utilized as reference data in the establishment of recovery from horizontal safety pillars in the future.
As discussed above, when mining plans that require stability are established or new mining methods are applied, it is necessary to periodically evaluate the stability of stopes and pillars, using 3D surveying work, to investigate the safety factor of the surveying results and conduct 3D numerical analysis.


