1. Introduction
Concerns about the amount of energy used for transportation have been translated by rail advocates as a rationale for support of passenger rail systems for at least the past four decades. Amtrak [
1] cited data from Davis et al. [
2] (pp. 9–11) to market itself as “33 percent more efficient than traveling by car and 12 percent more efficient than domestic airline travel on a per-passenger-mile basis”. This energy-efficiency rationale is a common part of the broader contemporary sustainability discourse in regards to different scales of rail transport, including streetcars, light rail, regional/commuter rail, and high-speed rail.
Numerous authors [
3,
4,
5,
6,
7,
8,
9,
10,
11,
12,
13,
14] have suggested that passenger rail should play a greater role as fossil fuel resources become more expensive and difficult to extract, and as those constraints reduce the viability of the dominant auto/air transportation paradigm.
Underlying those suggestions is a vast body of energy intensity research that has accrued over the past half century. The energy intensity of a service is commonly expressed in terms of a ratio of some particular measurement of useful work versus some measurement of energy required to do that work. The comparative efficiency of different services can then be evaluated based on the differing levels of energy intensity needed to perform the same task. For passenger transport modes, energy intensity is expressed as the amount of energy needed to transport a passenger over a defined unit of distance. This report uses the metric commonly used in the USA of British thermal units (Btu) per passenger mile.
Despite the appearance of objectivity created with the use of large datasets and rigorous mathematical techniques, significant discrepancies exist among published figures. These discrepancies hint at not only the complexity of the phenomenon being observed, but the subjectivities inherent in the reduction of complex phenomena to a limited set of numbers. This raises a fundamental ontological question of exactly what phenomenon is being quantified in energy intensity analysis, and whether any transport mode can be said to universally have an energy intensity advantage over other modes at all times, places and scales.
The primary assertion of this article is that this ontological question is as significant as the epistemic and methodological conflicts dominating discourses over competing studies and analytical approaches.
Amtrak, as the only provider of long-distance passenger rail in the United States, operates in a liminal space between public and private, between fossil and renewable, between nostalgia and progress, between commutation and recreation, and between success and failure. As such, it serves as a rich medium for examining the ambiguities and contradictions of energy intensity analysis.
This article critically reviews the existing literature on comparative energy intensity of American long-distance passenger rail with a focus on unpacking and analyzing the questions embedded in the published aggregate figures used in comparison with other modes and in other nations. This article focuses on five fundamental constituents of energy intensity that are masked when reduced to a single number: energy sources, life cycle energy use, utilization, circuity, function, and safety/comfort. The hope is that such analysis can encourage consideration of these hidden issues as we consider the role of long-distance passenger rail in the transition to a sustainable future.
2. Overview of Historic and Current Energy Intensity Estimates
This article uses baseline energy intensity numbers from the Oak Ridge National Laboratory’s (ORNL)
Transportation Energy Data Book [
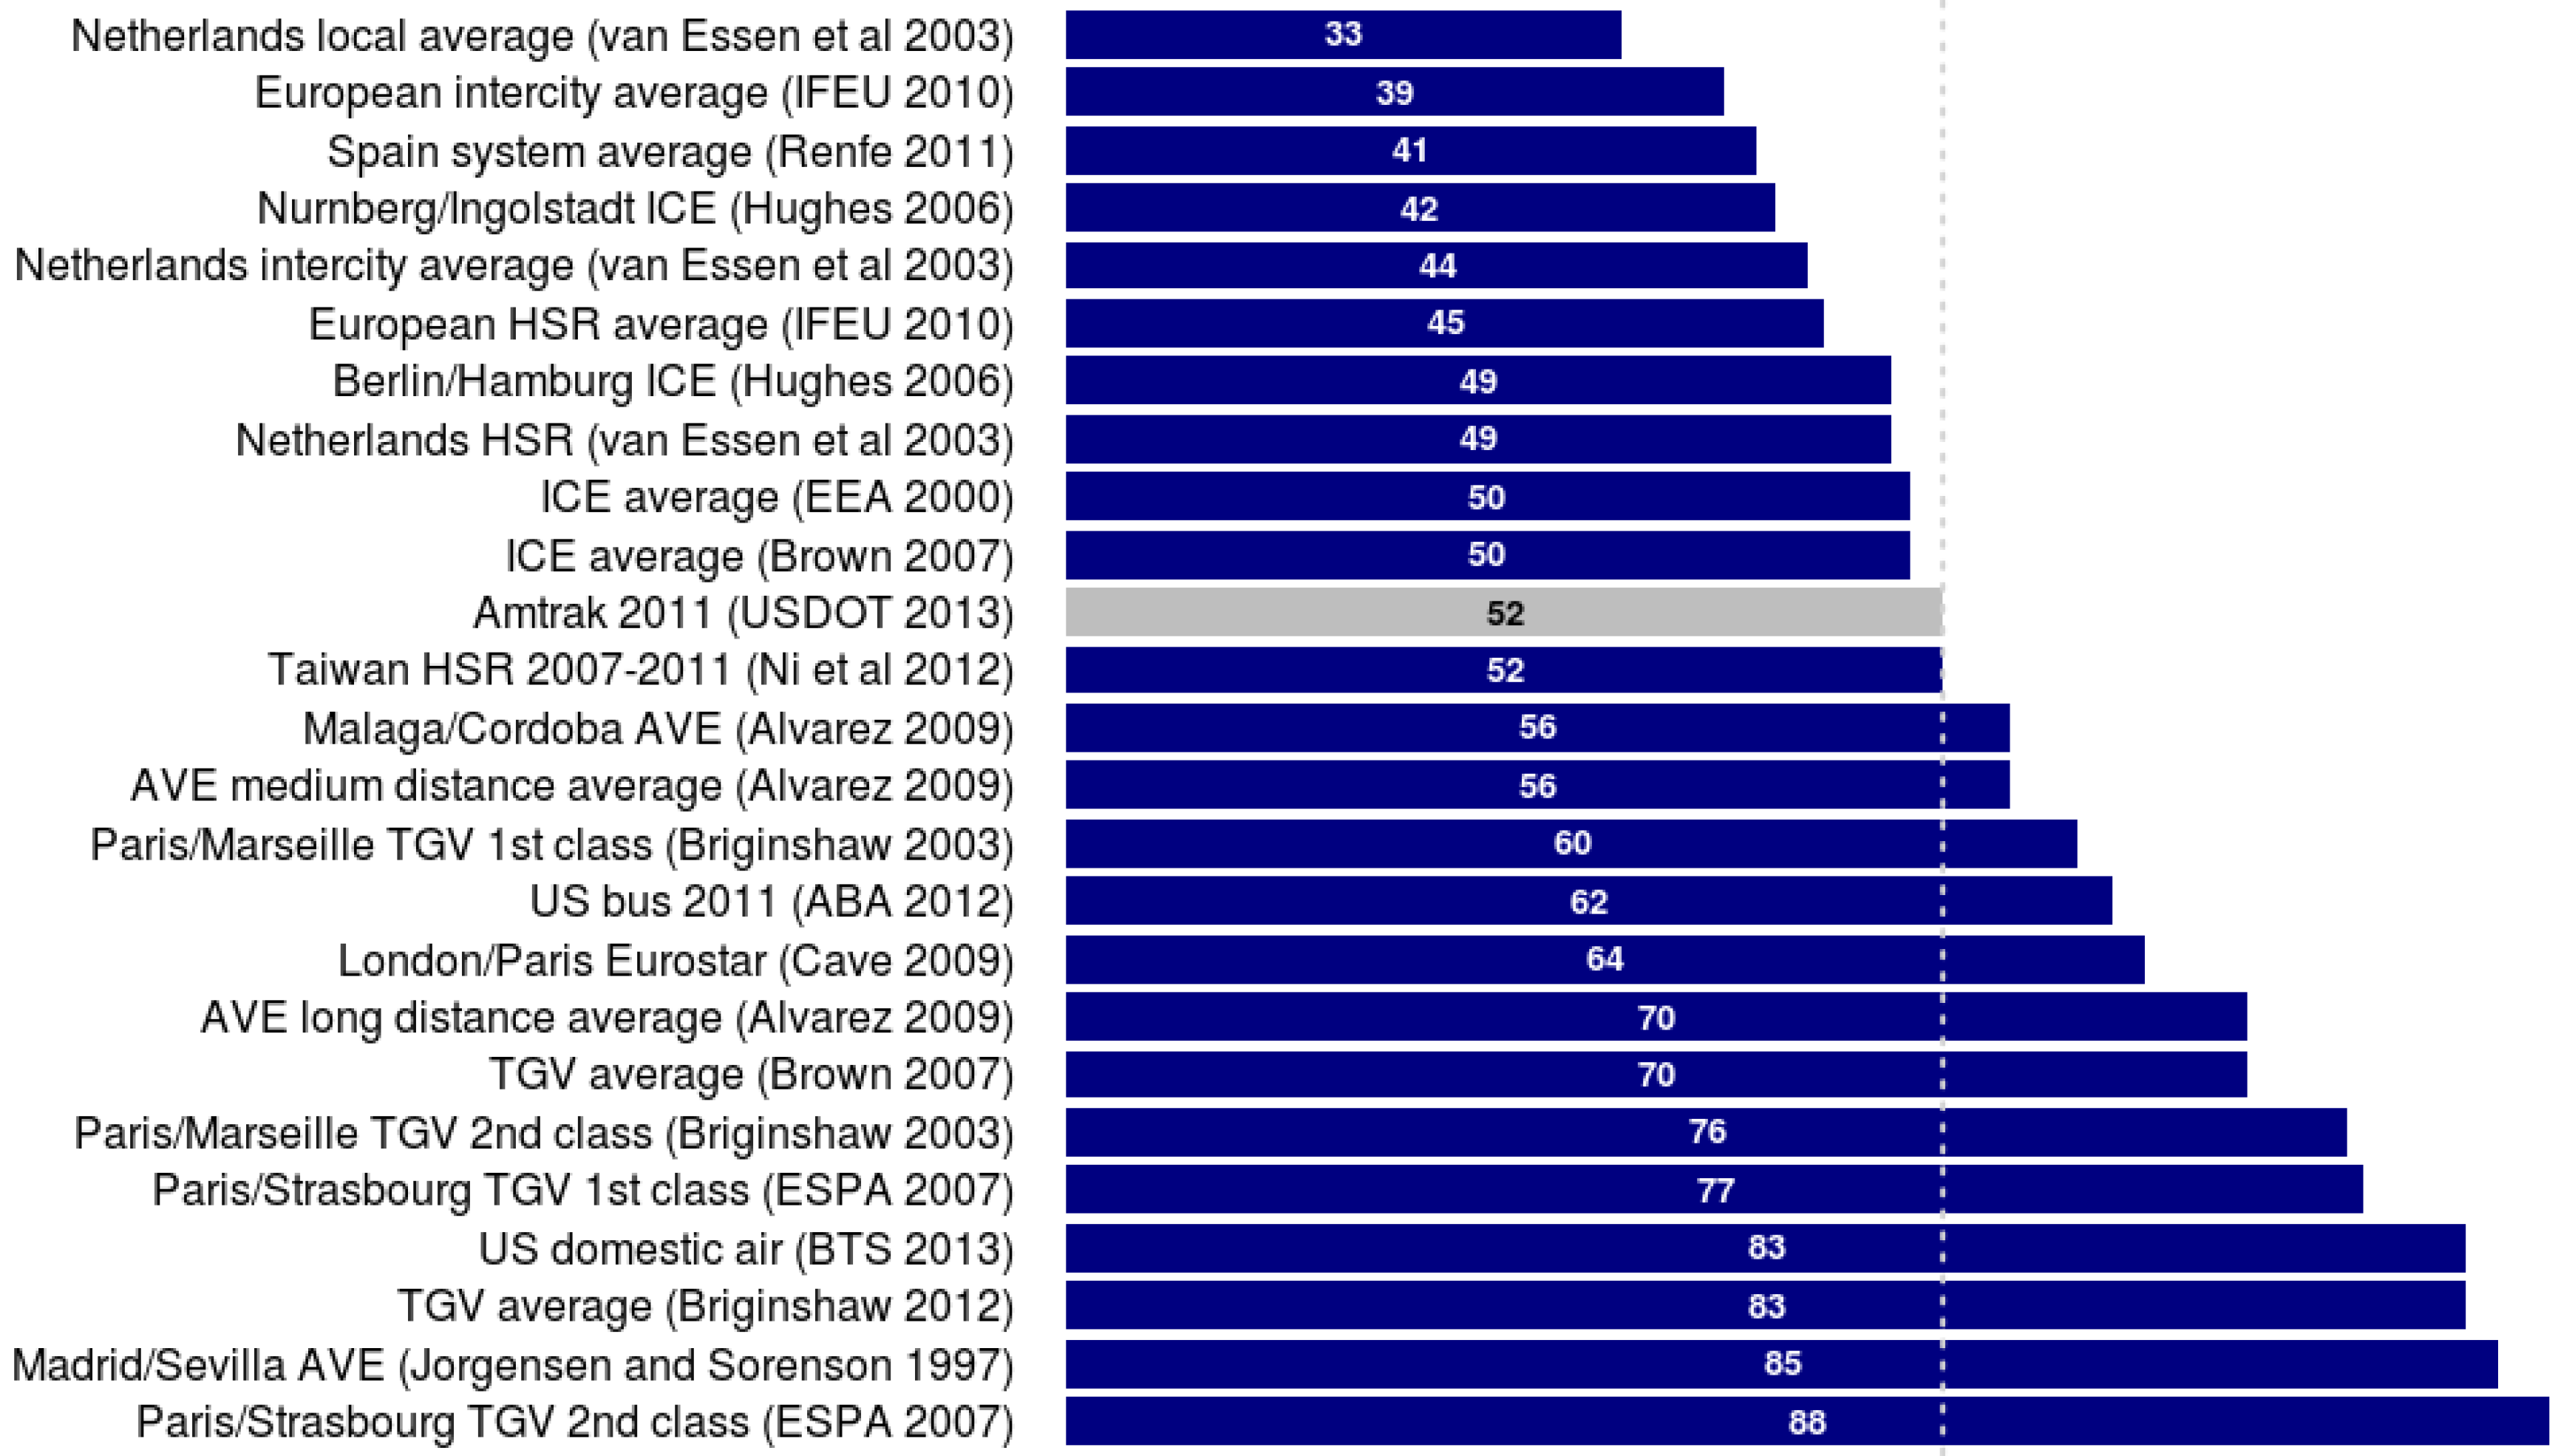
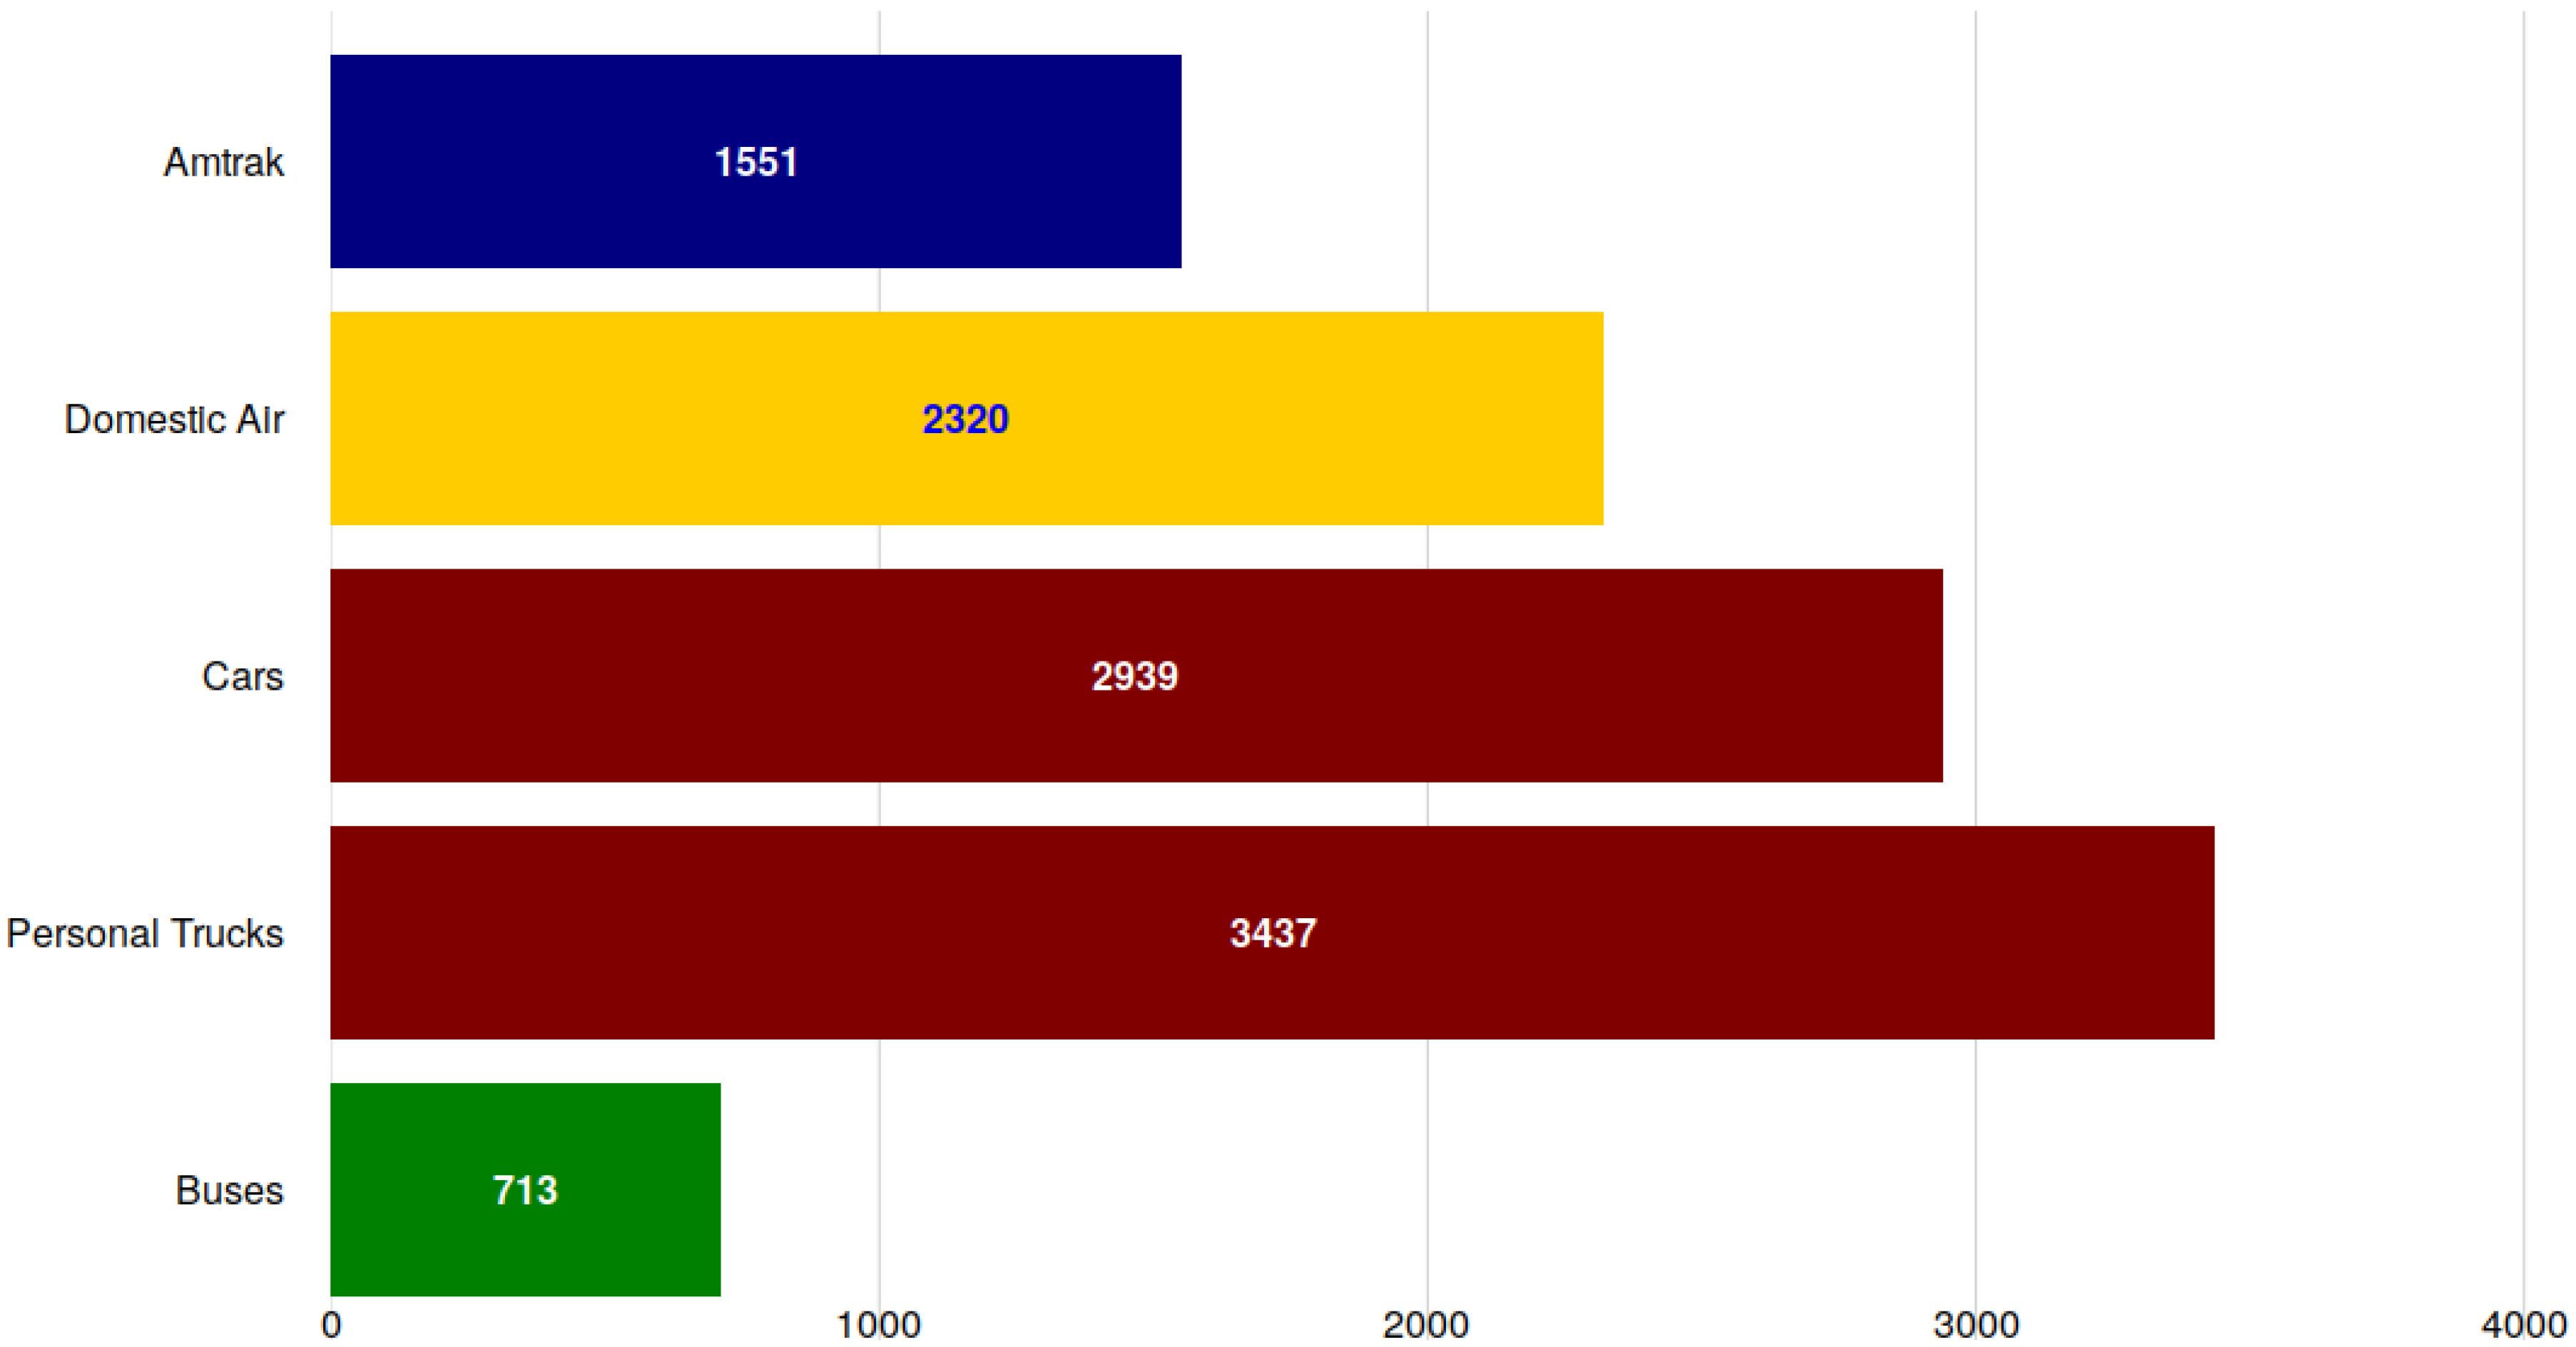
15] (pp. 2–13), prepared for the US Department of Energy (USDOE). These numbers provide context for comparison between modes and for comparison between different data sources, which were found using backward reference chaining and Google Scholar. The Davis et al. numbers are derived primarily from official government statistics and are shown in
Figure 1. Neither USDOE, BTS, nor FirstGroup plc (the operator of Greyhound, the only national motorcoach carrier in the US) include any specific efficiency information for long-distance buses, so the energy intensity of 713 Btu/passenger-mile (6.0 vehicle-MPG diesel) is based on 2010 fuel and passenger-mile data published by the American Bus Association (ABA) Foundation [
16].
Amtrak’s formative first decade as the only national long-distance passenger rail service in the US coincided with the rise of the environmental movement and a concomitant focus on material rapaciousness. Although minimizing vehicle fuel consumption has long been a research topic motivated by business considerations [
17,
18] and concerns about the limitations of petroleum resources date back to at least the 1870s [
19] (p. 62), the contemporary body of research on generalized modal energy intensity seems have had its advent with “System energy as a factor in considering future transportation”, a paper by Rice [
20] presented to the American Society of Mechanical Engineers. The subsequent “energy crises” associated with a pair of oil price shocks in 1973 and 1979 that were triggered by geopolitical events in the Middle East increased public awareness of the dependence of modern lifestyles on inexpensive energy sources and unleashed a flood of both private and government-sponsored energy research in the 1970s. Many of those reports include time-series of estimates going back to the 1950s.
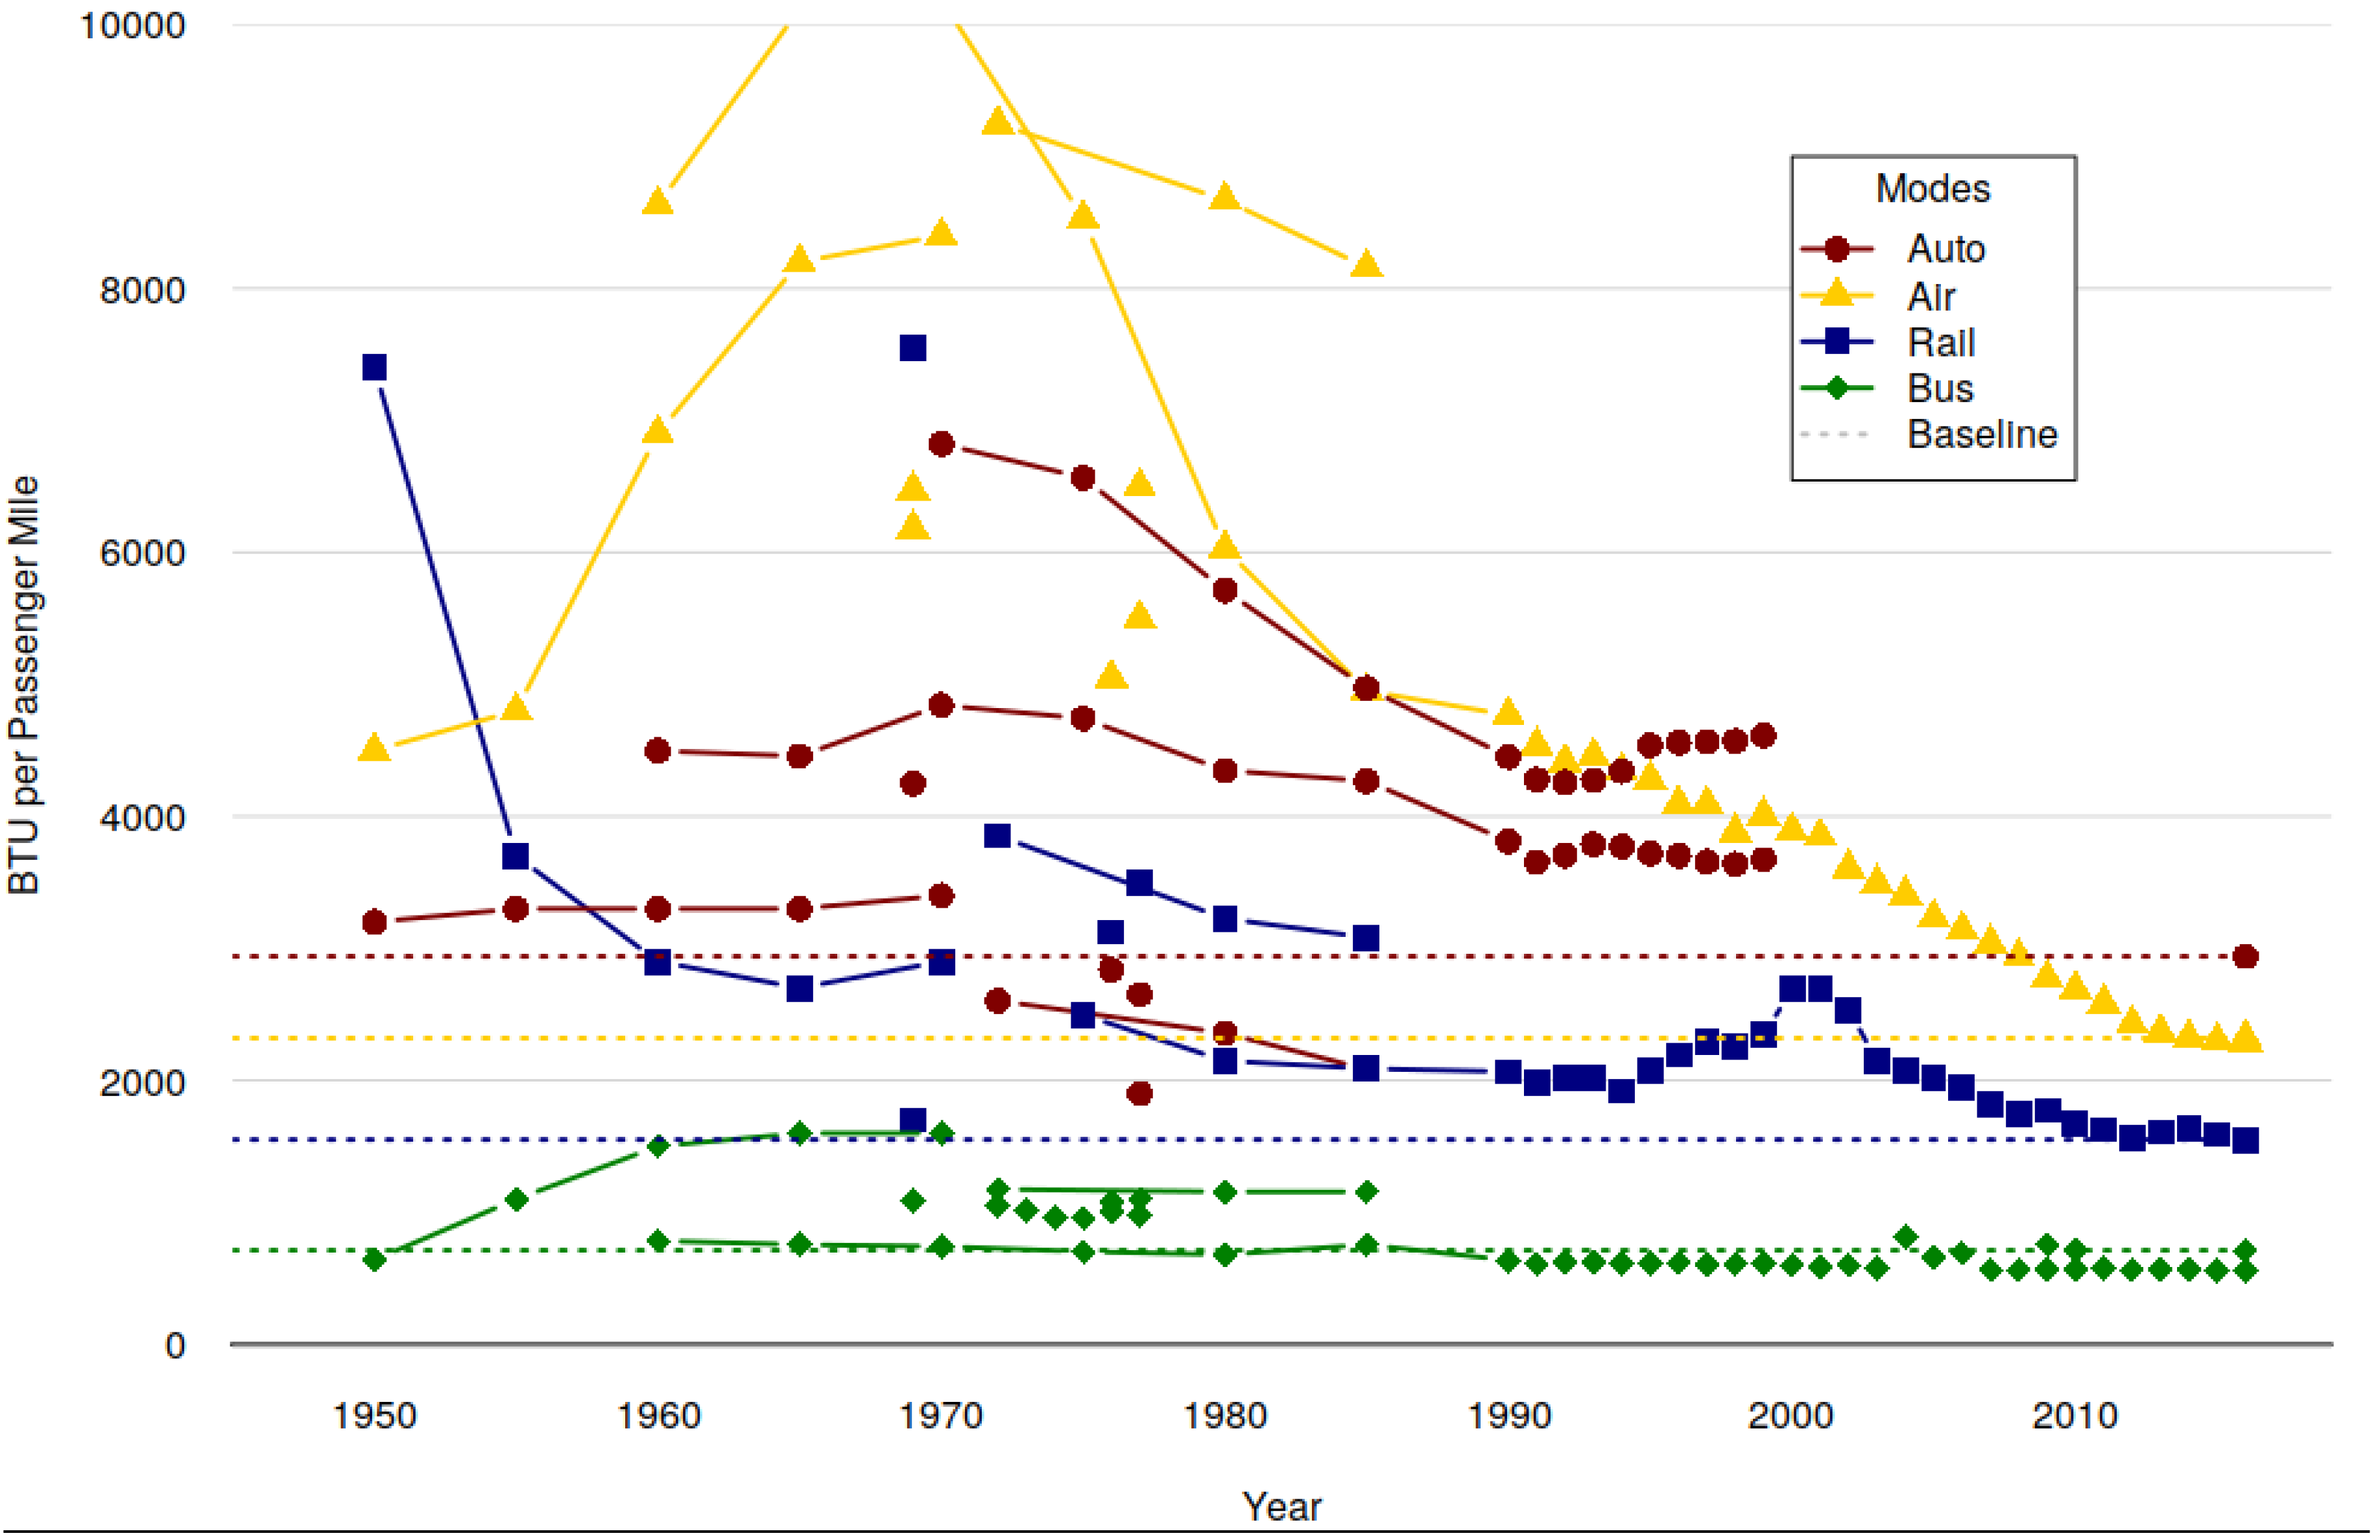
The summative scatter plot in
Figure 2 includes US passenger mode energy intensity estimates from historical sources [
20,
21,
22,
23,
24,
25,
26] with US time-series estimates from the Bureau of Transportation Statistics [
27] (Table 4-20) and contemporary baseline values from Davis et al. [
15] and John Dunham and Associates [
16].
The wide variation in values for each of the modes reflects the different methodologies and different levels of rigor used by different sources, and clearly illustrates the historical absence of consensus on exactly what intensity values should be ascribed to different travel modes. However, despite the significant variances, historical narratives of energy transition are visible in the different estimates:
The transition of aviation to low-efficiency turbojets in the 1950s and 1960s is reflected in steep increases in intensity, with subsequent decreases attributable to improvements in engine efficiency as well as operational changes wrought by industry deregulation in 1978 and by increased fuel prices.
The completion of the transition of passenger rail from steam to diesel traction in the early 1950s resulted in a significant drop in intensity, while comparative stasis since the creation of Amtrak in the 1970s reflects the limited amount of technical or operational innovation since that time.
Although the technical efficiency of automobiles improved significantly in the 1970s and 1980s, the intensity figures have remained stable since the 1990s as those efficiency gains have been plowed back into larger vehicles and increased horsepower [
28]. This continues a longer trend of stability that extends back into the 1920s [
29].
Bus energy intensity has also remained quite stable, which may reflect the limited opportunities and/or incentives for dramatic technical improvement of an already highly-efficient (and, arguably, highly-uncomfortable) mode of transport.
Amtrak has marketed itself since its advent as an energy-efficient choice, and has seen meaningful ridership increases during fuel price shocks [
30] (ES-1), [
31] (p. 34). However, research since the 1970s has consistently shown Amtrak as having little or no energy intensity advantage over other modes—especially buses [
32,
33,
34]. Several industry-sponsored and advocacy-group studies have been actively hostile to Amtrak’s ecological assertions [
35,
36,
37].
A major hindrance to comparison of statistics from different sources is this expression of energy intensity in a variety of units. Energy is measured in different multiples of watts, joules, kilocalories, and (occasionally) in gallons or tonnes of often unspecified fuels. Distance is a bit more standardized, with miles used in the United States and kilometers used almost everywhere else. The question of exactly what is being moved for that distance—passenger-miles vs. seat-miles vs. train-miles—increases the number of incompatible permutations (e.g., passenger-kilometers per megajoule, Btu per passenger-mile-traveled, miles-per-gallon, etc.). While these numbers can be converted to common units with a minimal amount of effort, such techniques are beyond the knowledge of many policymakers and consumers, resulting in a level of mystification that is unfortunate at best and deceptive at worst.
3. What Energy Is Being Measured?
Another ambiguity in assessing energy intensity is defining exactly what energy is being measured.
Almost all contemporary passenger rail systems are powered either by onboard diesel engines or with electricity supplied by external sources and delivered through overhead catenary wire or an electrified third rail. With diesel-powered trains or other transport modes powered by liquid hydrocarbons (which represent most forms of transportation), the energy used can be calculated by multiplying the volumes or masses of fuel consumed by standardized values of heat content embodied in the specific types of fuel consumed.
However, with electrified rail, the electricity can be sourced through the electrical grid from both fossil-fuel plants and non-fossil sources such as hydroelectric, nuclear, wind or solar. While energy calculations with fossil-fuel plants can be made in the same manner as with fossil-fueled vehicles, there is no uncontested method for assessing the energy inputs to non-fossil generators [
38] (p. 296).
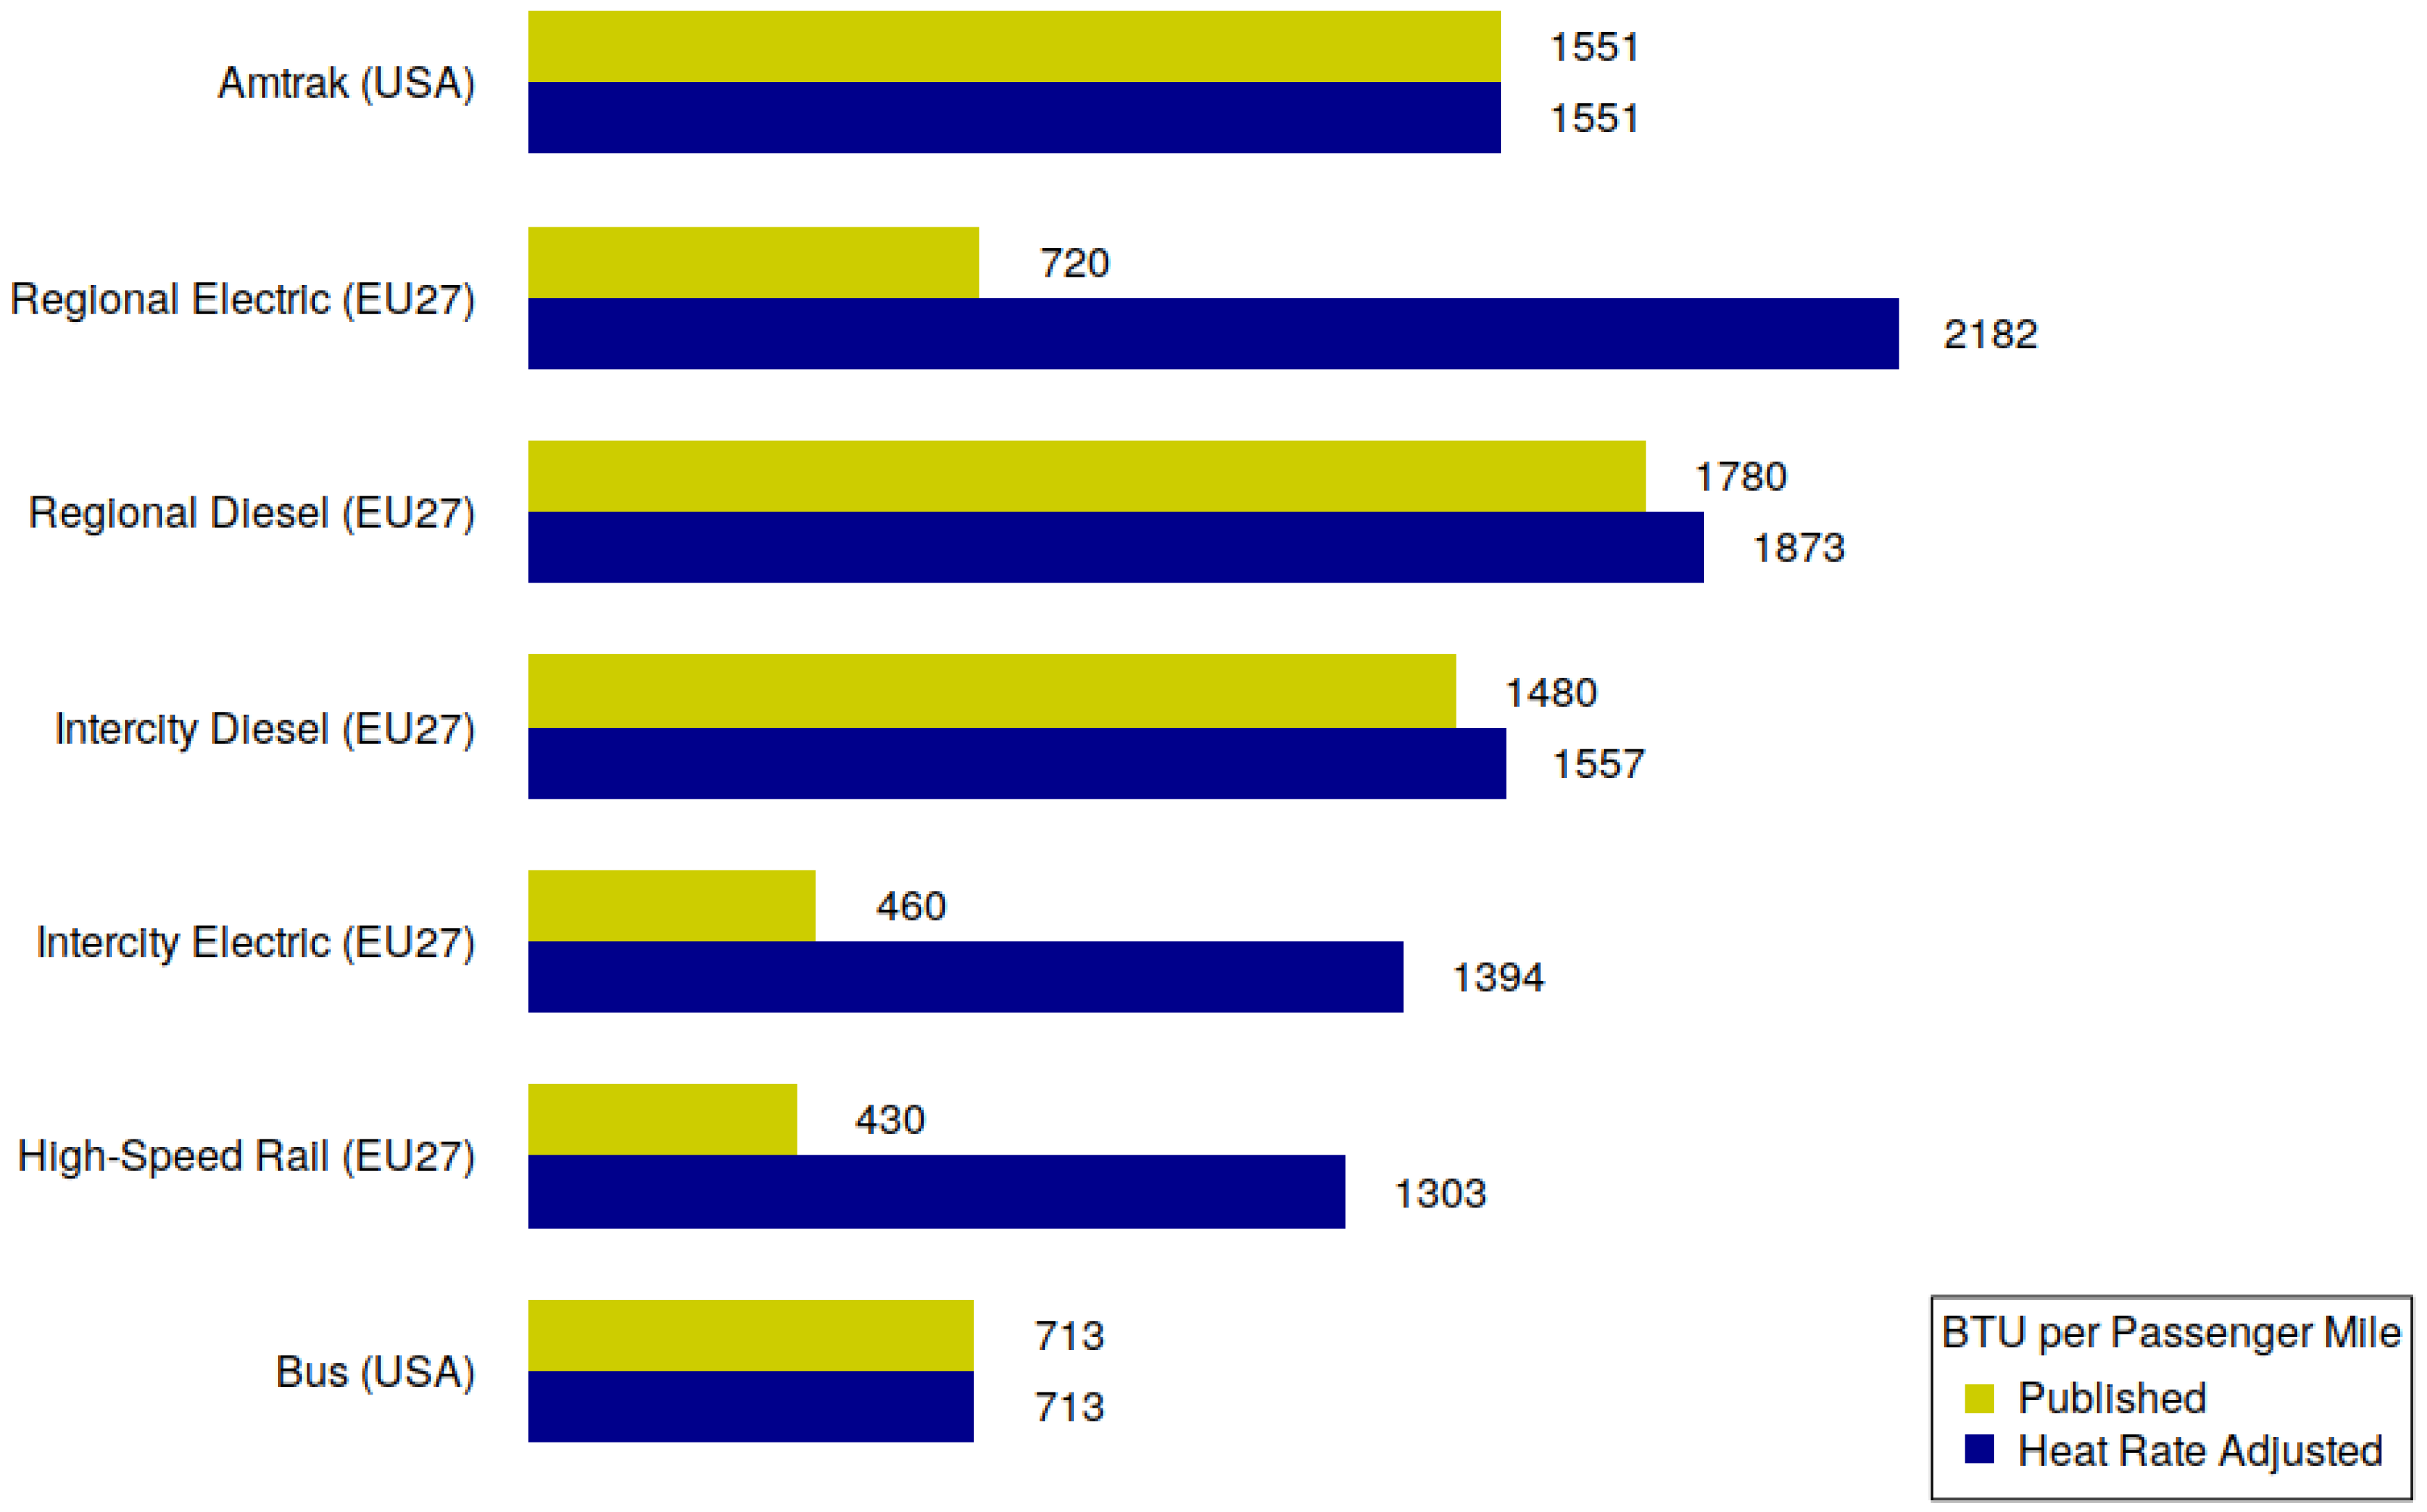
In 2016, Amtrak used around 60 million gallons of diesel fuel and 517 GWh of electricity for traction, with the electricity use exclusively in the Northeast Corridor [
15] (p. A-16). For the baseline overall Amtrak energy intensity figure used in this article, Davis et al. [
15] followed the European practice [
39] in using the theoretical heat content of 3412 Btu per kWh, resulting in an intensity figure of 1551 Btu per passenger-mile. However, Davis et al. noted that previous editions of their reports “included primary energy use for electricity which included generation and distribution losses”, a practice which formerly made Amtrak’s energy intensity figures more comparable to auto and air transportation.
In contrast, Bureau of Transportation Statistics [
27] (Table 4-27) converted electricity to Btu using a heat rate of 10,339 Btu per kWh that assumes a 33% conversion efficiency for fossil-generated electricity, resulting in an system-average energy intensity of 2099 Btu per passenger-mile that is 35% higher than the Davis et al. figures. Curiously, as late as 2019, the Amtrak website used 2014 data from Davis et al. calculated with this older methodology, giving their publicized number of 2118 Btu per passenger mile a 36% premium over the 2016 values [
1], ([
2], pp. 9–11).
While most authors and agencies evaluating electrified rail in comparison to diesel-powered rail seemed to ignore this incompatibility, rail critic Roger Kemp [
40,
41] incorporated fossil power-plant losses, transmission system losses, and catenary system losses in asserting that, in the UK, cars, airplanes and rail are largely equivalent in terms of primary fuel use. Kemp did acknowledge that the “conditions could be very different” in countries where electricity comes largely from nuclear or hydro, but he did not propose any analytical method for comparing situations with those different conditions [
40] (p. 79). García Álvarez [
42] noted that Kemp’s HSR energy figures are significantly higher than measured performance on a comparable Spanish AVE system.
Figure 3 shows European energy intensity numbers adjusted to US heat rate values.
Even within the nominally objective realm of theoretical heat content, there are areas of meaningful ambiguity that affect the reliability and comparability of published numbers.
Hydrocarbon fuel sources contain empirically-measurable amounts of heat content. However, the actual heat content for specific supplies of a fossil or organic fuel can vary by weight or mass, with different types of coal presenting an especially wide range of values (from 9 MM Btu/ton for low-quality lignite to 30 MM Btu/ton for high-quality bituminous). Heat contents are tracked and averaged by government agencies [
15,
43]. Ethanol has a significantly lower energy density than conventional gasoline (84,600 Btu/gallon vs. 125,000 Btu/gallon) and the increased blending of ethanol in standard automobile fuel calls into question any statistics based on the conversions of gasoline gallons into energy content using the conventional content value.
In addition, the heat content of a fuel can be expressed as gross (high) value that includes all heat released when the fuel is burned, or a net (low) value that excludes the latent heat of water vapor formed during combustion, resulting in a difference of 5–10% depending on fuel. The US EIA uses the high heating values, while the low heating values are typically used in European calculations [
43] (p. 321), making energy intensity figures from Europe understated relative to US statistics.
While the use of the theoretical rather than heat-rate conversion factors may reflect a desire by rail operators to improve the marketability of passenger rail as sustainable, the choice of conversion factors reflects a substantive core assumption about what is being sustained.
The fundamental incomparability of energy from fossil and renewable sources raises a core question of exactly what phenomenon is being measured under the concept of energy intensity. Conservationist discourse presumes that lower energy intensity is better, and the advent of contemporary energy intensity research in the 1970s has a direct philosophical connection to a discourse of scarcity [
44]. When comparing modes powered by fossil fuels, the phenomenon is efficient use of finite stocks. In relation to modes using renewably-generated electricity, the phenomenon is maximizing utility of constricted flows. Efficiency ratings based on theoretical potential do exist for wind turbines and solar cells ([
45], p. 34), [
46], but, since the lost energy with renewables is from flows that can be presumed to continue indefinitely, such efficiency is conceptually different from efficiency losses of finite, irreplaceable fossil energy stocks.
4. What Energy Is Considered?
Most published energy-intensity statistics only consider the operational energy directly used by the vehicles, although in some cases losses in the electrical generation or fuel production process are considered [
40], ([
47], p. A-23). All transportation systems require vast amounts of resources to facilitate their operation. Since those resources require energy to manufacture, maintain and operate, that energy has been considered in assessing the energy intensity of a transport mode.
One common analytical methodology involves the use of Leontief input-output matrices [
48] of the US economy in conjunction with industrial energy pricing information to create energy-dollar flow models for calculating the direct and indirect energy costs of goods and services.
Hirst [
49] performed this type of analysis for total automobile energy costs (in a monograph of otherwise conventional statistical analysis) using coefficients from Reardon [
50] and concluded that, in 1968, the total life-cycle energy used by an automobile was twice the amount of direct energy use from fuel. This analysis does not appear to include the energy costs of road construction. In a similar analysis of aviation, Hirst [
51] used 1963 coefficients from Herendeen [
52] to conclude that indirect energy use represented an additional 33% above the direct energy use by airplanes of fuel, although 60% of that was devoted to fuel refining. The Energy Research Group at the University of Illinois under the direction of Bruce Hannon used the input-output technique extensively for a number of years across a wide range of sectors, including transportation [
53,
54].
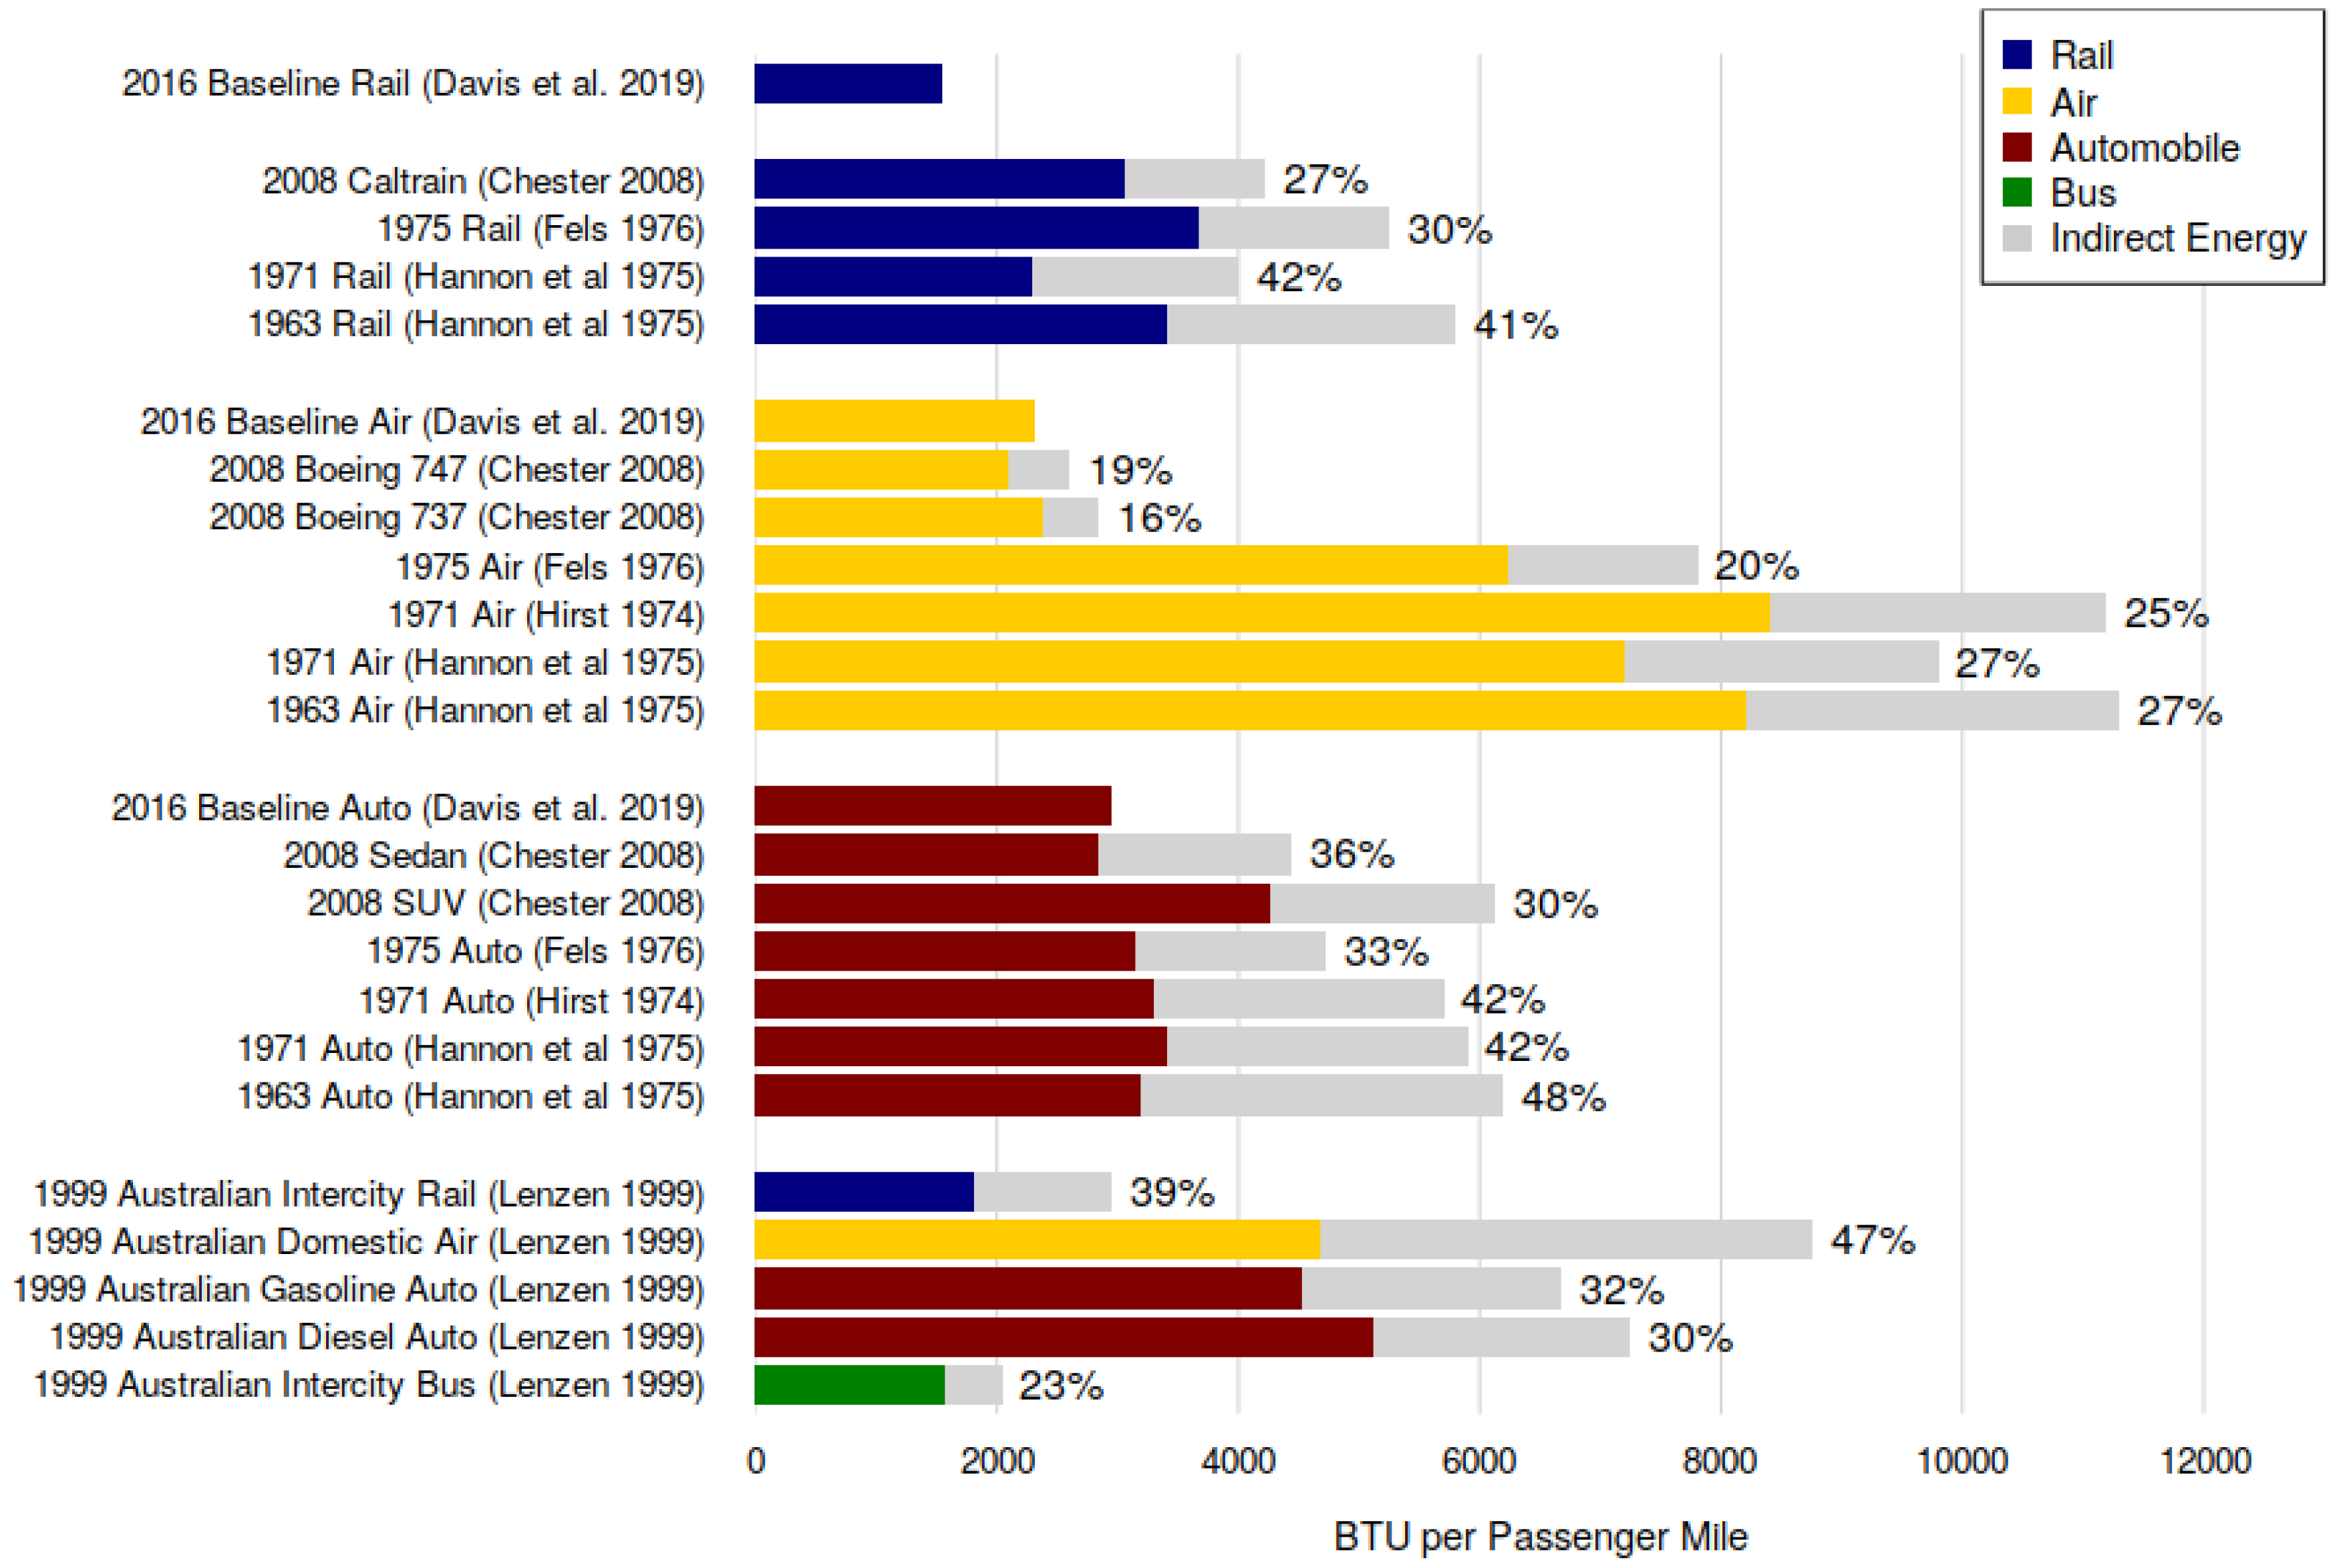
Results from Hirst [
51,
55] and Hannon et al. [
23] are shown along with the 2010 baseline intensity figures in
Figure 4. Lenzen [
56] also applied this technique in Australia and those results are included at the bottom of
Figure 4.
A complimentary bottom-up approach emerged in the 1970s with Fels [
57,
58,
59,
60] that involves decomposing product life-cycles into processes and materials that are then analyzed for their energy intensity, with the results summed to find the indirect energy embedded in a product or service. This methodology has become especially popular in recent years for analyzing the greenhouse-gas impacts of individual consumer purchasing choices. While this methodology is fraught with issues about where to set analytical boundaries, the process can be seen as somewhat more intuitive than the input-output accounting method.
Unfortunately, there does not yet appear to be a comprehensive life cycle analysis of Amtrak, and separating the costs of passenger from freight service has been a highly contested issue for decades [
36,
61,
62,
63,
64]. Assuming that track damage and wear is proportional to ton-miles [
65], Amtrak’s share of rail maintenance energy outside of the passenger-intensive Northeast Corridor is likely minimal. Amtrak [
66] traveled around 37 million train-miles in 2011. Assuming a typical long-distance train weight of 850 tons similar to the
California Zephyr, Amtrak only accounted for 31 billion or under 2% of the 1.7 trillion ton-miles carried by US Class I railroads [
67]. Since most non-NEC Amtrak rail service operates on tracks shared with freight, US long-distance rail does not incur the energy costs of dedicated infrastructure typical to HSR systems in other countries.
The situation is similar for automobiles and buses. Automobiles and buses are totally dependent upon a vast street and highway network, and robust maintenance is critical to passenger travel. However, Chester [
68] (p. 40) noted that the damage to roadways follows a fourth-power function of weight per axle, and the vast majority of roadway damage (including 98.4% of the damage to rural interstates) is attributable to freight trucks.
Fels [
58] and Congressional Budget Office [
34] asserted that the energy cost of rail equipment manufacture was comparatively insignificant when distributed over the operational life of a vehicle, something that likely remains applicable to the long-lived Superliner passenger cars from the late 1970s and mid-1980s that dominate Amtrak’s long-distance routes.
Chester [
68] performed a comprehensive transport life-cycle energy analysis on a variety of transport modes, including three types of light-duty vehicle, three types of airplanes, three types of urban rail systems, the Caltrain commuter service, and the proposed California HSR system. Some of those numbers are included with the historical numbers in
Figure 4. The Caltrain numbers may be at least vaguely applicable to long-distance service, as Caltrain operates diesel trains on shared corridors.
Chester’s findings for rail, aviation and automobiles are surprisingly similar on a percentage basis to Fels’ data of almost 40 years prior. As with operating energy, rail and sedans are fairly similar on an absolute per-passenger-mile basis in both direct and indirect energy. The much smaller amount of terrestrial infrastructure needed for aviation does appear to give it an advantage on a life-cycle basis. However, the significant technological and economic changes over the 34 years call into question the comparability of these different studies, and the very significant differences between the US and Australian studies call into question whether there is a definitive, essential life-cycle energy intensity that can be universally associated with any transportation mode.
5. How Many People Are in Each Vehicle?
The task of carrier management in the private sector and transportation policy in the public sector is to juggle the conflicting demands of capital utilization, customer satisfaction, operational cost, and political support in a way that maximizes satisfaction of institutional goals. While conservationist and economic perspectives value maximizing the number of people in vehicles and, accordingly, minimizing the amount of capital and energy investment, the plethora of other influences on vehicle loading add difficulty to the ascertainment of any fundamental energetic advantages of a particular transport technology, and make it difficult to objectively compare aggregated energy intensity numbers across modes.
Load factor is the percentage of available vehicle seats occupied during a period of operation. Although an increased number of passengers adds weight and can increase the amount of fuel consumed by a vehicle, in general, such increases are slight and load factor can be seen as inversely proportional to energy intensity. Load factor represents a ratio between potential efficiency and actual efficiency. If high energy efficiency and/or strong economic performance are primary goals, high load factors are needed.
On common carriers load factors can vary widely by route, day and season. Aggregation of these different operations makes comparison simpler, but obscures fine-grained variations that may be meaningful to rational assessment of specific subsets of operations for the mode as a whole. High-density main line routes can be dependent on passengers brought to hubs on low load factor feeder routes. Because long-distance trains and buses make multiple stops along their route, capacity utilization can vary widely along the route, although this is averaged by dividing overall passenger-miles by seat-miles [
69].
Amtrak’s system-wide FY 2007 average load factor of 52% is the aggregate of load factors for different routes ranging from 31% for the New York–Harrisburg, PA Keystone Service to 68% for the New York–Montreal Adirondack route [
70]. Amtrak’s load factor in 2011 varied over the year from 45% to 64% with a yearly average of 52% [
69].
The US domestic average air load factor of 83% for 2012 varied over the year from 78% in January to 87% in July [
71]. Airlines have historically needed load factors of at least 65% to break even, and that has increased to around 80% in recent years. The actual minimum economic load factor for any given airline is dependent upon economic conditions [
72].
Although Greyhound, the only remaining national motorcoach carrier in the US, does not publicly disclose load factors, a report by M.J. Bradley and Associates [
73] cited a census conducted by the American Bus Association in placing the scheduled motorcoach load factor for 2004 at around 47%. The John Dunham and Associates [
16] bus census reported 34.1 passengers per service mile in 2011, which yields a load factor of 62% assuming a typical 55-passenger bus. However, the percent of bus passenger-miles from regularly-schedule intercity service has dropped from 81% in 1970 to around 30% in 2010 [
16] (p. 12), [
74] (pp. 5–9), so industry-wide bus figures that aggregate regularly-scheduled, charter, tour, airport and sightseeing services are not directly comparable to the scheduled-service-only figures for Amtrak.
Official public load factor information for international rail systems is difficult to come by, but load factors in the US seem to be in line with load factors on comparable international systems.
Figure 5 includes sources mentioned by New Lines Programme [
75] augmented with additional data from public statements and news reports that cannot be assured to be accurate. Some quoted HSR load factors are well above 50%, although the publication of figures only for popular lines avoids system averaging that more clearly reflects less-trafficked lines that are important to the functioning of the network as a whole. Andersson and Lukaszewicz [
76] (p. 9) contrasted local versus long-distance service in noting that local and regional services have to provide spare capacity to manage large rush-hour peaks, which results in modest average load factors of 20–40%, while the long travel times and high, demand-regulated pricing associated with long-distance and HSR service result in smoothed load factors that average in the 50–75% range on different systems.
The analogous metric for private automobiles is occupancy rate, or number of occupants per vehicle, with the energy efficiency metric of passenger miles per gallon obtained by multiplying occupancy rate times the vehicle miles per gallon.
Because the operation of private vehicles is not directly monitored by any central coordinating entity in the same way as airlines or rail, occupancy rate statistics must be modeled based on travel and traffic surveys, adding significant levels of uncertainty, especially when attempting to consider the purpose of travel or when comparing statistics over vastly different time periods. The BTS and FHWA base their passenger-mile estimates on the 2009 National Household Travel Survey, but the BTS/FHWA use an automobile occupancy rate of 1.35 versus the 1.55 used by Davis et al. [
15], which results in higher auto energy intensity in the BTS/FHWA numbers. Because the FHWA data are only grouped by short- and long-wheelbase light-duty vehicles, Davis et al. [
15] used a model to divide between “cars” and “light trucks”, which likely filters out large energy-intensive commercial vehicles from the latter category.
While individual automobiles only need to operate when demand dictates, and have the potential for higher load factors than regularly scheduled common carriers, the trend globally has been in the opposite direction. Schäfer et al. [
90] (p. 82) noted a decrease in occupants per vehicle in the US from 2.2 in 1969 to 1.59 in 1995, with the decrease attributed primarily to decrease in household size and increase in number of vehicles. Accordingly, any assumption that automobile energy intensity is a fixed value or one that teleologically can only improve with technology is subject to question.
A further ambiguity with the use of occupancy rate in energy intensity analysis is the different averages for local and long-distance driving. Rail critic O’Toole [
37] cited Thompson [
91] in pointing out that in automobile trips longer than 75 miles (which presumably are in competition for riders with long-distance Amtrak), the occupancy rate for autos in 1990 was 2.19 occupants per vehicle, versus the average of 1.6 for all auto trips commonly used for computation of energy intensity. Data from the more-recent 2009 National Household Travel Survey indicate slight increases in overall occupancy rate, and that the occupancy rate for “social and recreational” purposes (which could also be presumed to compete more directly with Amtrak) at 2.2 occupants per vehicle [
92] (p. 33). Using that higher occupancy rate, the aggregate statistical energy advantage of Amtrak over private automobiles largely disappears.
6. What Is Distance?
No transportation mode can provide direct point-to-point access except in the most trivial (or expensive) cases. All modes involve some additional distance for routing considerations and non-revenue movements as well as, in the case of common carriers, access to terminals from initial points of departure and ultimate destinations.
Circuity is the ratio of network distance to Euclidian distance and represents the additional travel distance through a modal network relative to the minimum possible travel distance over the surface of the earth [
93]. When energy intensity is expressed simply as Btu-per-passenger-mile, these additional miles of circuity are not considered and the energy intensity per mile of meaningful distance traveled is understated.
This is an especially significant consideration with the existing, limited Amtrak network. When traveling between city pairs that have direct connections, the train will likely be on par with driving distance. The great circle distance between Chicago and New Orleans is about 835 miles. The driving distance is around 925 miles (1.11× circuity multiple) with the City of New Orleans distance stated as 934 miles (1.12× circuity multiple).
However, when traveling between city pairs that require multiple trains, the distance premium can be substantial, in addition to the possibility that uncoordinated schedules and operational delays may result in long layovers in the transfer city. The great circle distance between Seattle and New Orleans is around 2100 miles. The driving distance is around 2600 miles (1.24× circuity) and the Amtrak service through Chicago is a total of 3140 miles (1.5× circuity). In such a case, the train would have to be 18% less energy intensive than driving and 33% less energy intensive than flying (assuming a direct flight) simply to be on par with either mode.
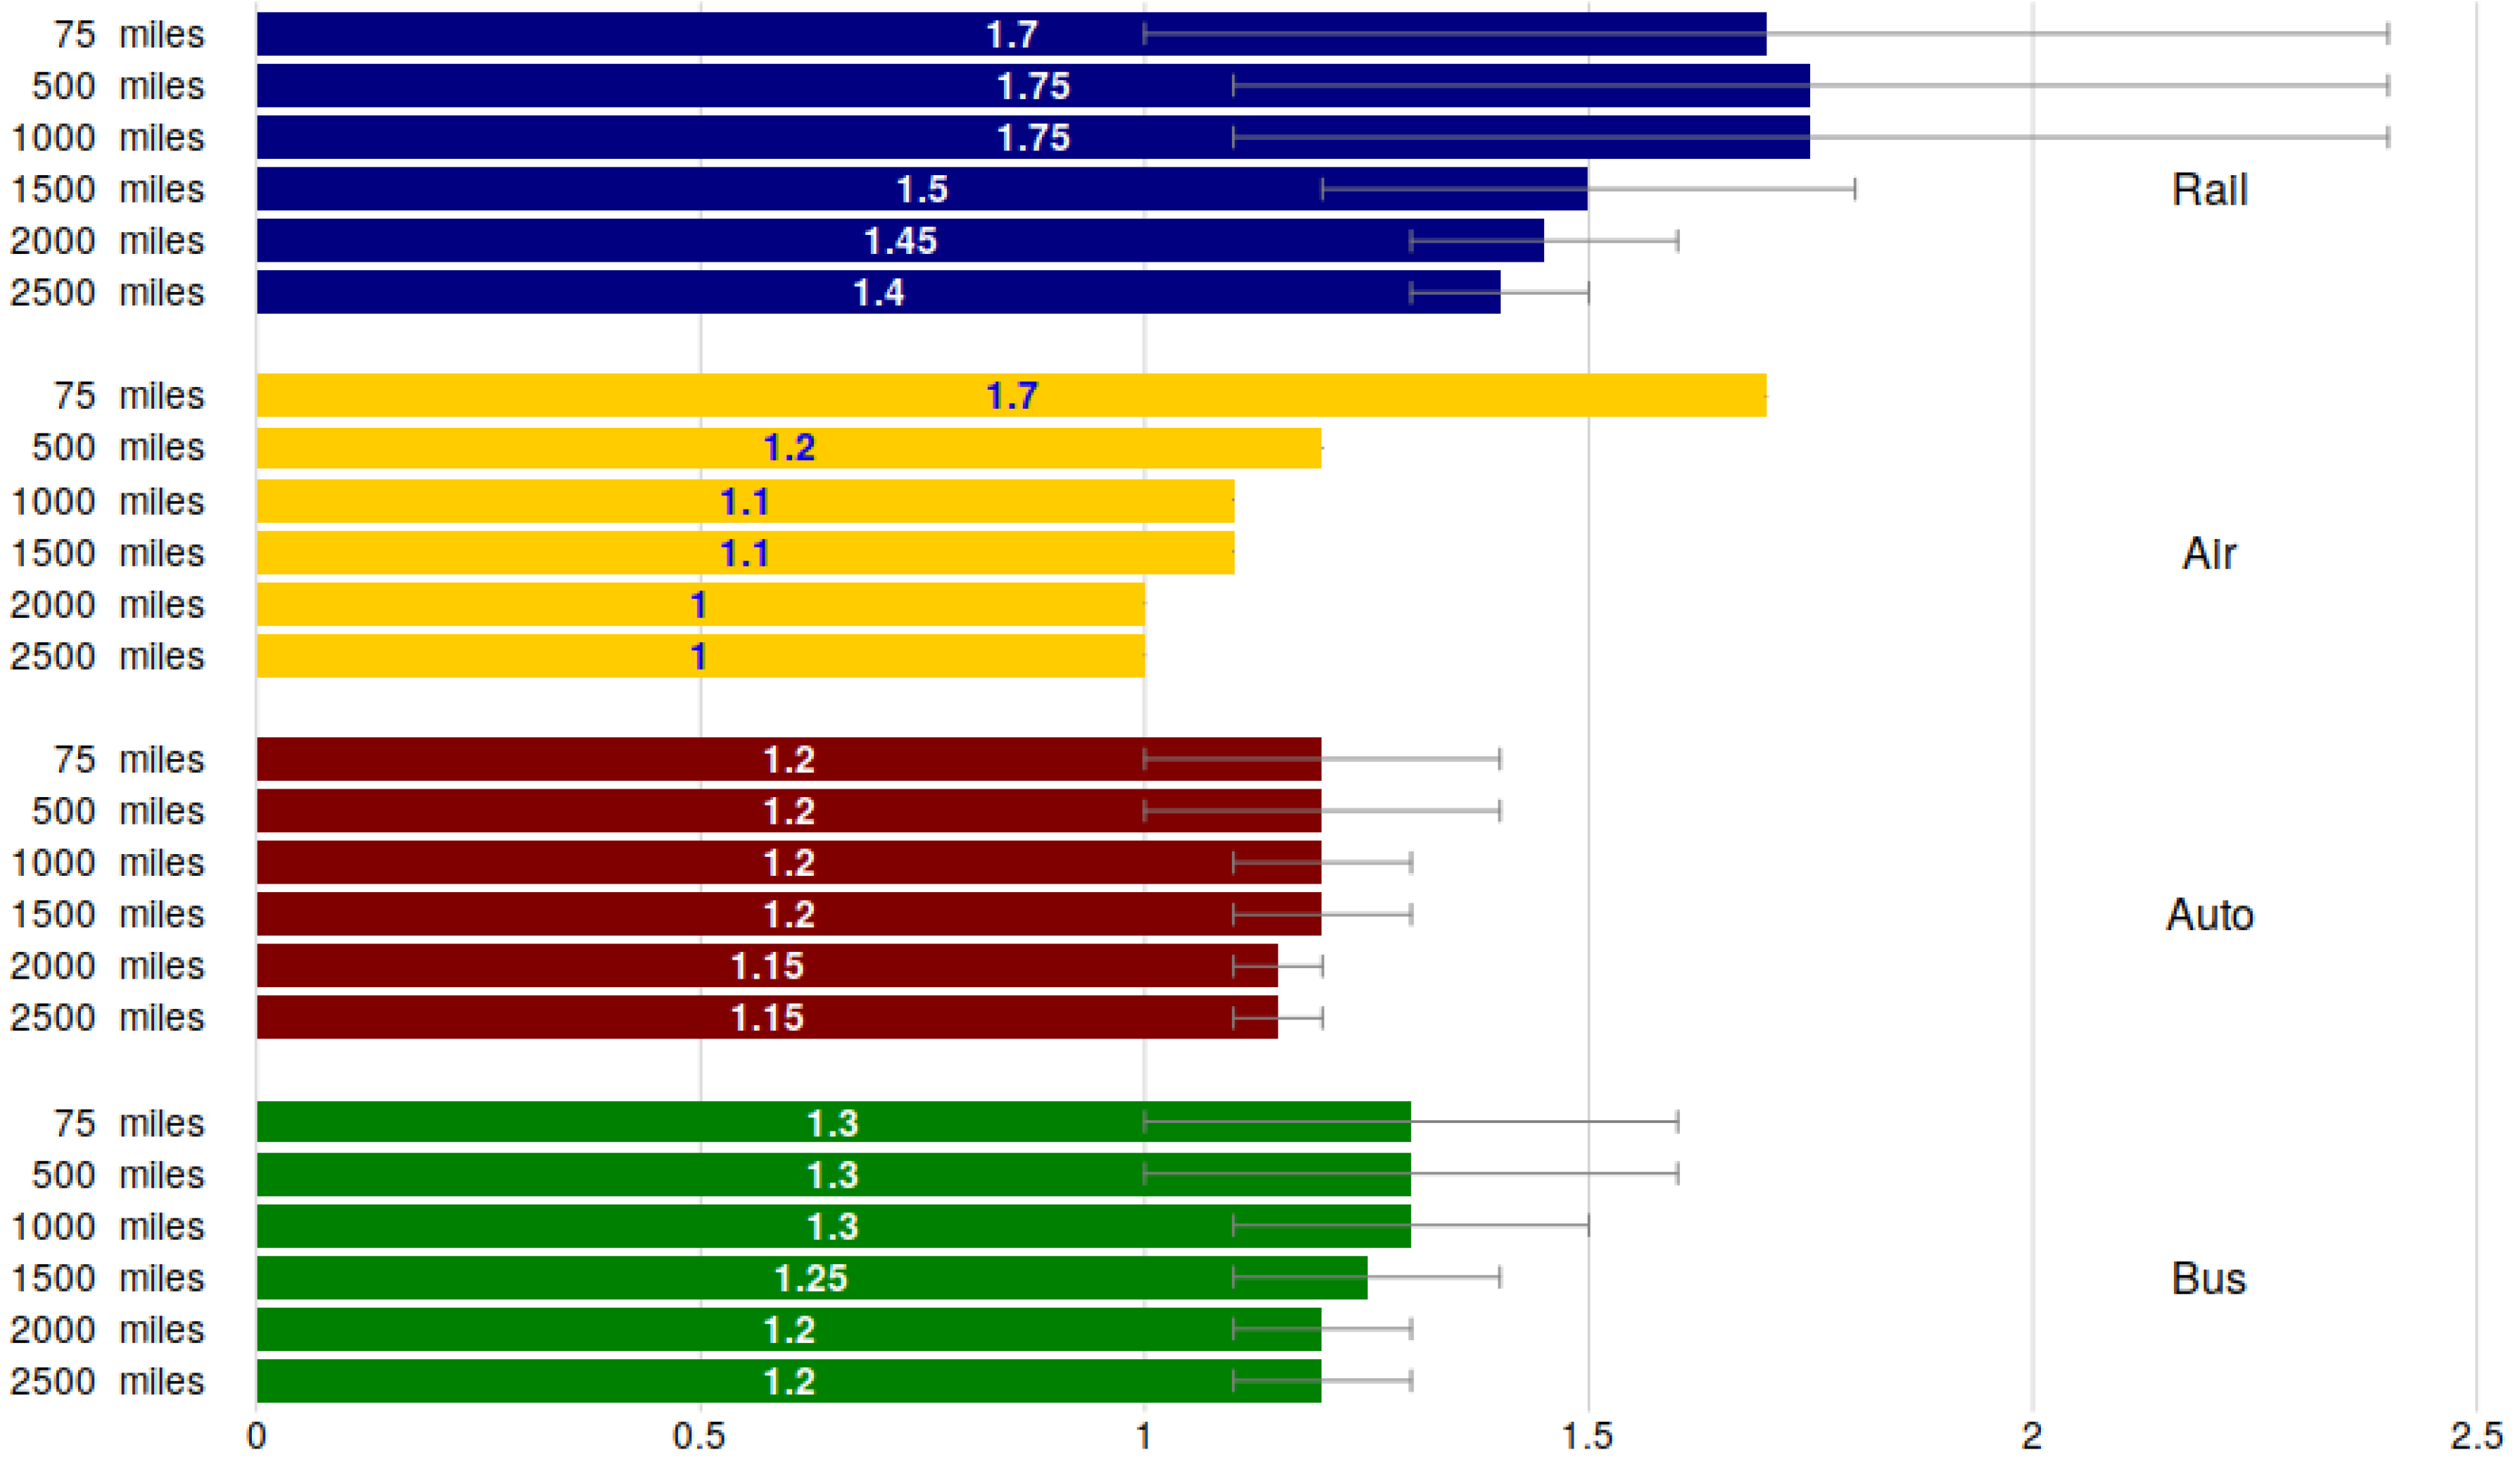
Boeing [
32] performed an analysis of 94 city pairs to find ranges of circuity multiples for different travel modes (
Figure 6). This analysis by an aircraft company clearly favored direct air travel as travel distances increase, although the report acknowledged that highly circuitous rail travel was uncommon and that the most frequently traveled city pairs on Amtrak were below a circuity of 1.45×.
Additionally, in focusing on long-distance rail as an object of analysis, a definition must be made of of exactly what “long-distance” is. This leads to an ontological ambiguity as to whether such operations can be considered distinct from non-long-distance operations.
Much of the current policy discourse on rail focuses on commuter/regional rail, subway, light rail and streetcar lines as potential solutions for fostering sustainable mobility and economics by permitting dense residential and commercial development. High-speed rail (HSR) in the US is largely envisioned as an extension of regional/commuter rail that will permit integration of mega-regions as substitution for short-haul aviation.
By contrast, long-distance lines hearken back to an older mobility paradigm that predates broadly-available commercial aviation. In a more energy-constrained future, energy-intensive commercial aviation may become less economically-viable as a mobility solution for the general public. Should such constraints also affect the ability to maintain automobility and the vast, complex physical infrastructure that makes automobility practical, a larger role for railroads in long-distance travel may (or may not) become practical.
Amtrak, the only remaining national passenger rail carrier in the US, has used a variety of categorizations of service for reporting purposes over the years, although Amtrak [
94] (p. A-34) monthly reports divide service into three categories, namely the Northeast Corridor Spine, State Supported and Other Short Distance Corridors, and Long Distance, with specific train names provided in the categories. The long-distance category ranges from the 780-mile
Capitol Limited (Chicago to Washington, DC) to the 2728-mile
Texas Eagle (Chicago to Los Angeles). The Passenger Rail Investment and Improvement Act of 2008 (section 201) defined long-distance as over 750 miles. Puentes et al. [
95] defind long-distance rail travel as around 400 miles or greater, which is below the 500–600 mile upper limit where high-speed rail has classically been considered competitive with air travel [
96,
97].
Despite this nominal distinction, in practice, long-distance routes commonly overlap and share riders with corridor operations. For example, the 934-mile City of New Orleans between Chicago and New Orleans is a third train along with the 300-mile Saluki and Illini in the Chicago–Champaign–Carbondale Illinois corridor. The 1377-mile Crescent between New York City and New Orleans begins its route as one of a multitude of different trains in the heavily-trafficked Northeast Corridor that is shared with the New Jersey Transit and Metro North commuter lines. Long-distance routes have multiple intermediate stops and many individual journeys are much shorter than the full route length.
Corridor-only operations have tighter seat pitch (higher per-car capacity) and lack other amenities such as sleeper or dining cars that cater to passengers making extended journeys. This makes the distinction meaningful for energy-intensity analysis, but the absence of disaggregated operational information for long-distance service makes specificity difficult.
7. What Is the Purpose of Transportation?
This concept of circuity is based in the utilitarian perspective of neoclassical economics, which also happens to be at the core of the definition of energy intensity, and which serves as the foundation of much of the oppositional rhetoric to Amtrak’s continued existence. From this viewpoint, the purpose of transportation is to get from origin to destination using a minimum of time, distance, energy and cost. This perspective privileges the quantitative over the qualitative and frames as irrational the reasoning used by riders that make an aesthetic choice of Amtrak over faster, shorter and more-efficient modes.
A report by the United States Government Accountability Office [
98] (pp. 23–24) included a survey-based estimate that over 80% of riders on long-distance Amtrak routes were on “recreational and leisure trips, including visits with family and friends and for personal business, compared with other types of travel, such as business or commuting.” Thirty-three percent of long-distance rail travelers were estimated to be retirees. For many, if not most of these people, long-distance rail travel is about the journey rather than the destination, and Amtrak’s circuity is a virtue rather than a vice.
The question of purpose returns the energy intensity question to the fundamental contradiction that has been at the heart of Amtrak since its founding: whether it exists to provide an economically (and energetically) rational transportation service, or whether it exists to preserve and enhance a politically-popular transportation mode whose virtues are more qualitative than quantitative. Those present at the founding of Amtrak who held the former position assumed that Amtrak would wither and die from its own irrationality. Those holding the latter position saw Amtrak as the long-needed nationalization that would result in rebirth. This tension persists in the perennial political battles that surround Amtrak funding, and the contradiction is physically manifest in voluminous, heavy rolling stock that offers more in terms of comfort and safety than in the energy efficiency that is part of its marketing.
The concept of the passenger-mile is rooted in an Enlightenment focus on the individual as the fundamental unit of society and fundamental unit of analysis. From this perspective, a 20-pound infant is functionally equivalent to a 300-pound linebacker, despite the radically differing travel and service needs of those two different types of passengers. A car transporting a nuclear family of four people serves a different social purpose than a car transporting four carpooling commuters or a driver and three hitchhikers. While the family car is an integral component of produced suburban space, the carpool and hitchhike require the expenditure of additional energy and effort, and, in some cases, the violation of social norms.
This also points to the difference in the value of energy intensity numbers in the decision-making process at the individual or collective level. The “state” in “statistics” needs generalized numbers for guiding public policies that control the social behaviors that affect collective energy consumption. Accordingly, embedded (and often hidden) social and political power relations directly affect the thermodynamic power relations of social function.
In contrast, attempts by individuals to minimize personal energy consumption need analysis that focuses on energy consumption at the vehicular and trip level in order to avoid the
ecological fallacy. The Union of Concerned Scientists [
99] took this perspective in their guide,
Getting There Greener: The Guide to Your Lower-Carbon Vacation. This guidebook recommends travel options based on distance and traveling-party size, which reflects the differing social purposes of transportation. For example, while the train is more suited to the solo traveler, the automobile is more functionally and energetically suited to travel by a family of four. The guidebook also addresses the issue of service class that is hidden in aggregated vehicle capacity figures by noting that premium service like first-class air and sleeper rail occupy more volume/weight and have a higher energy intensity (and carbon footprint) than coach service.
8. What Is the Energetic Value of Safety and Comfort?
Rail’s rolling resistance and aerodynamic resistance advantages with heavy, time-insensitive, weather-tolerant, inanimate commodities are significantly reduced when applied to light, time-critical, physically-sensitive, and highly-litigious living beings. The weight and velocity determinants of physical resistance and energy consumption are directly tied to passenger safety and comfort. Passenger safety and comfort are directly tied into the continued existence of long-distance passenger rail in the United States. Therefore, the energetic disadvantage of Amtrak compared to rail in the rest of the world can be directly traced to questions of service quality via weight and volume.
Weight and speed are directly related to safety in that desired increases in crashworthiness generally require reinforcement and safety equipment that increase weight [
100] (pp. 1986–1987). Increases in speed increase demands for crashworthiness. This implies a social, political, operational and economic trade-off of safety versus high speed and low weight, and, accordingly, energy intensity.
Aside from the Northeast Corridor’s
Metroliner and
Acela services, passenger rail service above 79 miles per hour (MPH) has remained elusive in the rest of the country since the 1940s, in part due to safety regulations limiting passenger train speed to 79 MPH on track without advanced signal protection. Those regulations ostensibly have their origin in a grisly 1946 accident near Naperville, IL involving two Chicago, Burlington, and Quincy Railroad passenger trains [
101] (p. 1938), [
102], although Stilgoe [
103] (pp. 68–74) asserted that a significant impetus for those regulations was political pressure from the then-ascendant highway, trucking and automobile industries. While it could be argued that these speed restrictions have worked to the energy efficiency benefit of Amtrak long-distance service, regulatory and operational speed limits have limited the utility of rail service to potential riders and, therefore, the competitive advantage of passenger rail over cars and airplanes.
The weight/energy vs. safety/comfort trade-off is also of significance in analyzing passenger rail in the US since the Federal crashworthiness standards increase the survivability of collisions at the expense of higher car weights and energy intensity [
104,
105]. This has been typified by difficulties with
Acela high-speed service where crashworthiness requirements increased car weight well beyond international HSR norms, introducing mechanical challenges that have significantly increased maintenance costs and reduced equipment availability [
106,
107].
While higher load factors improve profitability, they reduce the ability of a carrier to respond to demand fluctuations and disruptions, and high load factors are associated with reduced passenger comfort [
72], ([
108], p. 197). Crowding constrains freedom of movement in terminals and on vehicles and can reduce the perceived cleanliness of shared amenities such as bathrooms and lounges. Travelers are often required to share paired seats with strangers, limiting the available space for reclining and for carry-on baggage. High load factors add difficulty to the booking of reservations, constraining available travel times and, due to demand pricing used by all carriers, increasing fares. Common carriers need to run vehicles during off-peak periods in order to make the system operationally useful to passengers. Accordingly, unless a transport mode has a physical or economic monopoly, there is likely a maximum load factor that will trigger mode shift (perhaps with a delay for mobilization or transformation of normative practices) and prevent further increases.
What Amtrak is selling is a transportation experience as much as a utilitarian means of getting from origins to destinations. Unpleasant riding conditions were perceived as one reason for the decline of passenger rail in the US during the mid-20th century [
109] and a consistent motivation behind management decisions since the advent of the service has been the aesthetic improvement of this transportation experience.
The Superliner cars that dominate Amtrak’s current long-distance service outside of the NEC were built on a design based on Budd Hi-Level cars that first began operating on the Atchison, Topeka and Santa Fe Railway in 1956 [
110] (p. 129). Official commentary from Amtrak [
111] (p. 15) while the company was awaiting delivery of the first Superliners indicated that the objective with the 74-ton cars was comfort:
The Superliners will be unmatched anywhere in the world. Their stairways, double-levels and generous lounge and dining areas will provide a train more spacious and varied than ever before. Improved air-cushioned suspension systems will give passengers a smoother ride.
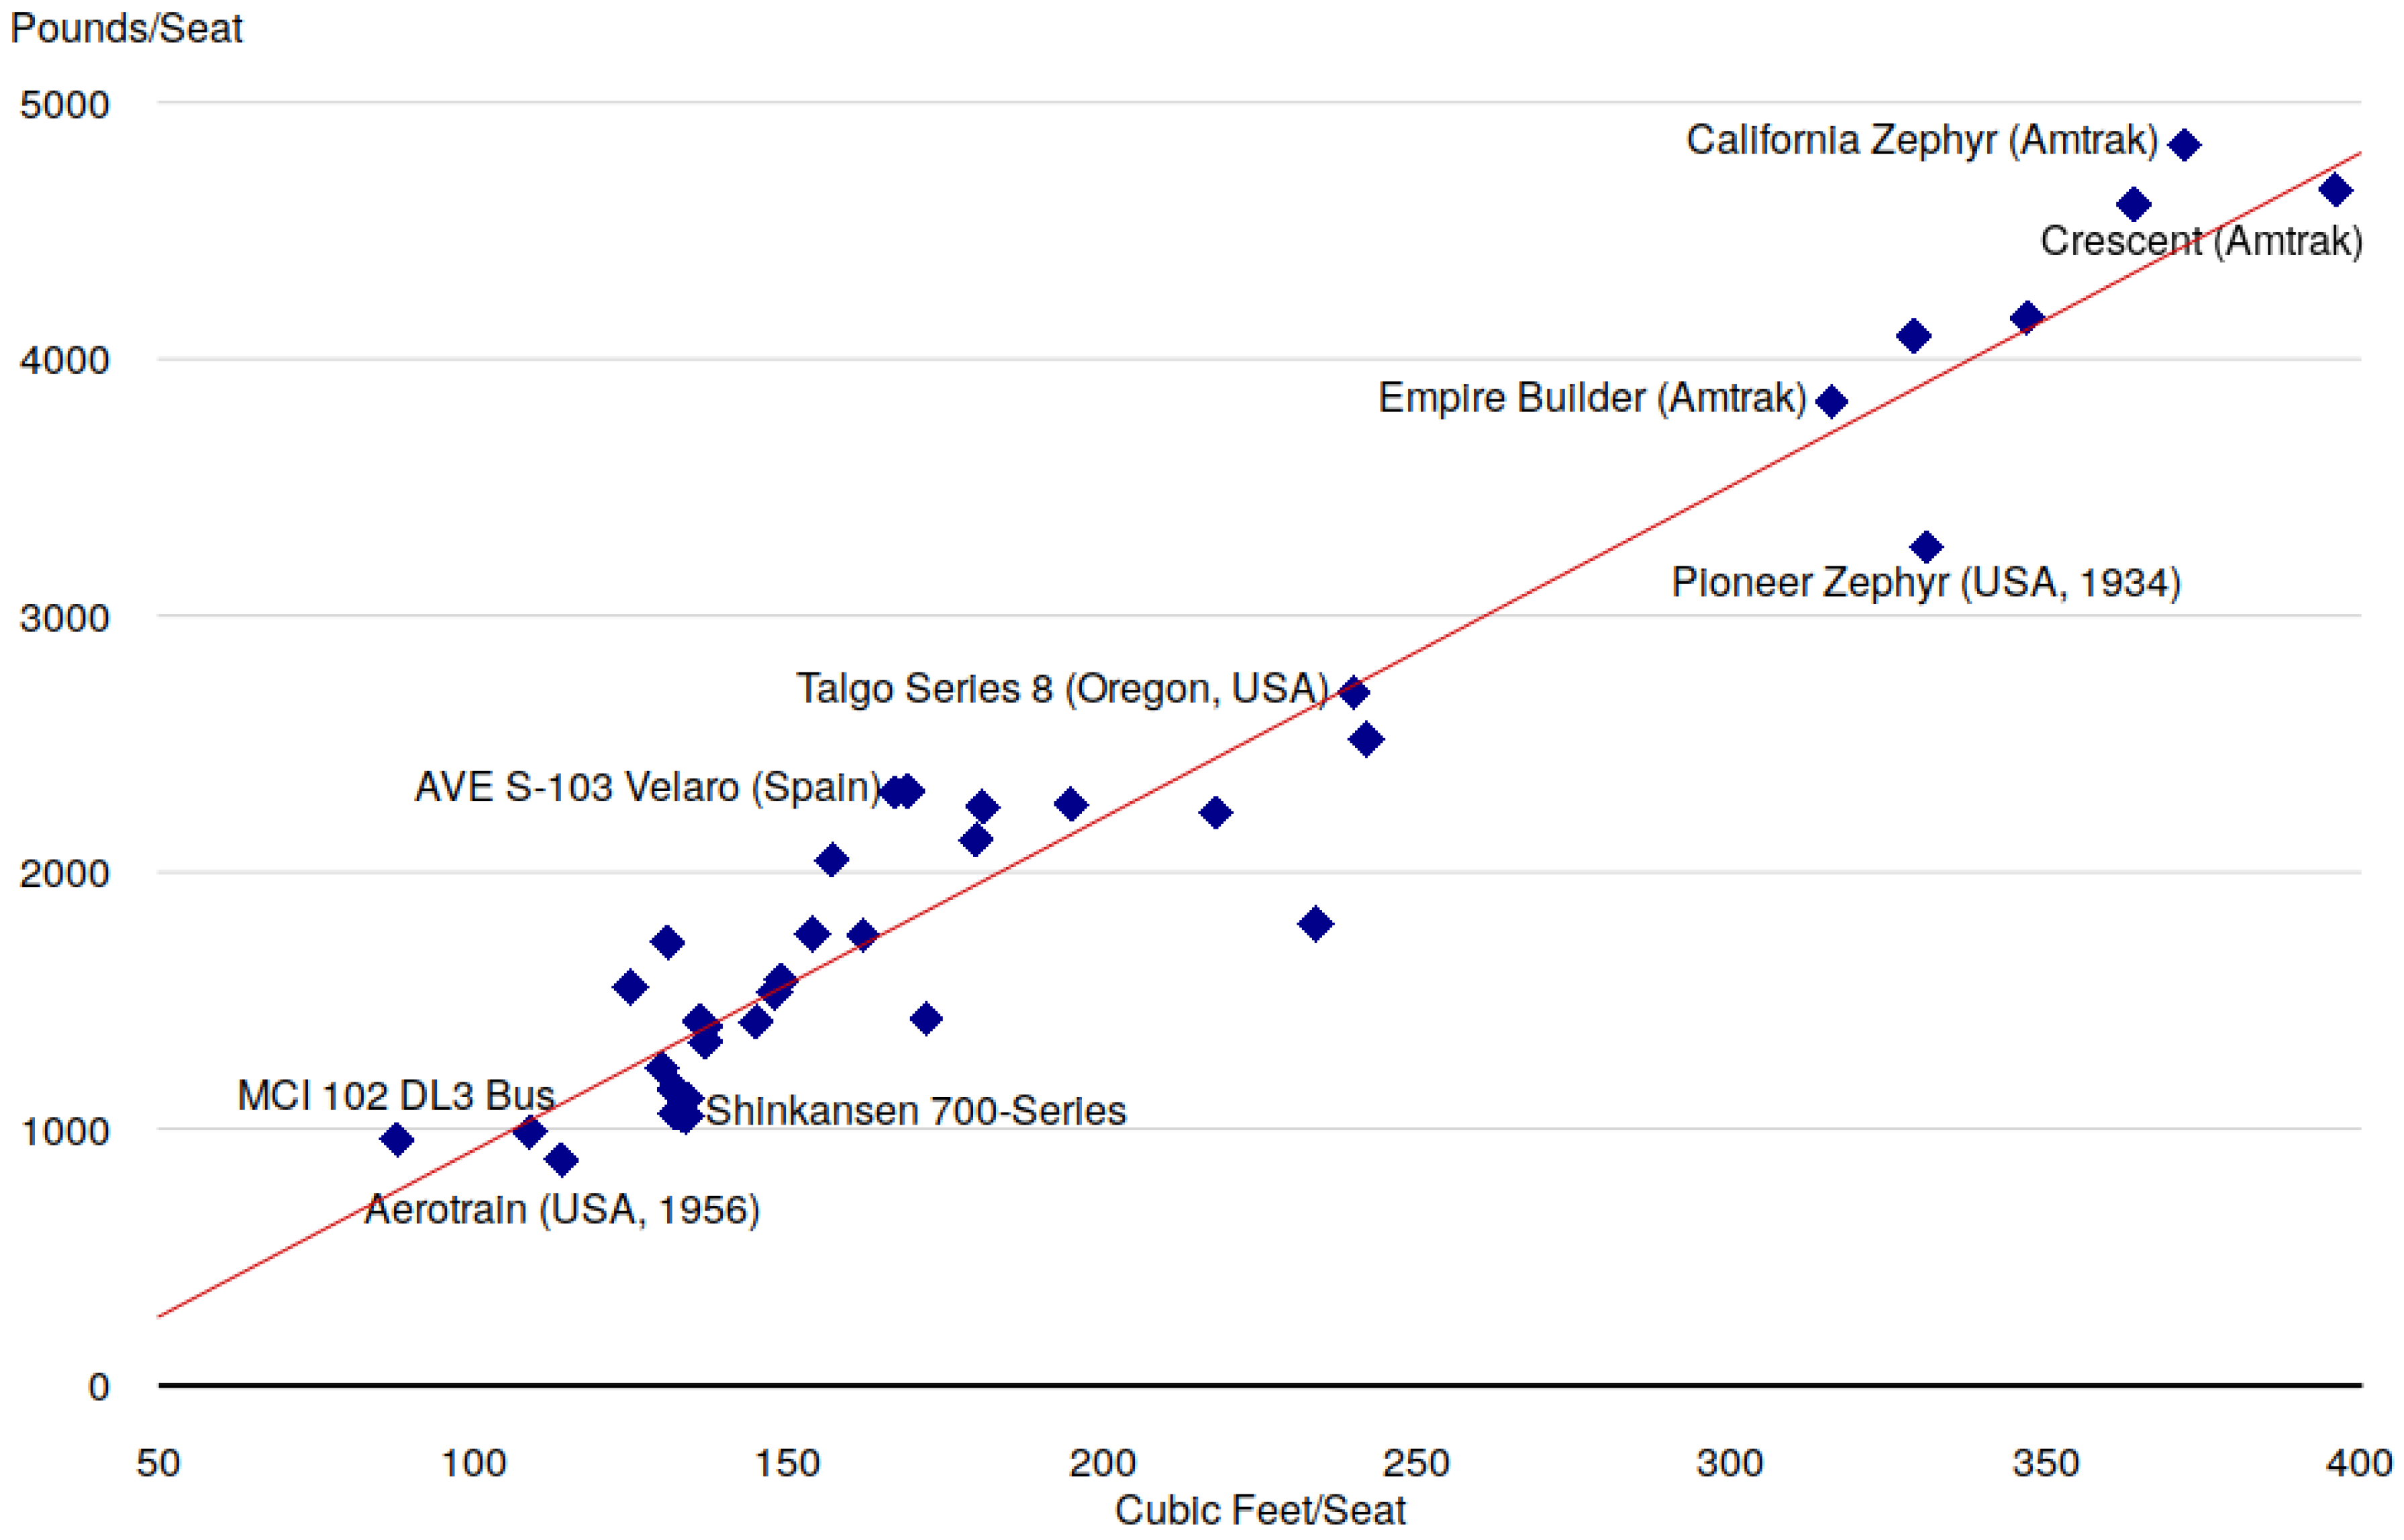
This spaciousness is a characteristic of passenger rail service in the US that distinguishes it from the rest of the world. As shown in
Figure 7, the amount of per-seat total train volume (width × height × length/seats) for trains in the US is well above the norms for regional and HSR services in most of the rest of the world.
Figure 7 also shows a very strong correlation (
) between per-seat volume and per-seat total train weight, indicating that the high weight of passenger trains in the US may be as much a function of qualitative comfort objectives as the aforementioned quantitative safety regulations. Therefore, a premium exists for mass and volume together, with the lower mass/volume vehicles generally having lower energy intensity when operational conditions are similar.
This thirst for weight-volume/safety-comfort has also been seen in automobility in the US. US auto technical efficiency has improved dramatically over the past 40 years, but most of those efficiency gains have been plowed back into larger vehicles and increased horsepower in a demonstration of the rebound effect [
28,
112,
113], an issue exacerbated by decreasing occupancy rates worldwide [
90] (p. 82).
Fuel-intensive aviation has responded to increasing fuel prices with opposite behaviors, transitioning to lighter planes, more-efficient engines and higher load factors, making well-loaded long-haul airplanes now more energy efficient than single-passenger cars ([
15], pp. 2–13), [
114], ([
115], p. 321). Use of higher temperatures and pressures enabled improvements in jet engine fuel efficiency of 35% between the mid-1970s and mid-2000s, with even more substantial reductions in noise and smoke emissions. While a further 30% in improvements are theoretically possible, 25% will likely be a limit without a technological breakthrough for reduction of NO
x emissions [
115] (p. 321). However, as with automobiles, these efficiency gains have also followed Jevon’s Paradox [
116] and induced demand, with efficiency trumping conservation and being offset by growing worldwide demand for air travel [
117].
The physiological and aesthetic demands of long-duration, long-distance rail are different from the needs of passengers on comparatively short-duration HSR corridor trains or domestic flights. A business passenger on a three-hour HSR trip can comfortably catch up on work or nap at her seat with a break or two to get a libation and use the restroom. A passenger on a 48-h journey across the North American West will have a much more pleasant experience if vehicular space is provided for dining, socializing with traveling companions, and fully reclining for overnight sleep. Accordingly, a service with a customer base such as Amtrak’s needs to provide these amenities at the cost of additional weight and higher energy intensity.
Regardless of the variations in energy intensity figures from different areas and eras, the intercity bus always stands head and shoulders above competing modes in terms of fuel efficiency. Buses have been surprisingly immune to weight and comfort improvements for half a century, perhaps reflecting a technology that reached maturity fairly early in its life-cycle. Operational innovations have included low-cost curbside carriers targeting high-traffic corridors as well as a limited number of luxury services in large commuter-intensive markets such as New York City. However, spatial decentralization in the US accentuates the social, temporal and convenience resistances of common-carrier modes including buses.
Omission of the intercity bus from Chester [
68] and other energy analyses may be indicative of the low status of the bus in the intercity transport pantheon. It is also further indicative of how the parameters of utility that influence transport decisions are more complex than simple economics or energetics. Indeed, the fuel efficiency and associated low operating cost of the bus may work against it in creating a broader class stigma from association with the members of society who cannot afford one of the more energy-intensive modes.
9. Conclusions
In 2016, Amtrak’s share of total US transportation energy usage was around 0.04% and 82% of Amtrak’s operational energy was from diesel fuel [
15] (Tables 2.13 and A.16). In 2016, Amtrak handled 6.5 billion passenger-miles or around 0.12% of total US passenger miles, while air travel was around 13% [
27] (Tables 1–40). Amtrak carried 31.3 million passengers, in contrast to 774 million enplaned revenue passengers who traveled on US and foreign airlines serving the US [
27] (Tables 1–37). Even if Amtrak can be said to have an energy intensity advantage over air and private auto transportation, its current contribution to the environment as a problem or a solution is trivial.
Rigorous comparison (as opposed to advocacy based on decontextualized quantification) requires consideration of the multiple dimensions of the phenomenon, the theoretical and empirically-determined ranges of those dimensions, and the capacities for changes in individual and collective behavior that do (and have the potential to) affect the variables used to express those dimensions.
For example, when comparing automobiles that are functionally similar, operate within a fairly limited set of conditions, use a common fuel, and can be subject to standardized measurement methodologies, the difficulties are reduced. However, when comparing modes that use different fuels and motive technologies, operate on different infrastructure, have different passenger capacities, and serve different social purposes, the fuzziness of such numbers is revealed on closer examination, and the numbers begin to have more heuristic than absolute value.
The energetic advantages of passenger rail can probably be best seen as qualitative rather than quantitative. Thompson [
118], among others, noted that rail is efficient in terms of land use, which has secondary energy benefits in promoting compact urban form and reduced building energy use. Rail is also more amenable to electrification than highway modes, offering the potential for the future use of renewable electricity sources with mature, established technology that avoids the considerable drawbacks associated with electrified automobility [
119]. Assertions of these advantages are value-laden and are not reflected in the operational energy intensity calculations.
Accordingly, the question of comparative energy intensity across transport modes is less amenable to the rigors of quantification demanded by the positivist philosophy at the foundation of the neoclassical economics and transportation engineering that dominates discussion of transport issues and, nominally at least, political discourse over the future of long-distance passenger rail in the United States. Despite the use of methodologies that give the illusion of objectivity, the analysis above demonstrates that there are a wide variety of underlying assumptions embedded in energy intensity numbers that give ample opportunity for subjective value judgments to hide conscious or unconscious biases toward or against a particular transportation mode. These judgments can be reflected in both presences and absences.
Indeed, as Lefebvre [
120] (p. 339) observed in his analysis of spatial practices, the powerful tendency toward quantification is “technical in appearance, financial in reality and moral in essence”. Certainly the conclusions of reports produced by industry and advocacy groups can be assumed to be colored by ideological orientation or pecuniary interest [
32,
35,
36,
37,
121,
122]. However, the complexity of the concept of energy intensity with massive transportation systems relates to an epistemological question of whether there can be assessments that are positively accurate, morally neutral and readily comprehensible, as well as to an ontological question of whether a unitary energy intensity for any transportation mode can actually be said to exist.
Ground transportation modes seem to converge on a fundamental minimal amount of energy needed to move a particular amount of mass a specified distance. Different modes add to their energy intensity by providing differing increments of speed, availability, flexibility, circuity, comfort and safety. The appropriateness and cost of a particular mode for a particular journey is therefore based on the subjective value of these distinctive qualities within the context of individual needs, and the societal norms codified in customs, regulations and spatial structures. That is something that does not lend itself to univariate reduction. Transportation specialists should incorporate this complexity into discussions of comparative modal energy intensity so that consumers and policymakers can make informed choices and rationally address the sustainability challenges of future energy transitions.

