Searching for the Various Effects of Subprograms in Official Development Assistance on Human Development across 15 Asian Countries: Panel Regression and Fuzzy Set Approaches


Abstract
:1. Introduction
2. Relevant Literature Review
2.1. ODA Determinants
2.2. ODA Effectiveness
3. Methodology and Data
3.1. Empirical Model: Panel Analysis and Fuzzy Set Ideal Type Analysis
3.2. Data and Variables
4. Empirical Results
4.1. Descriptive Statistics
4.2. Panel Regression Analysis
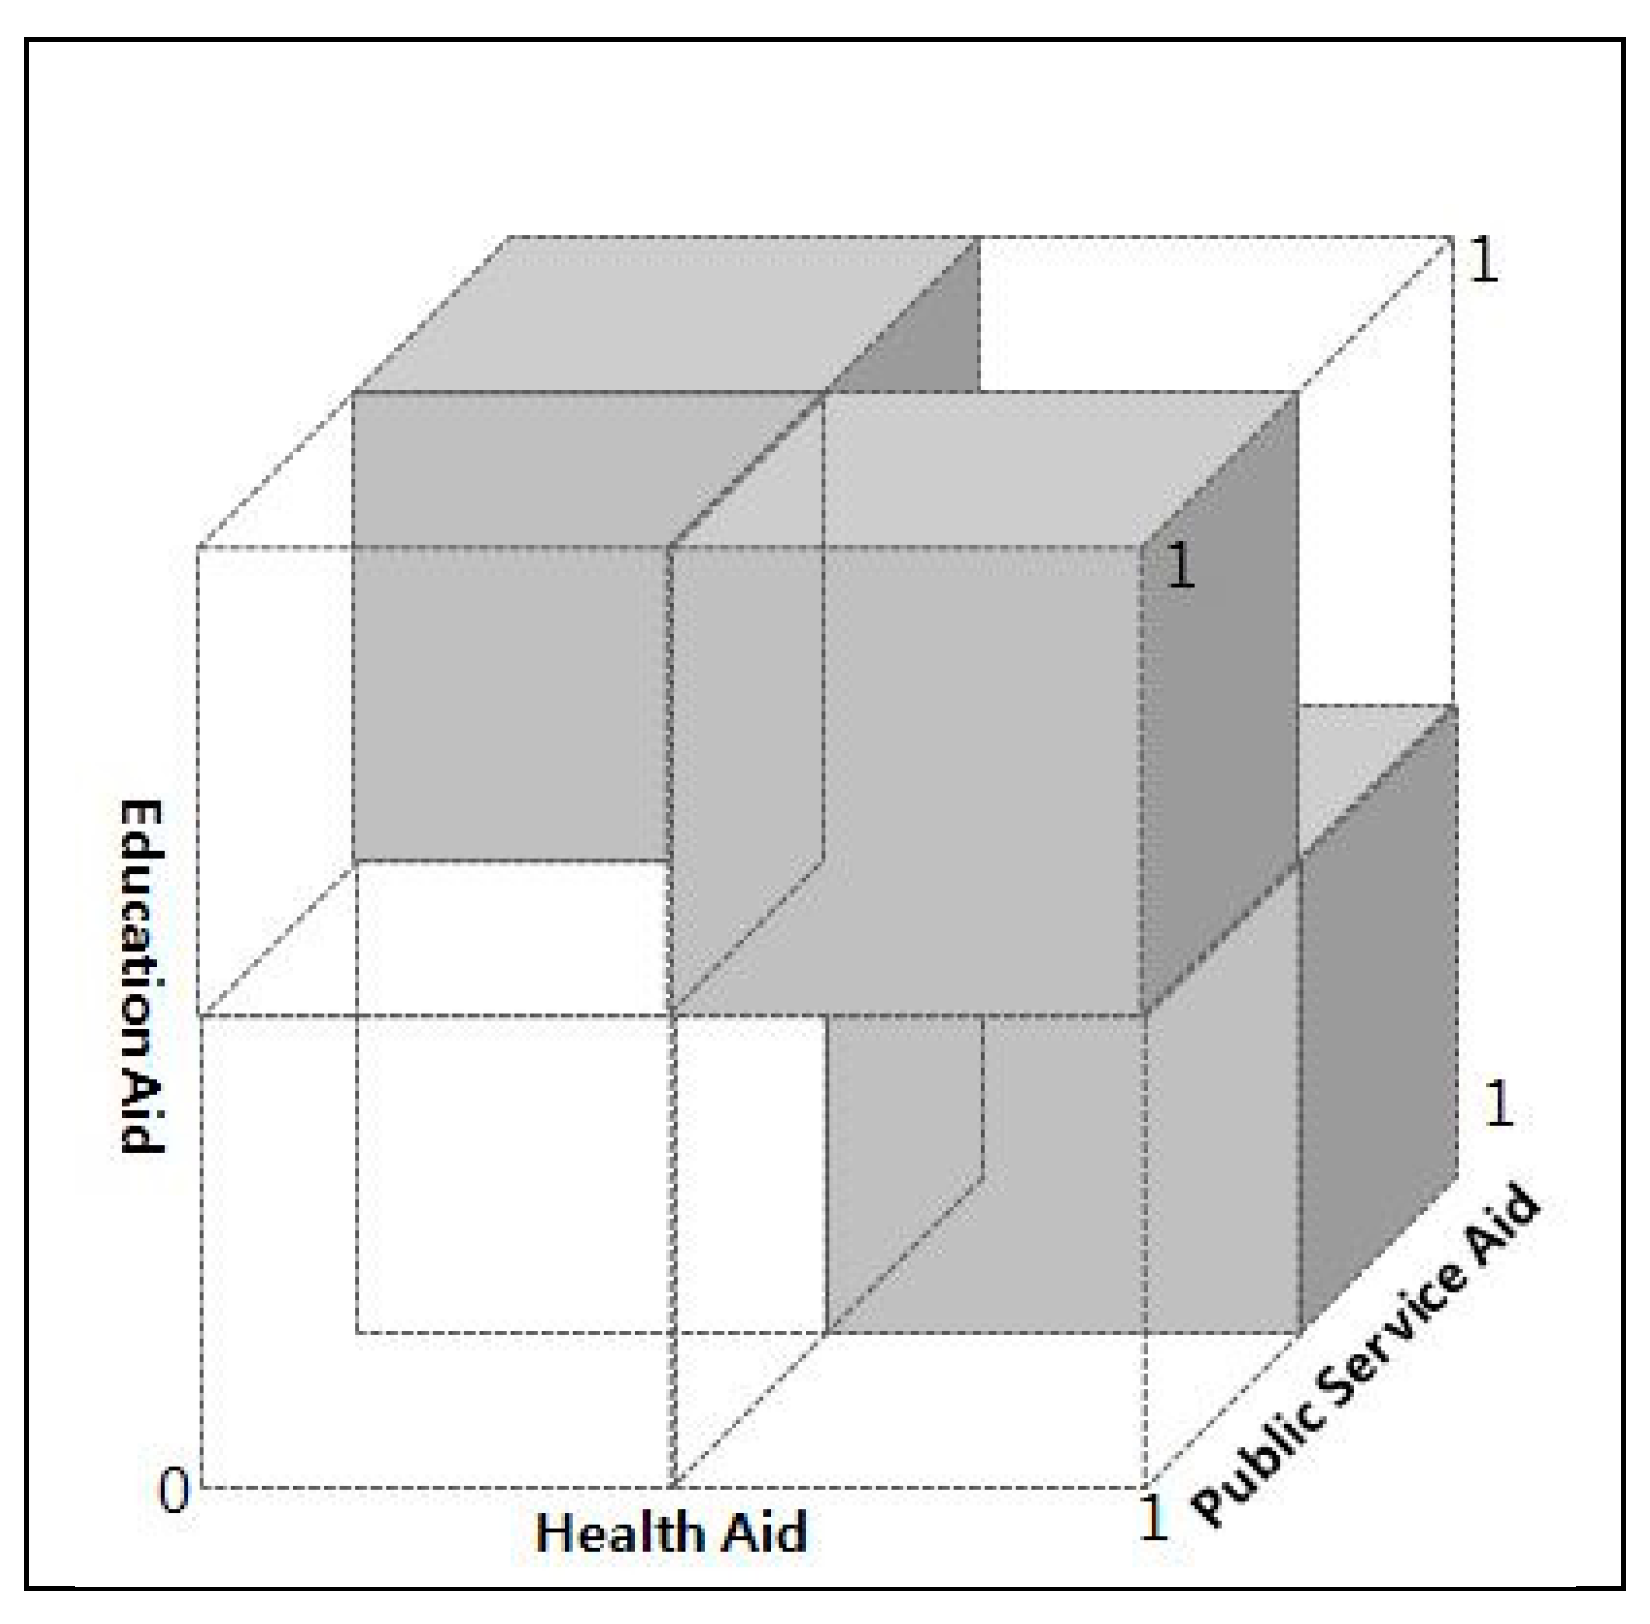
4.3. Fuzzy Set Ideal Type Analysis
(ODA_education * ~ODA_health * ODA_publicservice) +
(~ODA_education * ODA_health * ODA_publicservice)〉
5. Conclusions
5.1. Summary of Key Findings
5.2. Policy Implications of ODA Programs
Author Contributions
Funding
Conflicts of Interest
Appendix A

| Variables | Coefficient | SE | t-Value | p > |t| |
|---|---|---|---|---|
| I | −0.108 | 0.077 | −1.40 | 0.163 |
| POP | −2.183 | 3.580 | −0.61 | 0.543 |
| F | −0.072 | 0.188 | −0.38 | 0.701 |
| PS | 0.319 | 0.306 | 1.04 | 0.298 |
| G | −0.337 | 0.478 | −0.71 | 0.482 |
| C | 0.230 | 0.396 | 0.58 | 0.563 |
| Lee Myung-bak Administration | 0.193 | 0.049 | 3.91 | 0.000 |
| Park Geun-Hye Administration | 0.265 | 0.077 | 3.43 | 0.001 |
| Intercept | 1.464 | 1.731 | 0.85 | 0.399 |
| Variables | Coefficient | SE | z-Value | p > |z| |
|---|---|---|---|---|
| I | −0.088 | 0.072 | −1.22 | 0.223 |
| POP | 0.554 | 0.444 | 1.25 | 0.212 |
| F | −0.097 | 0.177 | −0.55 | 0.584 |
| PS | 0.382 | 0.269 | 1.42 | 0.156 |
| G | −0.346 | 0.386 | −0.90 | 0.370 |
| C | 0.304 | 0.367 | 0.83 | 0.408 |
| Lee Myung-bak Administration | 0.175 | 0.041 | 4.25 | 0.000 |
| Park Geun-Hye Administration | 0.221 | 0.055 | 4.02 | 0.000 |
| Intercept | 0.139 | 0.245 | 0.57 | 0.571 |
| Country | Roh | Lee | Park | Total | |
|---|---|---|---|---|---|
| Administration | Administration | Administration | |||
| Afghanistan 1 | Mean | 0.165 | 0.951 | 0.338 | 0.610 |
| SD | 0.055 | 0.030 | 0.348 | 0.401 | |
| Bangladesh 2 | Mean | 0.411 | 0.452 | 0.681 | 0.513 |
| SD | 0.042 | 0.231 | 0.174 | 0.210 | |
| Cambodia 3 | Mean | 0.257 | 0.091 | 0.029 | 0.105 |
| SD | 0.248 | 0.057 | 0.015 | 0.125 | |
| China 4 | Mean | 0.573 | 0.808 | 0.823 | 0.766 |
| SD | 0.105 | 0.078 | 0.069 | 0.124 | |
| Indonesia 5 | Mean | 0.592 | 0.776 | 0.939 | 0.788 |
| SD | 0.177 | 0.231 | 0.012 | 0.208 | |
| Lao PDR 6 | Mean | 0.424 | 0.462 | 0.743 | 0.539 |
| SD | 0.046 | 0.074 | 0.102 | 0.159 | |
| Mongolia 7 | Mean | 0.624 | 0.437 | 0.557 | 0.511 |
| SD | 0.161 | 0.160 | 0.141 | 0.159 | |
| Myanmar 8 | Mean | 0.204 | 0.322 | 0.904 | 0.473 |
| SD | 0.195 | 0.174 | 0.046 | 0.330 | |
| Nepal 9 | Mean | 0.486 | 0.863 | 0.870 | 0.790 |
| SD | 0.217 | 0.186 | 0.106 | 0.221 | |
| Pakistan 10 | Mean | 0.254 | 0.517 | 0.644 | 0.503 |
| SD | 0.021 | 0.222 | 0.062 | 0.208 | |
| Philippines 11 | Mean | 0.073 | 0.181 | 0.221 | 0.172 |
| SD | 0.031 | 0.098 | 0.066 | 0.092 | |
| Sri Lanka 12 | Mean | 0.400 | 0.830 | 0.920 | 0.771 |
| SD | 0.110 | 0.173 | 0.022 | 0.234 | |
| Thailand 13 | Mean | 0.043 | 0.082 | 0.200 | 0.109 |
| SD | 0.009 | 0.033 | 0.068 | 0.075 | |
| Timor-Leste 14 | Mean | 0.052 | 0.215 | 0.406 | 0.240 |
| SD | 0.032 | 0.164 | 0.222 | 0.201 | |
| Vietnam 15 | Mean | 0.596 | 0.930 | 0.975 | 0.877 |
| SD | 0.087 | 0.036 | 0.003 | 0.154 | |
| Total | Mean | 0.344 | 0.528 | 0.617 | 0.518 |
| SD | 0.224 | 0.331 | 0.321 | 0.322 |
| Configuration | Raw Coverage | Unique Coverage | Consistency |
|---|---|---|---|
| ODA_education * ODA_health * ~ODA_publicservice * ~politicalstability | 0.318565 | 0.0186003 | 0.818926 |
| ODA_education * ~ODA_health * ODA_publicservice * ~controlofcorruption | 0.333115 | 0.0217993 | 0.873311 |
| ODA_education * ODA_health * controlofcorruption * ~politicalstability | 0.268618 | 0.000516593 | 0.979762 |
| ODA_education * ODA_publicservice * ~controlofcorruption * politicalstability | 0.308036 | 0.0339696 | 0.923998 |
| ~ODA_education * ~ODA_health * ~ODA_publicservice * controlofcorruption * ~politicalstability | 0.31387 | 0.0662706 | 0.965027 |
| ~ODA_education * ~ODA_health * ~ODA_publicservice * ~controlofcorruption * politicalstability | 0.244026 | 0.0217538 | 0.922738 |
| ~ODA_education * ODA_health * ODA_publicservice * ~controlofcorruption * ~politicalstability | 0.267347 | 0.00730443 | 0.837683 |
| solution coverage: 0.596918 solution consistency: 0.821761 | |||
References
- Korea Official Development Assistance. Available online: http://www.odakorea.go.kr/eng.result.RegionCountry_Asia.do (accessed on 7 June 2018).
- United Nations Development Programme. Aid for the 21st Century. Human Development Report; Oxford University Press: New York, NY, USA, 2005. [Google Scholar]
- Organisation for Economic Co-operation and Development (OECD). DAC Statistical Reporting Directives; OECD/DAC(2010)/40REV1; OECD: Paris, France, 2010. [Google Scholar]
- Human Development Reports. Available online: http://hdr.undp.org/en/2018-update (accessed on 10 November 2018).
- Berthélemy, J.-C.; Tichit, A. Bilateral donors’ aid allocation decisions—A three-dimensional panel analysis. Int. Rev. Econ. Financ. 2004, 13, 253–274. [Google Scholar] [CrossRef]
- Maizels, A.; Nissanke, M.K. Motivations for aid to developing countries. World Dev. 1984, 12, 879–900. [Google Scholar] [CrossRef]
- McKinlay, R.D.; Little, R. A foreign policy model of US bilateral aid allocation. World Politics 1977, 30, 58–86. [Google Scholar] [CrossRef]
- Putnam, R.D. Diplomacy and domestic politics: The logic of two-level games. Int. Organ. 1988, 42, 427–460. [Google Scholar] [CrossRef]
- Hwang, Y.-G.; Park, S.; Kim, D. Efficiency Analysis of Official Development Assistance Provided by Korea. Sustainability 2018, 10, 2697. [Google Scholar] [CrossRef]
- Alesina, A.; Dollar, D. Who gives foreign aid to whom and why? J. Econ. Growth 2000, 5, 33–63. [Google Scholar] [CrossRef]
- Tuman, J.P.; Strand, J.R. The role of mercantilism, humanitarianism, and gaiatsu in Japan’s ODA programme in Asia. Int. Relat. Asia-Pac. 2006, 6, 61–80. [Google Scholar] [CrossRef]
- Katada, S.N. Two aid hegemons: Japanese-US interaction and aid allocation to Latin America and the Caribbean. World Dev. 1997, 25, 931–945. [Google Scholar] [CrossRef]
- Lancaster, C. Foreign Aid: Development, Domestic Politics; The University of Chicago Press: Chicago, IL, USA; London, UK, 2007. [Google Scholar]
- Axelrod, R.; Keohane, R. Achieving Cooperation under Anarchy: Strategies and Institutions. World Politics 1985, 38, 226–254. [Google Scholar] [CrossRef]
- Svirina, A.; Zabbarova, A.; Oganisjana, K. Implementing open innovation concept in social business. J. Open Innov. Technol. Mark. Complex. 2016, 2, 20. [Google Scholar] [CrossRef]
- Bandyopadhyay, S.; Wall, H. The Determinants of Aid in the Post-Cold War Era; Federal Reserve Bank of St. Louis: St. Louis, MO, USA, 2006. [Google Scholar]
- Abrams, B.A.; Lewis, K.A. Human rights and the distribution of US foreign aid. Public Choice 1993, 77, 815–821. [Google Scholar] [CrossRef]
- Dreher, A.; Nunnenkamp, P.; Thiele, R. Does aid for education educate children? Evidence from panel data. World Bank Econ. Rev. 2008, 22, 291–314. [Google Scholar] [CrossRef]
- Berthélemy, J.-C. Bilateral donors’ interest vs. recipients’ development motives in aid allocation: Do all donors behave the same? Rev. Dev. Econ. 2006, 10, 179–194. [Google Scholar] [CrossRef]
- Egbetokun, A.; Oluwadare, A.J.; Ajao, B.F.; Jegede, O.O. Innovation systems research: An agenda for developing countries. J. Open Innov. Technol. Mark. Complex. 2017, 3, 25. [Google Scholar] [CrossRef]
- Hagen, R.J. Concentration Difficulties? An Analysis of Swedish Aid Proliferation. Expertgruppen Biståndsanalys 2015, 3, 20–49. [Google Scholar]
- Healey, J.; Killick, T. Using Aid to Reduce Poverty. In Foreign Aid and Development: Lessons Learnt and Directions for the Future; Tarp, F., Hjertholm, P., Eds.; Routlege: New York, NY, USA, 2006. [Google Scholar]
- Savun, B.; Tirone, D.C. Foreign aid, democratization, and civil conflict: How does democracy aid affect civil conflict? Am. J. Political Sci. 2011, 55, 233–246. [Google Scholar] [CrossRef]
- Richard, G. Post-Lomé: The European Union and the South. Third World Q. 2000, 21, 457–481. [Google Scholar]
- Lebovic, J.H. Consider the source: Organizational bias in estimates of foreign military spending. Int. Stud. Q. 1998, 42, 161–174. [Google Scholar] [CrossRef]
- Poe, S.C. Human rights and economic aid allocation under Ronald Reagan and Jimmy Carter. Am. J. Political Sci. 1992, 36, 147–167. [Google Scholar] [CrossRef]
- Brown, S.; Swiss, L. The Hollow Ring of Donor Commitment: Country Concentration and the Decoupling of Aid-Effectiveness Norms from Donor Practice. Dev. Policy Rev. 2013, 31, 737–755. [Google Scholar] [CrossRef]
- Evans, P.; Rauch, J.E. Bureaucracy and growth: A cross-national analysis of the effects of “Weberian” state structures on economic growth. Am. Sociol. Rev. 1999, 64, 748–765. [Google Scholar] [CrossRef]
- Alesina, A.; Weder, B. Do corrupt governments receive less foreign aid? Am. Econ. Rev. 2002, 92, 1126–1137. [Google Scholar] [CrossRef]
- Knack, S. Does foreign aid promote democracy? Int. Stud. Q. 2004, 48, 251–266. [Google Scholar] [CrossRef]
- Rajkumar, A.S.; Swaroop, V. Public spending and outcomes: Does governance matter? J. Dev. Econ. 2008, 86, 96–111. [Google Scholar] [CrossRef]
- Dreher, A.; Eichenauer, V.Z.; Gehring, K. Geopolitics, aid, and growth: The impact of UN security council membership on the effectiveness of aid. World Bank Econ. Rev. 2018, 32, 268–286. [Google Scholar]
- Yanguas, P. The role and responsibility of foreign aid in recipient political settlements. J. Int. Dev. 2017, 29, 211–228. [Google Scholar] [CrossRef]
- Ranis, G.; Stewart, F.; Ramirez, A. Economic growth and human development. World Dev. 2000, 28, 197–219. [Google Scholar] [CrossRef]
- Shirazi, F.; Ngwenyama, O.; Morawczynski, O. ICT expansion and the digital divide in democratic freedoms: An analysis of the impact of ICT expansion, education and ICT filtering on democracy. Telemat. Inform. 2010, 27, 21–31. [Google Scholar] [CrossRef]
- Dalgaard, C.-J.; Hansen, H.; Tarp, F. On the empirics of foreign aid and growth. Econ. J. 2004, 114, 191–216. [Google Scholar] [CrossRef]
- Shon, C.; Lee, T.H.; Ndombi, G.O.; Nam, E.W. A Cost-Benefit Analysis of the Official Development Assistance Project on Maternal and Child Health in Kwango, DR Congo. Int. J. Environ. Res. Public Health 2018, 15, 1420. [Google Scholar] [CrossRef]
- Akinkugbe, O.; Yinusa, O. ODA and human development in Sub-Saharan Africa: Evidence from panel data. Presented at the 14th Annual Conference on Econometric Modelling for Africa, Abuja, Nigeria, 8–10 July 2009. [Google Scholar]
- Yun, J.J.; Cooke, P.; Kodama, F.; Phillips, F.; Gupta, A.K.; Gamboa, F.J.C.; Krishna, V.; Lee, K.; Lee, K.; Witt, U.; et al. An open letter to Mr. Secretary general of the united nations to propose setting up global standards for conquering growth limits of capitalism. J. Open Innov. Technol. Mark. Complex. 2016, 2, 22. [Google Scholar] [CrossRef]
- Yun, J.J. How do we conquer the growth limits of capitalism? Schumpeterian Dynamics of Open Innovation. J. Open Innov. Technol. Mark. Complex. 2017, 1, 17. [Google Scholar] [CrossRef]
- Yun, J.J.; Won, D.; Hwang, B.; Kang, J.; Kim, D. Analyzing and simulating the effects of open innovation policies: Application of the results to Cambodia. Sci. Public Policy 2015, 42, 743–760. [Google Scholar]
- Yun, J.J.; Won, D.; Park, K. Entrepreneurial cyclical dynamics of open innovation. J. Evol. Econ. 2018, 28, 1151–1174. [Google Scholar] [CrossRef]
- Gupta, A.; Dey, A.; Singh, G. Connecting corporations and communities: Towards a theory of social inclusive open innovation. J. Open Innov. Technol. Mark. Complex. 2017, 3, 17. [Google Scholar] [CrossRef]
- Kvist, J. Welfare reform in the Nordic countries in the 1990s: Using fuzzy-set theory to assess conformity to ideal types. J. Eur. Soc. Policy 1999, 9, 231–252. [Google Scholar] [CrossRef]
- Mahoney, J.; Kimball, E.; Koivu, K.L. The logic of historical explanation in the social sciences. Comp. Political Stud. 2009, 42, 114–146. [Google Scholar] [CrossRef]
- Ragin, C.C. Measurement versus Calibration: A Set-Theoretic Approach. In The Oxford Handbook of Political Methodology; Oxford University Press: Oxford, UK, 2008. [Google Scholar]
- Ragin, C.; Davey, S. fs/QCA [Computer Programme], version 2.5; University of California: Irvine, CA, USA, 2014. [Google Scholar]
- KOICA. Available online: https://www.koica.go.kr/sites/koica_en/index.do (accessed on 7 June 2018).
- Doornbos, M. ‘Good governance’: The rise and decline of a policy metaphor? J. Dev. Stud. 2001, 37, 93–108. [Google Scholar] [CrossRef]
- Lee, S.-W.; Jeon, J.-K. Dynamic Relationships between Mega Projects and Official Development Assistance: Case of South Korean Infrastructure Construction Projects in ASEAN’s Developing Countries. Sustainability 2018, 10, 4491. [Google Scholar] [CrossRef]
- Worldwide Governance Indicators. Available online: http://www.govindicators.org (accessed on 4 June 2018).
- Winters, M.S.; Martinez, G. The role of governance in determining foreign aid flow composition. World Dev. 2015, 66, 516–531. [Google Scholar] [CrossRef]
- Busse, M.; Gröning, S. Does foreign aid improve governance? Econ. Lett. 2009, 104, 76–78. [Google Scholar] [CrossRef]
- Schneider, C.Q.; Wagemann, C. Set-Theoretic Methods for the Social Sciences: A Guide to Qualitative Comparative Analysis; Cambridge University Press: Cambridge, UK, 2012. [Google Scholar]
- Furuoka, F. A History of Japan’s Foreign Aid Policy: From Physical Capital to Human Capital; MPRA Paper 5654; University Library of Munich: Munich, Germany, 2007. [Google Scholar]
- Smith, B.C. Good Governance and Development; Palgrave Macmillan: Basingstoke, UK, 2007. [Google Scholar]
- Gates, S.; Hoeffler, A. Global Aid Allocation: Are Nordic Donors Different? Centre for the Study of African Economies, University of Oxford: Oxford, UK, 2004. [Google Scholar]
- Hoeffler, A.; Outram, V. Need, Merit, or Self-Interest—What Determines the Allocation of Aid? Rev. Dev. Econ. 2011, 15, 237–250. [Google Scholar] [CrossRef]
- Johnson, D.; Zajonc, T. Can Foreign Aid Create an Incentive for Good Governance? Evidence from the Millennium Challenge Corporation; Center for International Development at Harvard University; Harvard University: Cambridge, MA, USA, 2006. [Google Scholar]
- Knack, S.; Rahman, A. Donor fragmentation and bureaucratic quality in aid recipients. J. Dev. Econ. 2007, 83, 176–197. [Google Scholar] [CrossRef]
- Knack, S.; Keefer, P. Institutions and economic performance: Cross-country tests using alternative institutional measures. Econ. Politics 1995, 7, 207–227. [Google Scholar] [CrossRef]
- Acharya, A.; de Lima, A.T.F.; Moore, M. Proliferation and fragmentation: Transactions costs and the value of aid. J. Dev. Stud. 2006, 42, 1–21. [Google Scholar] [CrossRef]

| Variables | Symbol | Description of Variables | |
|---|---|---|---|
| Dependent Variables | HDI | H | Human development index: average achievement in a long and healthy life, knowledge and decent standard of living (HDI of t_time) |
| HDI_life_expectancy | HL | Life expectancy at birth (HDI of t_time) | |
| HDI_education | HE | Years of schooling for adults aged 25 years and more and expected years of schooling for children of school entering age (HDI of t_time). | |
| HDI_GNI per capita | HG | Gross national income per capita (HDI of t_time) | |
| Independent Variables | Total ODA | TO | Total grant-aid of bilateral aid to recipient countries: t – 1 (USD, in millions) |
| ODA_education | OE | Education field grant-aid of bilateral aid to recipient countries: t – 1 (USD, in millions) | |
| ODA_health | OH | Health field grant-aid of bilateral aid to recipient countries: t – 1 (USD, in millions) | |
| ODA_water and sanitation | OW | Water and sanitation field grant-aid of bilateral aid to recipient countries: t – 1 (USD, in millions) | |
| ODA_public service | OP | Public service field grant-aid of bilateral aid to recipient countries: t – 1 (USD, in millions) | |
| Control Variables | Inflation | I | Annual consumer price index (CPI): t – 1 |
| Population (log) | POP | The number of people that live in the country: t – 1 | |
| FDI (log) | F | FDI (Foreign Direct Investment) financial flows: t – 1 (USD, in millions) | |
| Political stability and Absence of violence | PS | Perceptions of the likelihood of political instability and/or politically motivated violence, including terrorism: t – 1 (Worldwide Governance Indicators: WGI) | |
| Government Effectiveness | G | Perceptions of the quality of public services and the degree of its independence from political pressures: t – 1 (WGI) | |
| Control of Corruption | C | Perceptions of the extent to which public power is exercised for private gain as well as “capture” of the state by elites and private interests: t – 1 (WGI) | |
| Variables | N | Mean | Standard Deviation | Minimum | Maximum |
|---|---|---|---|---|---|
| H | 150 | 0.508534 | 0.3505276 | 0.010590 | 0.969988 |
| HL | 150 | 0.512992 | 0.3157069 | 0.008578 | 0.962822 |
| HE | 150 | 0.505424 | 0.3349232 | 0.024349 | 0.963258 |
| HG | 150 | 0.481802 | 0.3238082 | 0.029539 | 0.976328 |
| TO | 150 | 0.517705 | 0.3219417 | 0.010941 | 0.998624 |
| OE | 150 | 0.450524 | 0.3005218 | 0.028130 | 0.998793 |
| OH | 150 | 0.403426 | 0.3090197 | 0.046957 | 0.998573 |
| OW | 150 | 0.389493 | 0.333559 | 0.047426 | 0.998280 |
| POP | 150 | 0.483216 | 0.2669492 | 0.042851 | 0.954080 |
| F | 150 | 0.473743 | 0.2848984 | 1.55e-09 | 0.969215 |
| I | 150 | 0.447262 | 0.2738403 | 0.000493 | 0.998052 |
| PS | 150 | 0.225314 | 0.204469 | 0.048727 | 0.802184 |
| G | 150 | 0.214451 | 0.1295361 | 0.048727 | 0.557990 |
| C | 150 | 0.315111 | 0.2199036 | 0.054348 | 0.755253 |
| N = 150 | Fixed Effects Model | Fixed Effects Model (IV) | Random Effects Model | Random Effects Model (IV) | ||||
|---|---|---|---|---|---|---|---|---|
| Variables | b | SE | B | SE | B | SE | b | SE |
| TO | 0.082 *** | 0.017 | 0.300 *** | 0.077 | 0.101 *** | 0.021 | 0.409 *** | 0.095 |
| I | −0.004 | 0.016 | 0.017 | 0.025 | −0.025 | 0.019 | 0.024 | 0.033 |
| POP | 3.659 *** | 0.558 | 2.289 ** | 0.952 | 0.190 | 0.167 | −0.275 | 0.209 |
| F | 0.227 *** | 0.038 | 0.202 *** | 0.057 | 0.240 *** | 0.046 | 0.219 *** | 0.077 |
| PS | 0.187 *** | 0.060 | 0.072 | 0.098 | 0.269 *** | 0.068 | 0.024 | 0.127 |
| G | 0.028 | 0.098 | 0.146 | 0.152 | 0.122 | 0.109 | 0.582 *** | 0.182 |
| C | 0.243 *** | 0.074 | 0.175 | 0.114 | 0.442 *** | 0.085 | 0.273 * | 0.154 |
| Intercept | −1.511 *** | 0.266 | −0.956 ** | 0.440 | 0.068 | 0.091 | 0.068 | 0.105 |
| Within R2 = 0.712 Between R2 = 0.056 Overall R2 = 0.058 | Within R2 = 0.352 Between R2 = 0.074 Overall R2 = 0.079 | Within R2 = 0.614 Between R2 = 0.629 Overall R2 = 0.619 | Within R2 = 0.418 Between R2 = 0.734 Overall R2 = 0.657 | |||||
| Hausman test χ2(7) = 10.72, Prob. >χ2 = 0.1514 | POLS relevance test: χ2(1) = 278.66, Prob. >χ2 = 0.0001 | |||||||
| N = 150 | Fixed Effects Model | Fixed Effects Model (IV) | Random Effects Model | Random Effects Model (IV) | ||||
|---|---|---|---|---|---|---|---|---|
| Variables | B | SE | b | SE | B | SE | b | SE |
| TO | 0.046 * | 0.025 | 0.320 *** | 0.102 | 0.071 ** | 0.028 | 0.460 *** | 0.118 |
| I | 0.014 | 0.023 | 0.040 | 0.033 | −0.016 | 0.025 | 0.040 | 0.042 |
| POP | 4.945 *** | 0.797 | 3.220 ** | 1.274 | 0.663 *** | 0.211 | 0.250 | 0.315 |
| F | 0.233 *** | 0.054 | 0.202 *** | 0.076 | 0.235 *** | 0.061 | 0.193 ** | 0.096 |
| PS | 0.412 *** | 0.086 | 0.267 ** | 0.130 | 0.494 *** | 0.091 | 0.202 | 0.161 |
| G | −0.267 | 0.140 | −0.118 | 0.203 | −0.225 | 0.144 | 0.122 | 0.236 |
| C | 0.168 | 0.106 | 0.082 | 0.152 | 0.425 *** | 0.113 | 0.187 | 0.190 |
| Intercept | −2.062 *** | 0.380 | −1.363 ** | 0.588 | −0.080 | 0.114 | −0.079 | 0.161 |
| Within R2 = 0.593 Between R2 = 0.159 Overall R2 = 0.156 | Within R2 = 0.197 Between R2 = 0.171 Overall R2 = 0.171 | Within R2 = 0.494 Between R2 = 0.334 Overall R2 = 0.344 | Within R2 = 0.249 Between R2 = 0.365 Overall R2 = 0.335 | |||||
| Failure to meet the asymptotic assumptions of the Hausman test | POLS relevance test: χ2(1) = 324.40, Prob. >χ2 = 0.0001 | |||||||
| N = 150 | Fixed Effects Model | Fixed Effects Model (IV) | Random Effects Model | Random Effects Model (IV) | ||||
|---|---|---|---|---|---|---|---|---|
| Variables | B | SE | b | SE | B | SE | b | SE |
| TO | 0.079 *** | 0.024 | 0.309 *** | 0.093 | 0.104 *** | 0.028 | 0.469 *** | 0.117 |
| I | 0.026 | 0.022 | 0.048 | 0.030 | 0.001 | 0.025 | 0.056 | 0.041 |
| POP | 4.590 *** | 0.768 | 3.141 *** | 1.153 | 0.069 | 0.181 | −0.382 | 0.235 |
| F | 0.237 *** | 0.052 | 0.212 *** | 0.069 | 0.250 *** | 0.061 | 0.223 ** | 0.093 |
| PS | 0.268 *** | 0.082 | 0.146 | 0.118 | 0.358 *** | 0.090 | 0.069 | 0.154 |
| G | −0.060 | 0.134 | 0.065 | 0.184 | 0.132 | 0.140 | 0.616 *** | 0.216 |
| C | 0.115 | 0.102 | 0.043 | 0.138 | 0.380 *** | 0.113 | 0.157 | 0.188 |
| Intercept | −1.944 *** | 0.366 | −1.357 ** | 0.532 | 0.096 | 0.098 | 0.073 | 0.116 |
| Within R2 = 0.580 Between R2 = 0.018 Overall R2 = 0.019 | Within R2 = 0.269 Between R2 = 0.023 Overall R2 = 0.026 | Within R2 = 0.444 Between R2 = 0.644 Overall R2 = 0.621 | Within R2 = 0.280 Between R2 = 0.693 Overall R2 = 0.596 | |||||
| Failure to meet the asymptotic assumptions of the Hausman test | POLS relevance test: χ2(1) = 243.05, Prob. >χ2 = 0.0001 | |||||||
| N = 150 | Fixed Effects Model | Fixed Effects Model (IV) | Random Effects Model | Random Effects Model (IV) | ||||
|---|---|---|---|---|---|---|---|---|
| Variables | B | SE | b | SE | B | SE | b | SE |
| TO | 0.119 *** | 0.024 | 0.344 *** | 0.093 | 0.129 *** | 0.024 | 0.399 *** | 0.093 |
| I | −0.055 ** | 0.022 | −0.034 | 0.030 | −0.072 *** | 0.022 | −0.034 | 0.033 |
| POP | 2.362 *** | 0.785 | 0.946 | 1.156 | 0.017 | 0.222 | −0.327 | 0.260 |
| F | 0.184 *** | 0.053 | 0.159 ** | 0.069 | 0.196 **** | 0.054 | 0.171 ** | 0.075 |
| PS | 0.057 | 0.084 | −0.062 | 0.118 | 0.111 | 0.081 | −0.094 | 0.127 |
| G | 0.290 ** | 0.137 | 0.412 ** | 0.184 | 0.294 ** | 0.130 | 0.554 *** | 0.187 |
| C | 0.444 *** | 0.104 | 0.373 *** | 0.138 | 0.570 *** | 0.100 | 0.408 *** | 0.149 |
| Intercept | −0.983 ** | 0.374 | −0.410 | 0.534 | 0.106 | 0.121 | 0.127 | 0.134 |
| Within R2 = 0.615 Between R2 = 0.082 Overall R2 = 0.086 | Within R2 = 0.356 Between R2 = 0.154 Overall R2 = 0.167 | Within R2 = 0.588 Between R2 = 0.589 Overall R2 = 0.584 | Within R2 = 0.455 Between R2 = 0.518 Overall R2 = 0.487 | |||||
| Hausman test χ2(7) = 16.02, Prob. >χ2 = 0.0250 | POLS relevance test: χ2(1) = 447.22, Prob. >χ2 = 0.0001 | |||||||
| Human Development Index (Dependent Variables) | ||||
|---|---|---|---|---|
| H | HL | HE | HG | |
| Variable | Model 1 | Model 1 | Model 1 | Model 1 |
| OE | −0.029 * | 0.053 ** | 0.011 | −0.109 *** |
| OH | 0.061 *** | 0.032 | 0.037 | 0.085 *** |
| OW | 0.007 | 0.035 | 0.0004 | −0.002 |
| OP | 0.079 *** | 0.093 *** | 0.073 *** | 0.108 *** |
| I | 0.004 | 0.024 | 0.034 | −0.042 * |
| POP | 2.056 ** | 1.323 | 2.806 ** | 1.537 |
| F | 0.196 *** | 0.134 ** | 0.198 *** | 0.192 *** |
| PS | 0.227 *** | 0.416 *** | 0.306 *** | 0.128 |
| G | −0.016 | −0.262 * | −0.107 | 0.221 * |
| C | 0.271 *** | 0.220 ** | 0.166 | 0.469 *** |
| Intercept | −0.7307 * | −0.349 | −1.081 ** | −0.562 |
| ODA_Education | ODA_Health | ODA_public Service | Condition | Ideal Types |
|---|---|---|---|---|
| OE | OH | OP | OE*OH*OP | education * health * public service aid |
| OE | OH | ~OP | OE*OH*~OP | education * health aid |
| OE | ~OH | OP | OE*~OH*OP | education * public service aid |
| OE | ~OH | ~OP | OE*~OH*~OP | education aid |
| ~OE | OH | OP | ~OE*OH*OP | health * public service aid |
| ~OE | OH | ~OP | ~OE*OH*~OP | health aid |
| ~OE | ~OH | OP | ~OE*~OH*OP | public service aid |
| ~OE | ~OH | ~OP | ~OE*~OH*~OP | no aid |
| Configuration | Raw Coverage | Unique Coverage | Consistency |
|---|---|---|---|
| ODA_education * ODA_health * ~ODA_publicservice | 0.321835 | 0.058399 | 0.818084 |
| ODA_education * ~ODA_health * ODA_publicservice | 0.334142 | 0.0781004 | 0.873652 |
| ~ODA_education * ODA_health * ODA_publicservice | 0.27054 | 0.0204439 | 0.833568 |
| solution coverage: 0.437713 solution consistency: 0.798332 | |||
© 2019 by the authors. Licensee MDPI, Basel, Switzerland. This article is an open access article distributed under the terms and conditions of the Creative Commons Attribution (CC BY) license (http://creativecommons.org/licenses/by/4.0/).
Share and Cite
Lee, E.; Jung, K.; Sul, J. Searching for the Various Effects of Subprograms in Official Development Assistance on Human Development across 15 Asian Countries: Panel Regression and Fuzzy Set Approaches. Sustainability 2019, 11, 1152. https://doi.org/10.3390/su11041152
Lee E, Jung K, Sul J. Searching for the Various Effects of Subprograms in Official Development Assistance on Human Development across 15 Asian Countries: Panel Regression and Fuzzy Set Approaches. Sustainability. 2019; 11(4):1152. https://doi.org/10.3390/su11041152
Chicago/Turabian StyleLee, Eunmi, Kwangho Jung, and Jinbae Sul. 2019. "Searching for the Various Effects of Subprograms in Official Development Assistance on Human Development across 15 Asian Countries: Panel Regression and Fuzzy Set Approaches" Sustainability 11, no. 4: 1152. https://doi.org/10.3390/su11041152
APA StyleLee, E., Jung, K., & Sul, J. (2019). Searching for the Various Effects of Subprograms in Official Development Assistance on Human Development across 15 Asian Countries: Panel Regression and Fuzzy Set Approaches. Sustainability, 11(4), 1152. https://doi.org/10.3390/su11041152