Abstract
If we examine the characteristics of a sample of green bonds matched with their closest brown bond neighbors, we encounter a challenge. Green bonds have higher yields, lower variance, and are more liquid. The institutional/private issuer and the green third-party verification/non-verification breakdowns help explain this puzzle. Green bonds from institutional issuers have higher liquidity with respect to their brown bond correspondents and negative premia before correcting for their lower volatility. Green bonds from private issuers have much less favorable characteristics in terms of liquidity and volatility but have positive premia with respect to their brown correspondents, unless the private issuer commits to certify the “greenness” of the bond. An implication of our findings is that the issuer’s reputation or green third-party verifications are essential to reduce informational asymmetries, avoid suspicion of green (bond)-washing, and produce relatively more convenient financing conditions.
JEL:
Q01 Sustainable Development Asset; G10 General Financial Markets; G12 Asset Pricing • Trading Volume • Bond Interest Rates
1. Introduction
Sustainable development is one of the most important goals that humankind must attain in the coming years. The achievement of sustainable development includes the reduction of the carbon footprint, which is crucial for keeping the growth of the world temperature within reasonable limits, such as limits that prevent climate disasters such as small island and coastal area disappearance due to the rise of ocean levels. In order to reach the target, changes in production and CONSUMPTION patterns through what is called “green investment”—investment that modifies the current production standards fostering the adoption of technologies that support the circular economy and reduce the carbon footprint of production and consumption—is of utmost importance. These are the reasons why understanding the mechanisms of green investment financing is of particular interest for scholars and for policymakers.
Our paper contributes to this field by identifying the specificities of green bond characteristics with respect to their closest “brown” counterparts in terms of yields, liquidity, and volatility, and by considering the role of only partially explored factors such as the institutional and private characteristics of the issuer and the presence or absence of green third-party verifications.
Our contribution is original in a new field of literature that has mainly concentrated on the identification of the green bond premium and on co-movements of green bond prices with other relevant financial assets with mixed findings. Zerbib [1] showed that there is a mostly negative green bond premium, which is especially high in some market segments, claiming that the rating and the amount issued are the main drivers of the premium. Wulandari et al. [2] analyzed how liquidity risk affects the yield spread between a couple of matched green and brown bonds, arguing that liquidity risk is negligible for green bonds. Reboredo [3] found that green bond returns are strictly correlated with corporate and treasury bond returns, whereas they weakly co-move with stocks and energy commodities. Karpf and Mandel [4], analysing a sample of bonds issued by the US municipal bond market, showed that the green bond premium has been positive in the last years. Hachenberg and Schiereck [5] reported that green bonds rated AA-BBB trade tighter with respect to their similar non-labelled bond as well as financial and corporate green bonds, whereas government green bonds trade marginally wider. Glavas and Bancel [6] studied the determinants of green bond issuance and showed that agency motive and state-driven stakeholder motive are their key determinants.
The originality of our paper within this body of literature is in examining three bond characteristics (i.e., yields, volatility, and liquidity) and focusing on the role of the private and institutional issuer and the green (third-party) verification/non-verification breakdowns as key factors to explain the mixed findings reported in the literature. We provide an interpretation of the observed aggregate puzzle of green bonds, i.e., their higher yields in the presence of higher liquidity and lower volatility with respect to their brown bond counterparts. More specifically, we document a considerable difference between private and institutional green bond issuers. In the case of private issuers, we found significant positive premia for private green versus brown bond issuers in the presence of relatively lower liquidity and slightly lower volatility. On the contrary, institutional issuers have negative premia, before correcting for their lower volatility, and much higher liquidity and lower volatility. We also found that private issuers of green bonds without third-party verification have significantly higher premia and lower liquidity than their private verified counterparts. A likely interpretation of our findings is that institutional issuers (e.g., World Bank) have attracted large institutional investors allocating significant resources to fixed income and having a strategic interest in investing in climate-change-related projects. In addition, institutional issuers have transparency and information rules that increase their effectiveness in reducing informational asymmetries and overcoming investors’ doubts on the effective greenness of their products. Our findings show that a similar reputational result can be obtained by private issuers through external green verification. Hence, the higher on average premia of green bonds mainly reflect exposure to greenwashing risk of green bonds of private issuers non-verified by third parties.
Note that the term “greenwashing” includes companies that declare a commitment to environmental responsibility that is greater than in reality. The benefit of greenwashing (temptation function) is the advantage gained in terms of reputation and the willingness to pay of environmentally-sensitive consumers. The cost of greenwashing (punishment function) is the “sanction” arising when the public becomes aware of the gap between declarations and facts. As an example of these costs, consider the case of Volkswagen whose stock recorded a 20% loss on 21 September 2015 after the Environmental Protection Agency’s notice of violation became public. The price remained 30% lower at a one-year distance.
2. The Development of the Green Bond Market
A green bond is defined as a “plain-vanilla” fixed income product that offers investors the opportunity to participate in financing green projects, helping to mitigate climate change and supporting countries in their climate change adaptation plans. A key feature of green bonds is the due diligence process that the issuer is expected to conduct to identify and monitor the projects [7]. As clarified by the United Nation Development Program (UNDP) green bonds have no other differences from conventional bonds; their only unique characteristic is the specification that the proceeds from bond sales have to be invested in projects generating environmental benefits.
A substantial boost to the green bond market was provided by the Copenhagen Accord in 2009, establishing that financial markets have to play a central role in the fight against climate change through the mobilization of private investments for mitigation and adaptation projects. Several major economies agreed that the best strategy to boost investment needed to prevent air pollution, and the consequent enhancement of the global temperature, was to create and promote financial products that appeal to investors with a substantial asset base. Green bonds were therefore considered the main example of an innovative fixed-income investment product that could activate a significant amount of capital to finance the fight against climate change. Green bonds are extremely effective in this regard due to their standard financial characteristics bundled with the dedication to environmental issues. This feature makes them desirable for a wide range of investors, from retail and high-net-worth to institutional investors who have a separate asset class for climate-oriented investments, or to socially conscious investors who have specific environmental strategies. From the issuer’s point of view, green bonds have been proven to produce several benefits: diversification of the investor base, providing the potential to enjoy long-term pricing advantages; pro-active messages to stakeholders on environmental sustainability; and appealing to millennials as employees and customers. In this respect, developments in the financial markets have clearly confirmed that an issuer can broaden its investor base by providing green products and that investors are focusing on climate-related investment opportunities as part of their fixed income allocation [7] (the World Bank green bonds, for example, appealed to large institutional investors who had both significant allocations to fixed income and a strategic interest in investing in climate-change related projects, and reached investors who would not otherwise have purchased World Bank bonds [8]). From this perspective, corporations are increasingly starting to realize that managing environmental exposure may be more than just risk management and it may actually improve their economic performance. With the potential for progressively tighter ecological requirements for national and multi-national companies, environmental sustainability and profit maximization may actually work cooperatively.
2.1. The Growth in Green Bond Emissions
The first green bond was issued in June 2007 by the European Investment Bank. The Paris Climate Agreement of 2015 later pushed for renewable energy investments and other initiatives to reduce global warming, when 195 countries adopted the first-ever legally binding global climate deal. The deal includes an action plan to avoid dangerous climate change and limit global warming below the threshold of 2 °C. After being flat for three consecutive years, CO2 emissions grew by 1.4% in 2017, reaching a historic high of 32.5 gigatons due to higher energy demand and the slowing of energy efficiency improvements. [9] The increase in CO2 emissions, however, was not across all countries. While most major economies saw a rise, some others experienced declines, including the United States, the United Kingdom, Mexico, and Japan. The biggest drop occurred in the United States mainly because of the higher deployment of renewables. This means the current climate action effort is too weak to meet the target of staying 2 °C below the global energy-related CO2 emissions limit. According to the Climate Bond Initiative estimates, although 2017 was an encouraging year, the green bond market should reach 1 trillion USD by 2020 in order to produce a concrete impact on climate targets [10].
The progressive development of the green bond market is trying to support this difficult and ambitious task by providing financial resources for the required investments. After the issuance of the first AAA-rated green bond in 2007 by European Investment Bank (EIB), the wider green bond market expanded in March 2013 after the first USD $1 billion green bond was sold within an hour by the IFC. The yearly issuance of labelled green bonds in 2014 reached USD $37 billion, which is over three times the 2013 issuance, and it grew further the following year to USD $40 billion issued by 2015. In the meantime, the broader unlabeled “climate-aligned” bond market was valued at USD $600 billion in June 2015 [11]. In 2017, green bond issuance was almost USD $157 billion, reaching a new record [10]. The volume of issuances is practically doubling year after year, whereas the portion of corporate green bonds (both financial and non-financial) is constantly growing, with 146 new private issuers entering the green bond market in 2017. Large corporate issuers today include SNCF, Berlin Hyp, Apple, Engie, ICBC, and Credit Agricole.
2.2. Standards and Regulation
To keep pace with the progressively growing green finance market, domestic and transnational institutions are promoting guidelines, regulations, and incentives. A number of initiatives are underway to harmonize differences between regional standards and definitions. The European Commission, for instance, introduced a High-Level Expert Group on Sustainable Finance (HLEG) in late 2016 that has been working toward defining clear recommendations to support the development of green finance and establish common European green bond standards. The recommendations of the HLEG and the new “European taxonomy for sustainable finance” formed the basis for the action plan on sustainable finance adopted by the Commission in March 2018. Other national financial institutions, standard setters, and regulatory bodies are cooperating around the world to re-assess and unify green bonds principles and criteria. The EIB and China’s Green Finance Committee have recently published a white paper identifying differences between the European and Chinese green bond standards to work on convergence in the future. The ASEAN Capital Markets Forum launched the ASEAN Green Bond Standards in November 2017, which will improve transparency and unification of the market and ensuring investors have access to sufficient information. To date, the most important and widely accepted initiative at the international level is the “Green Bond Principles” (GBP) [12]. The GBP are voluntary guidelines that encourage transparency and disclosure and promote integrity in the development of the Green Bond market by clarifying the procedure for issuance of a green bond. In particular, the GBP recommends that issuers use an external review to certify green definitions and criteria and the processes and systems applied.
The European Commission Technical Expert Group (TEG) report on Sustainable Finance [13] suggests a refinement of indicators for green bond issuers, arguing that companies should consider disclosing their green bond ratio (the proportion of the total green bond outstanding amount over the total bond outstanding amount) or their green debt ratio (total amount of green bond or green debt instruments over the total debt amount) in order to transparently communicate the intensity of their overall low carbon transition plan beyond the individual green bond issue.
If governments and financial institutions are working to harmonize standards, they are providing incentives to promote the issuance of green financial instruments. Several national and international initiatives have been launched to diversify portfolios away from carbon-based investments and redirect assets toward more environmentally-friendly projects. For example, in December 2017, the European Commission announced willingness to lower capital requirements for lending against energy efficient buildings and electric cars.
The crux of the matter remains how to determine whether the bond may be classified as green or as conventional. Demand for accessible information on the use of proceeds has grown in parallel with the expansion of the green bond market, as investors require knowing exactly where their money is going. Thus, in addition to evaluating the standard characteristics of the security (such as maturity, coupon, price, and credit quality of the issuer), financial market players want to be able to assess the specific environmental impact of the projects that green bonds intend to support. An objective evaluation of the environmental benefits has been a key question since the market started to grow. The reputational risk for green bonds issuers, i.e., when bonds labelled as green are found not to be green, is high and can have an impact on investor trust. For these reasons, rating agencies recently started to include evaluation on the greenness of financial products in order to help investors when choosing their portfolio allocations. In addition, a broad network exists of non-financial rating agencies, of “second” and “third opinion”, and auditing agencies. However, labelling and the use of external reviews are not yet mandatory, and according to the CBI Report [10], only 60% of green bonds are externally reviewed.
To summarize, green bond authenticity is based on invisible characteristics subject to asymmetric information. In this paper, we analyzed the consequences of greenness on bond performance and how asymmetric information about genuine green characteristics affects issuers with different reputation and issues with and without green verification.
3. Research Hypothesis
Based on the above considerations, our research questions include:
- The green adjective defining the bond issue may create, per se, a difference in terms of bond pricing, liquidity, and volatility on secondary markets;
- The effects of the issuer’s characteristics on asymmetric information and greenwashing risk perceived by investors, and, therefore, on the green bond premium.
For point (1), several theoretical reasons support why this may be the case. First, in the presence of the same characteristics and financial conditions, environmentally concerned investors may be willing to receive a lower yield for environmental responsibility, and as a consequence, the yield difference between the green bond and its brown correspondent should be negative. Roe et al. [14] found that investors are willing to receive a lower yield when emission reductions stem from the increased reliance upon renewable fuels, suggesting that several product features could help explain real price premiums. Kaenzig et al. [15] showed that consumers are willing to receive a lower yield of about 16% for an upgrade from the current average German default electricity mix to a more environmentally-friendly default electricity mix. Rommel et al. [16] found that, compared to investor-owned firms, willingness to receive a lower yield for renewable energy doubles when offered by cooperatives or municipally-owned electricity utilities, claiming that public policy may reduce information asymmetries and foster labeling of green energy products.
With respect to point (1) (related to volatility), green bonds should be (coeteris paribus) relatively less exposed to the specific source of stakeholder risk related to environmental lack of responsibility. As a consequence, they may attract relatively higher demand from risk averse investors. Amiraslani et al. [17] showed that firms with high corporate social responsibility (CSR) better resist financial crisis probably because they are trusted more by financial investors. Bauer et al. [18] observed that environmental concerns are positively correlated with a higher cost of debt and lower credit ratings. Graham et al. [19] reported that environmental information has a significant impact on bond rating. Oikonomou et al. [20] analyzed the impact of CSR on bond pricing and claimed that corporate social transgressions are penalized through higher corporate bond yield spreads. Becchetti et al. [21] documented that CSR risk is an additional orthogonal risk factor to which stocks are exposed in Fama–French multi-factor capital asset pricing models. Becchetti et al. [22] found that stocks with higher environmental reputational risk have, coeteris paribus, lower price-earnings ratios. Sharfman and Fernando [23] showed that lower environmental risk is associated with a lower cost of capital.
Based on the above considerations, we tested the following null hypotheses:
Hypothesis 0 (H0).
No green bond premium.
Under our null hypothesis, there should be no difference between green and brown bonds once we consider yield differentials between green and brown “twins” that have the same characteristics. Rejection of the null may be related to one of the above described rationales proposed in the literature for the difference between green and brown investments. A negative premium is expected if, coeteris paribus, investors are willing to pay for the environmental features of green bonds or they address relatively higher demand to a class of bonds that is relatively less exposed to a source of risk orthogonal to those traditionally considered (i.e., idiosyncratic non-diversifiable risk, bankruptcy risk, small size risk, etc.), such as stakeholder risk.
We also consider that the premium may be affected by informational asymmetry in point (2). If bonds are not green certificated, the risk of greenwashing is higher, and investors may require a premium. The private or institutional characteristics of the issuer may also affect the premium in a framework of asymmetric information since an institutional issuer has a higher reputation and is more likely to be believed as effectively using financial resources for green investment.
Hypothesis 1 (H1).
No difference in liquidity in the secondary market.
Under the null hypothesis, there should be no difference in liquidity between green and brown bonds.
Rejection of the null may be interpreted on several grounds. By assuming that the market microstructure for green and brown bonds is the same (i.e., same market makers with the same characteristics), bonds that are traded with a higher frequency tend to have more potential buyers and greater liquidity than bonds traded at a lower frequency. For this reason, if green bonds are able to attract a higher (lower) number of investors and transactions they may end up being more (less) liquid with respect to their brown twins.
Hypothesis 2 (H2).
No difference in yield (price) volatility in the secondary market.
The null hypothesis here states that there is no difference in risk exposure between green and brown bonds that have the same characteristics. Rationales for the rejection of the null may be found in the literature, arguing that green bonds are exposed to an additional source of (greenwashing) risk. Conversely, we have already provided ample theoretical and empirical evidence on the relatively lower exposure of green bonds to stakeholder risk. The two opposite effects may or may not offset each other.
3.1. Matching Method and Dataset
As is usually the case, the best methodological approach for testing this research question is unusable since the counterfactual information (what would have happened if the same bond would not be “green”?) is not available. The second best to a full-fledged randomized experiment is also impossible since it requires that both treatment and control, respectively green and brown bonds, are issued after the experiment starts and with ad-hoc procedures that satisfy randomness. Hence, randomized experiments cannot be used to evaluate the impact of already existing or existed bonds. We were therefore obliged to use the third best approach that uses econometric specifications to compare bonds that are as similar as possible to each other, except for the greenness.
Based on these considerations, to analyze the yield spreads between green bonds and their closest “brown” (non-green) neighbors, we adopted an exact matching method. Matching methods have been widely used in the financial literature to compare responsible versus conventional funds [24,25,26] and to measure bond credit risk and the effect of volatility on returns. Other studies [27,28,29] used pairs of matched bonds to control for credit risk. Helwege et al. [30] and Dick-Nielsen et al. [31] used this approach to evaluate liquidity premia.
More specifically, bonds defined as “green” in our sample were those defined as such by the issuer itself and listed in the Climate Bonds Initiative website. Within the green bond group, we defined a subgroup of the green bonds as “certified” if they meet one of the following two criteria: (1) they meet the CBI-defined requirements; (2) they have been externally certificated by a third party (Figure 1). The role of an external review mainly involves avoiding adverse selection and green washing through third-party verification of green value creation, showing the issuer’s capability to implement the program, and the likely realization of the output promised. Green bond assessment is based on the verification of the corporate use of proceeds (renewable energy, clean water, etc.), the management of proceeds (tracking of proceeds and audit), and ongoing reporting (monitoring and environmental impact).
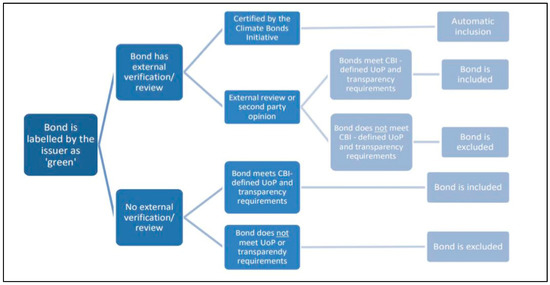
Figure 1.
Green bond database inclusion assessment explained. Source: Green Bond Market Summary [32] Q1 2018.
For each green bond in the dataset, we searched for a brown bond that was the nearest neighbor in terms of selected crucial characteristics (Table 1). In particular, we required that the two bonds: (1) were issued by the same organization (including supranational, municipal, and corporate institutions), (2) had the same currency, (3) had the same rating (Moody’s rating or, when not available, S&P rating), (4) had the same bond structure, and (5) had the same coupon type (we only considered fixed rate bonds).

Table 1.
Matching method between green and brown bond.
For the maturity date, the coupon rate, and the amount issued, given the impossibility of finding two bonds with exactly the same characteristics, we based the matching method on specific thresholds in order to find a brown bond that was as similar as possible to its closest green bond correspondent. For the maturity date, we allowed for a maximum two-year lead/lag. For the amount issued, we considered amounts up to four times larger or smaller. Finally, for the coupon rate, we accepted values at most 0.25 higher or lower than the green bond rate (when defining matching criteria, we faced a trade-off between the number of matched bonds and accuracy of the matching. For the coupon rate, we chose a threshold that was slightly larger with respect to Helwage et al. [30] that, in order to study the effect on liquidity on the yield spread, fixed 1.5% as the maximum difference in coupon rate. For other criteria, we followed Zerbib [1]). In order to control for a possible bias arising from the mismatch, we controlled for these variables in our econometric analysis. All criteria used for the matching are summarized in Table 1.
In addition to the above described one-to-one matching, when deemed necessary, we created a synthetic bond through a linear combination of two otherwise unmatched bonds in order to meet our matching conditions. We did so when we found two brown bonds with a slightly higher coupon rate (max. 0.5% over the threshold) or slightly lower (max. 0.04% under the threshold) with respect to the matching condition. In these cases, a linear combination allowed us to create a synthetic matched bond. In our dataset, three green bonds were matched with a synthetic bond using this approach.
Based on these principles we identified 89 bond couples (corresponding to 179 different bonds, more than twice the 89 couples due to the synthetic bond cases) (details of each bond are provided in the Appendix A). For these bonds, we included in the dataset daily observations of ask price, bid price, and redemption yield in the period spanning from 1 January 2013 to 31 December 2017. By doing so, we could compare green and brown bonds with similar characteristics that were traded in the same day. These bonds had the same credit risk, bond characteristics, and were exposed to the same market shocks. Thus, their yields do not differ because of credit risk, taxes, or market risk. Ask and bid official prices, returns and issuer, and bond characteristics were downloaded from Datastream (see Table 2 for variable legend). Yields were computed as net present value (NPV) considering the amount of money paid for the bond and relating this to the future dividend and capital payments. The issued amount was converted to dollars considering the exchange rate on the issuing date. Liquidity was computed using the bid-ask spread (price bid–price ask); hence, by construction, a higher value is associated with higher liquidity. Zero trading day (ZTD) was a dummy variable that took a value of 1 if there had not been any trade during the whole day. Finally, delta liquidity, delta yield, and delta ZTD were computed using the difference in daily returns, daily liquidity, and the daily ZTD dummy variable, respectively.
Table 2.
Variables legend.
The summary statistics for the abovementioned variables are reported in Table 3. The average green bond yield was positive and around 200 bps. Non-trading days were around 5.5% of the overall sample trading days for both the green and brown bonds. The bid-ask spread of green and brown was close from a descriptive point of view (27 against 22 bps, respectively). The green bond yield was slightly higher (2.03 against 2.01) and brown bonds appear to have been more volatile. Time to maturity of brown bonds was on average one month higher. The distribution of coupon and amount was almost the same in the two groups. These descriptive statistics across green and brown groups were independent from the matching between green and brown bonds with the closest characteristics.
Around 34% of the green bonds had an institutional issuer (national government, municipality, or supranational institution, such as the World Bank), whereas 22% were bank issuers. The majority were American (22.15%), around 17% from Germany, 11% from Sweden, and 10% from Luxembourg. The currencies were mainly USD (about 44%) and Euros (23%). Concerning the rating, the vast majority of bonds in our sample were top rated (AAA) (around 62%). A synthesis of these sample statistics is provided in Figure 2.
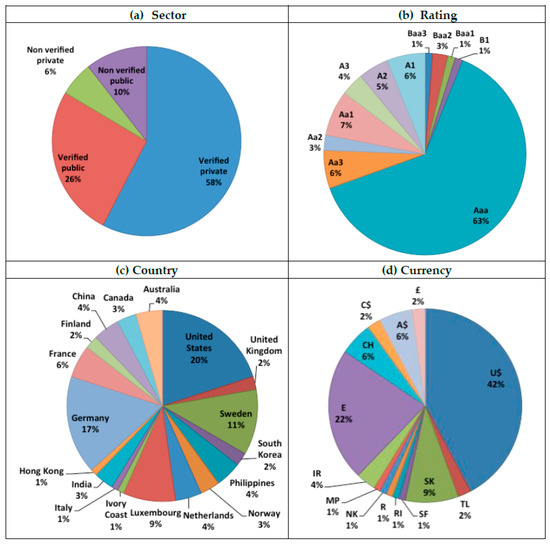
Figure 2.
Sample statistics for green bonds only. Breakdown for sector (a), rating (b), country (c), currency (d). Currency legend: -£: Pound; A$: Australian Dollar; C$: Canadian Dollar; CH: Swiss Franc; E: Euro; IR: Indian Rupee; MP: Mexican Pesos; NK: Norwegian Krone; R: Russian Ruble; RI: Indonesian Rupiah; SF: Romanian Leu; SK: Slovak Koruna; TL: Turkish Lira; U$: US Dollar.
3.2. Differences in Yields, Liquidity, and Volatility: The Green-Brown Bond Puzzle
Our main research question including asking whether the green characteristic of a bond can per se create a difference in terms of bond returns, liquidity, and volatility.
In order to study the difference between a green bond and its closest brown bond correspondent, we started by looking at the matched yield pairs for the days on which both were traded (i.e., excluding zero trading days for at least one of the two bonds). The specification used in order to estimate the green effect on returns is
where is the daily yield spread for the ith bond couple on day t, which is given by the difference between the green bond ask yield and the ask yield of its closest brown bond neighbor according to the matching criteria discussed in the previous paragraph. Among the regressors, was our main parameter of interest that captures the time invariant green effect; ΔLiq is the daily difference in liquidity between a green bond and its brown bond twin, where the variable is computed for each bond as a difference between the bid and the ask price. The validity of this measure as a proxy for liquidity is supported by Van Loon et al. [32], Dick-Nielsen et al. [30], and Chen et al. [33]. ΔZTD is the difference in no trading days between the green and brown bond and is included as additional measure of (il)liquidity; is the difference in bond yield variance computed ex post in a 20-day moving window. B-variables are bond characteristics that are not exactly matched (coupon, amount issued, and maturity), in order to control for factors not fully captured by our matching.
The equation was first estimated with ordinary least squares (OLS) and afterward, with fixed effects (FE) () in order to control for any bond couple unobservable time invariant characteristic. In this last case, ΔB variables disappear as the considered differences in bond characteristics are time invariant for each bond couple.
Regression findings on the overall sample identify a positive green premium between 2.06 and 5.9 bps (Table 4). Note that the R2 is extremely low, especially in the non-augmented specification, as expected and consistent with the literature [1] (in the specification with fixed effects and just the intercept without other controls the variance of the residuals is equal to the total variance, and for this reason the R2 is equal to 0 (Table 4, column 4). We used this specification (in which we compute the mean and the variance) only as a first benchmark for comparison with the augmented specifications that follow). This is reasonable considering that our dependent variable measures differences in yields between twins. The positive premium was larger in OLS when we controlled for both of our two liquidity measures and for the standard deviation (Table 4, columns 3 and 6 for OLS and FE estimates, respectively) with the augmented specification accounting for a substantial increase in goodness of fit (R2 = 0.2). As expected, the yield differential was also positively correlated with differences in coupon, maturity, and standard deviation.
Table 4.
Determinants of the green bond yield differential.
Our second test is on H2: the difference in liquidity between a green bond and its brown bond twin. We cannot perform an independent t-test on the equality of means for green and brown bonds since observations are not independent. We therefore estimated differences in liquidity spread between brown and green bonds using a simple fixed effect approach:
where the dependent variable is the difference in liquidity for the ith (green-brown) bond couple on day t, calculated as the difference between price bid and price ask of the green bond minus the same difference for its brown bond closest neighbor. Given variable construction, a significant and positive coefficient for implies that green bonds are more liquid. As shown in the first column of Table 5, we found that green bonds are generally (around 5 bps) more liquid with respect to their matched twins.
Table 5.
Testing the difference in liquidity and volatility for green and brown bonds.
Our third null hypothesis on the equality of volatility between green and brown bonds was tested using the same simple fixed effect approach. We therefore estimated the following specification:
where volatility in yields in the secondary market is calculated as the ex post standard deviation of bond yields by considering a spanning period of 20 days ().
Estimated findings showed that green bonds are significantly less volatile than brown bonds, even though the difference in magnitude is small (Table 5, column 2).
Our findings on returns, liquidity, and volatility outline a puzzle. Green bonds have uncompensated advantages with respect to their brown twins since they have higher returns and are simultaneously more liquid and slightly less volatile. In what follows, we propose an interpretation of it by considering the characteristics of the issuer (its private or institutional nature) and the presence or absence of a green label that can reduce asymmetric information and greenwashing (reputational) risk.
3.3. The Institutional–Private Issuer Breakdown
As mentioned in Section 3, the better reputation of the institutional issuer could be one of the rationales for the rejection of the null. We therefore split the sample into private and institutional issuers.
When re-estimating Equation (1) for the private issuer subsample, we found that green bonds have significantly higher returns with respect to their brown twins (Table 6) and exhibit a premium between 2 and 3 bps. If we limit the estimate to the private issuers without a green label, the premium is much higher and between 3.2 and 12.4 bps according to the different specifications (Table 7).
Table 6.
The determinants of the green bond yield differential: private issuers.
Table 7.
Determinants of the green bond yield differential: private issuers without third-party verification.
When estimating the same model for the institutional issuers subsample, we found that the green bond premium is now negative and statistically significant, and when we controlled for liquidity. In terms of magnitude, green bonds from institutional issuers exhibited a yield lower in a range between 0.9 and 1.87 bps according to the different estimates. (Table 8, columns 2 and 4). The premium was positive only when we corrected for the yield standard deviation.
Table 8.
The determinants of the green bond yield differential: institutional issuers.
To analyze further differences in characteristics between green and brown bonds from private versus institutional issuers, we re-estimated the liquidity and variance specifications in Equations (2) and (3) for the two different groups. Results on liquidity differences are shown in Table 9. Green bonds from private issuers were significantly but slightly (18 bps) more liquid with respect to their brown twins (Table 9, column 2), except when green bonds were not green certified (Table 9, column 3). In the latter case, green bonds were less liquid then their brown twins. Green bonds issued by domestic or supranational institutions were significantly more liquid (around 10 bps) with respect to their brown twins (Table 9, column 1).
Table 9.
Liquidity difference for green and brown bonds in different subsamples.
Results on the differences in volatility for the same subgroups are shown in Table 8. Again, the standard deviation in yields was smaller for green bonds when considering the private–institutional breakdown, except for private non-verified bonds (where, however, the difference in standard deviation was not significant). This finding is consistent with the assumption that non-verified green bonds from private issuers have worse reputations and higher risk of green washing (Table 10). Notably, the strongest negative difference in SD between green and brown bonds (almost 10%) was for green bonds from institutional issuers.
Table 10.
Volatility difference for green and brown bonds in different subsamples.
4. Robustness Checks
To check whether our results hold even when we departed from the normality assumption, we provide bootstrapped estimates of the specification on the determinants of yield differences between green and brown bonds. Our findings were substantially unchanged since private green bonds exhibited a positive premium, whereas institutional green bonds a negative premium, versus their closest brown counterparts (Table 11). As well, private bonds displayed a (slightly) lower premium.
Table 11.
The determinants of the green bond yield differential (bootstrapped ordinary least squares (OLS) estimates with 500 replications).
Finally, in order to control for outliers in our dependent variable, especially on the right side of the distribution, we propose a Tobit specification by censoring observations at the 1st and at the 99th percentiles, controlling for the unmatched bond characteristics and splitting the sample for institutional, private, and private issuers with no third-party verification (note that when using this model, we could not control for fixed effects because the Tobit specification is a non-linear function). Our main results were substantially unchanged. Green bonds had significantly lower yields for the institutional issuers sample, with positive yields from the private issuers sample, and still more positive for private issuers of unlabeled bonds (Table 12).
Table 12.
The determinants of the green bond yield differential (TOBIT estimates censoring the data at the 1st and 99th percentiles).
5. Conclusions
Understanding the characteristics and financing conditions of green bonds is of great importance in a world that struggles to convert its production system into a more sustainable and circular economy in order to tackle environmental challenges and the threat of climate change.
The literature aiming to provide answers in this field has so far only partially investigated green bond yield premia and mixed findings have been produced. We contribute to the literature by examining issuer characteristics and the presence or absence of green verification to better understand green versus brown bond features.
We collected a sample of 89 bond couples and found that, overall, green bonds have surprisingly higher yields coupled with higher liquidity and are simultaneously slightly less volatile than their closest brown bond correspondents. We helped explain these findings by analyzing the institutional/private issuer breakdown and considering the verification variable. Institutional green bonds display a negative premium and are far more liquid, whereas private green bonds have a positive premium and a much narrower liquidity advantage with respect to their brown bond twins. When we further decomposed private issuer green bonds into certified and non-certified categories, we found that the positive premium is very strong for the latter.
Our findings mainly suggest that green bonds may enjoy a negative premium and therefore green investment may be financed at a discount (either for the existence of a willingness of investors to pay for environmental sustainability, or due to the lower exposition to stakeholder risk of green investment). However, the premium requires either the established reputation of the (institutional) issuers or a green verification in order to reduce asymmetric information and provide guarantees to investors against bond greenwashing.
Author Contributions
Funding
This research was funded by the Italian project “Social Impact Finance SIF 16-00055”.
Conflicts of Interest
The authors declare no conflict of interest.
Appendix A
Table A1.
The bond sample.
Table A1.
The bond sample.
| Couple | Green | Isin | Amount | Coupon | Issue Date | Maturity Date | Currency |
|---|---|---|---|---|---|---|---|
| 1 | 0 | US45950KCH14 | 500,000 | 1.25 | 27/11/2015 | 27/11/2018 | U$ |
| 1 | 1 | US45950VHE92 | 500,000 | 1.25 | 27/11/2015 | 27/11/2018 | U$ |
| 2 | 0 | US61746BDX10 | 2,000,000 | 2.45 | 27/01/2016 | 01/02/2019 | U$ |
| 2 | 1 | US6174468B80 | 500,000 | 2.20 | 08/06/2015 | 07/12/2018 | U$ |
| 3 | 0 | XS1399311064 | 1,200,000 | 0.5 | 26/04/2016 | 26/04/2021 | SK |
| 3 | 1 | XS1494406074 | 3,000,000 | 0.5 | 22/09/2016 | 22/09/2023 | SK |
| 4 | 0 | US00850XAC20 | 500,000 | 2.75 | 21/05/2015 | 21/05/2020 | U$ |
| 4 | 1 | XS1303791336 | 500,000 | 2.75 | 20/10/2015 | 20/10/2020 | U$ |
| 5 | 0 | US459058CY72 | 750,000 | 2.125 | 13/02/2013 | 13/02/2023 | U$ |
| 5 | 1 | US45905URL07 | 600,000 | 2.125 | 03/03/2015 | 03/03/2025 | U$ |
| 6 | 0 | US500769HH04 | 4,000,000 | 1.75 | 07/03/2017 | 31/03/2020 | U$ |
| 6 | 1 | US500769GF56 | 1,500,000 | 1.75 | 15/10/2014 | 15/10/2019 | U$ |
| 7 | 0 | US45950KCE82 | 500,000 | 0.625 | 03/10/2014 | 03/10/2016 | U$ |
| 7 | 1 | US45950VCJ35 | 1,000,000 | 0.5 | 22/02/2013 | 16/05/2016 | U$ |
| 8 | 0 | US500769FH22 | 3,000,000 | 2 | 04/10/2012 | 04/10/2022 | U$ |
| 8 | 1 | US500769HP20 | 1,000,000 | 2 | 05/10/2017 | 29/09/2022 | U$ |
| 9 | 0 | US500769FH22 | 3,000,000 | 2 | 04/10/2012 | 04/10/2022 | U$ |
| 9 | 1 | US500769HD99 | 1,500,000 | 2 | 30/11/2016 | 30/11/2021 | U$ |
| 10 | 0 | DE000NWB17W8 | 500,000 | 0.5 | 07/06/2017 | 07/06/2027 | E |
| 10 | 1 | DE000NWB0AE6 | 500,000 | 0.5 | 13/09/2017 | 13/09/2027 | E |
| 11 | 0 | XS0965428799 | 350,000 | 4.17 | 11/09/2013 | 11/09/2018 | MP |
| 11 | 1 | XS1508504526 | 75,000 | 4.1 | 16/11/2016 | 16/11/2019 | MP |
| 12 | 0 | US045167CX94 | 2,250,000 | 1.875 | 18/02/2015 | 18/02/2022 | U$ |
| 12 | 1 | US045167EB56 | 750,000 | 1.875 | 10/08/2017 | 10/08/2022 | U$ |
| 13 | 0 | US30216BGN64 | 1,250,000 | 1.625 | 19/01/2017 | 17/01/2020 | U$ |
| 13 | 1 | US30216BGU08 | 500,000 | 1.625 | 01/06/2017 | 01/06/2020 | U$ |
| 14 | 0 | XS1043504452 | 4,924,000 | 2 | 11/03/2014 | 18/01/2017 | CH |
| 14 | 1 | XS1080036939 | 500,000 | 2 | 26/06/2014 | 26/06/2017 | CH |
| 15 | 0 | XS0993228534 | 1,000,000 | 0.375 | 13/11/2013 | 15/12/2016 | E |
| 15 | 1 | XS1047440448 | 550,000 | 0.25 | 20/03/2014 | 20/03/2017 | E |
| 16 | 0 | XS1371532117 | 600,000 | 1.875 | 01/03/2016 | 01/03/2019 | U$ |
| 16 | 1 | XS1437622548 | 500,000 | 1.875 | 12/07/2016 | 12/07/2019 | U$ |
| 17 | 0 | XS1346287748 | 1,000,000 | 1.5 | 22/01/2016 | 22/01/2019 | U$ |
| 17 | 1 | XS1383831648 | 600,000 | 1.5 | 22/03/2016 | 23/04/2019 | U$ |
| 18 | 0 | SE0005880143 | 200,000 | 2.45 | 15/04/2014 | 15/04/2019 | SK |
| 18 | 1 | SE0005798816 | 500,000 | 2.473 | 19/03/2014 | 19/03/2019 | SK |
| 19 | 0 | DE000NWB16P4 | 500,000 | 0.75 | 05/02/2014 | 05/02/2018 | E |
| 19 | 1 | DE000NWB0AA4 | 250,000 | 0.75 | 28/11/2013 | 28/11/2017 | E |
| 20 | 0 | US06051GES49 | 1,000,000 | 1.25 | 11/01/2013 | 11/01/2016 | U$ |
| 20 | 1 | US06051GEZ81 | 500,000 | 1.35 | 21/11/2013 | 21/11/2016 | U$ |
| 21 | 0 | XS1221967042 | 1,000,000 | 2.125 | 23/04/2015 | 23/04/2025 | U$ |
| 21 | 1 | XS1188118100 | 500,000 | 2.125 | 11/02/2015 | 11/02/2025 | U$ |
| 22 | 0 | US45950KCE82 | 500,000 | 0.625 | 03/10/2014 | 03/10/2016 | U$ |
| 22 | 1 | US45950VCP94 | 1,000,000 | 0.625 | 15/11/2013 | 15/11/2016 | U$ |
| 23 | 0 | XS1074055770 | 600,000 | 2.5 | 04/06/2014 | 04/06/2026 | E |
| 23 | 1 | XS1038708522 | 750,000 | 2.5 | 26/02/2014 | 26/02/2024 | E |
| 24 | 0 | DE000A168Y55 | 5,000,000 | 0.375 | 09/03/2016 | 09/03/2026 | E |
| 24 | 1 | XS1612940558 | 2,000,000 | 0.25 | 16/05/2017 | 30/06/2025 | E |
| 25 | 0 | XS1165130219 | 500,000 | 2.75 | 12/02/2015 | 12/08/2020 | U$ |
| 25 | 1 | XS1209864229 | 500,000 | 2.75 | 01/04/2015 | 01/04/2020 | U$ |
| 26 | 0 | US00254EMC39 | 1,000,000 | 1.875 | 17/06/2014 | 17/06/2019 | U$ |
| 26 | 1 | US00254EMD12 | 500,000 | 1.875 | 23/06/2015 | 23/06/2020 | U$ |
| 27 | 0 | XS1257176914 | 150,000 | 1.85 | 15/07/2015 | 15/07/2020 | U$ |
| 27 | 1 | XS1618289802 | 500,000 | 1.875 | 23/05/2017 | 01/06/2021 | U$ |
| 28 | 0 | XS1640903537 | 14,000,000 | 5.9 | 06/07/2017 | 20/12/2022 | IR |
| 28 | 1 | XS1618178567 | 3,000,000 | 6 | 24/05/2017 | 24/02/2021 | IR |
| 29 | 0 | XS1669155209 | 500,000 | 1.375 | 23/08/2017 | 23/11/2018 | U$ |
| 29 | 1 | XS1508672828 | 500,000 | 1.375 | 26/10/2016 | 26/10/2020 | U$ |
| 30 | 0 | XS1369614034 | 750,000 | 0.75 | 19/02/2016 | 19/02/2021 | E |
| 30 | 1 | XS1324923520 | 500,000 | 0.75 | 25/11/2015 | 25/11/2020 | E |
| 31 | 0 | US302154CJ68 | 500,000 | 2.125 | 25/01/2017 | 25/01/2020 | U$ |
| 31 | 1 | US302154BZ10 | 400,000 | 2.125 | 11/02/2016 | 11/02/2021 | U$ |
| 32 | 0 | XS0840673858 | 58,020 | 0.5 | 31/10/2012 | 24/10/2017 | TL |
| 32 | 1 | XS0536541005 | 65,000 | 0.5 | 29/09/2010 | 29/09/2017 | TL |
| 33 | 0 | SE0008963920 | 1,250,000 | 1.205 | 24/10/2017 | 24/04/2023 | SK |
| 33 | 1 | SE0010494351 | 1,250,000 | 1.205 | 24/10/2017 | 24/04/2023 | SK |
| 34 | 0 | SE0009345630 | 515,000 | 1.0075 | 29/08/2016 | 15/12/2021 | SK |
| 34 | 1 | SE0009983810 | 830,000 | 1.083 | 24/05/2017 | 24/05/2022 | SK |
| 35 | 0 | US298785HP47 | 5,000,000 | 2.5 | 17/01/2018 | 15/03/2023 | U$ |
| 35 | 1 | US298785GQ39 | 1,000,000 | 2.5 | 15/10/2014 | 15/10/2024 | U$ |
| 36 | 0 | US302154CB33 | 1,000,000 | 1.75 | 26/05/2016 | 26/05/2019 | U$ |
| 36 | 1 | US302154BG39 | 500,000 | 1.75 | 27/02/2013 | 27/02/2018 | U$ |
| 37 | 0 | DE000A1RET72 | 2,000,000 | 0.375 | 15/04/2013 | 18/04/2017 | E |
| 37 | 1 | XS1087815483 | 1,500,000 | 0.375 | 22/07/2014 | 22/07/2019 | E |
| 38 | 0 | US037833DK32 | 1,500,000 | 3 | 13/11/2017 | 13/11/2027 | U$ |
| 38 | 1 | US037833CX61 | 1,000,000 | 3 | 20/06/2017 | 20/06/2027 | U$ |
| 39 | 0 | AU3CB0223592 | 250,000 | 4 | 27/05/2014 | 27/11/2019 | A$ |
| 39 | 1 | AU3CB0226090 | 300,000 | 4 | 16/12/2014 | 16/12/2021 | A$ |
| 40 | 0 | XS1197351577 | 1,500,000 | 1.125 | 04/03/2015 | 04/03/2022 | E |
| 40 | 1 | XS1636000561 | 500,000 | 0.875 | 27/06/2017 | 27/06/2022 | E |
| 41 | 0 | US00828EBE86 | 1,100,000 | 1.375 | 12/02/2015 | 12/02/2020 | U$ |
| 41 | 1 | US00828EBJ73 | 500,000 | 1.375 | 17/12/2015 | 17/12/2018 | U$ |
| 42 | 0 | CA298785GT79 | 1,400,000 | 1.125 | 18/02/2015 | 18/02/2020 | C$ |
| 42 | 1 | XS1490971634 | 500,000 | 1.125 | 16/09/2016 | 16/09/2021 | C$ |
| 43 | 0 | US459058FF56 | 1,000,000 | 1.75 | 19/04/2016 | 19/04/2023 | U$ |
| 43 | 1 | US45905UZT41 | 500,000 | 1.75 | 22/11/2016 | 22/11/2021 | U$ |
| 44 | 0 | FR0013231743 | 1,000,000 | 1.125 | 18/01/2017 | 18/01/2023 | E |
| 44 | 1 | FR0013067170 | 300,000 | 1.125 | 14/12/2015 | 14/12/2022 | E |
| 45 | 0 | AU3CB0241891 | 400,000 | 3.25 | 17/01/2017 | 17/01/2022 | A$ |
| 45 | 1 | AU3CB0243657 | 450,000 | 3.25 | 31/03/2017 | 31/03/2022 | A$ |
| 46 | 0 | US45905UQ233 | 750,000 | 2 | 30/10/2017 | 30/10/2020 | U$ |
| 46 | 1 | US45905UG408 | 300,000 | 2 | 12/04/2017 | 12/04/2022 | U$ |
| 47 | 0 | XS1688390068 | 300,000 | 3 | 25/09/2017 | 25/05/2023 | U$ |
| 47 | 1 | XS1589873097 | 300,000 | 3 | 24/04/2017 | 21/10/2022 | U$ |
| 48 | 0 | XS0167422871 | 200,000 | 1 | 19/05/2003 | 17/05/2018 | U$ |
| 48 | 1 | US045167DQ35 | 800,000 | 1 | 16/08/2016 | 16/08/2019 | U$ |
| 49 | 0 | XS1481017520 | 500,000 | 0.875 | 25/08/2016 | 27/08/2018 | U$ |
| 49 | 1 | US30216BER96 | 300,000 | 0.875 | 30/01/2014 | 30/01/2017 | U$ |
| 50 | 0 | US459058ER04 | 4,000,000 | 1 | 07/10/2015 | 05/10/2018 | U$ |
| 50 | 1 | US45905UWE09 | 280,000 | 1.005 | 21/04/2016 | 01/10/2018 | U$ |
| 51 | 0 | CA298785GT79 | 1,400,000 | 1.125 | 18/02/2015 | 18/02/2020 | C$ |
| 51 | 1 | XS1314336204 | 500,000 | 1.25 | 05/11/2015 | 05/11/2020 | C$ |
| 52 | 0 | XS1346287748 | 1,000,000 | 1.5 | 22/01/2016 | 22/01/2019 | U$ |
| 52 | 1 | US50046PAU93 | 600,000 | 1.5 | 22/03/2016 | 23/04/2019 | U$ |
| 53 | 0 | XS1368576572 | 1,250,000 | 0.75 | 22/02/2016 | 22/02/2021 | E |
| 53 | 1 | XS1324217733 | 500,000 | 0.75 | 24/11/2015 | 24/11/2020 | E |
| 54 | 0 | US459058FQ12 | 300,000 | 1.2 | 30/09/2016 | 30/09/2019 | U$ |
| 54 | 1 | XS1517268105 | 100,000 | 1.181 | 14/11/2016 | 15/12/2019 | U$ |
| 55 | 0 | CH0180006113 | 305,000 | 1.625 | 02/04/2012 | 02/04/2026 | SF |
| 55 | 1 | CH0233004172 | 350,000 | 1.625 | 04/02/2014 | 04/02/2025 | SF |
| 56 | 0 | US44987DAE67 | 1,000,000 | 2.05 | 17/08/2015 | 17/08/2018 | U$ |
| 56 | 1 | US44987DAJ54 | 800,000 | 2 | 24/11/2015 | 26/11/2018 | U$ |
| 57 | 0 | SE0009580186 | 250,000 | 0.35 | 31/01/2017 | 31/07/2019 | SK |
| 57 | 1 | SE0009607013 | 490,000 | 0.38 | 14/02/2017 | 28/08/2019 | SK |
| 58 | 0 | US459058DY63 | 4,300,000 | 1.625 | 12/02/2015 | 10/02/2022 | U$ |
| 58 | 1 | US45905ULF92 | 5000 | 1.5 | 12/07/2012 | 12/07/2022 | U$ |
| 59 | 0 | DE000NWB12F4 | 75,000 | 4.32 | 24/08/2009 | 28/12/2017 | E |
| 59 | 1 | DE000NWB0AB2 | 500,000 | 4.25 | 04/11/2014 | 05/11/2018 | E |
| 60 | 0 | XS1405911576 | 1,350,000 | 0.83 | 10/05/2016 | 10/05/2021 | SK |
| 60 | 1 | XS1433082861 | 1,000,000 | 0.885 | 15/06/2016 | 15/06/2022 | SK |
| 61 | 0 | XS1399311064 | 1,200,000 | 0.5 | 26/04/2016 | 26/04/2021 | SK |
| 61 | 1 | XS1347786797 | 1,000,000 | 0.625 | 20/01/2016 | 20/01/2021 | SK |
| 62 | 0 | XS0858366098 | 3,550,000 | 1.375 | 27/11/2012 | 15/09/2020 | E |
| 62 | 1 | LU0953782009 | 3,000,000 | 1.375 | 18/07/2013 | 15/11/2019 | E |
| 63 | 0 | AU3CB0236727 | 175,000 | 3.25 | 07/04/2016 | 07/04/2021 | A$ |
| 63 | 1 | AU3CB0230100 | 6.000e+08 | 3.25 | 29/06/2015 | 03/06/2020 | A$ |
| 64 | 0 | CND100009HY3 | 5.000e+08 | 3.4 | NA | 14/03/2021 | CH |
| 64 | 1 | CND10000G4D6 | 1.000e+09 | 3.4 | NA | 24/09/2021 | CH |
| 65 | 0 | INE296A07LC6 | 2.000e+08 | 8.55 | NA | 28/04/2021 | IR |
| 65 | 1 | INE296A07LL7 | 2.000e+08 | 8.55 | NA | 14/07/2021 | IR |
| 66 | 0 | CND100005DQ6 | 2.500e+10 | 3.87 | NA | 28/06/2019 | CH |
| 66 | 1 | CND10000G602 | 1.000e+10 | 3.79 | NA | 23/12/2019 | CH |
| 67 | 0 | CND10000H8S4 | 2.000e+09 | 4.68 | NA | 10/05/2020 | CH |
| 67 | 1 | CND10000H6C2 | 2.000e+09 | 4.79 | NA | 11/04/2020 | CH |
| 68 | 0 | DE000BHY0BA8 | 500,000 | 0.125 | 22/10/2015 | 22/10/2020 | E |
| 68 | 1 | DE000BHY0GP5 | 500,000 | 0.125 | 05/05/2015 | 05/05/2022 | E |
| 69 | 0 | DE000BHY0MT5 | 500,000 | 0.125 | 05/09/2017 | 05/01/2024 | E |
| 69 | 1 | DE000BHY0GH2 | 500,000 | 0.125 | 14/06/2017 | 23/10/2023 | E |
| 70 | 0 | XS0849420905 | 2,000,000 | 2.5 | 31/10/2012 | 3/11/02022 | £ |
| 70 | 1 | XS1051861851 | 1,800,000 | 2.25 | 08/04/2014 | 07/03/2020 | £ |
| 71 | 0 | XS1351517260 | 1.800e+08 | 8.46 | 18/02/2016 | 19/02/2019 | RI |
| 71 | 1 | XS1324201497 | 1.700e+08 | 8.66 | 14/12/2015 | 17/12/2018 | RI |
| 72 | 0 | XS1417412506 | 142,800 | 2.5 | 29/11/2016 | 29/11/2021 | A$ |
| 72 | 1 | XS1367226385 | 49,100 | 2.3 | 24/06/2016 | 18/06/2020 | A$ |
| 73 | 0 | XS1014678053 | 2,500,000 | 3.45 | 16/01/2014 | 16/01/2017 | CH |
| 73 | 1 | XS1437844100 | 1,500,000 | 3.6 | 12/07/2016 | 12/07/2018 | CH |
| 74 | 0 | XS1254823682 | 412,000 | 5.71 | 30/07/2015 | 05/08/2020 | IR |
| 74 | 1 | XS1241051967 | 260,000 | 5.6 | 25/06/2015 | 25/06/2020 | IR |
| 75 | 0 | DE000NWB18E4 | 500,000 | 0.25 | 04/07/2017 | 04/07/2025 | E |
| 75 | 1 | DE000NWB0AD8 | 500,000 | 0.375 | 17/11/2016 | 17/11/2026 | E |
| 76 | 0 | XS1138501918 | 400,000 | 1.34 | 18/11/2014 | 18/11/2019 | SK |
| 76 | 0 | XS1697577556 | 1,000,000 | 0.98 | 11/10/2017 | 11/10/2022 | SK |
| 76 | 1 | XS1436518606 | 1,000,000 | 1.048 | 23/06/2016 | 23/06/2021 | SK |
| 77 | 0 | XS1401196958 | 500,000 | 1.125 | 28/04/2016 | 28/04/2027 | E |
| 77 | 0 | XS1523192588 | 500,000 | 0.875 | 22/11/2016 | 21/02/2025 | E |
| 77 | 1 | XS1218319702 | 500,000 | 1 | 15/04/2015 | 14/03/2025 | E |
| 78 | 0 | US30216BFZ04 | 1,000,000 | 1.25 | 02/02/2016 | 04/02/2019 | U$ |
| 78 | 1 | US30216BFY39 | 300,000 | 1.25 | 08/12/2015 | 10/12/2018 | U$ |
| 79 | 0 | DE000A168Y06 | 5,000,000 | 0.125 | 03/09/2015 | 01/06/2020 | E |
| 79 | 1 | XS1311459694 | 1,500,000 | 0.125 | 27/10/2015 | 27/10/2020 | E |
| 80 | 0 | XS0995130712 | 2,250,000 | 8.5 | 22/11/2013 | 25/07/2019 | TL |
| 80 | 1 | XS1198278175 | 275,000 | 8.5 | 12/03/2015 | 27/03/2019 | TL |
| 81 | 0 | AU3CB0204402 | 1,200,000 | 3.5 | 24/01/2013 | 24/01/2018 | A$ |
| 81 | 1 | AU3CB0220424 | 300,000 | 3.5 | 29/04/2014 | 29/04/2019 | A$ |
| 82 | 0 | XS1346200055 | 1,450,000 | 1.375 | 18/01/2016 | 01/02/2021 | £ |
| 82 | 1 | XS1268337844 | 1,000,000 | 1.625 | 30/07/2015 | 05/06/2020 | £ |
| 83 | 0 | XS0544798167 | 1,250,000 | 7 | 06/10/2010 | 06/10/2015 | R |
| 83 | 1 | XS0994434487 | 2,300,000 | 6.75 | 19/11/2013 | 15/09/2017 | R |
| 84 | 0 | XS1040151315 | 750,000 | 0.75 | 05/03/2014 | 05/03/2018 | E |
| 84 | 1 | XS1083955911 | 500,000 | 0.625 | 03/07/2014 | 03/07/2019 | E |
| 85 | 0 | DE000NWB17G1 | 1,000,000 | 0.625 | 11/02/2016 | 11/02/2026 | E |
| 85 | 1 | DE000NWB0AC0 | 500,000 | 0.875 | 10/11/2015 | 10/11/2025 | E |
| 86 | 0 | NO0010724743 | 1,500,000 | 2.45 | 24/11/2014 | 24/05/2023 | NK |
| 86 | 1 | NO0010752702 | 1,500,000 | 2.35 | 04/12/2015 | 04/09/2024 | NK |
| 87 | 0 | US06050TME90 | 1,250,000 | 2.05 | 07/12/2015 | 07/12/2018 | U$ |
| 87 | 0 | US06050TMC35 | 1,750,000 | 1.75 | 05/06/2015 | 05/06/2018 | U$ |
| 87 | 1 | US06051GFR56 | 600,000 | 1.95 | 12/05/2015 | 12/05/2018 | U$ |
| 88 | 0 | XS1128264758 | 350,000 | 4.125 | 23/10/2014 | 23/04/2020 | U$ |
| 88 | 1 | XS1325600994 | 350,000 | 4.25 | 30/11/2015 | 30/11/2020 | U$ |
| 89 | 0 | XS1422841202 | 500,000 | 0.625 | 31/05/2016 | 31/05/2022 | E |
| 89 | 1 | XS1244060486 | 500,000 | 0.75 | 09/06/2015 | 09/06/2020 | E |
Amount: thousands of local currency.
References
- Zerbib, O.D. The effect of pro-environmental preferences on bond prices: Evidence from green bonds. J. Bank. Finance 2019, 98, 39–60. [Google Scholar] [CrossRef]
- Wulandari, F.; Schäfer, D.; Andreas, S.; Sun, C. Liquidity Risk and Yield Spreads of Green Bonds. DIW Berlin Discussion Paper No. 1728. 2018. Available online: https://papers.ssrn.com/sol3/papers.cfm?abstract_id=3161323 (accessed on 16 February 2019).
- Reboredo, J.C. Green Bond and Financial Markets: Co-Movement, Diversification and Price Spillover Effects. Energy Econ. 2018, 74, 38–50. [Google Scholar] [CrossRef]
- Karpf, A.; Mandel, A. The changing value of the ‘green’ label on the US municipal bond market. Nat. Clim. Chang. 2018, 8, 161. [Google Scholar] [CrossRef]
- Hachenberg, B.; Schiereck, D. Are green bonds priced differently from conventional bonds? J. Asset Manag. 2018, 19, 371–383. [Google Scholar] [CrossRef]
- Glavas, D.; Bancel, F. Are Agency Problems a Determinant of Green Bond Issuance? Univ. Libr. MunichGer. 2018. MPRA Paper No. 88377. Available online: https://mpra.ub.uni-muenchen.de/88377/ (accessed on 16 February 2019).
- Reichelt, H. Green bonds: A model to mobilise private capital to fund climate change mitigation and adaptation projects. In The EuroMoney Environmental Finance Handbook; World Bank Group: Washington, DC, USA, 2010; pp. 1–7. [Google Scholar]
- World Bank. What Are Green Bonds? (English); World Bank Group: Washington, DC, USA, 2015; Available online: http://documents.worldbank.org/curated/en/400251468187810398/What-are-green-bonds (accessed on 16 February 2019).
- International Energy Agency. Global Energy & CO2 Status Report 2017. Available online: https://www.iea.org/publications/freepublications/publication/GECO2017 (accessed on 16 February 2019).
- Climate Bonds Initiative. Green Bond Policy: Highlights from 2017. Available online: https://www.climatebonds.net/files/reports/cbi-policyroundup_2017_final_3. (accessed on 16 February 2019).
- OECD. Mapping Channels to Mobilise Institutional Investment in Sustainable Energy. In Green Finance and Investment; OECD Publishing: Paris, France, 2015. [Google Scholar]
- ICMA—International Capital Market Association. Green Bond Principles. Voluntary Process Guidelines for Issuing Green Bonds; ICMA: Washington, DC, USA, 2015. [Google Scholar]
- Technical Expert Group on Sustainable Finance: Report on Climate-Related Disclosures. Available online: https://ec.europa.eu/info/publications/190110-sustainable-finance-teg-report-climate-related-disclosures_en (accessed on 16 February 2019).
- Roe, B.; Teisl, M.F.; Levy, A.; Russell, M. US consumers’ willingness to pay for green electricity. Energy Policy 2001, 29, 917–925. [Google Scholar] [CrossRef]
- Kaenzig, J.; Heinzle, S.L.; Wüstenhagen, R. Whatever the customer wants, the customer gets? Exploring the gap between consumer preferences and default electricity products in Germany. Energy Policy 2013, 53, 311–322. [Google Scholar] [CrossRef]
- Rommel, J.; Sagebiel, J.; Müller, J.R. Quality uncertainty and the market for renewable energy: Evidence from German consumers. Renew. Energy 2016, 94, 106–113. [Google Scholar] [CrossRef]
- Amiraslani, H.; Lins, K.V.; Servaes, H.; Tamayo, A. A matter of Trust? The Bond Market Benefits of Corporate Social Capital during the Financial Crisis. CEPR Discussion Paper No. DP12321. 2017. Available online: https://ssrn.com/abstract=3042634 (accessed on 16 February 2019).
- Bauer, R.; Hann, D. Corporate Environmental Management and Credit Risk. Available online: https://ssrn.com/abstract=1660470 (accessed on 16 February 2019).
- Graham, A.; Maher, J.J.; Northcut, W.D. Environmental liability information and bond ratings. J. Account. Audit. Finance 2001, 16, 93–116. [Google Scholar] [CrossRef]
- Oikonomou, I.; Brooks, C.; Pavelin, S. The effects of corporate social performance on the cost of corporate debt and credit ratings. Financial Rev. 2014, 49, 49–75. [Google Scholar] [CrossRef]
- Becchetti, L.; Ciciretti, R.; Dalo, A. Fishing the Corporate Social Responsibility Risk Factors. J. Financial Stabil. 2018, 37, 25–48. [Google Scholar] [CrossRef]
- Becchetti, L.; Ciciretti, R.; Hasan, I.; La Licata, G. Environmental Reputational Risk, Negative Media Attention and Financial Performance. Mimeo 2019. [Google Scholar]
- Sharfman, M.P.; Fernando, C.S. Environmental risk management and the cost of capital. Strateg. Manag. J. 2008, 29, 569–592. [Google Scholar] [CrossRef]
- Renneboog, L.; Ter Horst, J.; Zhang, C. Socially responsible investments: Institutional aspects, performance, and investor behavior. J. Bank. Finance 2008, 32, 1723–1742. [Google Scholar] [CrossRef]
- Kreander, N.; Gray, R.H.; Power, D.M.; Sinclair, C.D. Evaluating the performance of ethical and non-ethical funds: A matched pair analysis. J. Bus. Finance Account. 2005, 32, 1465–1493. [Google Scholar] [CrossRef]
- Gregory, A.; Matatko, J.; Luther, R. Ethical unit trust financial performance: Small company effects and fund size effects. J. Bus. Finance Account. 1997, 24, 705–725. [Google Scholar] [CrossRef]
- Crabbe, L.E.; Turner, C.M. Does the liquidity of a debt issue increase with its size? Evidence from the corporate bond and medium-term note markets. J. Finance 1995, 50, 1719–1734. [Google Scholar] [CrossRef]
- Helwege, J.; Turner, C.M. The slope of the credit yield curve for speculative-grade issuers. J. Finance 1999, 54, 1869–1884. [Google Scholar] [CrossRef]
- Huang, W.J.; Zhang, Y.B. Assessment of power customer credit risk based on extension method. Power Syst. Prot. Control 2008, 19. [Google Scholar]
- Helwege, J.; Huang, J.Z.; Wang, Y. Liquidity effects in corporate bond spreads. J. Bank. Finance 2014, 45, 105–116. [Google Scholar] [CrossRef]
- Dick-Nielsen, J.; Feldhütter, P.; Lando, D. Corporate bond liquidity before and after the onset of the subprime crisis. J. Financial Econ. 2012, 103, 471–492. [Google Scholar] [CrossRef]
- Green Bonds Market Summary—Q1 2018. Climate Bond Initiative. Available online: https://www.climatebonds.net/resources/reports/green-bonds-market-summary-q1-2018 (accessed on 16 February 2019).
- Chen, L.; Lesmond, D.A.; Wei, J. Corporate yield spreads and bond liquidity. J. Finance 2007, 62, 119–149. [Google Scholar] [CrossRef]
© 2019 by the authors. Licensee MDPI, Basel, Switzerland. This article is an open access article distributed under the terms and conditions of the Creative Commons Attribution (CC BY) license (http://creativecommons.org/licenses/by/4.0/).