Review

Data Mining and Machine Learning to Promote Smart Cities: A Systematic Review from 2000 to 2018

by
Jovani Taveira de Souza
*,
Antonio Carlos de Francisco
,
Cassiano Moro Piekarski
and
Guilherme Francisco do Prado
Department of Production Engineering, Federal University Technology, Av. Monteiro Lobato, 84016-210, Ponta Grossa, Paraná, Brazil
*
Author to whom correspondence should be addressed.
Sustainability 2019, 11(4), 1077; https://doi.org/10.3390/su11041077
Submission received: 24 January 2019 / Revised: 14 February 2019 / Accepted: 15 February 2019 / Published: 19 February 2019
(This article belongs to the Collection Sustainable Smart Cities and Villages)

Abstract

:
Smart cities (SC) promote economic development, improve the welfare of their citizens, and help in the ability of people to use technologies to build sustainable services. However, computational methods are necessary to assist in the process of creating smart cities because they are fundamental to the decision-making process, assist in policy making, and offer improved services to citizens. As such, the aim of this research is to present a systematic review regarding data mining (DM) and machine learning (ML) approaches adopted in the promotion of smart cities. The Methodi Ordinatio was used to find relevant articles and the VOSviewer software was performed for a network analysis. Thirty-nine significant articles were identified for analysis from the Web of Science and Scopus databases, in which we analyzed the DM and ML techniques used, as well as the areas that are most engaged in promoting smart cities. Predictive analytics was the most common technique and the studies focused primarily on the areas of smart mobility and smart environment. This study seeks to encourage approaches that can be used by governmental agencies and companies to develop smart cities, being essential to assist in the Sustainable Development Goals.

1. Introduction

According to a United Nations [1] report, it is estimated that 68% of all people will live in urban areas by 2050. The report [1] shows that there was an exponential increase in urban living from 1950 to 2018, from 751 million to 4.2 billion people.
Bibri and Krogstie [2] argue that 70% of the world’s natural resources are used in urban cities, resulting in environmental destruction, degradation of ecosystems, and problems with energy resources, among others. Restrictions on the availability of resources are one of the major challenges for urban development, as cities are designed to reduce costs, reduce unemployment, focus on climate change, and supply potable water, among other things [3,4]. Therefore, it is necessary to use smart approaches to aid citizens in addressing all these aspects [5] and smart cities are one of the solutions to solve these problems [6]. The term “smart city” has become increasingly used [7], due to the goals of this concept: To improve the environment and economy and to ameliorate mobility, safety, governance, and living standards of citizens [8]. According to Marsal-Llacuna et al. [9], smart cities (SC) seek to provide high-quality services to their citizens, improve the quality of life, provide better public services, encourage innovative business, monitor and optimize urban infrastructure, preserve the environment, etc.
SC can be classified into six aspects: Environment, economy, governance, living, mobility, and people. [10]. These are key points for solutions to the major divergences of urban development and management of these topics will lead to a smarter city [11].
Many countries and cities are seeking to develop smart cities and some of them have developed a smart environment, smart mobility, and smart energy, among others [12]. One of the big problems for smart cities, however, is knowing how to handle the immeasurable quantities of information generated by organizations, systems, and people every day [13]. However, proper analysis of this data can result in useful information that can help in the process of promoting a smart city [14]. Wenge et al. [15] showed that for smart city implementation, all forms of data are required.
According to Wu et al. [12] the combination of strategic policies and techniques are fundamental for smart cities, promoting sustainable development, economic growth, and better conditions for its citizens. In this sense, data mining (DM) and machine learning (ML) techniques are crucial for applications involving smart cities, since they assist in issues involving urban development, such as identifying locations that need monitoring by police officers [16].
Despite the interest in promoting smart cities, there is still a lack of consensus in current literature about the real effects of these techniques for cities. In addition, most research explores specific issues, not focusing on the role of DM and ML in smart cities.
As far as we know, no published articles have addressed the different DM and ML techniques needed for this subject. Therefore, the contribution of this work is to provide, from a literature review in journals belonging to the Web of Science and Scopus databases, the different DM and ML techniques used, as well as to present the sectors most engaged in the promotion of smart cities. Literature reviews play a crucial role in synthesizing results from previous research, providing new insights on the topic and advancing a particular line of research [17,18,19]. To this end, the Methodi Ordinatio [20] was used to find relevant articles. This review consists of literature published between 2000 and 2018.
This paper has the following structure: Section 2 introduces the materials and methods employed to perform the systematic review, while Section 3 displays results and discussion, and finally, Section 4 provides the main findings and further investigations.

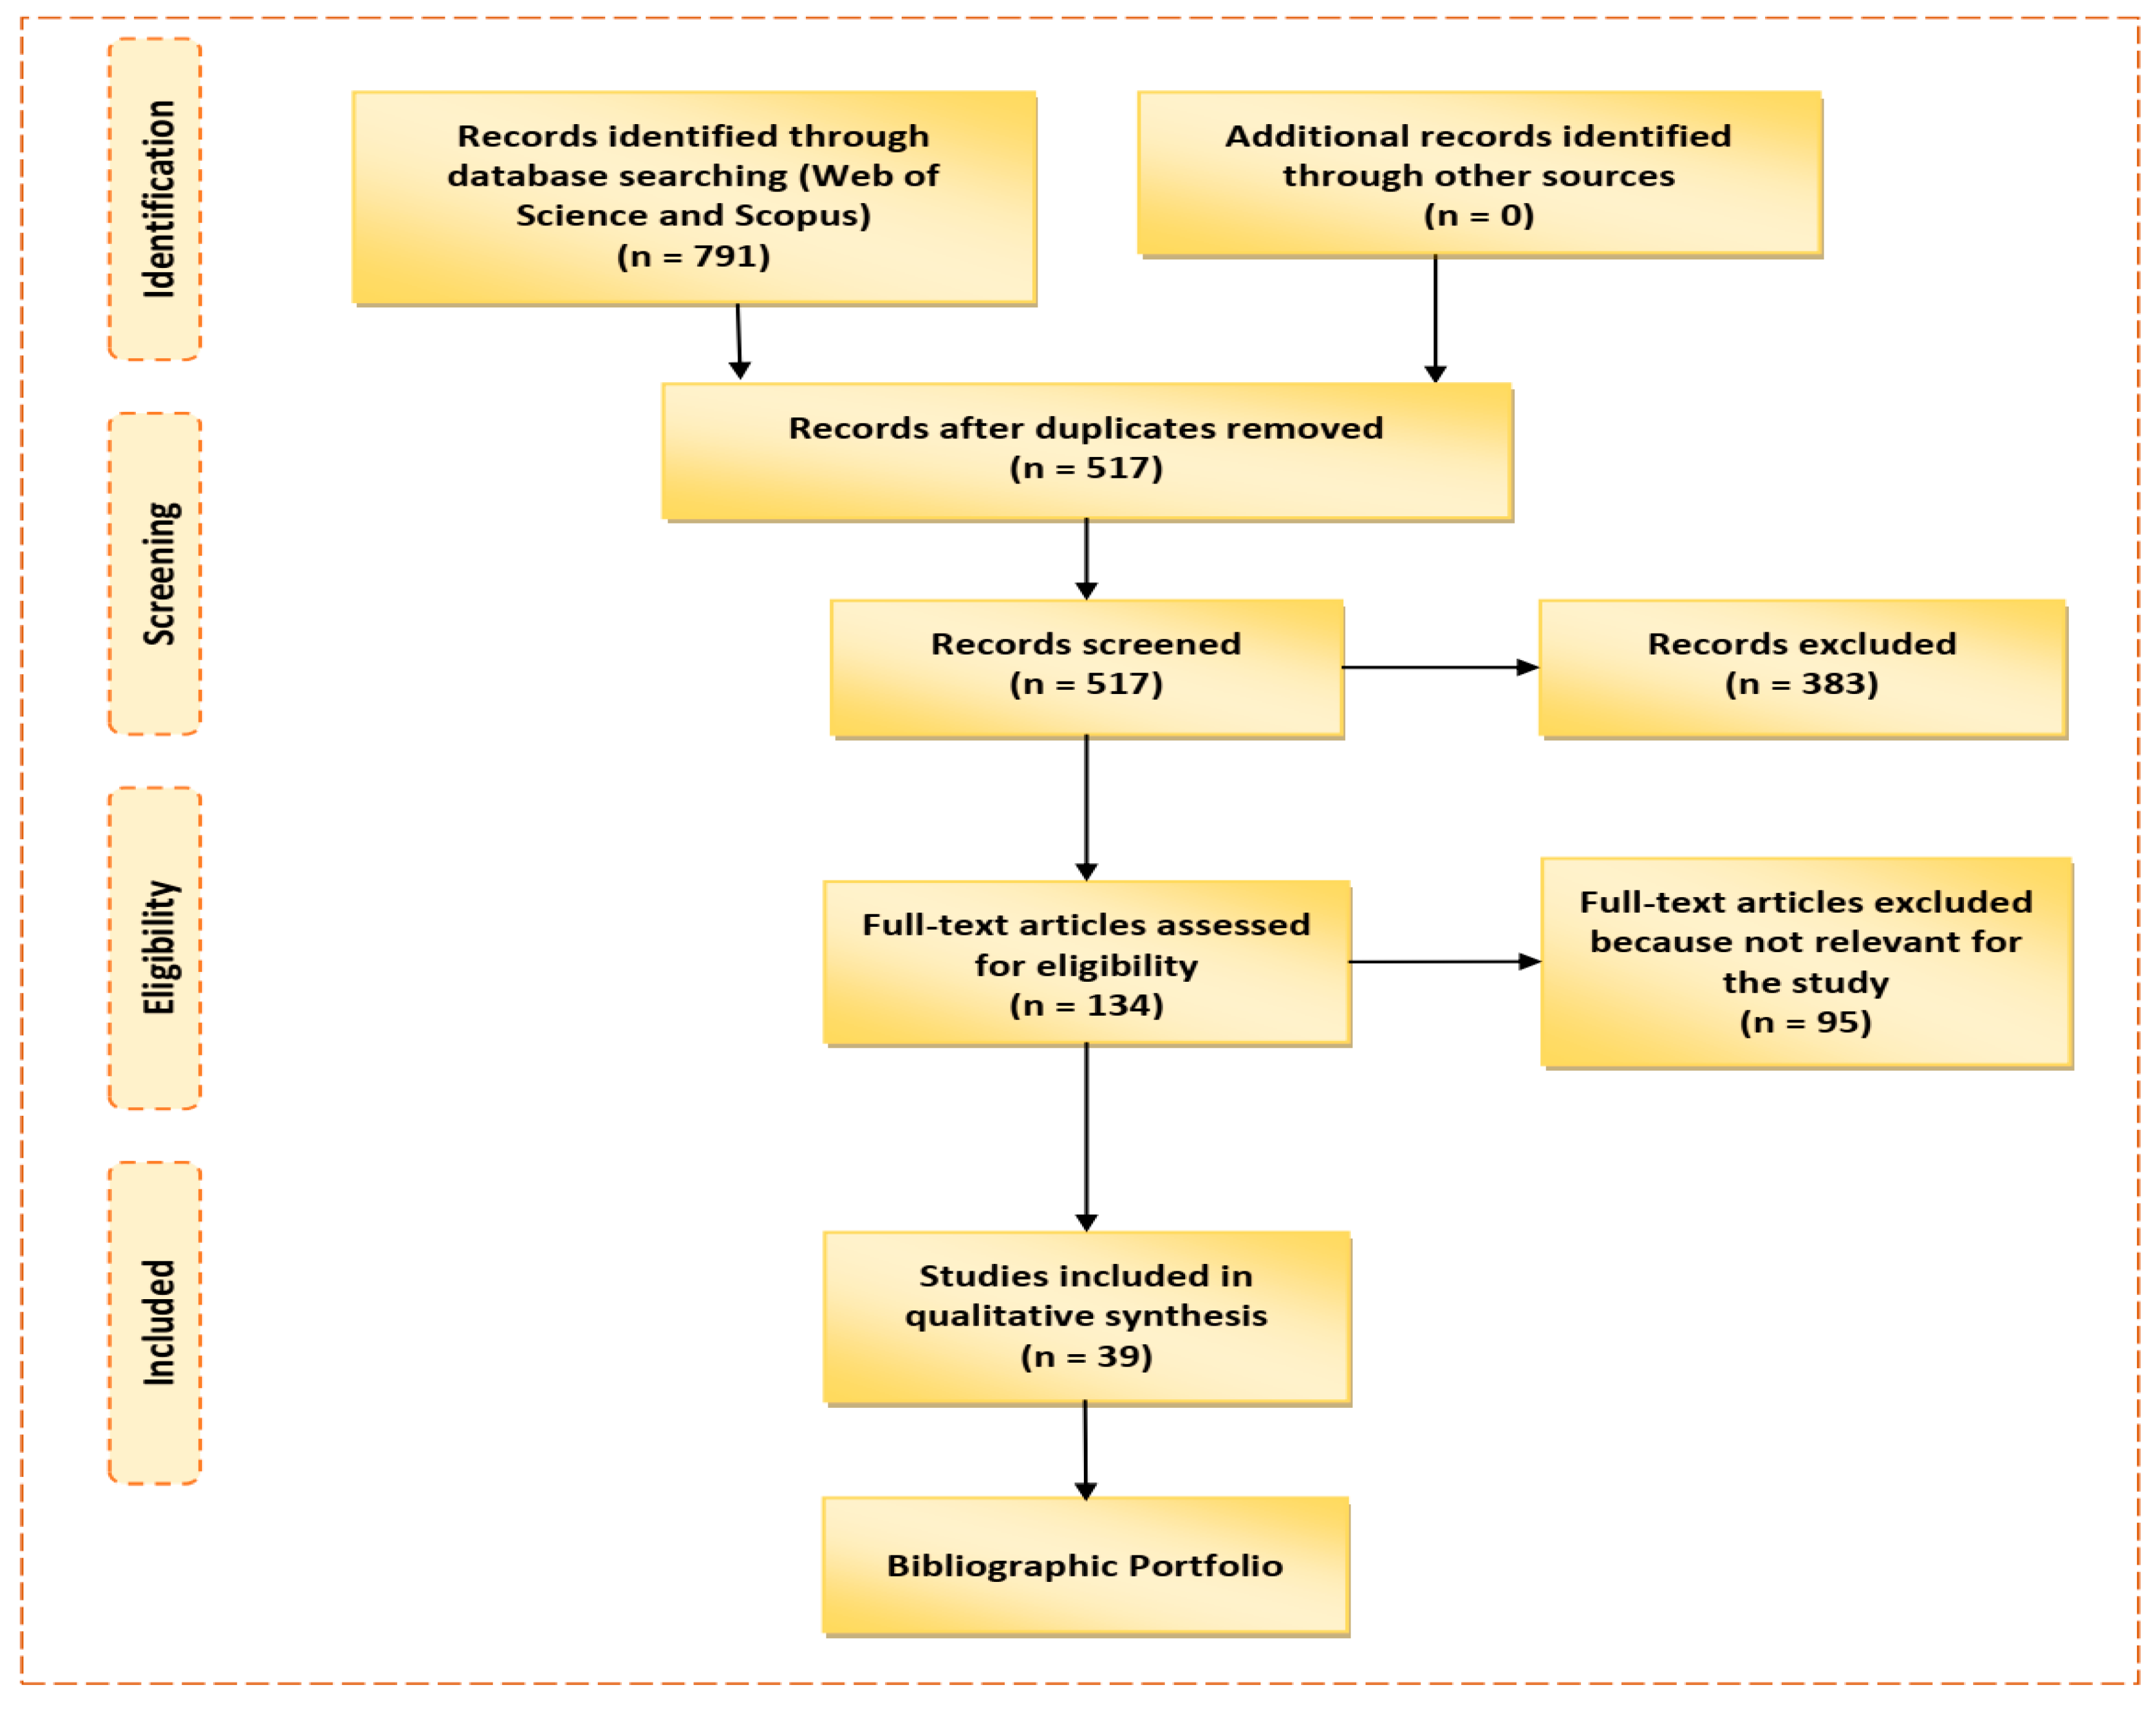
2. Materials and Methods

To identify the existing knowledge related to the use of DM and ML in the promotion of SC, a systematic review was conducted. The methodology called Methodi Ordinatio [20] assisted in this process, the steps of which are detailed below. Figure 1 shows the general process using a PRISMA flowchart. VOSviewer software, version 1.6.7 (van Eck and Waltman, Leiden, Netherlands) was used [21] to create visual maps illustrating authors’ co-citations, journal co-citations, and keywords co-occurrence network.
The first step was to determine the intent of the research, which refers to the problem that the researchers propose to solve. In this research, we intended to identify the main DM and ML techniques that are used to promote smart cities. Therefore, we addressed two research questions:
  • RQ1. What are the most commonly used DM and ML techniques to promote smart cities?
  • RQ2. What areas are most engaged in promoting smart cities?
Subsequently, we determined the initial research in the databases. In relation to the keywords, two groups were formed:
  • Group 1: “Smart city,” “smart cities,” “smart community,” “smart communities,” “intelligent city,” “intelligent cities,” “sustainable city,” “sustainable cities,” “knowledge city,” “knowledge cities.”
  • Group 2: “Data mining,” “machine learning,” “predictive analysis,” “descriptive analytics,” and “deep learning.”
The Web of Science and Scopus databases were used in this step. The time period of the study consisted of literature published between 2000 and 2018. The search resulted in a total number of 791 articles across both databases before the filtering criteria were applied (Table 1).
In order to select the primordial articles for our study, filtering procedures were used. The following criteria were adopted: (a) Exclusion of duplicates, for which the Mendeley software, version 1.19.3 (Elsevier, Londres, England) was used; (b) exclusion of papers published at conferences, in books, or as book chapters, since only periodicals with an impact factor were searched; and (c) exclusion of articles unrelated to the topic— the titles and abstracts of these articles were read, followed by a reading of the full article for the purpose of confirming alignment with the subject. After this screening was completed, 39 articles remained for analysis. The InOrdinatio equation [20] was used to classify the articles in order of relevance, according to the metrics of the year in which it was published, number of citations, and impact factor (Journal Citations Reports (JCR)). The final results are presented in Table 2. It should also be emphasized that the choice of articles was according to the criteria imposed by the researchers, which could variously result in the choice of five, ten, or more relevant articles. For this study, we opted to read and analyze 39 articles (bibliographic portfolio).

3. Results and Discussion

In order to obtain answers to the two research questions, we used a systematic review and herein present the articles gathered through this methodology. Steps were taken during the selection of these articles to remain consistent with the research problems. In addition, research information was provided through visual maps in relation to the authors’ co-citations, journal co-citations, and keywords co-occurrence network in order to find trends, correlations, and hidden information among these investigated studies.

3.1. Bibliographic Portfolio

A total of 39 studies were mapped as shown in Table 2. These studies are in order of relevance as reported in Section 2. We sought mainly to identify the data mining and machine learning techniques employed.
The first study investigated was by Yuan et al. [22], who developed a smart driving direction system for finding the fastest and most intelligent route. In this system, both traffic rhythms and taxi drivers’ ability to choose the best directions were considered. Thus, clustering analyses were used to estimate the distribution of travel time between two reference points at two different time intervals.
The study developed by Rudin et al. [23] involves the creation of predictive models of component and system failures from electrical network histories. These models are based on the application of knowledge, discovery, and ML, which includes time aggregation, formation of features, and labels, alongside ranking methods. Classification algorithms (support vector machine for ranking—SVM Rank, Rankboost, and P-Norm Push) were used to rank the main components according to the probability of failure.
Jurado et al. [24] used random forest and soft computing techniques to perform short-term electrical load forecasting. The goal was to show the performance of the models generated and to support smart grids by providing accurate and fast predictions of electricity consumption in different types of buildings.
Peréz-Chacón et al. [25] developed a cluster-based model capable of identifying patterns of time series in databases related to energy consumption. The results of the study were implemented at a university in Spain.
The study by Peña et al. [26] sought to optimize energy efficiency (EE) in a smart building by reducing energy consumption and by being ecologically correct through the data mining process. The rule-based system detected anomalies in the energy building consumption. Both principal component analysis (PCA) and attribute selection were used to infer a correlation between internal and external sensor data and energy consumption behaviors. They were also used to study the influence of each attribute and to quantify the importance of the variables in EE.
Research completed by Liu et al. [27] aimed to develop a ML model to evaluate the quality of the urban environment through street vision images. These were evaluated through scale-invariant feature transform, AlexNet, and GoogLeNet, together with support vector regression (SVR).
Muhammed et al. [28] developed a ubiquitous framework called UbeHealth using cloud computing to assist in healthcare. In this sense, deep learning was used to predict network traffic.
The study conducted by Massana et al. [29] involved the use of autoregressive models adopted to predict a short-term load-forecasting Smart City platform. The goal was to feature services that increased energy efficiency.
A study conducted by Wang et al. [30] identifies, through a systematic study, the main drivers of urban energy efficiency. Data was collected through the Global Power City Index (GPCI) report, amongst other sources, from twenty-five cities located on three continents: Asia, Europe and America. For data analysis, they used clustering, decision tree, and data wrap techniques. The purpose of utilizing these techniques was to calculate and compare the energy efficiency of the specified cities.
In their research, Abbasi and El Hanandeh [31] developed a predictive model for accurate generation of municipal solid waste (MSW). This could help organizations to better design and operate MSW management systems. In this instance, support vector machines (SVM), adaptive neuro fuzzy inference systems (ANFIS), artificial neural networks (ANN), and k-nearest neighbors (kNN) were used to predict the monthly generation of residues.
With the aim of improving urban mobility in terms of available parking spaces, Badii et al. [32], in their study, compared various techniques that are used to detect possible open spaces to park in the garages. Among the techniques used, the Bayesian regularized artificial neural networks and SVR were highlighted.
In addition to deep learning, Madu et al. [33] used formal concept analysis, which includes principle association rules to identify crucial points in the development of urban sustainability, in order to evaluate textual data acquired by the Carbon Disclosure Project, an organization that disseminates information on the four areas: Risks and opportunities, strategies and performance, greenhouse gas emissions, and governance.
The study by Gomede et al. [34] used a data mining (random forest) model to evaluate information about students’ intellectual progress (acquired knowledge) in order to improve their performance.
Furthermore, Cramer et al. [35] analyzed the application of ML algorithms (genetic programming, SVR, radial basis neural networks, M5 rules, and kNN) for prediction from weather derivatives.
The study conducted by You and Yang [36] sought to understand the process of urban expansion and its determinants. For this purpose, they employed data mining techniques, more precisely, random forest regression, to explore these variables in 30 megacities in China.
The study by Nagy and Simon [37] details the use of predictive methods facilitating traffic mobility. The main methods used were time series models, Kalman filters, Bayesian networks, and kNN.
In their work, Belhajem et al. [38], applied neural networks, SVM, and extended Kalman filter to improve the mobility and positioning of vehicles for adequate fleet coordination.
Moreover, Fernández-Ares et al. [39] utilized different data mining techniques (cluster analysis through a self-organizing map (SOM)) to develop a mobility monitoring system for a smart city, in order to optimize traffic flows in terms of travel time and safety (smart traffic), improve safety, and better tackle energy issues prevalent in buildings.
The authors Belhajem et al. [40] used SVM and extended Kalman filter to provide more accurate information about the positioning of vehicles for smart cities.
The study used by Gopalakrishnan [41] involved a review of deep learning in the context of pavement images analysis and automated distress detection.
The study by Khan et al. [42] aimed to identify the best practices of smart cities as well as those for smart tourism in Dubai. Further, the text mining technique was applied to measure the image of Dubai’s destination, with regard to the concept pertaining to smart cities.
The paper by Idowu et al. [43] presented an approach involving ML techniques (SVM, feed-forward neural network, multiple linear regression, and regression tree) to predict the thermal load in district heating substations.
Bellini et al. [44] developed a methodology to evaluate people’s behavior in the city from Wi-Fi access points. Cluster analyses were applied to extract the most frequented places and typical city users’ behavior, among other data.
A study developed by Tiwari and Adamowski [45] involved using a hybrid method, called wavelet-bootstrap-artificial neural network (WBANN) to predict urban water.
Melzi et al. [46] presented an unsupervised classification approach (clustering) to extract typical patterns of electric consumption from smart meters, with the proposal to optimize consumption of electricity in the cities.
Brentan et al. [47] applied PCA, SOM, and random forest to predict water demand. The study was conducted in three metropolitan areas of France and a Brazilian city, exploring climatic and social variables to improve the knowledge of the residential demand for water.
A study by Kwoczek et al. [48] proposed a solution to the problem of traffic congestion, especially in planned events (soccer games, concerts, etc.). The k-nearest neighbor regression was applied for the predictions.
The work developed by Torija and Ruiz [49] involved a system capable of assisting in the classification of urban locations through the traffic composition. Multi-layer perceptron and SVM were used.
The work of Armas et al. [50] uses evolutionary computation, ML and DM methods to investigate the city of Quito, Ecuador. The study focuses on optimizing a large number of semaphores deployed across a large area of the city and examines their impact on travel time, emissions, and fuel consumption. ML and DM were used to perform hierarchical grouping, in addition to the analysis of signal clusters, estimation of fuel consumption, spatial analysis of emissions, and analysis of signal coordination.
Zhang et al. [51] developed a model involving prediction of passenger flow and passenger boarding. XGBoost was used as an aid in this process.
The study by Del Busto Pinzon and Souza [52] aimed to apply data mining techniques as a tool for metropolitan management. An autocorrelation matrix (ACM), PCA, clustering, and a hierarchical tree were used to study the structure of the variables employed and to analyze the evolution of growth over time.
The work developed by Zheng et al. [53] used a synthetic control method (ML approach) to evaluate the environmental policies in 12 cities in Hubei Province, China, which needed to control environmental pollution.
Pinelli et al. [54] proposed a methodology together with classification and clustering analyses to detect and later correct bus stop locations as well as reconstruct routes and designate schedules through GPS traces.
Liu et al. [55] identified the most important variables in the use of urban water. For this, the authors used historical urban water use data and a DM model called genetic programming (GP) to identify the most relevant factors for 47 cities in northern China.
The study by Kuang and Jiang [56] applied PCA and method wavelet transform to find irregular traffic in urban areas. For its use, the method was applied in a GPS dataset with registered information from several taxis.
Kosmides et al. [57] proposed an infrastructure of stable, reliable, and high-quality wireless communication that combined heterogeneous wireless networks with social networks using software wireless networks (SDNs). Three approaches based on ML, called multilayer perceptrons (MLP), SVM, and probabilistic neural networks (PNN) were applied to make predictions about the level of people expected in a certain area and thus prevent congestion.
The work developed by Liu et al. [58] proposed a system called Population Anomaly Detection (PAD), being one of the key issues related to event monitoring and population management within a city. To perform their study, the authors used correlation-based clustering and mobile phone networks, which offer enormous spatial and temporal communication data on people, to cluster incomplete location information derived from the mobile phone data.
Wang and Zou [59] employed spatial data mining by acquiring knowledge from the geographic information system (GIS) database to support urban planners in their decision-making processes, as accelerating Chinese urbanization begins to cause urban overexpansion problems.
Finally, the study by Zhuang et al. [60] aims to present a method that improves traffic cameras in a city, which helps to control real-time traffic. The authors developed two methods, one of them being Gaussian-based statistical learning, to model the traffic.
From the 39 articles analyzed, it can be affirmed that the techniques perform different functions, for example, as a predictive model, identifying the influence of attributes and variables, or helping in the creation of monitoring systems and policy making. The study conducted by Visvizi et al. [61] highlights the new generation of policy-aware smart cities geared toward innovation and socially inclusive economic growth for sustainability.
The technique of predictive analytics was found to be the most commonly used in the studies (RQ1) [23,24,25,29,30,31,35,37,43,45,47,51,55,57]. Predictions are generally used because they are employed in a variety of situations due to their high predictive accuracy and good interpretation [62]. We also found that the authors’ motivation was not only to create models, systems, or approaches to solve certain problems, but to help planners develop more pleasant cities to live in by using intelligent technology in their favor.
The studies also exhibit that the proposed studies are motivated to find solutions for specific domains of the city (e.g., traffic, mobility, environment, and so on). Clustering analyses were the most used approaches in the studies [22,25,30,39,44,46,50,52,54,57] and later, supported vector machine [23,31,38,40,43,49,57]. The designated studies focused primarily on the areas of smart mobility [22,32,33,36,37,38,39,40,41,42,48,49,50,51,52,54,56,57,58,59,60] and smart environment (RQ2) [23,24,25,26,29,30,31,33,35,36,42,43,45,46,47,52,53,55,59].
In general, as far as we know, this is the first time that a study has been conducted to identify data mining (DM) and machine learning (ML) techniques in order to promote smart cities (SC) and show the areas that are being worked on the most. A more concise and practical solution was to carry out a systematic review to answer these research problems. The research studies showed that few studies related the three keywords (SC, DM, and ML) together; therefore, there are still discrepancies regarding this selection. An accurate study was required by the authors for this. Further, our study shows that there are different purposes for such techniques. However, some studies noted that typically, several experiments are performed to select the ideal technique. Another important observation is that more studies of the different areas within smart cities are necessary, especially concerning smart people, smart governance, and the smart economy; few studies have reported on these three areas. For a city to succeed, it takes people who can intelligently manage where they live and help with decision-making, political strategies, and future perspectives [11]. The evaluated studies were more concerned with environmental and mobility issues.
There remains much to be studied about the benefits that these techniques can provide, since the concepts of smart cities are still new [63]. One of the main challenges is to properly categorize the context in which a particular research fits in order to avoid conducting problematic analysis. We also highlight the employment of cognitive computing as a vital requirement for organizations that act within smart cities, as its solutions allow faster innovation [64,65].
It is recommended that future studies develop models that contemplate dealing with all areas of a smart city. It is also necessary that studies cover more areas at once, since the studies to date have tried to solve specific problems. The integration of the six key points (environment, economy, governance, housing, mobility, and people) are essential for an SC [11]. Our other observation is that understanding the key trends related to smart cities is crucial to the 2030 Agenda for Sustainable Development, which includes all the guidelines for transforming an existing city into a smart city by always promoting the well-being of citizens and through actions directed at people, the planet, prosperity, peace, and partnership.

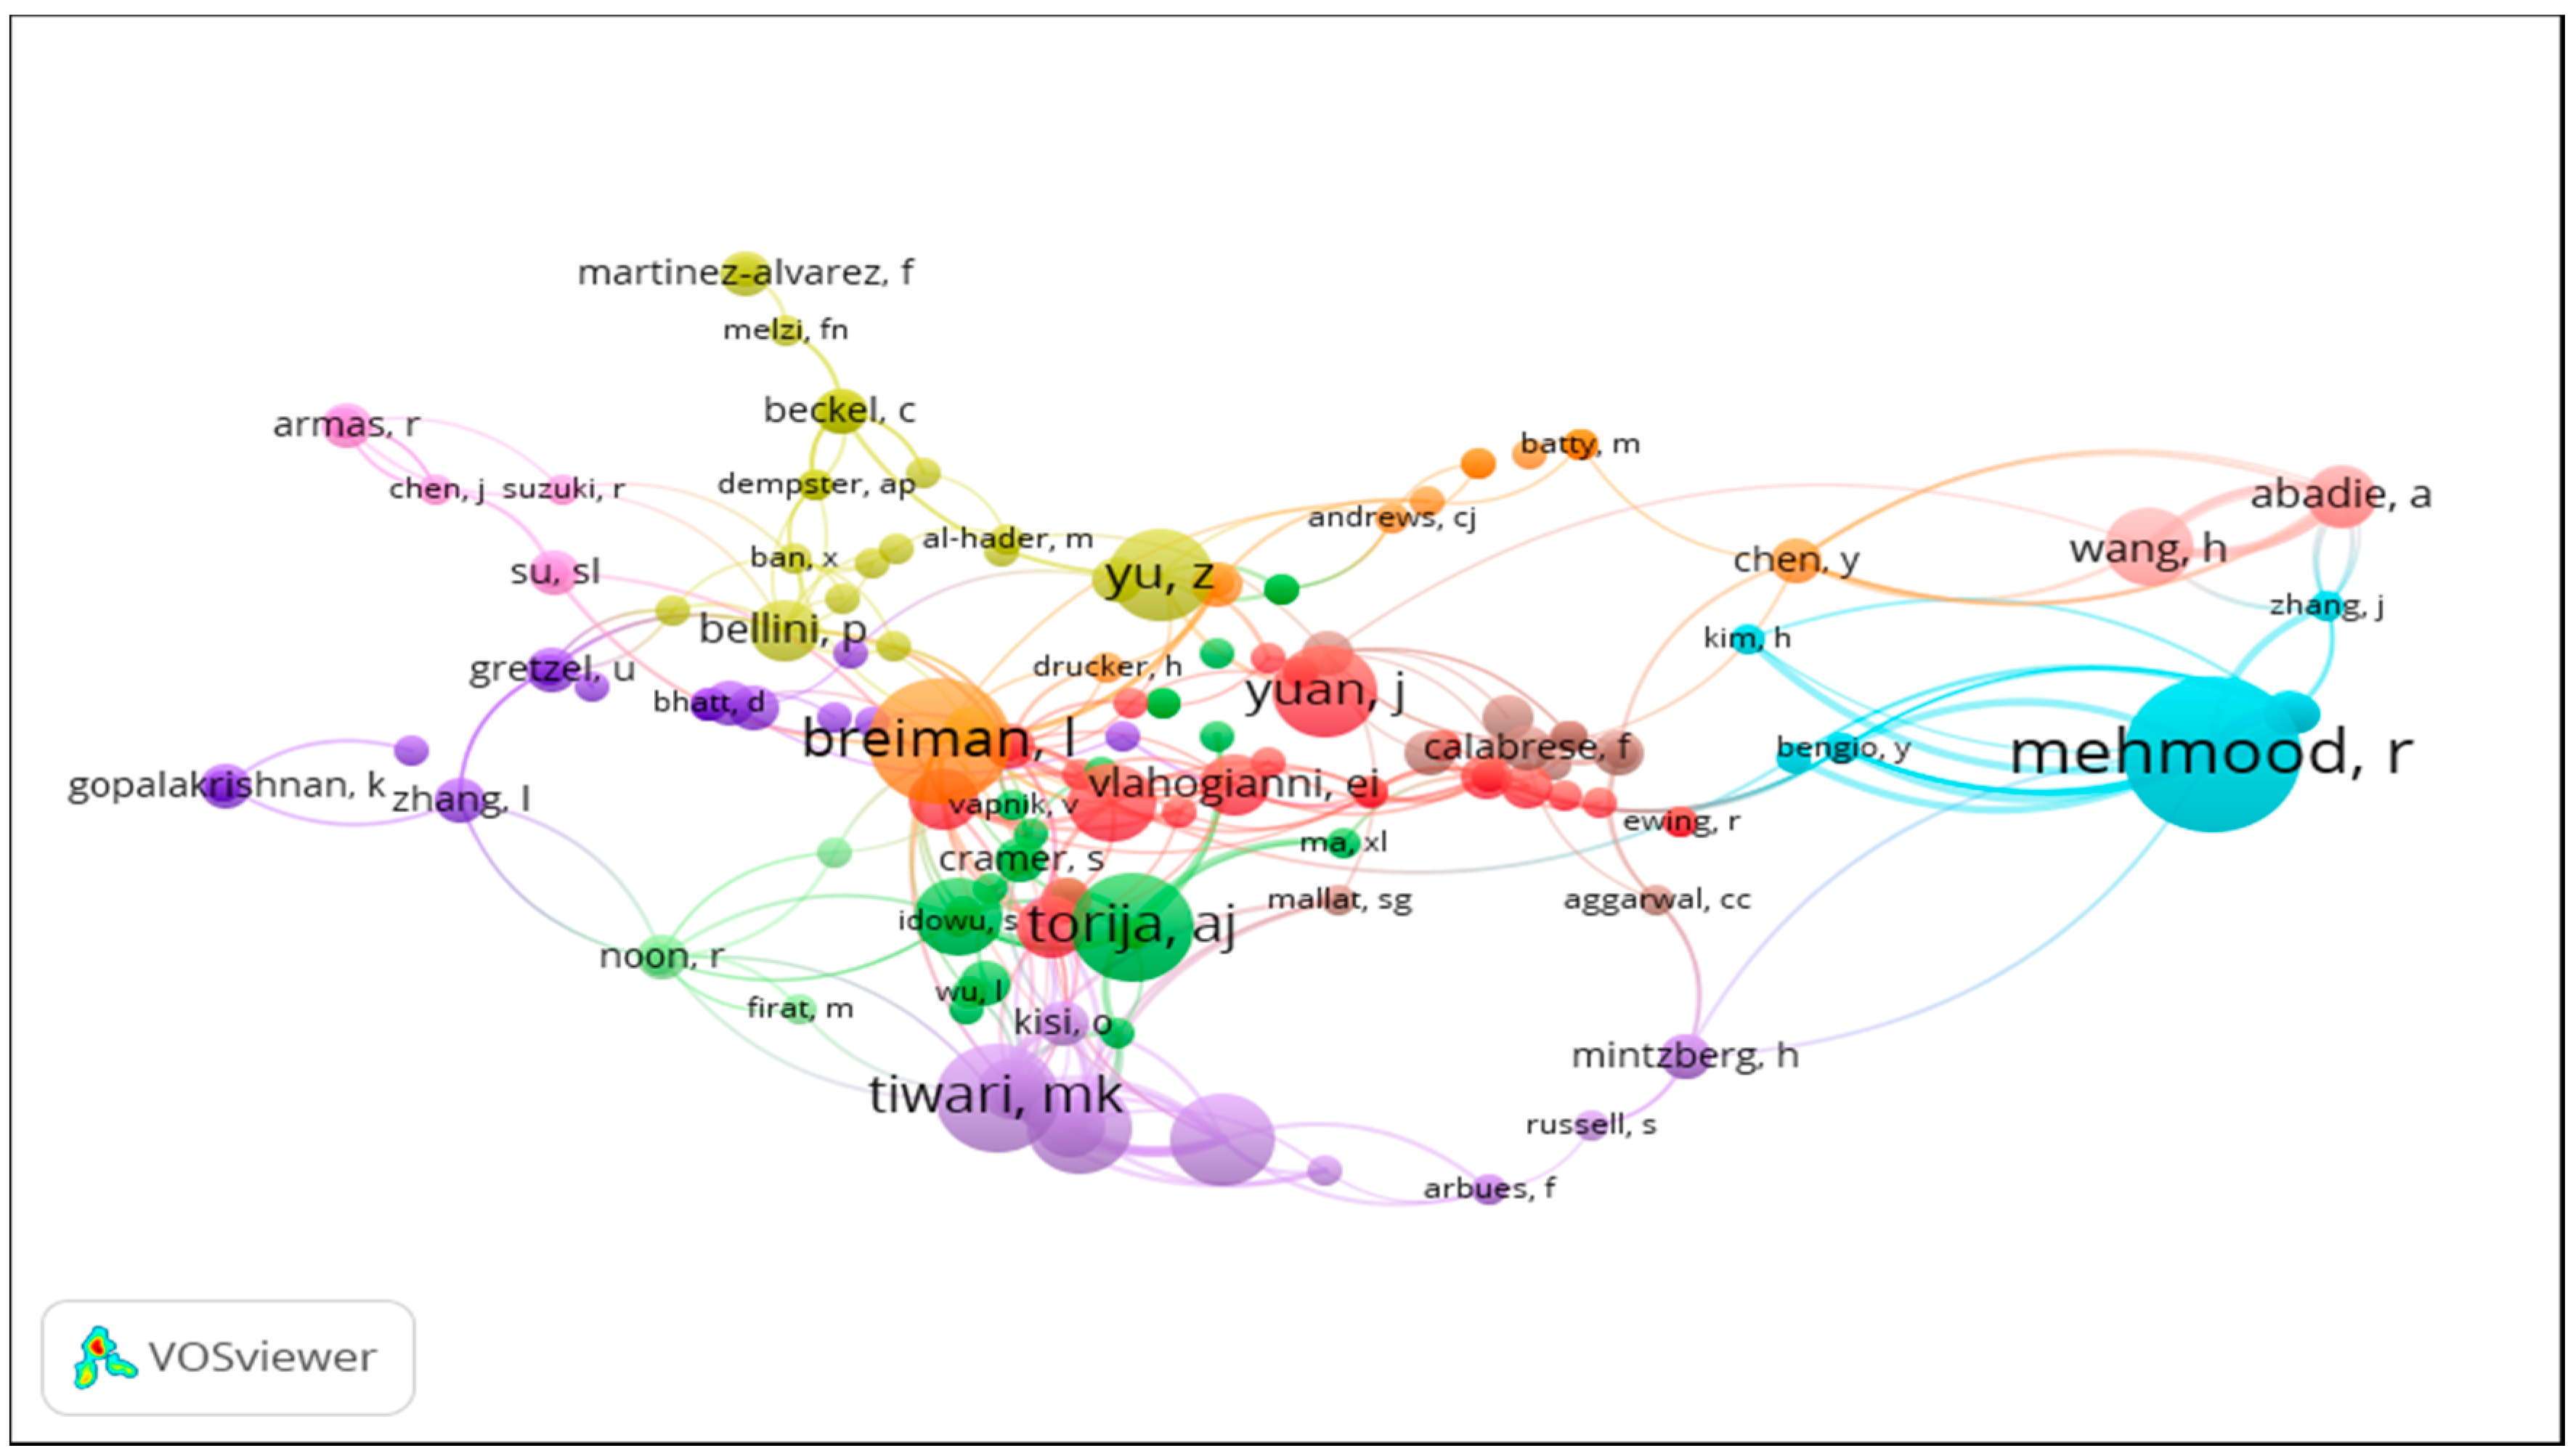
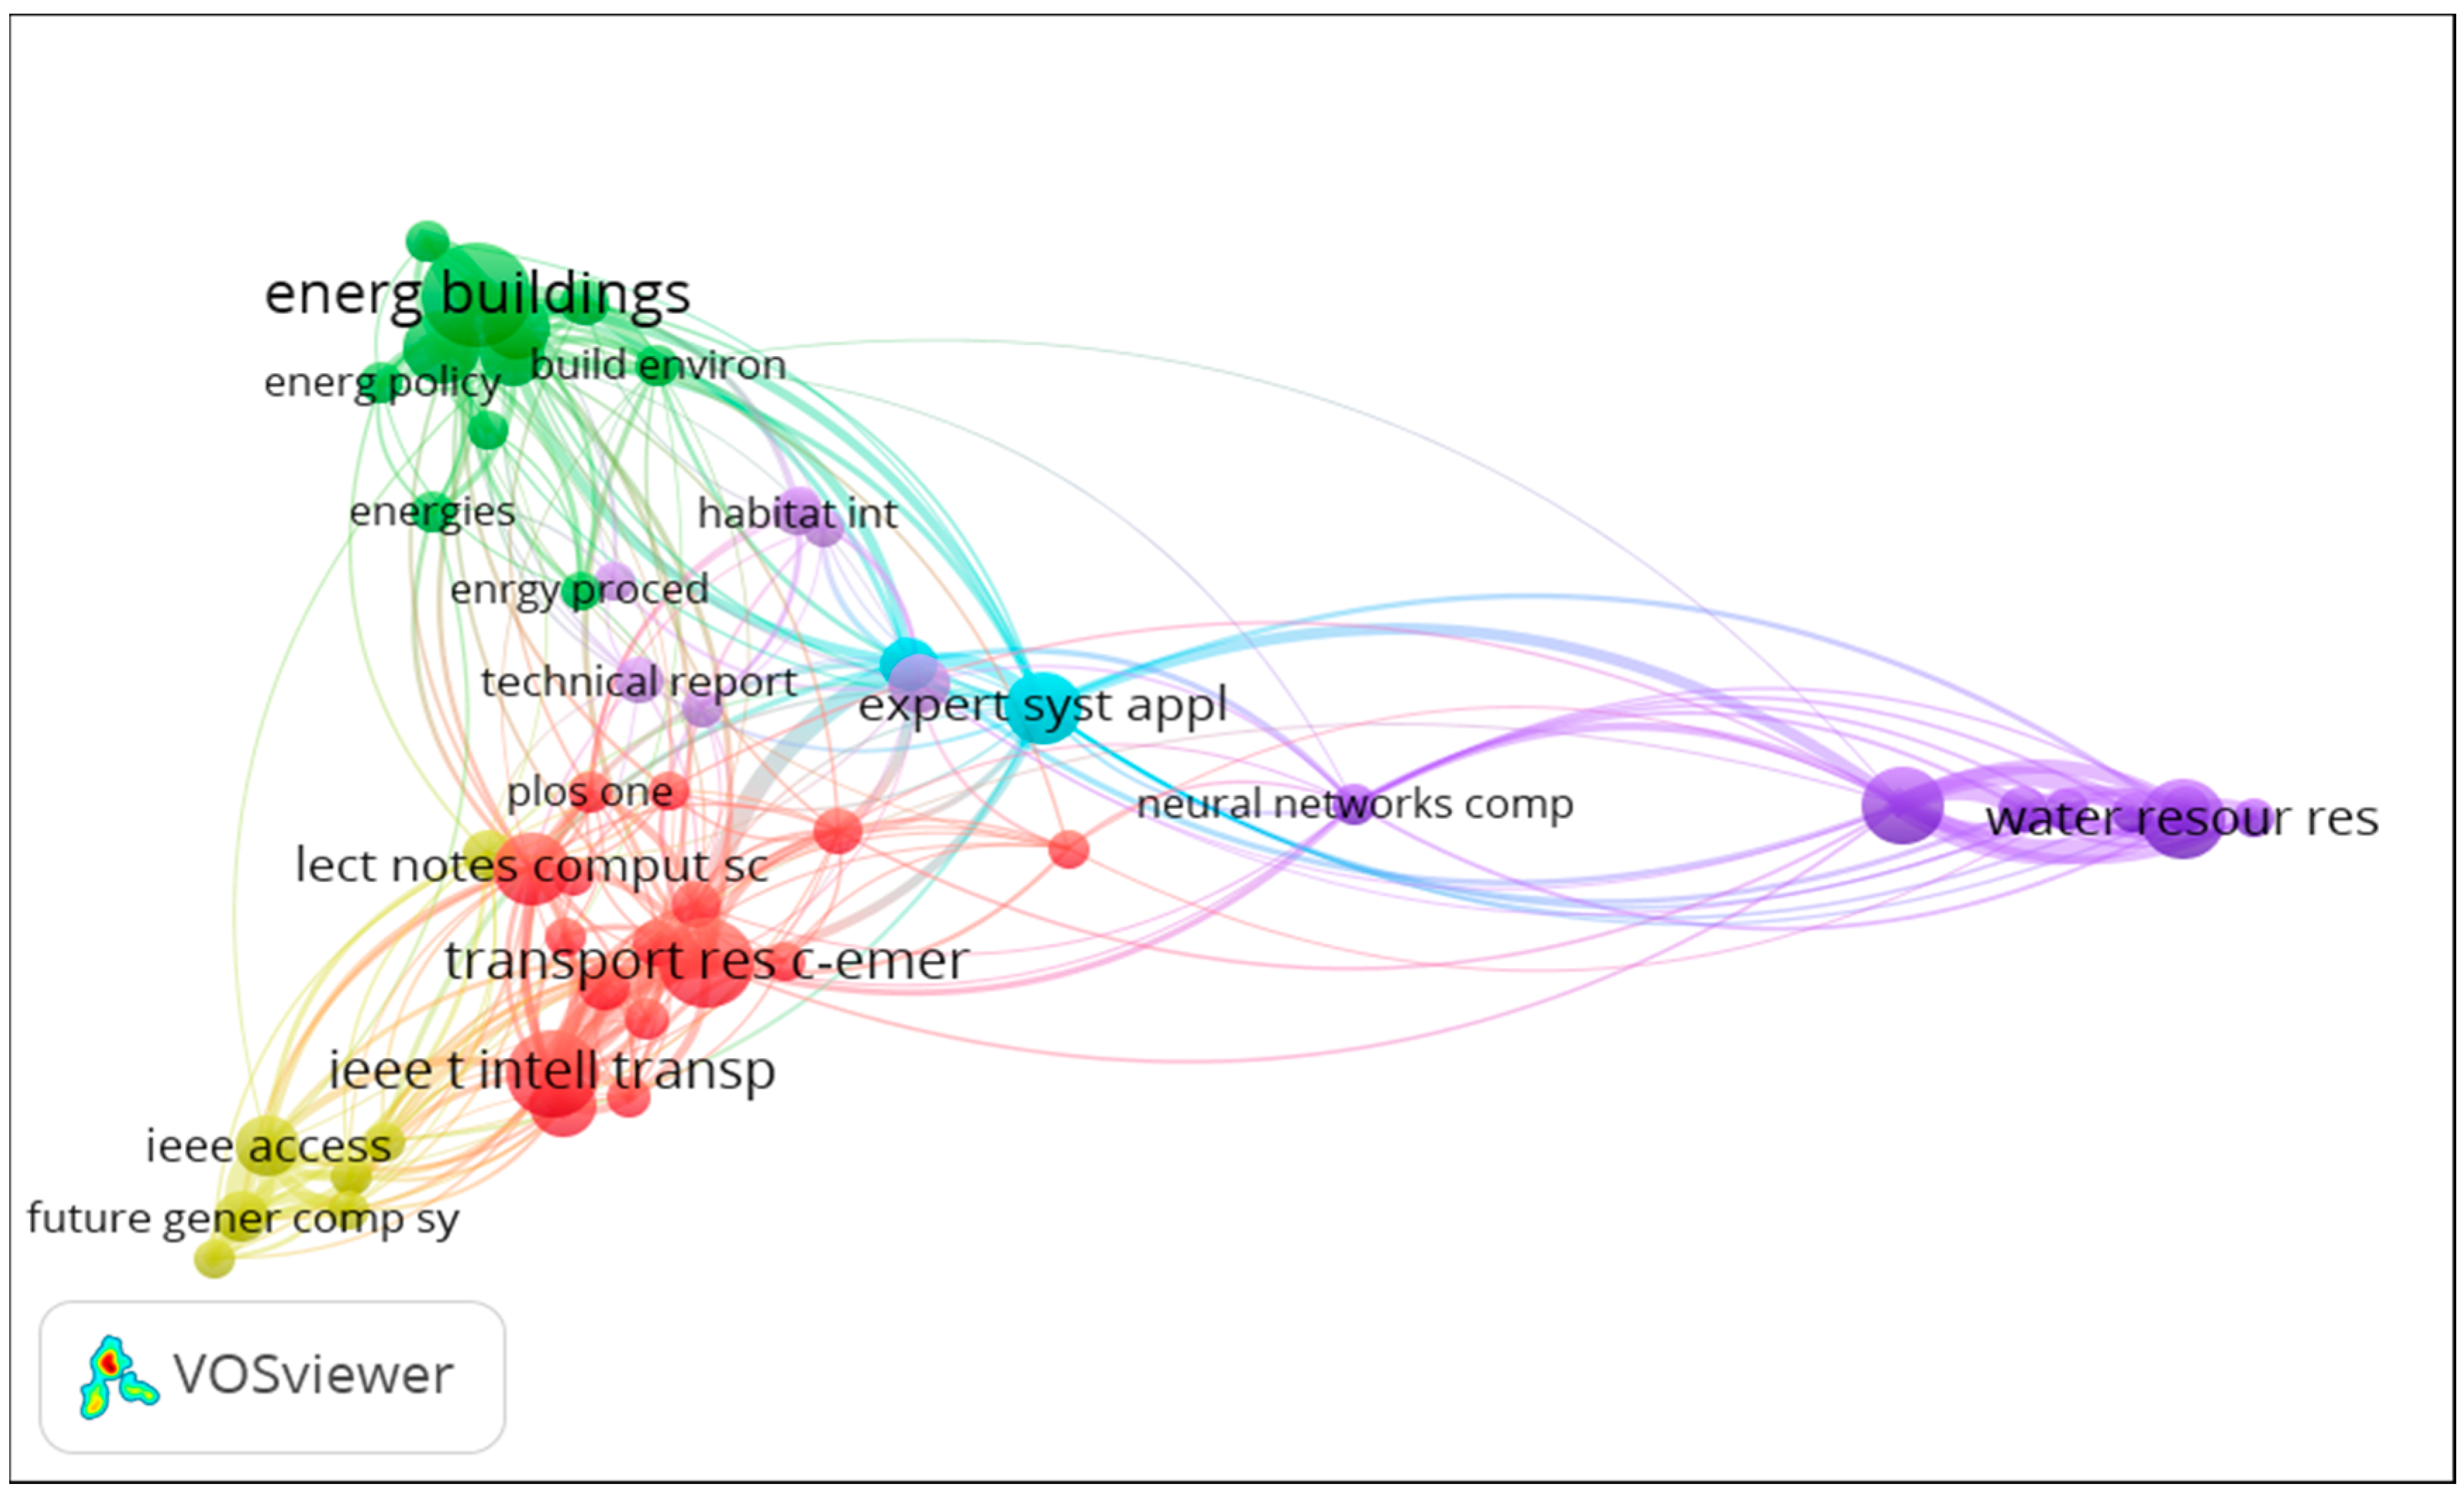
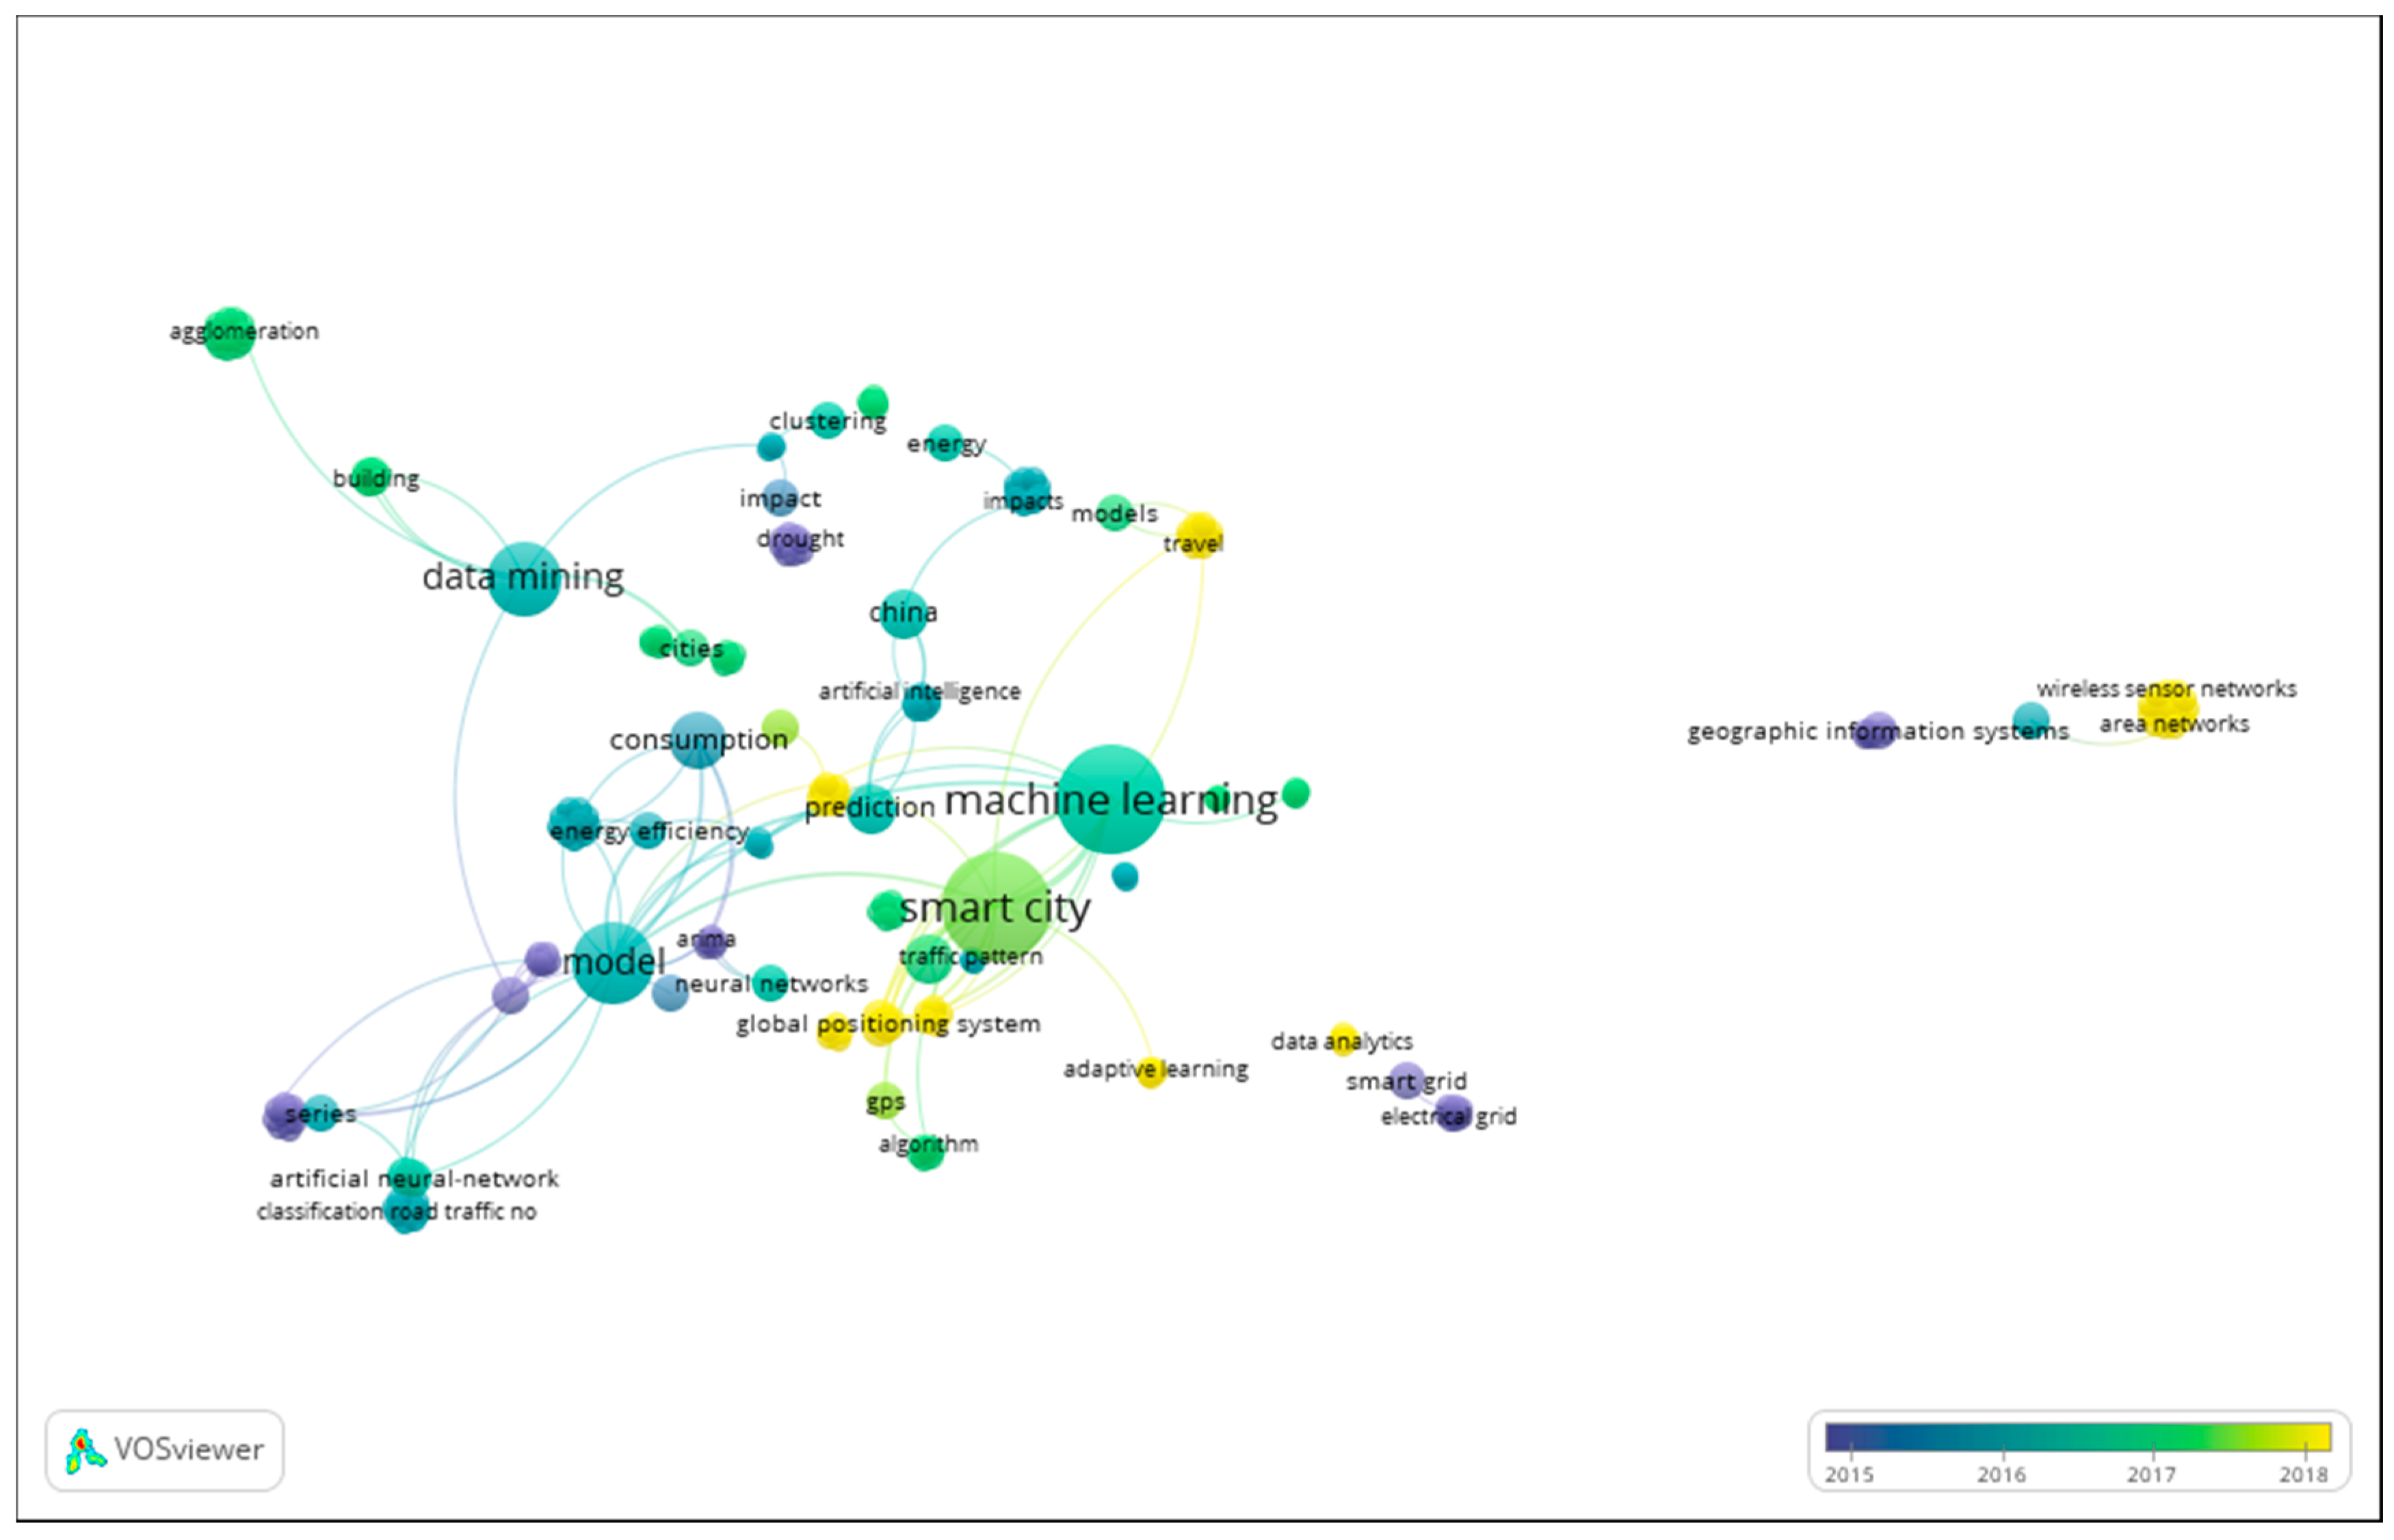
3.2. Network Analysis

Along with identifying and analyzing articles based on the above keywords, network analyses were performed on authors’ co-citations, journal co-citations, and keywords co-occurrence. These analyses were performed using VOSviewer software. The objective was to verify the behavior of the bibliometric networks for the chosen articles, investigate possible hidden information, and identify tendencies and relations of the matter in question.
The first analysis is presented in Figure 2, which shows the authors’ co-citations network according to the bibliographic portfolio.
A node represents an author; the line refers to when two authors are cited in a document; the size symbolizes the frequencies of an author, and the distance between two nodes shows the degree of similarity to the field of study of the authors [66]. Figure 2 shows the existence of 11 clusters, the main cluster being the blue one, which is led by Mehmood, in relation to the number of citations.
The second analysis refers to the journal co-citation network, which is represented by Figure 3.
In this analysis, the size of a node characterizes the number of articles published and a small distance between two journals reveals a higher frequency of citations [66]. For analysis, a minimum number of four citations of a source was used. In Figure 3, five clusters are apparent. The sources Energy and Buildings and IEEE Transactions on Intelligent Transportation Systems are the periodicals that presented the greatest number of citations.
Finally, Figure 4 illustrates the co-occurrence of keywords. For Li et al. [67], co-occurrence addresses the hotspots for research in the discipline’s fields, providing ancillary support for scientific research.
The size of the nodes and words correspond to the weights of the nodes; that is, the larger the node and the word, the greater the weight [68]. The distance between the nodes reflects the force of relationship between them. The thicker the line, the greater the co-occurrence [67,69]. It can be seen in the above figure, therefore, that the words with greater frequency and total strength of the link of the nodes were “machine learning,” “smart city,” “model,” “data mining,” “consumption,” “prediction,” “China”, and “energy efficiency”.
Through the visual maps in the bibliographic portfolio, we seek to show interesting results for the subject in question through the authors’ co-citations, journal co-citation, and keywords co-occurrence network. Analyses have shown that studies of smart cities have been enriched in recent years. The most searched keywords for the topic covered refers to predictive analytics, which confirms the analysis performed in Section 3.1. China is the country with the highest level of connection to the issue, most likely due to being the world’s largest producer of scientific articles [70] and the energy efficiency approach being a well-explored topic for smart cities. There is also a good involvement of data mining techniques for buildings. The two journals with the highest number of co-citations were determined by the importance of the techniques with regard to energy consumption (environment) and also intelligence in urban transport (mobility).

4. Conclusions

The present work sought to contribute to the identification of data mining and machine learning techniques as well as to present the areas that were most engaged in the promotion of smart cities for this theme. For this, the Methodi Ordinatio and the Web of Science and Scopus databases were used. This review consisted of literature published between 2000 and 2018. A thorough selection of articles to compose the bibliographic portfolio was necessary, since there are not many papers available that address the three keywords (SC, DM and ML) together.
The most-frequently used technique was predictive analytics. This is probably due to the fact that predictive analytics can be used in different scenarios, are easy to interpret, and return reliable results. These studies focused more on the areas of smart mobility and the smart environment, with few studies addressing smart people, smart governance, and smart economies, whose areas are primordial if cities want to prosper in the future. Cities need to have people who are prepared to consciously manage their environment and good management is always measured in the way it involves its citizens. It is also noted that the studies encompassed only specific areas of the city, and studies on smart cities have only recently begun to be explored. The analyses also showed that China is the country with the highest level of connection. Approaches involving energy efficiency and intelligence in urban transport have also been outstanding for this theme.
Finally, it is important to highlight that, independent of the analyzed sector, the selection of an adequate technique is essential to understand the generated information and to ensure competent decisions are made. Thus, we seek to present some of these techniques in order to help government agencies and companies to develop smarter cities and to assist the application of the Sustainable Development Goals, which include all factors that promote the well-being of citizens.
This study can therefore contribute to serving as a basis to stimulate research on the real impacts that computational methods, more specifically DM and ML methods, can generate for the development of smart cities and to showing the urge to deepen studies about practices that develop smarter people, governments, and economies. These areas must be carefully analyzed.
Future studies could deeply analyze each classification of the concept of smart cities, especially the least-used classifications. The DM and ML techniques mentioned in the present study can be analyzed more specifically. One suggestion would be to create models to perform predictive functions in all areas related to smart cities. Analysis should specifically focus on the other, lesser used areas (people, governance, and economy), or all these aspects together. In short, there are several research opportunities open to future researchers, especially due to the fact that this is a growing field of research.

Author Contributions

J.T.d.S. and A.C.d.F. conceptualized the study. J.T.d.S., A.C.d.F., G.F.d.P. assisted in the methodology. J.T.d.S worked with the software. Analysis was executed by J.T.d.S., C.M.P., and G.F.d.P. Validation was done by J.T.d.S., A.C.d.F., C.M.P., and G.F.d.P. The original draft was written by J.T.d.S. and A.C.d.F. Review and editing were done by J.T.d.S., C.M.P., and G.F.d.P. All the authors read and approved the final manuscript.

Funding

The present study was developed under the financial support of the Fundação Araucária Paraná/Brazil, the Coordination of Improvement of Higher Education Personnel (CAPES), and the National Council for Scientific and Technological Development (CNPq).

Conflicts of Interest

The authors declare no conflict of interest.

References

  1. United Nations. World Urbanization Prospects: The 2018 Revision. 2018. Available online: https://esa.un.org/unpd/wup/Publications/Files/WUP2018-KeyFacts.pdf (accessed on 26 November 2018).
  2. Bibri, S.E.; Krogstie, J. Smart sustainable cities of the future: An extensive interdisciplinary literature review. Sustain. Cities Soc. 2017, 31, 183–212. [Google Scholar] [CrossRef]
  3. Mattoni, B.; Gugliermetti, F.; Bisegna, F. A multilevel method to assess and design the renovation and integration of Smart Cities. Sustain. Cities Soc. 2015, 15, 105–119. [Google Scholar] [CrossRef]
  4. Pinheiro, E.; de Francisco, A.C.; Piekarski, C.M.; de Souza, J.T. How to identify opportunities for improvement in the use of reverse logistics in clothing industries? A case study in a Brazilian cluster. J. Clean. Prod. 2019, 210, 612–619. [Google Scholar] [CrossRef]
  5. Novotný, R.; Kuchta, R.K.J. Smart City Concept, Applications and Services. J. Telecommun. Syst. Manag. 2014, 3, 1. [Google Scholar]
  6. Myeong, S.; Jung, Y.; Lee, E. A Study on Determinant Factors in Smart City Development: An Analytic Hierarchy Process Analysis. Sustainability 2018, 10, 2606. [Google Scholar] [CrossRef]
  7. Albino, V.; Berardi, U.; Dangelico, R. Smart Cities: Definitions, Dimensions, Performance, and Initiatives. J. Urban Technol. 2015, 22, 3–21. [Google Scholar] [CrossRef]
  8. Abella, A.; Ortiz-de-Urbina-Criado, M.; De-Pablos-Heredero, C. A model for the analysis of data-driven innovation and value generation in smart cities’ ecosystems. Cities 2017, 64, 47–53. [Google Scholar] [CrossRef]
  9. Marsal-Llacuna, M.-L.; Colomer-Llinàs, J.; Meléndez-Frigola, J. Lessons in urban monitoring taken from sustainable and livable cities to better address the Smart Cities initiative. Technol. Forecast. Soc. Chang. 2015, 90, 611–622. [Google Scholar] [CrossRef]
  10. Giffinger, R.; Fertner, C.; Kramar, H.; Kalasek, R.; Milanović, N.; Meijers, E. Smart Cities—Ranking of European Medium-Sized Cities; Vienna UT: Wien, Austria, 2007. [Google Scholar]
  11. Iker, Z.; Alessandro, S.; Saioa, A. Smart City Concept: What It Is and What It Should Be. J. Urban Plan. Dev. 2016, 142, 4015005. [Google Scholar]
  12. Wu, Y.; Zhang, W.; Shen, J.; Mo, Z.; Peng, Y. Smart city with Chinese characteristics against the background of big data: Idea, action and risk. J. Clean. Prod. 2018, 173, 60–66. [Google Scholar] [CrossRef]
  13. Lim, C.; Kim, K.-J.; Maglio, P.P. Smart cities with big data: Reference models, challenges, and considerations. Cities 2018, 82, 86–99. [Google Scholar] [CrossRef]
  14. Honarvar, A.R.; Sami, A. Towards Sustainable Smart City by Particulate Matter Prediction Using Urban Big Data, Excluding Expensive Air Pollution Infrastructures. Big Data Res. 2018. [Google Scholar] [CrossRef]
  15. Wenge, R.; Zhang, X.; Dave, C.; Chao, L.; Hao, S. Smart city architecture: A technology guide for implementation and design challenges. China Commun. 2014, 11, 56–69. [Google Scholar] [CrossRef]
  16. Kitchin, R. The real-time city? Big data and smart urbanism. GeoJournal 2014, 79, 1–14. [Google Scholar] [CrossRef]
  17. Rousseau, D.M. The Oxford Handbook of Evidence-Based Management; Oxford University Press: Oxford, UK, 2012; ISBN 9780199763986. [Google Scholar]
  18. ten Ham-Baloyi, W.; Jordan, P. Systematic review as a research method in post-graduate nursing education. Heal. SA Gesondheid 2016, 21, 120–128. [Google Scholar] [CrossRef] [Green Version]
  19. Barros, M.V.; Piekarski, C.M.; de Francisco, A.C. Carbon Footprint of Electricity Generation in Brazil: An Analysis of the 2016–2026 Period. Energies 2018, 11, 1412. [Google Scholar] [CrossRef]
  20. Pagani, R.; Kovaleski, J.; Resende, L. Methodi Ordinatio: A proposed methodology to select and rank relevant scientific papers encompassing the impact factor, number of citation, and year of publication. Scientometrics 2015, 104, 1–27. [Google Scholar] [CrossRef]
  21. van Eck, N.J.; Waltman, L. Software survey: VOSviewer, a computer program for bibliometric mapping. Scientometrics 2010, 84, 523–538. [Google Scholar] [CrossRef]
  22. Yuan, J.; Zheng, Y.; Xie, X.; Sun, G. T-Drive: Enhancing Driving Directions with Taxi Drivers’ Intelligence. IEEE Trans. Knowl. Data Eng. 2013, 25, 220–232. [Google Scholar] [CrossRef]
  23. Rudin, C.; Waltz, D.; Anderson, R.; Boulanger, A.; Salleb-Aouissi, A.; Chow, M.; Dutta, H.; Gross, P.; Huang, B.; Ierome, S.; et al. Machine learning for the New York City power grid. IEEE Trans. Pattern Anal. Mach. Intell. 2012, 34, 328–345. [Google Scholar] [CrossRef]
  24. Jurado, S.; Nebot, A.; Mugica, F.; Avellana, N. Hybrid methodologies for electricity load forecasting: Entropy-based feature selection with machine learning and soft computing techniques. Energy 2015, 86, 276–291. [Google Scholar] [CrossRef] [Green Version]
  25. Pérez-Chacón, R.; Luna-Romera, J.M.; Troncoso, A.; Martínez-Alvarez, F.; Riquelme, J.C. Big data analytics for discovering electricity consumption patterns in smart cities. Energies 2018, 11, 683. [Google Scholar] [CrossRef]
  26. Peña, M.; Biscarri, F.; Guerrero, J.I.; Monedero, I.; León, C. Rule-based system to detect energy efficiency anomalies in smart buildings, a data mining approach. Expert Syst. Appl. 2016, 56, 242–255. [Google Scholar] [CrossRef]
  27. Liu, L.; Silva, E.A.; Wu, C.; Wang, H. A machine learning-based method for the large-scale evaluation of the qualities of the urban environment. Comput. Environ. Urban Syst. 2017, 65, 113–125. [Google Scholar] [CrossRef]
  28. Muhammed, T.; Mehmood, R.; Albeshri, A.; Katib, I. UbeHealth: A Personalized Ubiquitous Cloud and Edge-Enabled Networked Healthcare System for Smart Cities. IEEE Access 2018, 6, 32258–32285. [Google Scholar] [CrossRef]
  29. Massana, J.; Pous, C.; Melendez, J.; Colomer, J. Identifying services for short-term load forecasting using data driven models in a Smart City platform. Sustain. Cities Soc. 2017, 28, 108–117. [Google Scholar] [CrossRef]
  30. Wang, X.; Li, Z.; Meng, H.; Wu, J. Identification of key energy efficiency drivers through global city benchmarking: A data driven approach. Appl. Energy 2017, 190, 18–28. [Google Scholar] [CrossRef]
  31. Abbasi, M.; El Hanandeh, A. Forecasting municipal solid waste generation using artificial intelligence modelling approaches. Waste Manag. 2016, 56, 13–22. [Google Scholar] [CrossRef]
  32. Badii, C.; Nesi, P.; Paoli, I. Predicting Available Parking Slots on Critical and Regular Services by Exploiting a Range of Open Data. IEEE Access 2018, 6, 44059–44071. [Google Scholar] [CrossRef]
  33. Madu, C.N.; Kuei, C.; Lee, P. Urban sustainability management: A deep learning perspective. Sustain. Cities Soc. 2017, 30, 1–17. [Google Scholar] [CrossRef]
  34. Gomede, E.; Gaffo, F.H.; Brigano, G.U.; de Barros, R.M.; de Mendes, L.S. Application of Computational Intelligence to Improve Education in Smart Cities. Sensors 2018, 18, 267. [Google Scholar] [CrossRef] [PubMed]
  35. Cramer, S.; Kampouridis, M.; Freitas, A.A.; Alexandridis, A.K. An extensive evaluation of seven machine learning methods for rainfall prediction in weather derivatives. Expert Syst. Appl. 2017, 85, 169–181. [Google Scholar] [CrossRef] [Green Version]
  36. You, H.; Yang, X. Urban expansion in 30 megacities of China: Categorizing the driving force profiles to inform the urbanization policy. Land Use Policy 2017, 68, 531–551. [Google Scholar] [CrossRef]
  37. Nagy, A.M.; Simon, V. Survey on traffic prediction in smart cities. Pervasive Mob. Comput. 2018, 50, 148–163. [Google Scholar] [CrossRef]
  38. Belhajem, I.; Ben Maissa, Y.; Tamtaoui, A. Improving Vehicle Localization in a Smart City with Low Cost Sensor Networks and Support Vector Machines. Mob. Netw. Appl. 2018, 23, 854–863. [Google Scholar] [CrossRef]
  39. Fernández-Ares, A.; Mora, A.M.; Arenas, M.G.; García-Sanchez, P.; Romero, G.; Rivas, V.; Castillo, P.A.; Merelo, J.J.; Fernandez-Ares, A.; Mora, A.M.; et al. Studying real traffic and mobility scenarios for a Smart City using a new monitoring and tracking system. Future Gener. Comput. Syst. 2017, 76, 163–179. [Google Scholar] [CrossRef]
  40. Belhajem, I.; Ben Maissa, Y.; Tamtaoui, A. Improving low cost sensor based vehicle positioning with Machine Learning. Control Eng. Pract. 2018, 74, 168–176. [Google Scholar] [CrossRef]
  41. Gopalakrishnan, K. Deep Learning in Data-Driven Pavement Image Analysis and Automated Distress Detection: A Review. Data 2018, 3, 28. [Google Scholar] [CrossRef]
  42. Khan, M.S.; Woo, M.; Nam, K.; Chathoth, P.K. Smart City and Smart Tourism: A Case of Dubai. Sustainability 2017, 9, 2279. [Google Scholar] [CrossRef]
  43. Idowu, S.; Saguna, S.; Ahlund, C.; Schelen, O. Applied machine learning: Forecasting heat load in district heating system. Energy Build. 2016, 133, 478–488. [Google Scholar] [CrossRef]
  44. Bellini, P.; Cenni, D.; Nesi, P.; Paoli, I. Wi-Fi based city users’ behaviour analysis for smart city. J. Vis. Lang. Comput. 2017, 42, 31–45. [Google Scholar] [CrossRef] [Green Version]
  45. Tiwari, M.K.; Adamowski, J.F. Medium-Term Urban Water Demand Forecasting with Limited Data Using an Ensemble Wavelet-Bootstrap Machine-Learning Approach. J. Water Resour. Plan. Manag. 2015, 141, 04014053. [Google Scholar] [CrossRef]
  46. Melzi, F.N.; Same, A.; Zayani, M.H.; Oukhellou, L. A Dedicated Mixture Model for Clustering Smart Meter Data: Identification and Analysis of Electricity Consumption Behaviors. Energies 2017, 10, 1446. [Google Scholar] [CrossRef]
  47. Brentan, B.M.; Meirelles, G.; Herrera, M.; Luvizotto, E., Jr.; Izquierdo, J. Correlation Analysis of Water Demand and Predictive Variables for Short-Term Forecasting Models. Math. Probl. Eng. 2017. [Google Scholar] [CrossRef]
  48. Kwoczek, S.; Di Martino, S.; Nejdl, W. Predicting and visualizing traffic congestion in the presence of planned special events. J. Vis. Lang. Comput. 2014, 25, 973–980. [Google Scholar] [CrossRef]
  49. Torija, A.J.; Ruiz, D.P. Automated classification of urban locations for environmental noise impact assessment on the basis of road-traffic content. Expert Syst. Appl. 2016, 53, 1–13. [Google Scholar] [CrossRef] [Green Version]
  50. Armas, R.; Aguirre, H.; Daolio, F.; Tanaka, K. Evolutionary design optimization of traffic signals applied to Quito city. PLoS ONE 2017, 12. [Google Scholar] [CrossRef] [PubMed]
  51. Zhang, N.; Chen, H.; Chen, X.; Chen, J. Forecasting Public Transit Use by Crowdsensing and Semantic Trajectory Mining: Case Studies. ISPRS Int. J. Geo-Inf. 2016, 5, 180. [Google Scholar] [CrossRef]
  52. Del Busto Pinzon, D.F.; de Souza, F.T. A data based model as a metropolitan management tool: The Bogota-Sabana region case study in Colombia. Land Use Policy 2016, 54, 253–263. [Google Scholar] [CrossRef]
  53. Zheng, Y.; Zheng, H.; Ye, X. Using Machine Learning in Environmental Tax Reform Assessment for Sustainable Development: A Case Study of Hubei Province, China. Sustainability 2016, 8, 1124. [Google Scholar] [CrossRef]
  54. Pinelli, F.; Calabrese, F.; Bouillet, E. A Methodology for Denoising and Generating Bus Infrastructure Data. IEEE Trans. Intell. Transp. Syst. 2015, 16, 1042–1047. [Google Scholar] [CrossRef]
  55. Liu, Y.; Zhao, J.; Wang, Z. Identifying determinants of urban water use using data mining approach. Urban Water J. 2015, 12, 618–630. [Google Scholar] [CrossRef]
  56. Kuang, W.; An, S.; Jiang, H. Detecting Traffic Anomalies in Urban Areas Using Taxi GPS Data. Math. Probl. Eng. 2015. [Google Scholar] [CrossRef]
  57. Kosmides, P.; Adamopoulou, E.; Demestichas, K.; Theologou, M.; Anagnostou, M.; Rouskas, A. Socially Aware Heterogeneous Wireless Networks. Sensors 2015, 15, 13705–13724. [Google Scholar] [CrossRef] [PubMed] [Green Version]
  58. Liu, S.; Chen, L.; Ni, L.M. Anomaly Detection from Incomplete Data. ACM Trans. Knowl. Discov. Data 2014, 9. [Google Scholar] [CrossRef]
  59. Wang, Y.; Zou, Z. Spatial Decision Support System for Urban Planning: Case Study of Harbin City in China. J. Urban Plan. Dev. 2010, 136, 147–153. [Google Scholar] [CrossRef]
  60. Zhuang, P.; Shang, Y.; Hua, B. Statistical methods to estimate vehicle count using traffic cameras. Multidimens. Syst. Signal Process. 2009, 20, 121–133. [Google Scholar] [CrossRef]
  61. Visvizi, A.; Lytras, M.D.; Damiani, E.; Mathkour, H. Policy making for smart cities: Innovation and social inclusive economic growth for sustainability. J. Sci. Technol. Policy Manag. 2018, 9, 126–133. [Google Scholar] [CrossRef]
  62. Jin, Y.; Cao, W.; Wu, M.; Yuan, Y. Accurate fuzzy predictive models through complexity reduction based on decision of needed fuzzy rules. Neurocomputing 2019, 323, 344–351. [Google Scholar] [CrossRef]
  63. Al Nuaimi, E.; Al Neyadi, H.; Mohamed, N.; Al-Jaroodi, J. Applications of big data to smart cities. J. Internet Serv. Appl. 2015, 6, 25. [Google Scholar] [CrossRef]
  64. Lytras, M.; Raghavan, V.; Damiani, E. Big Data and Data Analytics Research:: From Metaphors to Value Space for Collective Wisdom in Human Decision Making and Smart Machines. Int. J. Semant. Web Inf. Syst. 2017, 13, 1–10. [Google Scholar] [CrossRef]
  65. Lytras, M.; Aljohani, N.; Hussain, A.; Luo, J.; Xi Zhang, J. Cognitive Computing Track Chairs’ Welcome & Organization. In Proceedings of the The Web Conference 2018, Lyon, France, 23–27 April 2018; pp. 247–250. [Google Scholar]
  66. Tang, M.; Liao, H.; Wan, Z.; Herrera-Viedma, E.; Rosen, M.A. Ten Years of Sustainability (2009 to 2018): A Bibliometric Overview. Sustainability 2018, 10, 1655. [Google Scholar] [CrossRef]
  67. Li, H.; An, H.; Wang, Y.; Huang, J.; Gao, X. Evolutionary features of academic articles co-keyword network and keywords co-occurrence network: Based on two-mode affiliation network. Phys. A Stat. Mech. Its Appl. 2016, 450, 657–669. [Google Scholar] [CrossRef]
  68. Liao, H.; Tang, M.; Luo, L.; Li, C.; Chiclana, F.; Zeng, X.-J. A Bibliometric Analysis and Visualization of Medical Big Data Research. Sustainability 2018, 10, 166. [Google Scholar] [CrossRef]
  69. Gu, D.; Li, J.; Li, X.; Liang, C. Visualizing the knowledge structure and evolution of big data research in healthcare informatics. Int. J. Med. Inform. 2017, 98, 22–32. [Google Scholar] [CrossRef] [PubMed]
  70. Tollefson, J. China declared world’s largest producer of scientific articles. Nature 2018, 553, 390. [Google Scholar] [CrossRef] [PubMed]
Figure 1. Flowchart of the literature review process.
Sustainability 11 01077 g001
Figure 2. Author co-citation network from the bibliographic portfolio.
Sustainability 11 01077 g002
Figure 3. Journal co-citation network from the bibliographic portfolio.
Sustainability 11 01077 g003
Figure 4. Keywords co-occurrence network from the bibliographic portfolio.
Sustainability 11 01077 g004
Table 1. Results from searching the Web of Science and Scopus databases.
Combination of KeywordsDatabasesTotal
Web of ScienceScopus
Group 1 AND Group 2333 search results (143 articles, 187 conference paper, and 6 editorial)458 search results (200 articles, 226 conference papers, and 32 book chapters)791
Table 2. Articles assigned by Methodi Ordinatio.
AuthorsYearTitle
Yuan et al. [22]2013T-Drive: Enhancing Driving Directions with Taxi Drivers’ Intelligence
Rudin et al. [23]2012Machine Learning for the New York City Power Grid
Jurado et al. [24]2015Hybrid methodologies for electricity load forecasting: Entropy-based feature selection with machine learning and soft computing techniques
Pérez-Chacón et al. [25]2018Big data analytics for discovering electricity consumption patterns in smart cities
Peña et al. [26]2016Rule-based system to detect energy efficiency anomalies in smart buildings, a data mining approach
Liu et al. [27]2017A machine learning-based method for the large-scale evaluation of the qualities of the urban environment
Muhammed et al. [28]2018UbeHealth: A Personalized Ubiquitous Cloud and Edge-Enabled Networked Healthcare System for Smart Cities
Massana et al. [29]2017Identifying services for short-term load forecasting using data driven models in a Smart city platform
Wang et al. [30]2017Identification of key energy efficiency drivers through global city benchmarking: a data driven approach
Abbasi and El Hanandeh [31]2016Forecasting municipal solid waste generation using artificial intelligence modelling approaches
Badii et al. [32]2018Predicting Available Parking Slots on Critical and Regular Services by Exploiting a Range of Open Data
Madu et al. [33]2017Urban sustainability management: A deep learning perspective
Gomede et al. [34]2018Application of Computational Intelligence to Improve Education in Smart Cities.
Cramer et al. [35]2017An extensive evaluation of seven machine learning methods for rainfall prediction in weather derivatives
You and Yang [36]2017Urban expansion in 30 megacities of China: categorizing the driving force profiles to inform the urbanization policy
Nagy and Simon [37]2018Survey on traffic prediction in smart cities
Belhajem et al. [38]2018Improving Vehicle Localization in a Smart City with Low Cost Sensor Networks and Support Vector Machines
Fernández-Ares et al. [39]2017Studying real traffic and mobility scenarios for a Smart City using a new monitoring and tracking system
Belhajem et al. [40]2018Improving low cost sensor based vehicle positioning with Machine Learning
Gopalakrishnan [41]2018Deep Learning in Data-Driven Pavement Image Analysis and Automated Distress Detection: A Review
Khan et al. [42]2017Smart City and Smart Tourism: A Case of Dubai
Idowu et al. [43]2016Applied machine learning: Forecasting heat load in district heating system
Bellini et al. [44]2017Wi-Fi based city users’ behaviour analysis for smart city
Tiwari and Adamowski [45]2015Medium-Term Urban Water Demand Forecasting with Limited Data Using an Ensemble Wavelet-Bootstrap Machine-Learning Approach
Melzi et al. [46]2017A Dedicated Mixture Model for Clustering Smart Meter Data: Identification and Analysis of Electricity Consumption Behaviors
Brentan et al. [47]2017Correlation Analysis of Water Demand and Predictive Variables for Short-Term Forecasting Models
Kwoczek et al. [48]2014Predicting and visualizing traffic congestion in the presence of planned special events
Torija and Ruiz [49]2016Automated classification of urban locations for environmental noise impact assessment on the basis of road-traffic content
Armas et al. [50]2017Evolutionary design optimization of traffic signals applied to Quito city
Zhang et al. [51]2016Forecasting Public Transit Use by Crowdsensing and Semantic Trajectory Mining: Case Studies
Del Busto Pinzon and Souza [52]2016A data based model as a metropolitan management tool: The Bogotá-Sabana region case study in Colombia
Zheng et al. [53]2016Using Machine Learning in Environmental Tax Reform Assessment for Sustainable Development: A Case Study of Hubei Province, China
Pinelli et al. [54]2015A Methodology for Denoising and Generating Bus Infrastructure Data
Liu et al. [55]2015Identifying determinants of urban water use using data mining approach
Kuang and Jiang [56]2014Detecting Traffic Anomalies in Urban Areas Using Taxi GPS Data
Kosmides et al. [57]2015Socially Aware Heterogeneous Wireless Networks
Liu et al. [58]2014Anomaly detection from incomplete data
Wang and Zou [59]2010Spatial Decision Support System for Urban Planning: Case Study of Harbin City in China
Zhuang et al. [60]2009Statistical methods to estimate vehicle count using traffic cameras

