Article

Cattle Production for Exports in Water-Abundant Areas: The Case of Finland

1
Water and Development Research Group, Aalto University, P.O. Box 15200, FI-00076 Aalto, Finland
2
Department of Agricultural Sciences, University of Helsinki, P.O. Box 27, FI-00014 Helsinki, Finland
3
Ruralia Institute, University of Helsinki, Lönnrotinkatu 7, FI-50100 Mikkeli, Finland
4
Faculty of Social and Business Studies, University of Eastern Finland, P.O. Box 1627, FI-70211 Kuopio, Finland
5
Finnish National Defence University, PL 7, 00861 Helsinki, Finland
*
Authors to whom correspondence should be addressed.
Sustainability 2019, 11(4), 1075; https://doi.org/10.3390/su11041075
Submission received: 17 January 2019 / Revised: 9 February 2019 / Accepted: 11 February 2019 / Published: 19 February 2019

Abstract

:
Water scarcity is a severe global threat, and it will only become more critical with a growing and wealthier population. Annually, considerable volumes of water are transferred virtually through the global food system to secure nations’ food supply and to diversify diets. Our objective is to assess, whether specializing water-intensive production for exports in areas with an abundance of natural resources, would contribute to globally resource-efficient food production. We calculated Finland’s virtual water net export potential (four scenarios) by reallocating the present underutilized agricultural land and combining that with a domestic diet change (three scenarios) to maximize the exports of cattle products. Assessed scenarios indicate that the greatest potential to net export virtual water (3.7 billion m3 year−1, 25-time increase to current) was achieved when local production was maximized with domestic and exported feed, and bovine meat consumption in Finland was replaced with a vegetarian substitute. This corresponds to annual virtual water consumption for food of about 3.6 million global citizens (assuming 1032 m3 cap−1 year−1). Therefore our results suggest, that optimizing water-intensive production to water-rich areas, has a significant impact on global water savings. In addition, increasing exports from such areas by decreasing the domestic demand for water-intensive products to meet the nutrition recommendation levels, saves water resources.

1. Introduction

The world is facing a severe dilemma—how to feed the population sustainably in the future [1,2,3]. Global population is expected to exceed 9 or even 10 billion by 2050 [4,5], and this creates a tremendous pressure to provide enough food for everyone. In many parts of the world, natural resources for food production are already scarce [6,7] and unevenly distributed, especially relative to the population.
Mekonnen and Hoekstra [8] specified that in general, the highest water scarcity occurs in areas where the population density is high or agriculture is heavily irrigated, or both—often combined with low natural water availability. Around 4 billion people are facing water scarcity for at least some time of the year [8]. On average, the global water footprint for an average consumer was around 1385 m3 cap−1 year−1, of which the water footprint related to consumption of agricultural products was 92% (total virtual water 1274 m3 cap−1 year−1, of which green and blue virtual water contribute to 1032 m3 cap−1 year−1) over the years 1996–2005 [9]. Therefore, food production is the key focus point in tackling water scarcity.
Existing studies have shown that international trade often leads to global water savings (see e.g., [10,11,12,13,14,15,16]), and thus can also be used as a measure to lower the overall pressure on natural resources. The same applies locally: A recent study by Porkka et al. [17] shows that a majority of the sub-national areas facing scarce green-blue water resources, increased their food imports to secure the local food supply. It has been estimated, that since the mid-1980s to 2009, the percentage of world food production that is internationally traded on international markets rose from 15% to 23% [18].
Use of key natural resources for food production has exceeded sustainable limits (see e.g., [6,19,20,21]). At the same time, measures, such as diet change, a reduction of food losses and a yield gap closure can, if used together, sustainably increase the global food availability by 100–200% [6,22,23]. Kummu et al. [23] found that in Europe and Northern America, among the measures mentioned above, diet change plays a key role in increasing food availability without increasing resources use. This is due to a high share of animal products in the diets, and hence these diets have several times higher resource use per unit of nutrition produced than plant-based diets (see, e.g., [24,25,26,27]).
In addition to the global overviews, there are local studies about the agricultural land use efficiency comparing the outsourced and (re)localized production to meet the domestic food demand (see e.g., for the UK, Reference [28]; Sweden, Reference [29]; USA, Reference [30]; Finland, Reference [31]). However, not much is known about an export potential of specializing water-intensive production to countries with an abundance of natural resources.
In this present study, we take a different angle to increase the understanding of food production and study the reallocation of global water resources. To the best of our knowledge, we conduct the first detailed study about the reallocating global water resources by specializing water-intensive cattle production in water-rich areas, and turning that into virtual water exports to potentially easing global water scarcity. We build scenarios based on reallocations potential in domestic land use combined with domestic diet change towards lower water intensity. We acknowledge that the global, and even local, food system forms a complex net that has multiple economic, environmental and social aspects to consider. Our study focuses on the environmental and natural resources perspectives, providing knowledge about the possibilities of reallocation that can be used as a foundation for further research focusing on, for example, economic feasibility or social acceptability.
We aim to form a better understanding of practical actions that can be done at the national level towards more sustainable global food production. Kummu and Varis [32] presented data showing that in the northern latitudes, water resources are rich and populations low. We chose Finland as our case study, since it is a typical northern country with the presented characteristics of rich water resources and low population [33,34]. Still, Finland annually imports a considerable, and increasing, amount of water-intensive products [35]. Finland’s external water footprint is 47%, and a majority of it is caused by agricultural production [36]. While importing virtual water, Finland is also outsourcing negative environmental impacts. Sandström et al. [37] discovered, that over 93% of the land use related to biodiversity impacts of Finnish supply, is external [37]. However, Finnish natural resources are underused [38], and there is potential to decrease imports of arable food crop commodities to Finland by domestic production. Sandström et al. [31] studied, that the replacement of imported rice, soybeans and rapeseed with domestic crops, would reduce embedded blue water requirement by up to 16% and green water by almost 30% of the total crop related virtual water imports [31]. As complementary to the current national studies, our research focuses on increasing Finland’s virtual water net exports related to cattle production.
We focus on cattle production for four main reasons. First, the global water footprint of bovine meat is very high with an average of 15,415 l kg−1 [39,40]. Thus, cattle production should be in close focus in redesigning food systems for water efficiency. Second, the rich freshwater resources in Finland are underused for agricultural production [41]. Third, there are agronomic and environmental needs to diversify arable land use in Finland, to which leys and pastures, as well as domestic protein feeds, would contribute positively [42]. At the moment, Finland is a net importer of bovine meat [43], although its prerequisites are met to increase domestic cattle production and to become a net exporter. Fourth, Finns consume animal products, especially red meat, beyond national [44], regional [45] and international [46] dietary recommendations. Currently, it is part of the national food policy to reduce meat-based meals by increasing the proportion of plant-based meals [47].
Therefore, we hypothesize that Finland has a potential for, and multiple benefits to be gained from, a strategic specialization to water-intensive cattle products for exports as a contribution to a globally fair share of limited water resources. Further, we hypothesize that shifting towards a more sustainable diet would increase this export potential.
After presenting the motivation for and aim of this study in Section 1, Section 2 focuses on introducing the relevant materials and methods used to test our hypothesis. Since our study focuses only on one country, we provide the main benefits and limitations for cattle production in Finland already at the beginning of the paper. In Section 3, we present how our scenarios would impact the land use in Finland and abroad, and the potential for Finland to export virtual water. We then discuss the benefits and disadvantages of cattle production in Finnish and global contexts in Section 4. We also acknowledge the limitations of our study while making suggestions for future studies. Finally, we draw our conclusions in Section 5.

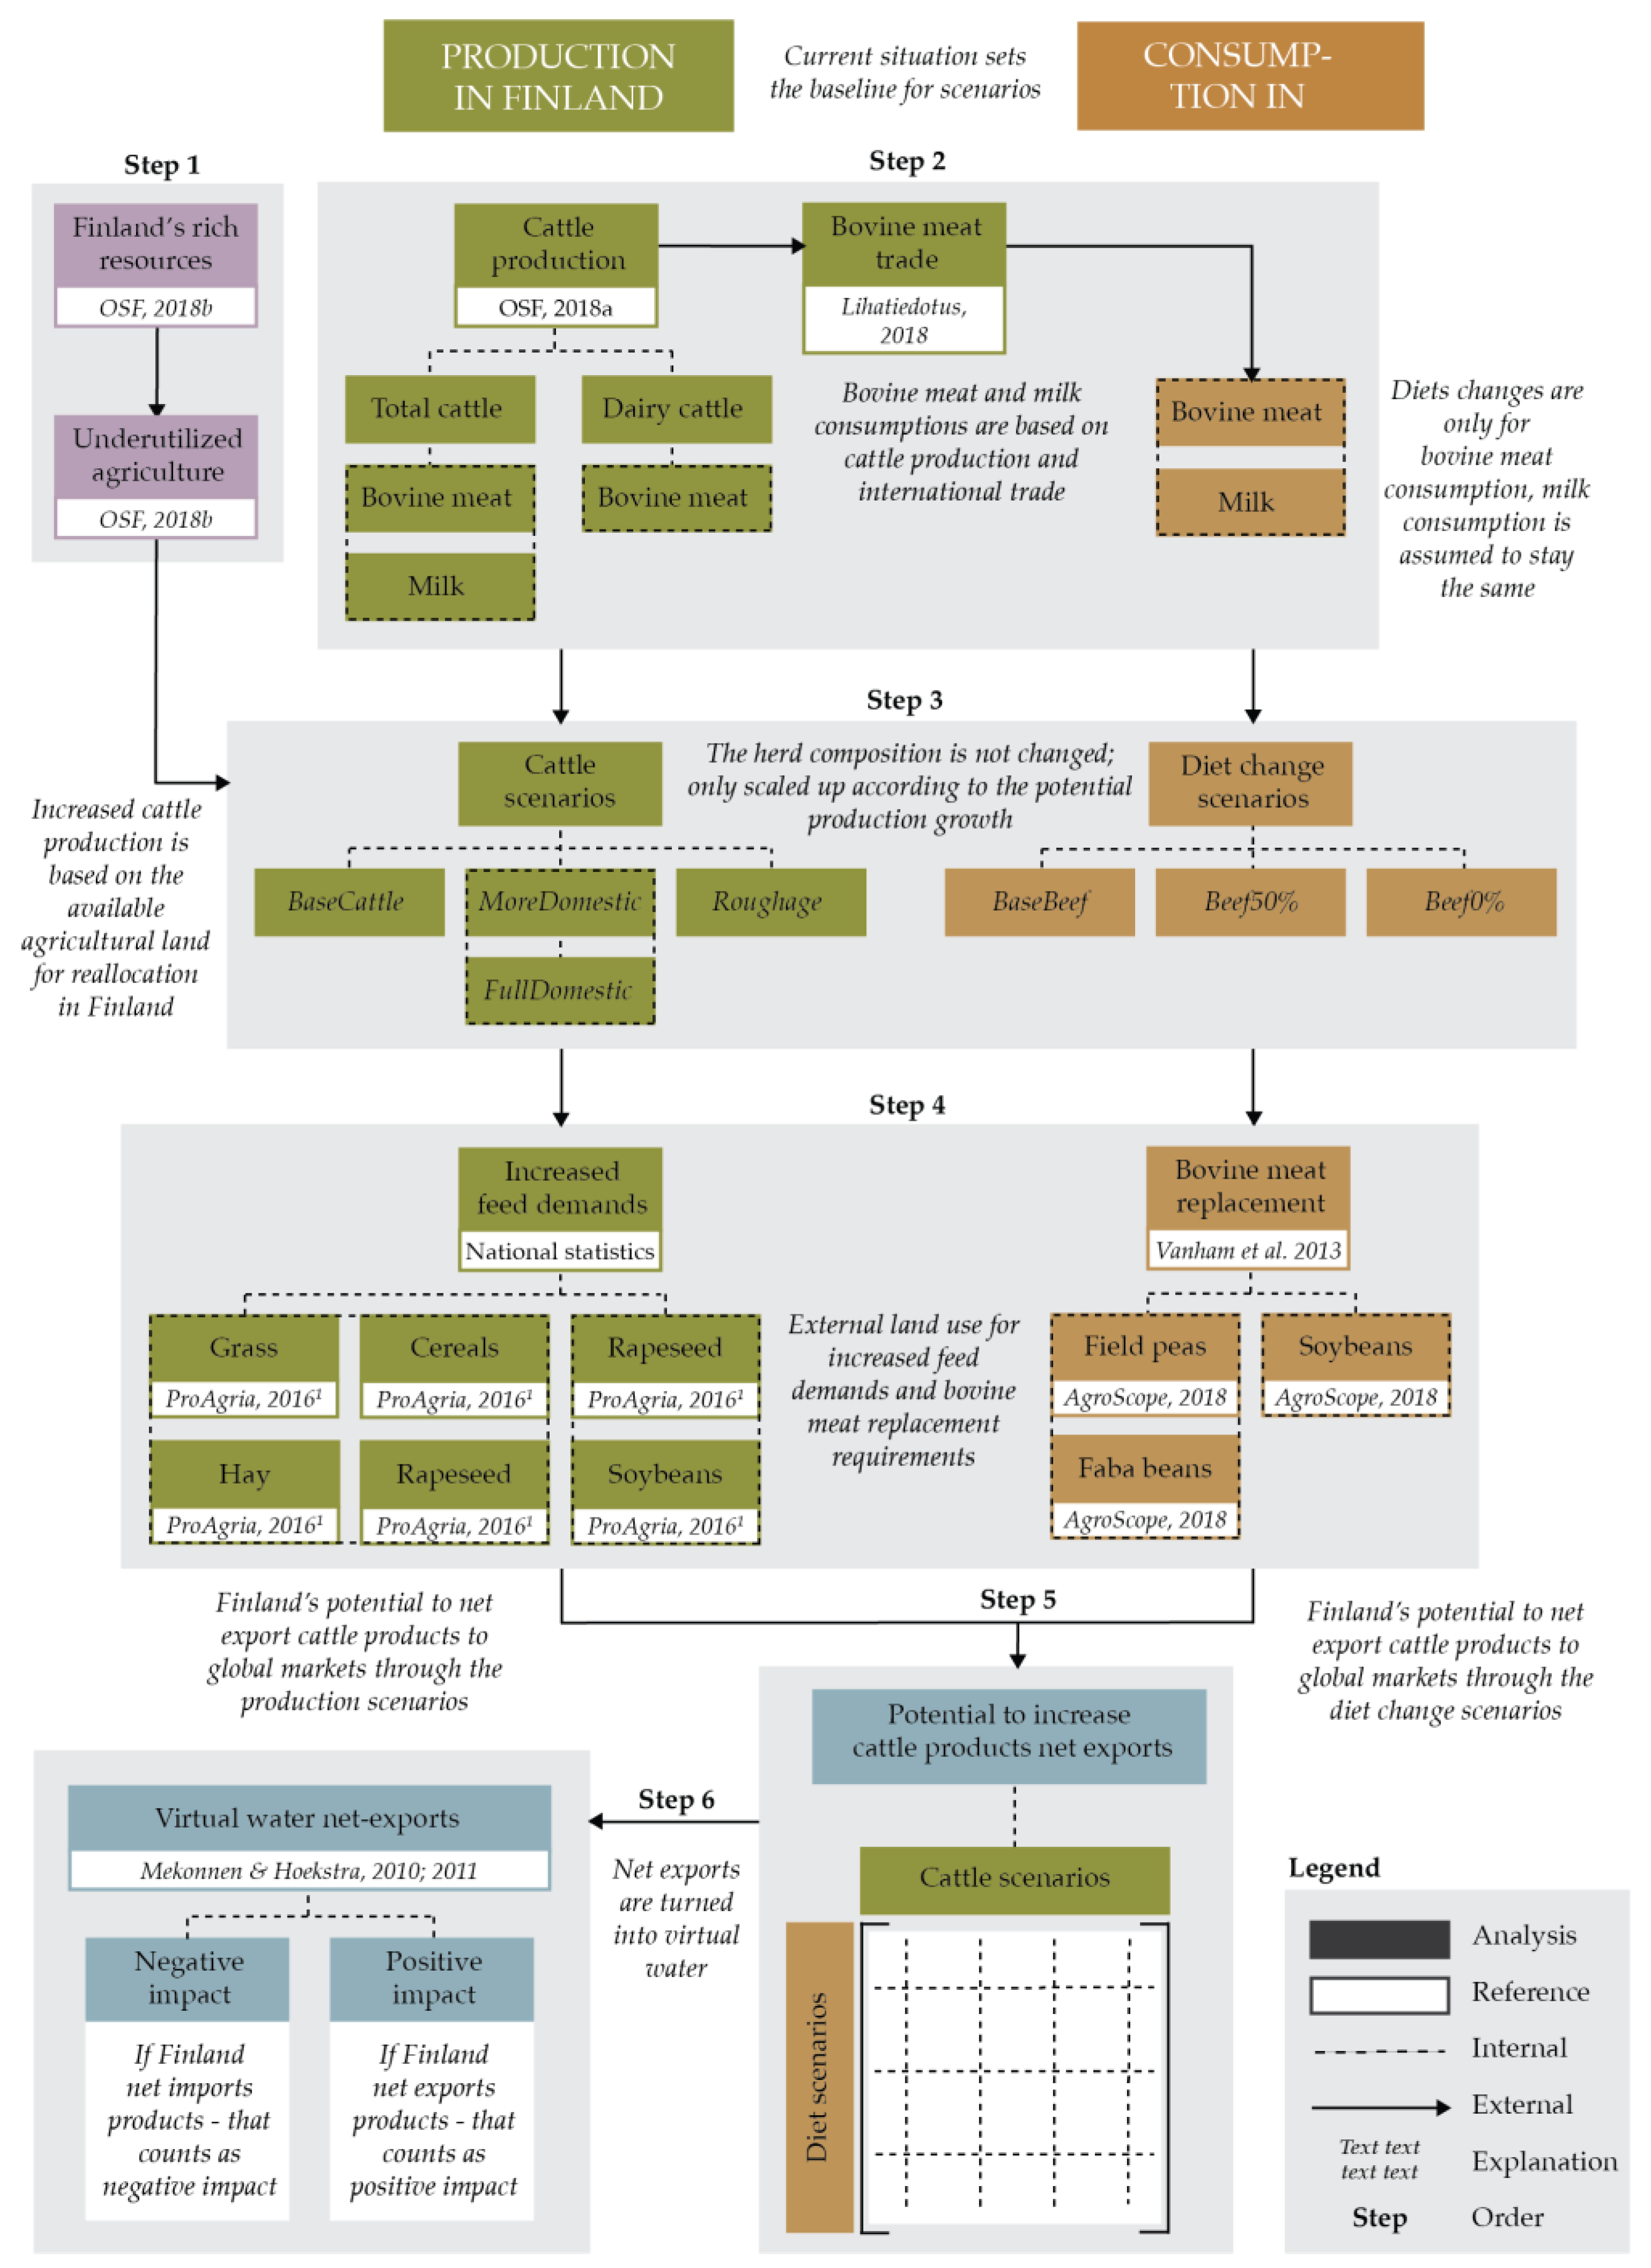
2. Materials and Methods

This study was designed and conducted as follows (Figure 1):
  • Step 1: Calculating the potential of reallocation cattle production to the presently underutilized share of grass leys maintained in arable farmland in Finland;
  • Step 2: Laying the baseline for current Finnish cattle production and cattle product consumption;
  • Step 3: Creating four cattle production scenarios (a current production, productions with current and future domestic feed potentials, a maximum production), and three diet scenarios (current consumption, 50% reduction of bovine meat consumption and 100% reduction of bovine meat consumption) in Finland;
  • Step 4: Calculating the domestic and outsourced land use requirements for cow feed in different cattle production scenarios, and calculating the need for an agricultural land replacing the bovine meat protein with a vegetarian substitute in the different scenarios;
  • Step 5: Estimating the potential to increase the cattle product net exports with a scenario-matrix, considering the feed trade and diet changes;
  • Step 6: Converting the scenario-matrix into water footprints and calculating the potential to net export virtual water.

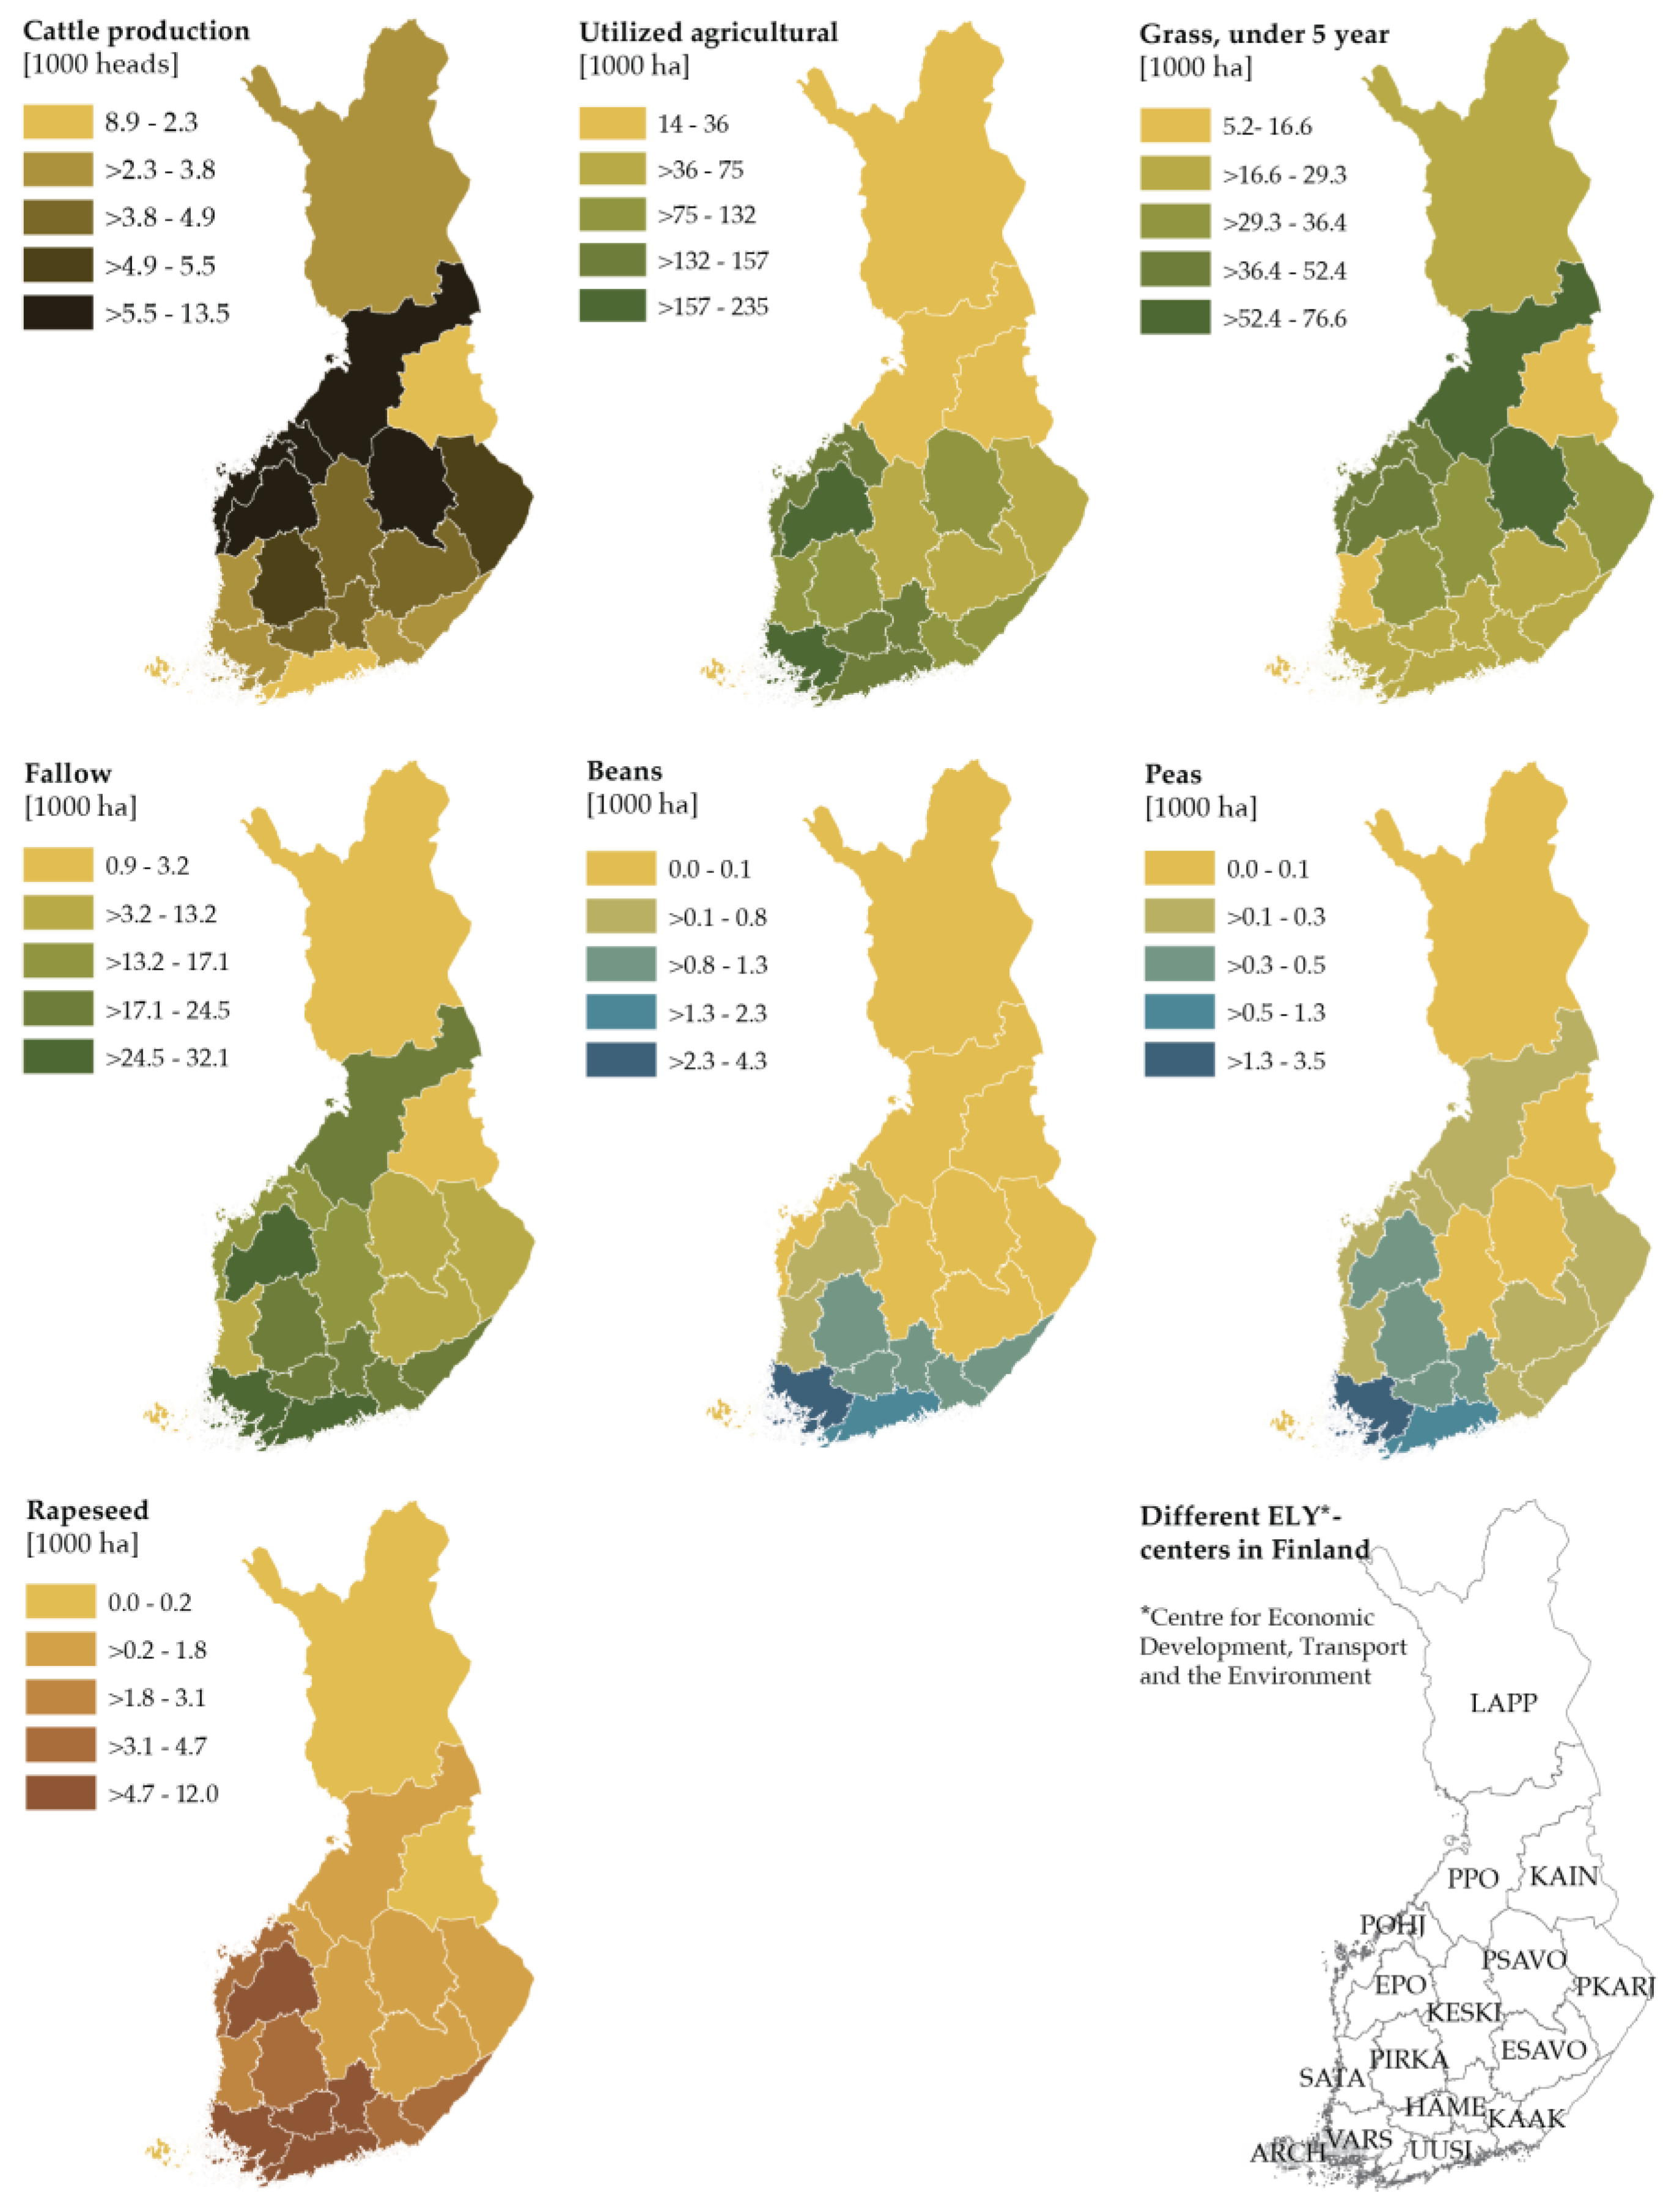
2.1. Reallocation of Agricultural Land (Step 1)

We did not assume any changes to the current extent of agricultural land. The concept of underutilized leys—which refers to arable land that is sown to grasses or mixtures of species of grasses and dicotyledons—is maintained as a measure of an agri-environmental scheme or as fallow, and is only partially or not at all used as a pasture or for silage [49]. Seppälä et al. [49] estimated that the Finnish underutilized ley potential was 472,000 ha in 2013. This estimation matches relatively well to the data from OSF [50], where the total available land for reallocation was calculated to be 480,200 ha on average over the baseline period 2012–2017 [50]. Potentially, the underutilized leys might be even higher, since year by year the number of animals is decreasing and hence, idle leys are increasing [49].
Further, Finland also imported (53,000 tons year−1) and exported (660,400 tons year−1) of cereals on average over the baseline period 2012–2017. We assumed that the net export (607,400 tons year−1) of cereals could also be partly used for cattle feed, if needed, and thus the potential for additional cow feed requirements already exists. In our scenarios, cereal exports refer to wheat, barley and oats, since those are the main crop commodities to be traded.

2.2. Baseline of the Cattle Production and Cattle Product Consumption (Step 2)

2.2.1. Current Cattle Production

Beef and dairy production systems are very interlinked, and changes in the dairy system might cause alterations in the beef production system [51]. Hence, no changes in the relative size of beef to dairy cattle husbandry was assumed, and the ratio between the dairy and meat products was kept at the present level. On average over the baseline period 2012–2017, the total cattle herd size was 909,400 heads, of which the dairy cattle was 282,400 heads. The baseline for the annual production was 83,400 tons of bovine meat and 2327 million litres of milk based on the 5-year average [52]. A special characteristic of Finnish cattle production is the comparatively low share of bovine meat production, since a large part of the cattle is specialized on milk production.

2.2.2. Current Consumption of Cattle Products

We studied bovine meat consumption at the national level, and took into consideration international trade. The national bovine meat consumption was calculated as the sum of cattle production and net imports (imports–exports). The cattle production data was available over the years 2012–2017 [52], and the trade of bovine meat until the year 2016 [43], that was scaled to correspond to the year 2017. On average, the annual bovine meat consumption at the national level was 102,700 tons, resulting around 19 kg cap−1 year−1 (carcass meat).

2.3. Cattle Production and Diet Change Scenarios (Step 3)

2.3.1. Local Constraints to Cattle Production

Finland is a large country that is sparsely populated. Figure 2 presents the current cattle production areas and the agricultural land uses in Finland, relevant to our study [50,52]. Cattle production is focused in the western and middle regions of the country, where the landscape is mainly plains. The utilized agricultural land for feed production is focused in the southern and western parts of the country. Leys and fallows are focused in the same areas as cattle production, meaning that the majority of the feed is close to cattle production. However, farmers’ decision-making for chosen crops and animal numbers is based on market prices and agricultural policies, which were not part of our assessment.
Cultivation of rapeseed competes with peas and beans cultivation in the southern and south-west regions [50]. However, based on the estimate by Peltonen-Sainio [53], there is an increased cultivation potential for rapeseed and legumes. The realistic combined potential for rapeseed and legumes, taking into account the crop rotation, currently is around 201,000 ha (baseline for the year 2011, using mean figure for cultivated area in the 2000s) and in the future could be around 392,000 (baseline for the year 2055, using mean figure for cultivated area in the 2000s). When looking only at the rapeseed cultivation, the increased potential is currently around 258,000 ha (baseline for the year 2011, using mean figure for cultivated area in the year 2000s) and in the future could be around 445,000 ha (baseline for the year 2055, using mean figure for cultivated area in the 2000s). In addition, when looking only at the legume cultivation, the increased potential is currently 242,500 ha (baseline for the year 2011, using mean figure for cultivated area in the 2000s) and in the future could be around 444,500 ha (baseline for the year 2055, using mean figure for cultivated area in the 2000s). The current potential was estimated only for areas that have manageable production risks and the future potential, induced by a prolonged growing season attributable to projected climate change, was estimated for 30 year period according to 19 climatic models [53].
European Union banned the use of neonicotinoid (pesticide) in 2018, and hence the production of rapeseed cultivation is challenged in Finland [54]. The Finnish rapeseed yields are already declining but the situation is constantly changing, and thus we decided not to consider this in our calculations. Overall, the yields in Finland are lower than in Central Europe, mostly due to the shorter growing season. In the future, better cultivars, which have adapted to long days in the northern hemisphere, might offer high-yielding varieties also in the north [55].

2.3.2. Cattle Production Scenarios

We created four cattle production scenarios based on the availability of underutilized Finnish agricultural land for reallocation (Table 1). In all scenarios, the herd composition (dairy to beef animals ratio, number of lactations of dairy cows) was not changed. The production was simply scaled-up in its current structure to meet the potential for growth. The estimations for the increases in feed demand were based on the current feed consumption from ProAgria data [48]. The industrial by-product energy feeds (such as molasses and glycerine) were omitted, since these dietary supplements are produced as by-products from industry, and therefore do not directly compete with agricultural land use. Moreover, those are not a significant proportion of the cattle diet.
The first cattle production scenario (BaseCattle) presents the baseline situation. Rapeseed and soybean feed imports are based on the current use, and the underutilized agricultural land has not been reallocated for feed production. The trade of cereals also remains the same as currently.
The second and third cattle production scenarios focus on improving the feed self-sufficiency by replacing soybean feed imports with domestic rapeseed feed protein. The replacement is done by a conversion factor 1.37 (protein replacement factor is based on the soybeans (0.52 [57]) and rapeseed (0.38 [57]) protein content). In the second cattle production scenario (MoreDomestic), the current domestic rapeseed cultivation potential of 258,000 ha [53] is utilized, and the rest of rapeseed protein feed is imported. In the third cattle production scenario (FullDomestic), the future domestic rapeseed cultivation potential of 445,000 ha [53] is utilized, and no feed imports are needed. In MoreDomestic and FullDomestic, the currently underutilized land has been claimed for also growing the other cattle feed (such as pasture, grass for silage, hay, and barley). In both of these scenarios, no extra land is needed for agricultural production—only the potential in underutilized cultivation potential is reclaimed, and the cereal net exports are exploited domestically.
The fourth cattle production scenario (Roughage) describes the grass feed self-sufficient production, where the production is based on the maximum cultivation potential of domestic pasture and grass silage. This is supported with increased rapeseed and soybeans exports in the same proportions as in the BaseCattle to meet the feed requirements.

2.3.3. Diet Change Scenarios

We used three diet change scenarios to estimate the potential impact of reducing bovine meat consumption. The first scenario (BaseBeef) presents the current diet, where no changes are done. In the second diet scenario (Beef50%), the bovine meat consumption is reduced by 50%, and in the third diet scenario (Beef0%), the bovine meat consumption is reduced by 100%. The replacement of bovine meat with vegetable foodstuff was calculated based on equal protein content [58]. The consumption of milk and milk products were assumed to remain at the current level, and hence no replacement was needed.
The Finnish average daily bovine meat protein intake is 7.8 g cap−1 day−1 (on average over the years 2008–2013) [59]. At the national level, this equals 15,590 tons year−1 of bovine meat protein. This bovine meat protein needs to be replaced partly or fully with vegetable substitute protein in Beef50% and Beef0% scenarios. To do that, we created a vegetable substitute protein (VegSubPro) mix based on the global consumption of soybeans, peas, and beans (on average over the years 2008–2013). First, we collected the global average for the food (kg cap−1 year−1) supply quantity of soybeans, peas, and beans, and then calculated the relational share of consumption for those. This analysis provided us with a general reference of how the replacement could be. For the imported protein replacements [57], we used the dried soybeans (Glycine max), and for domestic protein replacements, we used dried green peas (Pisum sativum) and dried faba beans (Vicia faba). Based on the relative share of consumption and protein content, we calculated the VegSubPro has the protein content of 297 g kg−1.

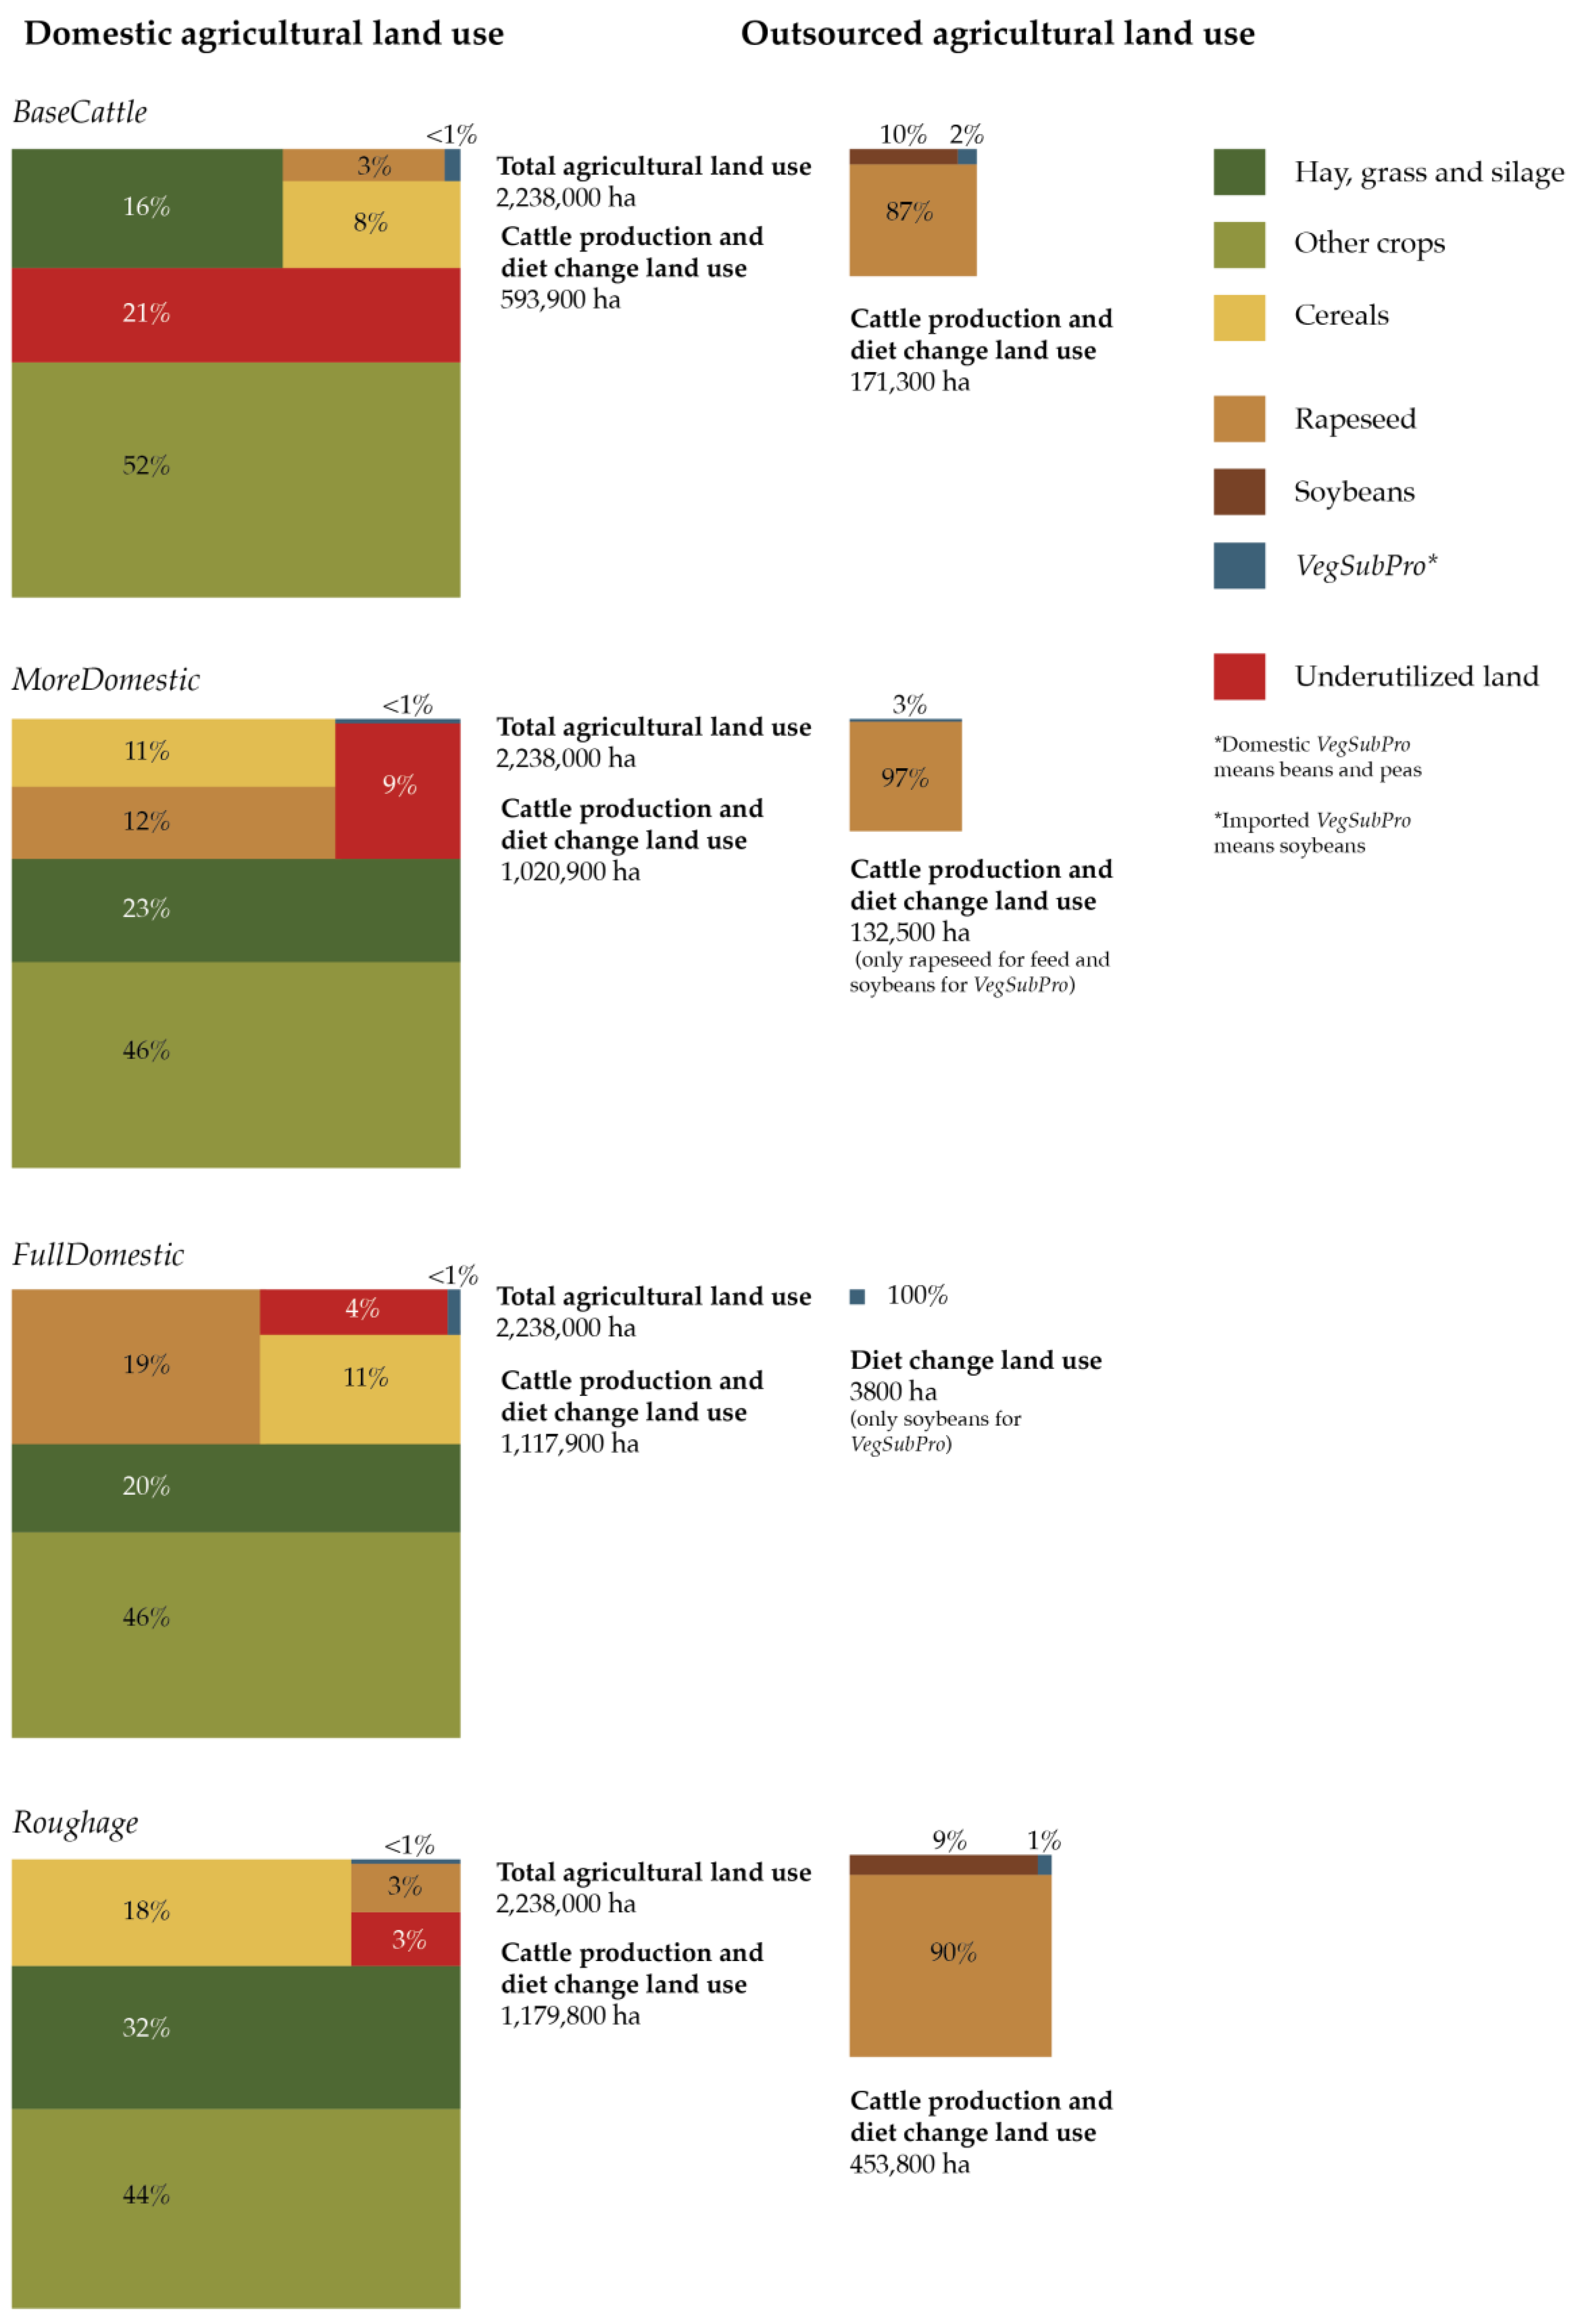
2.4. Land Use Requirements for Cow Feed and Diet Change (Step 4)

For calculating the land use need in cattle production and cattle products consumption scenarios, we developed a land use model that accounts for the interactions between the changes in the agricultural land use and plant yields, cattle production and diet change scenarios, and trade for both human foodstuff and cattle feeds products. The calculation was done in a mass balance basis and then converted to land use according to the local and global yields. The agricultural land was allocated first to the domestic feed and food production, and only after that to the cereal exports. If the domestic supply could not suffice cattle production or diet change scenarios, global yield estimates were used to calculate the land use in aboard on per plant basis [60]. The land use requirements were calculated using the following equation (1):
Land   use   requirements   = p l a n t   p r o d u c t i o n h u m a n   d e m a n d d i e t   c h a n g e   m o d i f i e r + c a t t l e   d e m a n d c a t t l e   s c e n a r i o   m o d i f i e r s + i m p o r t s   exports .

2.5. Potential for Cattle Products Exports (Step 5)

We created a scenario-matrix, using cattle production and domestic diet change scenarios. This scenario-matrix was based on the following principles:
  • Finland exports and imports bovine meat: The bovine meat net imports were always first replaced with domestic products, and only after that, the potential for bovine meat exports was allowed;
  • Finland also exports and imports milk and milk products: The current milk production was taken as a baseline level and the increased production seen as potential exports;
  • The VegSubPro was included in the trade as well: Only soybeans were imported, since beans and peas were cultivated domestically.

2.6. Virtual Water Net Export Potentials (Step 6)

The water footprint is defined as an indicator of freshwater use that takes into account both direct and indirect water use of a consumer or producer [61]. We used the global water footprints for crops [39] and animal products [40] in order to calculate the impact, that Finland could have in the global markets.
The water footprint is divided into blue, green and grey water. Blue water refers to the fresh surface and groundwater used in the production, while green water refers to the amount of rainwater consumed, and grey water refers to the amount of fresh water needed to assimilate the pollutants to meet specific water quality standards [61]. Blue and green water consumption is inherent to the production of crops and livestock—biomass cannot grow without a certain amount of water. Grey water is much more avoidable by agricultural management practices, and therefore was neglected in this study.
The potential for virtual water net exports of the different scenario combinations was accounted for Finland’s international net trade of cattle products and feeds needed for the production. Finland’s net imports of virtual water are given as negative values, since then Finland is consuming the already scarce global water resources. Finland’s net exports of virtual water result in a positive virtual water contribution, since then Finland is providing virtual water for the global markets. The water footprint for domestic cattle production and consumption in Finland was not counted to the virtual water trade balance, as it does not affect the virtual water trade balance. The virtual water net exports were calculated using the following equation:
V i r t u a l   w a t e r   n e t   e x p o r t s = e x p o r t s v i r t u a l   w a t e r   f o o t p r i n t s i m p o r t s v i r t u a l   w a t e r   f o o t p r i n t s .  
Yet, it is vital to recognize that not all Finland’s consumed global water is from scarce water resources—therefore not all virtual water net exports ease the global water scarcity. Nevertheless, when calculating the number of global citizens that net exports from Finland could sustain, we used the value of 1032 m3 cap−1 year−1 [9] for the global average of virtual green and blue water footprints for food consumption per capita. It is also good to acknowledge, that we looked at only the net exports of cattle products, not Finland’s overall net exports.

3. Results

3.1. Cattle Production and Diet Change Scenarios

From BaseCattle to MoreDomestic and FullDomestic scenarios, the number of total cattle increases by 42.9%, and from BaseCattle to Roughage increases by 134.0%. Since the herd composition in the scenarios was kept unchanged, the production of milk and beef products increases by the same proportions. The annual bovine meat production increases from 83,400 tons year−1 in BaseCattle, to 119,200 tons year−1 in MoreDomestic and FullDomestic, and to 195,100 tons year−1 in Roughage. While the milk production increases from 2.3 billion litres year−1 in BaseCattle, to 3.2 billion litres year−1 in MoreDomestic and FullDomestic, and to 5.3 billion litres year−1 in Roughage.
In the baseline diet scenario (BeefBase), no substitutions for proteins derived from animal products are required. In Beef50%, annually 26,800 tons year−1 of VegSubPro replace the reduced domestic bovine meat consumption (51,300 tons), of which 10,700 tons year−1 of soybeans (4300 tons of dry matter) is imported and rest 16,100 tons year−1 of legumes (6100 tons of dry matter) is domestic. In Beef0%, 53,600 tons of VegSubPro is required to replace 102,700 tons year−1 of domestic bovine meat consumption. For this amount of VegSubPro, 21,400 tons year−1 of soybeans (8600 tons of dry matter) is imported and the remaining 32,100 tons year−1 of legumes (12,100 tons of dry matter) is domestic.

3.2. Land Use Scenarios

In BaseCattle, 78% of the feed use is domestic (593,900 ha; including hay, grass and silage, cereals, rapeseed, peas and beans) and 22% is outsourced (171,300 ha) (Figure 3). Rapeseed feeds dominate the imports, having a share of 87% of the total outsourced land use. In MoreDomestic, 89% of the feed is domestic (1,020,900 ha) and 11% is outsourced (132,500 ha). In this scenario, 97% of the outsourced land use is for rapeseed cultivation, as the soybeans imports are replaced with the rapeseed imports. In FullDomestic, all the feed production (1,117,900 ha) is 100% domestic and only soybeans replacement for bovine meat reduction is outsourced (3800 ha). In Roughage, 72% of the feed use is domestic (1,179,800 ha) and 28% is outsourced (453,800 ha). In this scenario, rapeseed imports dominate with a share of 82% (408,400 ha) of the total outsourced land use, and soybeans for feed and food are outsourced for 45,400 ha.
In all the scenarios, domestic agricultural land use changes mainly take place in the presently underutilized agricultural land (Figure 3). BaseCattle leaves 21% (474,300 ha of the total of 2.3 million ha) of the land underutilized. Of the other scenarios which resort to the underutilized land based on the rapeseed cultivation potential, MoreDomestic decreases it to 9% (191,400 ha), FullDomestic to 4% (94,400 ha), and Roughage to 3% (65,800 ha). The share of other agricultural crops remains relatively unchanged.

3.3. Cattle Products and Feed Trade

The most significant increase in net exports is in milk. The annual net exports increased tremendously in all scenarios, from 975,200 tons up to 3,139,800 tons. Relatively, the net exports of bovine meat increase in relative terms even more, from −19,300 tons to 175,800 tons (Table 2). The trade of harvested crop products is also variably affected. In MoreDomestic and FullDomestic, the majority of underutilized agricultural land is used for rapeseed cultivation, and the potential for exports of grain cereals remains modest. This is an opposite case in the Roughage, in which the majority of the underutilized land can be used for cereals, and due to animal feed imports, plenty of grain cereals are available for exports. In VegSubPro, a variation between the scenarios in need for imports for VegSubPro is relatively minor (ranging from 4300 tons to 8600 tons), but accountable.

3.4. Virtual Water Net Exports

When assessing the potential of different scenarios to increase virtual water exports, it can be seen that despite that Roughage is importing feed the most, maximizing cattle production has the greatest potential to increase net export virtual water (Figure 4). At the same time, this scenario also consumes global water resources the most, that needs to be taken into account when calculating the overall trade-offs.
When solely looking at the trade of virtual water, it can be seen that only FullDomestic does not consume global water resources (apart for the soybeans imports in the VegSubPro), because the share of domestic feed has a high impact on virtual water net exports. The production of cattle products is the same in both MoreDomestic and FullDomestic, but as domestic feed has a higher share in FullDomestic (Figure 4), it also leads to a higher virtual water net export potential.
The role of diet changes also plays an important role when calculating the potential to increase virtual water net exports: The less bovine meat Finnish people eat, the more virtual water can be net exported. The Beef0% has on average, 0.9 billion m3 year−1 higher potential for net exports compared to the BaseBeef, despite the chosen cattle production scenario.
Finally, we estimated what the virtual water net exports would mean regarding the average water footprint for a global citizen (Figure 4). Thus, the above-explored potential to increase virtual water net exports of different scenarios, would provide virtual water for more than half of the population of Finland. In the scenario maximizing the net exports of virtual water, Roughage combined with the radical of domestic consumption (Beef0%), the exports would meet with annual virtual water needs for food of 3.6 million global citizens. Even if Roughage was combined with the nutritionally recommended cut in domestic beef consumption (Beef50%), it would still sustain 3.1 million global citizens for their virtual water needs for food consumption.

4. Discussion

Based on these results, we argue that on top of efforts in reducing water use by conventional methods (e.g., food loss reduction, yield gap closure, improved irrigation efficiency), water consumption could be directed to areas with a surplus of water, and exported as virtual water to relieve water demand in areas with water scarcity, for example. In this study, we assessed Finland’s potential to increase virtual water net exports by intensifying water-intensive animal production in an area with rich water and farmland resources, and combining that with a diet change towards less water-intensive protein sources. There have been previous studies on Finland’s negative external water footprint [31,36] and agriculture’s negative outsourced environmental impacts [35,37]. However, in this study, we wanted to estimate the positive impact, that Finland could have with its rich water and farmland resources.

4.1. Dependency on Imported Agricultural Inputs and Products

Finland, like a majority of countries, is a net importer of agricultural products and, therefore, has an external water footprint surplus [36]. The Nordic climate sets certain restrictions for agricultural production, such as one and short growing season, late spring and early autumn frosts, low degree days, and albeit long daylength during the growing season, low temperatures, and low solar radiation intensity [62,63]. It is thus understandable, that Finland imports part of the food consumed by its population, especially items that help with meeting the dietary requirements over the winter period [44].
Our analysis explored cattle production scenarios under current agricultural production conditions, assuming current yields and current practices of cattle husbandry. Even though there is potential to increase cattle production in Finland with domestic feed, dependency on the global markets remains through other imported agricultural inputs [64,65], which is important to keep in mind when estimating the vulnerability of Finnish food system.
We expect the scenarios to have political relevance in terms of the economics of farming in Finland—structural change from a high number of small family farms to a low number of bigger, more entrepreneurial farms has been fast, and is still ongoing [66]. At the same time, the price margin between farmer prices of agricultural products and the price of food is increasing, and farming is hardly profitable [67,68]. In this situation, any sustainable scenario for increasing exports of agricultural products attracts attention. For any country, finding its sustainable role in the globalizing food system is serving the maintenance of human resources, infrastructures, social capital and institutions for maintenance domestic food supply and food security.

4.2. Diet Changes for Humans and Animals

Finnish red meat consumption has increased alarmingly in recent years, as it has in a large part of the other Western and Northern European countries [45,59,69]. Finland’s recent national food policy suggests reducing meat-based meals by increasing the proportion of plant-based meals [47]. However, it is vital to recognize that livestock production is more than just meat production, and beef production is closely associated with milk production in Finland. Our analysis demonstrated that the exports of milk (products) also had a significant role, when calculating the potential to net export virtual water of the large production potential in various scenarios (Figure 4).
Consumers can adapt more easily to a diet that contains some meat rather than to an entirely meatless diet [70]. Our diet change scenarios only reduced the consumption of bovine meat, and otherwise the meat consumption remained the same. Based on the current polls on Finnish consumer habits, there is a modest increasing trend on favouring plant-based meals [71], and therefore our diet changes could be realistic in the long term.
The scenarios did not include changes in feed protein sources to monogastric livestock (e.g., poultry and pigs); in these, a change to domestic sources may cause negative effects to growth and productivity [42,72,73]. Regarding the feed for bovine livestock, Peltonen et al. [42] explained that Finland has a great potential to shift towards fully domestic protein sources, including legumes in grass mixtures and rapeseed meals, but also more marginally malting residues, pea and faba bean [42,74,75]. As Finland only has one growing season, and agriculture has been characterized as a monoculture [42], diversifying the domestic legume cultivation—for food and feed—would enrichen the agriculture and landscape [31].
In our scenarios, cereal cultivation and trade played a notable role. Especially in Roughage, virtual water net export increased substantially when the underutilized land was used for cereal cultivation, and the cereals were first consumed domestically along with the increased feed imports, and then exported mainly as feed (the quality might vary, and hence we assumed the exports to be feed such as barley, oats and what). Our analysis showed that there are two different ways to achieve increased animal production—either to increase the overall net exports in the expenses of partly outsourced environmental impacts via partly imported feed as in Roughage, or to have more moderate virtual water net exports with hardly any outsourced environmental impacts as done in the FullDomestic scenario.

4.3. Global Impacts of the Reallocation of Land and Water for Cattle Production

While our study provides new information on how a country can increase its virtual water net flows and have a positive impact in the global markets, this study does not consider how this trade would affect the global markets and what kind of impacts it would have on current production countries. Theoretically, there is a potential to minimize the land and water needed globally by reallocating production to countries with high land and water efficiencies [12], but there are also several challenges and risks regarding the reallocation. We used Fader et al.’s [12] statements for assessing our results against the current situation in Finland and the global context (Table 3).

4.4. Water Scarcity Impacts in Finland and Globally

Finland has on average (2008–2013) 237 billion m3 of renewable water resources [33]. This puts Finland at the top of EU countries if measured as the water resources per capita [82]. Based on our scenario-matrix, the greatest potential of net export virtual water (blue and green) was 3.7 billion m3 year−1. This is on average only 1.6% of all renewable freshwater resources in Finland, and thus can be assumed that Finnish freshwater resources would not be endangered by the increased net export volumes under the normal conditions.
Although on average, water is abundant in Finland, various parts of it are also experiencing droughts, which have been studied less than the more frequently occurring floods [83]. One of the recent severe droughts occurred in 2002–2003 when Finland’s water deficit was at its worse (about 60 billion m3). According to Kuusisto [82], almost half of the deficit was in groundwater stores, a quarter in soil moisture storage and the remainder in lakes. There were severe drought conditions over the growing season 2018, causing prominent (ca. 30%) reduction in harvest compared to the 2017 year’s harvest, and the final estimations have not yet been assessed [56]. Even though most of the Finnish crop production is rainfed, Peltonen-Sainio et al. [41,84] state that climate change will create challenges. Especially, frequencies of extreme weather events are expected to increase, which might require the development of irrigation systems for comprehensive water management [41]. Our scenarios did not include assessment for future climatic conditions, but it is obvious that any changes in water resources and agricultural production conditions are relevant.
Finland could increase the net exports of virtual water of cattle products from 0.1 billion m3 year−1 to 3.7 billion m3 year−1 (Figure 4), depending on which scenario combination that is chosen. When putting these net exports into practical measures, this means providing annual agricultural virtual water to up to 3.6 million global citizens (when assuming 1032 m3 cap−1 year−1 water consumption for food). Even though greater volumes of virtual water would be required in order to make a powerful influence on the 4 billion people impacted by water scarcity, it is good to put this into a wider perspective—Finland has a population only of around 5.5 million people [34], and it could provide additional virtual water for more than half of a population of its own size. Our study provides a practical example of what one country can do, and if scaling the same scenarios for other water-abundant countries, this might have a considerable impact globally and contribute to the globally fairer sharing of resources.

4.5. Limitations of the Study and Future Directions

Despite the vast freshwater resources, Finland is already facing the challenge of eutrophication in the rivers and lakes that are close to agricultural production, in particular through nitrogen and phosphorus loadings [85,86]. In addition, the entire Baltic Sea is already affected by eutrophication, due to the intensive use of the sea itself and anthropogenic activities [87,88]. Our research focused only on the water quantities, but the future research should expand the assessment also to a water quality analysis. Another significant and negative environmental impact is caused by greenhouse gas (GHG) emissions [89], to which methane from ruminant livestock metabolism has a significant global contribution but which were not considered in our study. Even though the carbon footprint of cows in Finland is smaller (reference level of that in Sweden [51]) than for example in the United States [90,91]) or in Brazil [92], the GHG emissions are an important consideration going beyond our assessment. Further, when evaluating the overall sustainability of increased cattle production in Finland, all positive—but also all negative—impacts, such as economic influence, transportation emissions, degradation of wildlife habitats, eutrophication and deforestation, need to be considered in more detail in the future studies, before constituting the comprehensive understanding.
In the future, population growth and increasing meat consumption are adding more pressure to already limited natural resources. Bringing additional virtual water to global markets does not directly reduce agricultural water consumption in water-stressed areas, due to the increased consumption demand, but rather might keep the scarcity level at the same level. Unfortunately, scarce resources are often depleted in one way or another, as people are understandably seeking ways to secure their income. Thus, instead of suggesting the reduction, or phasing out, of agricultural production in water-stressed areas—alternatively, we are suggesting that less water-intensive products and livelihoods would have to be introduced together with support for efficient and just water resources management.

5. Conclusions

Water scarcity is globally a critical challenge, and the international trade of agricultural products connects a majority of the countries, including water-rich Finland, tightly to it. Case studies are needed to understand how an individual country could implement the existing knowledge and contribute positively to a globally resource-efficient food production in practical matters.
In this paper, we assessed the potential to ease water demand in water-scarce areas by assessing the increase of water-intensive production in areas with a surplus of freshwater, such as Finland. We took into consideration Finland’s land use requirements that are embedded in agricultural production and trade. We combined the production scenarios with diet change, and calculated Finland’s total potential to net export virtual water in the form of cattle products.
Our analysis demonstrated that there is a potential for reallocation of water use to water-rich areas through the exports of water-intensive products, and replacing partly or fully the bovine meat protein with vegetable protein sources. Finland has vast water and land resources, and hence the increase of water-intensive production does not consume the existing natural resources in the same ratio than in some other production areas, already suffering from water scarcity. Based on these findings, we argue that it is more important to consider where water is saved rather than looking merely at volumes that are saved.
Future case studies could have a combination of global trade and spatial analysis to provide further insights on where the water should be saved and where the natural resources are underutilized. In order to solve the global dilemma of food production with limited resources, the detailed system-wide spatial approach is necessary for this alarming problem.

Author Contributions

Initial idea: J.H. and E.L.; Conceptualization: E.L., T.P., J.H., M.K., A.O.S. and M.K.; Formal analysis: E.L., T.P. and M.J.; Project administration, E.L.; Supervision, J.H. and M.K.; Writing—original draft: E.L., T.P., J.H., M.K., A.O.S. and M.K.

Funding

This research was funded by Strategic Research Council (SRC) through project ‘From Failand to Winland’; Emil Aaltonen foundation through project ‘eat-less-water’; University of Helsinki Research Foundation in the Doctoral programme in the sustainable use of renewable natural resources (AGFOREE) through a personal grant. This research was also supported by Maa- ja vesitekniikan tuki ry.hel

Acknowledgments

Authors want to thank Johanna Mäkelä (University of Helsinki) for the help with ideation of the paper, Pirjo Peltonen-Sainio (Natural Resources Institute Finland) for her valuable comments on crop cultivation potential, Frederick Stoddard (University of Helsinki) for his much-appreciated comments on the diet change, Maija Taka (Aalto University) for her kind help with Figure 2, and Amy Fallon (Aalto University) for her respected help with the language.

Conflicts of Interest

The authors declare no conflict of interest.

References

  1. Godfray, H.C.J.; Beddington, J.R.; Crute, I.R.; Haddad, L.; Lawrence, D.; Muir, J.F.; Pretty, J.; Robinson, S.; Thomas, S.M.; Toulmin, C. Food Security: The Challenge of Feeding 9 Billion People. Science 2010, 327, 812–818. [Google Scholar] [CrossRef] [PubMed] [Green Version]
  2. HLPE. Nutrition and Food Systems; A Report by the High Level Panel of Experts on Food Security and Nutrition of the Committee on World Food Security; HLPE: Rome, Italy, 2017; p. 152. [Google Scholar]
  3. Springer, N.P.; Duchin, F. Feeding Nine Billion People Sustainably: Conserving Land and Water through Shifting Diets and Changes in Technologies. Environ. Sci. Technol. 2014, 48, 4444–4451. [Google Scholar] [CrossRef] [PubMed]
  4. Gerland, P.; Raftery, A.E.; Ševčíková, H.; Li, N.; Gu, D.; Spoorenberg, T.; Alkema, L.; Fosdick, B.K.; Chunn, J.; Lalic, N.; et al. World population stabilization unlikely this century. Science 2014, 346, 234–237. [Google Scholar] [CrossRef] [PubMed] [Green Version]
  5. United Nations. World Population Prospects: The 2017 Revision, Key Findings and Advance Tables; ESA/P/WP/248; United Nations, Department of Economic and Social Affairs, Population Division: Rome, Italy, 2017. [Google Scholar]
  6. Foley, J.A.; Ramankutty, N.; Brauman, K.A.; Cassidy, E.S.; Gerber, J.S.; Johnston, M.; Mueller, N.D.; O’Connell, C.; Ray, D.K.; West, P.C.; et al. Solutions for a cultivated planet. Nature 2011, 478, 337–342. [Google Scholar] [CrossRef] [Green Version]
  7. Ramankutty, N.; Mehrabi, Z.; Waha, K.; Jarvis, L.; Kremen, C.; Herrero, M.; Rieseberg, L.H. Trends in Global Agricultural Land Use: Implications for Environmental Health and Food Security. Annu. Rev. Plant Biol. 2018, 69, 789–815. [Google Scholar] [CrossRef]
  8. Mekonnen, M.M.; Hoekstra, A.Y. Four billion people facing severe water scarcity. Sci. Adv. 2016, 2, e1500323. [Google Scholar] [CrossRef] [Green Version]
  9. Hoekstra, A.Y.; Mekonnen, M.M. The water footprint of humanity. Proc. Natl. Acad. Sci. USA 2012, 109, 3232–3237. [Google Scholar] [CrossRef] [Green Version]
  10. Chapagain, A.K.; Hoekstra, A.Y.; Savenije, H.H.G. Water saving through international trade of agricultural products. Hydrol. Earth Syst. Sci. 2006, 10, 455–468. [Google Scholar] [CrossRef] [Green Version]
  11. Dalin, C.; Konar, M.; Hanasaki, N.; Rinaldo, A.; Rodriguez-Iturbe, I. Evolution of the global virtual water trade network. Proc. Natl. Acad. Sci. USA 2012, 109, 5989–5994. [Google Scholar] [CrossRef] [Green Version]
  12. Fader, M.; Gerten, D.; Thammer, M.; Heinke, J.; Lotze-Campen, H.; Lucht, W.; Cramer, W. Internal and external green-blue agricultural water footprints of nations, and related water and land savings through trade. Hydrol. Earth Syst. Sci. 2011, 15, 1641–1660. [Google Scholar] [CrossRef] [Green Version]
  13. Konar, M.; Reimer, J.J.; Hussein, Z.; Hanasaki, N. The water footprint of staple crop trade under climate and policy scenarios. Environ. Res. Lett. 2016, 11, 035006. [Google Scholar] [CrossRef] [Green Version]
  14. Liu, W.; Antonelli, M.; Kummu, M.; Zhao, X.; Wu, P.; Liu, J.; Zhuo, L.; Yang, H. Savings and losses of global water resources in food-related virtual water trade. Wiley Interdiscip. Rev. Water 2018, 6, e1320. [Google Scholar] [CrossRef]
  15. Oki, T.; Kanae, S. Virtual water trade and world water resources. Water Sci. Technol. 2004, 49, 203–209. [Google Scholar] [CrossRef]
  16. Yang, H.; Wang, L.; Abbaspour, K.C.; Zehnder, A.J.B. Virtual water trade: An assessment of water use e ciency in the international food trade. Hydrol. Earth Syst. Sci. Discuss. Eur. Geosci. Union 2006, 10, 443–454. [Google Scholar] [CrossRef]
  17. Porkka, M.; Guillaume, J.H.A.; Siebert, S.; Schaphoff, S.; Kummu, M. The use of food imports to overcome local limits to growth: Use of imports to overcome local limits. Earths Future 2017, 5, 393–407. [Google Scholar] [CrossRef]
  18. D’Odorico, P.; Carr, J.A.; Laio, F.; Ridolfi, L.; Vandoni, S. Feeding humanity through global food trade. Earths Future 2014, 2, 458–469. [Google Scholar] [CrossRef] [Green Version]
  19. Steffen, W.; Richardson, K.; Rockstrom, J.; Cornell, S.E.; Fetzer, I.; Bennett, E.M.; Biggs, R.; Carpenter, S.R.; de Vries, W.; de Wit, C.A.; et al. Planetary boundaries: Guiding human development on a changing planet. Science 2015, 347, 1259855. [Google Scholar] [CrossRef]
  20. Tilman, D. Global environmental impacts of agricultural expansion: The need for sustainable and efficient practices. Proc. Natl. Acad. Sci. USA 1999, 96, 5995–6000. [Google Scholar] [CrossRef] [Green Version]
  21. Tilman, D.; Balzer, C.; Hill, J.; Befort, B.L. Global food demand and the sustainable intensification of agriculture. Proc. Natl. Acad. Sci. USA 2011, 108, 20260–20264. [Google Scholar] [CrossRef] [Green Version]
  22. Aleksandrowicz, L.; Green, R.; Joy, E.J.M.; Smith, P.; Haines, A. The Impacts of Dietary Change on Greenhouse Gas Emissions, Land Use, Water Use, and Health: A Systematic Review. PLoS ONE 2016, 11, e0165797. [Google Scholar] [CrossRef]
  23. Kummu, M.; Fader, M.; Gerten, D.; Guillaume, J.H.; Jalava, M.; Jägermeyr, J.; Pfister, S.; Porkka, M.; Siebert, S.; Varis, O. Bringing it all together: Linking measures to secure nations’ food supply. Curr. Opin. Environ. Sustain. 2017, 29, 98–117. [Google Scholar] [CrossRef]
  24. Erb, K.-H.; Lauk, C.; Kastner, T.; Mayer, A.; Theurl, M.C.; Haberl, H. Exploring the biophysical option space for feeding the world without deforestation. Nat. Commun. 2016, 7, 11382. [Google Scholar] [CrossRef] [PubMed] [Green Version]
  25. Jalava, M.; Kummu, M.; Porkka, M.; Siebert, S.; Varis, O. Diet change—A solution to reduce water use? Environ. Res. Lett. 2014, 9, 074016. [Google Scholar] [CrossRef]
  26. Pimentel, D.; Pimentel, M. Sustainability of meat-based and plant-based diets and the environment. Am. J. Clin. Nutr. 2003, 78, 660S–663S. [Google Scholar] [CrossRef] [PubMed]
  27. Tilman, D.; Clark, M. Global diets link environmental sustainability and human health. Nature 2014, 515, 518–522. [Google Scholar] [CrossRef]
  28. Cowell, S.J.; Parkinson, S. Localisation of UK food production: An analysis using land area and energy as indicators. Agric. Ecosyst. Environ. 2003, 94, 221–236. [Google Scholar] [CrossRef]
  29. Röös, E.; Patel, M.; Spångberg, J.; Carlsson, G.; Rydhmer, L. Limiting livestock production to pasture and by-products in a search for sustainable diets. Food Policy 2016, 58, 1–13. [Google Scholar] [CrossRef] [Green Version]
  30. Zumkehr, A.; Campbell, J.E. The potential for local croplands to meet US food demand. Front. Ecol. Environ. 2015, 13, 244–248. [Google Scholar] [CrossRef]
  31. Sandström, V.; Lehikoinen, E.; Peltonen-Sainio, P. Replacing Imports of Crop Based Commodities by Domestic Production in Finland: Potential to Reduce Virtual Water Imports. Front. Sustain. Food Syst. 2018, 2. [Google Scholar] [CrossRef]
  32. Kummu, M.; Varis, O. The world by latitudes: A global analysis of human population, development level and environment across the north–south axis over the past half century. Appl. Geogr. 2011, 31, 495–507. [Google Scholar] [CrossRef]
  33. Eurostat Water statistics. Available online: https://ec.europa.eu/eurostat/web/environment/water/database (accessed on 24 September 2018).
  34. Statistics Finland Population. Available online: http://www.stat.fi/til/vrm_en.html (accessed on 14 November 2018).
  35. Sandström, V.; Saikku, L.; Antikainen, R.; Sokka, L.; Kauppi, P. Changing impact of import and export on agricultural land use: The case of Finland 1961–2007. Agric. Ecosyst. Environ. 2014, 188, 163–168. [Google Scholar] [CrossRef]
  36. Nikula, J. Finland’s Water Footprint; WWF Finland: Helsinki, Finland, 2012. [Google Scholar]
  37. Sandström, V.; Kauppi, P.E.; Scherer, L.; Kastner, T. Linking country level food supply to global land and water use and biodiversity impacts: The case of Finland. Sci. Total Environ. 2017, 575, 33–40. [Google Scholar] [CrossRef] [PubMed]
  38. Peltonen-Sainio, P.; Jauhiainen, L.; Hakala, K. Climate change and prolongation of growing season: Changes in regional potential for field crop production in Finland. Agric. Food Sci. 2008, 18, 171. [Google Scholar] [CrossRef]
  39. Mekonnen, M.M.; Hoekstra, A.Y. The green, blue and grey water footprint of crops and derived crop products. Hydrol. Earth Syst. Sci. 2011, 15, 1577–1600. [Google Scholar] [CrossRef] [Green Version]
  40. Mekonnen, M.M.; Hoekstra, A.Y. The Green, Blue and Grey Water Footprint of Farm Animals and Animal Products; Value of Water Research Report Series No. 48; UNESCO-IHE: Delft, the Netherlands, 2010. [Google Scholar]
  41. Peltonen-Sainio, P.; Jauhiainen, L.; Alakukku, L. Stakeholder perspectives for switching from rainfed to irrigated cropping systems at high latitudes. Land Use Policy 2015, 42, 586–593. [Google Scholar] [CrossRef]
  42. Peltonen-Sainio, P.; Jauhiainen, L.; Sorvali, J. Diversity of high-latitude agricultural landscapes and crop rotations: Increased, decreased or back and forth? Agric. Syst. 2017, 154, 25–33. [Google Scholar] [CrossRef]
  43. Lihatiedotus ry Lihan tuonti ja vienti. Available online: http://www.lihatiedotus.fi/liha-tilastoissa/lihan-tuonti-ja-vienti.html (accessed on 10 March 2018).
  44. Fogelholm, M.; Hakala, P.; Kara, R.; Kiuru, S.; Kurppa, S.; Kuusipalo, H.; Laitinen, J.; Marjaniemi, A.; Misikangas, M.; Roo, E.; et al. Suomalaiset Ravitsemussuositukset; Valtion Ravitsemusneuvottelukunta: Tampere, Finland, 2014; p. 60. [Google Scholar]
  45. Mithril, C.; Dragsted, L.O.; Meyer, C.; Blauert, E.; Holt, M.K.; Astrup, A. Guidelines for the New Nordic Diet. Public Health Nutr. 2012, 15, 1941–1947. [Google Scholar] [CrossRef] [PubMed] [Green Version]
  46. World Health Organization (WHO). Diet, Nutrition, and the Prevention of Chronic Diseases: Report of a WHO-FAO Expert Consultation; WHO Technical Report Series; World Health Organization: Geneva, Switzerland, 2003; ISBN 978-92-4-120916-8. [Google Scholar]
  47. MMM Food2030. Government Report on Food Policy. Finland Feed Us and the World; Ministry of Agriculture and Foresty of Finland: Helsinki, Finland, 2017; p. 42. [Google Scholar]
  48. Huuskonen, A.; Natural Resources Institute Finland; Niskanen, O.; Natural Resources Institute Finland. Feed requirements for Finnish cattle. Personal communication, 16 June 2016. [Google Scholar]
  49. Seppälä, A.; Pellervo, K.; Lehtonen, H.; Aro-Heinilä, E.; Niemeläinen, O.; Oiva, E.; Höhn, J.; Salo, T.; Keskitalo, M.; Nysand, M.; et al. Biogas from Grass for Traffic Fuel; MTT Raportti 151; MTT Maa-ja Elintarviketalouden Tutkimuskeskus; Maa- ja elintarviketalouden tutkimuskeskus (MTT): Jokioinen, Finland, 2014. [Google Scholar]
  50. OSF Utilised Agricultural Area. Available online: http://stat.luke.fi/en/utilised-agricultural-area (accessed on 17 September 2018).
  51. Cederberg, C.; Stadig, M. System expansion and allocation in life cycle assessment of milk and beef production. Int. J. Life Cycle Assess. 2003, 8, 350–356. [Google Scholar] [CrossRef]
  52. OSF Meat Production. Available online: http://stat.luke.fi/en/meat-production (accessed on 17 September 2018).
  53. Peltonen-Sainio, P.; Hannukkala, A.; Huusela-Veistola, E.; Voutila, L.; Niemi, J.; Valaja, J.; Jauhiainen, L.; Hakala, K. Potential and realities of enhancing rapeseed- and grain legume-based protein production in a northern climate. J. Agric. Sci. 2013, 151, 303–321. [Google Scholar] [CrossRef]
  54. Peltonen-Sainio, P.; Jauhiainen, L.; Lehtonen, H. Land Use, Yield and Quality Changes of Minor Field Crops: Is There Superseded Potential to Be Reinvented in Northern Europe? PLoS ONE 2016, 11, e0166403. [Google Scholar] [CrossRef]
  55. Nakamichi, N. Adaptation to the Local Environment by Modifications of the Photoperiod Response in Crops. Plant Cell Physiol. 2015, 56, 594–604. [Google Scholar] [CrossRef] [PubMed]
  56. OSF Yield of the Main Crops. Available online: http://statdb.luke.fi/PXWeb/pxweb/en/LUKE/LUKE__02%20Maatalous__04%20Tuotanto__14%20Satotilasto/01_Viljelykasvien_sato.px/?rxid=001bc7da-70f4-47c4-a6c2-c9100d8b50db (accessed on 12 October 2018).
  57. AgroScope Swiss Feed Database. Available online: www.feedbase.ch (accessed on 8 March 2018).
  58. Vanham, D.; Hoekstra, A.Y.; Bidoglio, G. Potential water saving through changes in European diets. Environ. Int. 2013, 61, 45–56. [Google Scholar] [CrossRef] [PubMed]
  59. FAOSTAT Food Balance Sheets. Available online: http://www.fao.org/faostat/en/#data/FBS (accessed on 24 September 2018).
  60. FAOSTAT Crops. Available online: http://www.fao.org/faostat/en/#data/QC (accessed on 16 November 2018).
  61. Hoekstra, A.Y.; Chapagain, A.K.; Aldaya, M.M.; Mekonnen, M.M. The Water Footprint Assessment Manual: Setting the Global Standard; Earthscan: London, UK; Washington, DC, USA, 2011; ISBN 978-1-84971-279-8. [Google Scholar]
  62. Olesen, J.E.; Trnka, M.; Kersebaum, K.C.; Skjelvåg, A.O.; Seguin, B.; Peltonen-Sainio, P.; Rossi, F.; Kozyra, J.; Micale, F. Impacts and adaptation of European crop production systems to climate change. Eur. J. Agron. 2011, 34, 96–112. [Google Scholar] [CrossRef]
  63. Olesen, J.E.; Bindi, M. Consequences of climate change for European agricultural productivity, land use and policy. Eur. J. Agron. 2002, 16, 239–262. [Google Scholar] [CrossRef]
  64. Knuuttila, M.; Vatanen, E. Elintarvikemarkkinoiden Tuontiriippuvuus; Natural Resources Institute: Helsinki, Finland, 2015; p. 49. [Google Scholar]
  65. Niemi, J.; Knuuttila, M.; Liesivaara, P.; Vatanen, E. Suomen ruokaturvan ja elintarvikehuollon nykytila ja tulevaisuuden näkymät (Finland’s Food Security and Maintenance and Supply Security: The Current Situation and Future Prospects); MTT Raportti 80; Maa- ja elintarviketalouden tutkimuskeskus (MTT): Jokioinen, FInland, 2013; p. 67. [Google Scholar]
  66. Niemi, J.; Liesivaara, P.; Lehtonen, H.; Huan-Niemi, E.; Kettunen, L.; Kässi, P.; Toikkanen, H. EU:n yhteinen maatalouspolitiikka vuosina 2014–2020 ja Suomen maatalous (EU’s Common Agricultural Policy during 2014–2020 and Finnish Agriculture); MTT Raportti 130; Maa- ja elintarviketalouden tutkimuskeskus (MTT): Jokioinen, Finland, 2014; p. 65. [Google Scholar]
  67. Irz, X.; Lin, L.; Thirtle, C.; Wiggins, S. Agricultural Productivity Growth and Poverty Alleviation. Dev. Policy Rev. 2001, 19, 449–466. [Google Scholar] [CrossRef]
  68. Swinnen, J.F.M.; Vandeplas, A. Market power and rents in global supply chains: Market power and rents in global supply chains. Agric. Econ. 2010, 41, 109–120. [Google Scholar] [CrossRef]
  69. Vanham, D.; Mekonnen, M.M.; Hoekstra, A.Y. The water footprint of the EU for different diets. Ecol. Indic. 2013, 32, 1–8. [Google Scholar] [CrossRef]
  70. Schösler, H.; de Boer, J.; Boersema, J.J. Can we cut out the meat of the dish? Constructing consumer-oriented pathways towards meat substitution. Appetite 2012, 58, 39–47. [Google Scholar] [CrossRef] [Green Version]
  71. Hyry, J. Resurssiviisas Kansalainen; The Finnish Innovation Fund Sitra: Helsinki, Finland, 2017; p. 55. [Google Scholar]
  72. Crépon, K.; Marget, P.; Peyronnet, C.; Carrouée, B.; Arese, P.; Duc, G. Nutritional value of faba bean (Vicia faba L.) seeds for feed and food. Field Crops Res. 2010, 115, 329–339. [Google Scholar] [CrossRef]
  73. Jezierny, D.; Mosenthin, R.; Bauer, E. The use of grain legumes as a protein source in pig nutrition: A review. Anim. Feed Sci. Technol. 2010, 157, 111–128. [Google Scholar] [CrossRef]
  74. Vanhatalo, A.; Ahvenjärvi, S.; Jaakkola, S. Metabolic and production responses in dairy cows fed peas or rapeseed meal on grass silage based diet. J. Anim. Feed Sci. 2004, 13, 231–234. [Google Scholar] [CrossRef] [Green Version]
  75. Huuskonen, A.; Khalili, H.; Joki-Tokola, E. Effects of three different concentrate proportions and rapeseed meal supplement to grass silage on animal performance of dairy-breed bulls with TMR feeding. Livest. Sci. 2007, 110, 154–165. [Google Scholar] [CrossRef]
  76. Mekonnen, M.M.; Hoekstra, A.Y. A Global Assessment of the Water Footprint of Farm Animal Products. Ecosystems 2012, 15, 401–415. [Google Scholar] [CrossRef] [Green Version]
  77. Yang, H.; Zehnder, A. “Virtual water”: An unfolding concept in integrated water resources management: OPINION. Water Resour. Res. 2007, 43. [Google Scholar] [CrossRef]
  78. Niemi, J.; Väre, M. Suomen maa- ja elintarviketalous 2016/2017; Luonnonvara- ja biotalouden tutkimus 17/2017; Natural Resources Institute Finland: Helsinki, Finland, 2017; p. 88. [Google Scholar]
  79. Niemi, J.; Väre, M. Suomen maa- ja elintarviketalous 2018; Luonnonvara- ja biotalouden tutkimus 34/2018; Natural Resources Institute Finland: Helsinki, Finland, 2018; p. 98. [Google Scholar]
  80. Hoekstra, A. The Relation between International Trade and Freshwater Scarcity; WTO Staff Working Paper; World Trade Organization: Geneva, Switzerland, 2010. [Google Scholar]
  81. Hooda, P.S.; Edwards, A.C.; Anderson, H.A.; Miller, A. A review of water quality concerns in livestock farming areas. Sci. Total Environ. 2000, 250, 143–167. [Google Scholar] [CrossRef]
  82. Kuusisto, E. Veden kierto, hydrologinen palvelu Suomessa 1908–2008 = The Water Cycle, Hydrological Service in Finland 1908–2008; Suomen ympäristökeskus: Hämeenlinna, Finland, 2008; ISBN 978-952-11-3128-8. [Google Scholar]
  83. Silander, J.; Järvinen, E.A. Vuosien 2002–2003 poikkeuksellisen kuivuuden vaikutukset; Suomen ympäristö; Edita Prima Oy: Helsinki, Finland, 2004; ISBN 952-11-1842-3. [Google Scholar]
  84. Peltonen-Sainio, P.; Laurila, H.; Jauhiainen, L.; Alakukku, L. Proximity of waterways to Finnish farmlands and associated characteristics of regional land use. Agric. Food Sci. 2015, 24, 24–38. [Google Scholar] [CrossRef]
  85. Hietala, S.; Pulkkinen, H.; Järvenranta, K.; Virkajärvi, P.; Huuskonen, A.; Nousiainen, J. Mitigating environmental impacts of beef production—Scenario comparison. In Proceedings of the Global Food Challenges towards Sustainable Consumption and Production, Bangkok, Thailand, 17–19 October 2018; pp. 257–260. [Google Scholar]
  86. Rankinen, K.; Gao, G.; Granlund, K.; Grönroos, J.; Vesikko, L. Comparison of impacts of human activities and climate change on water quantity and quality in Finnish agricultural catchments. Landsc. Ecol. 2015, 30, 415–428. [Google Scholar] [CrossRef] [Green Version]
  87. Fleming-Lehtinen, V.; Andersen, J.H.; Carstensen, J.; Łysiak-Pastuszak, E.; Murray, C.; Pyhälä, M.; Laamanen, M. Recent developments in assessment methodology reveal that the Baltic Sea eutrophication problem is expanding. Ecol. Indic. 2015, 48, 380–388. [Google Scholar] [CrossRef] [Green Version]
  88. HELCOM Ecosystems Health of the Baltic Sea. HELCOM Initial Holistic Assessment; Helsinki Commission, Baltic Marine Environment Protection Commission: Helsinki, Finland, 2010; p. 63. [Google Scholar]
  89. Desjardins, R.; Worth, D.; Vergé, X.; Maxime, D.; Dyer, J.; Cerkowniak, D. Carbon Footprint of Beef Cattle. Sustainability 2012, 4, 3279–3301. [Google Scholar] [CrossRef] [Green Version]
  90. Johnson, D.; Phetteplace, H.V.; Seidl, A.F.; Schneider, U.A.; McCarl, B.A. Management Variations for U.S. Beef Production Systems: Effects on Greenhouse Gas Emissions and Profitability; China Coal Information Institute: Beijing, China, 2003; pp. 953–961. [Google Scholar]
  91. Pelletier, N.; Pirog, R.; Rasmussen, R. Comparative life cycle environmental impacts of three beef production strategies in the Upper Midwestern United States. Agric. Syst. 2010, 103, 380–389. [Google Scholar] [CrossRef]
  92. Cederberg, C.; Persson, U.M.; Neovius, K.; Molander, S.; Clift, R. Including Carbon Emissions from Deforestation in the Carbon Footprint of Brazilian Beef. Environ. Sci. Technol. 2011, 45, 1773–1779. [Google Scholar] [CrossRef] [PubMed]
Figure 1. Flowchart of the study. Finland’s vast and underused natural resources create the baseline for this study (Step 1). The calculation is divided into separate assessments of cattle production and cattle products consumption in Finland (Steps 2–4). Cattle production and feed use scenarios are combined (Step 5) and turned into virtual water to calculate the potential net exports (Step 6). 1 Data for ProAgria is based on a personal communication with professor A. Huuskonen (Natural Resources Institute Finland) and researcher O. Niskanen (Natural Resources Institute Finland) 16 June 2016 [48].
Sustainability 11 01075 g001
Figure 2. Cattle production and different agricultural land uses in Finland that are relevant to our study [50,56]: UUSI, Uusimaa; VARS, Varsinais-Suomi; SATA, Satakunta; HÄME, Häme; PIRKA, Pirkanmaa; KAAK, Kaakkois-Suomi; ESAVO, Etelä-Savo; PASAVO, Pohjois-Savo; PKARJ, Pohjois-Karjala; KESKI, Keski-Suomi; EPO, Etelä-Pohjanmaa; POHJ, Pohjanmaa; PPO, Pohjois-Pohjanmaa; KAIN, Kainuu; LAPP, Lappland; ARCH, Archipelago (Åland Islands).
Sustainability 11 01075 g002
Figure 3. Land use for different cattle production scenarios. The domestic part of the analysis demonstrates how the different cattle feed and VegSubPro requirements change the land use (with the total land use being constant at 2,238,000 ha and the ‘other crops’ specify the other agricultural production). The outsourced land use assessment presents how much external land use the cattle feed and VegSubPro imports require. Due to the rounding, not all percentages add up to 100%.
Sustainability 11 01075 g003
Figure 4. Finland’s potential to net export virtual water in combinations of scenarios for cattle production and domestic diet change. Bars indicate the product-specific imports (negative values) and exports (positive values), while the line represents total net exports (exports–imports). The estimation of how many global citizens could be provided with annual virtual water for food production is given as a number on top of the line (in million people).
Sustainability 11 01075 g004
Table 1. Cattle production scenarios (BaseCattle, MoreDomestic, FullDomestic, Roughage), including the assumptions for land use and feed trade.
LimitationsAssumptions
Cattle production scenariosBaseCattleMoreDomesticFullDomesticRoughage
Underutilized agricultural landNon-productive/biodiversityLeys/RapeseedLeys/RapeseedLeys
Availability of cereal feed (for cattle)CurrentCurrent or increasedCurrent or increasedCurrent or increased
Rapeseed imports allowedCurrentImports allowed No importsGrowth allowed
Soybeans imports allowedCurrentNo importsNo importsGrowth allowed
Soybeans replaced with rapeseed NoYesYesNo
Table 2. Finland’s international net trade of bovine meat under the diet change scenarios (BaseBeef, Beef50%, and Beef0%), milk, as well as for cattle feeds (cereals, rapeseed, soybeans) and vegetable substitutive protein (VegSubPro) in different cattle productions scenarios (BaseCattle, MoreDomestic, FullDomestic and Roughage). The net trade is calculated at Finland’s border, and negative values indicate imports and positive values indicate exports.
ProductBaseCattleMoreDomesticFullDomesticRoughageUnit
BaseBeef
Bovine meat −19,30016,50016,50092,400tons year−1
Soybeans (VegSubPro)0000tons year−1
Beef50%
Bovine meat 22,40048,50048,500124,500tons year−1
Soybeans (VegSubPro)4300430043004300tons year−1
Beef0%
Bovine meat 64,10099,90099,900175,800tons year−1
Soybeans (VegSubPro)8600860086008600tons year−1
Milk 0 975,200975,2003,139,800tons year−1
Feed
Cereal607,400372,900372,900275,400tons year−1
Rapeseed −258,500−222,3000−705,300tons year−1
Soybeans −39,7000 0−93,000tons year−1
Table 3. Challenges in reallocating water-intensive production (Fader et al., 2011) contrasted to the current situation in Finland, and against global impact.
Challenges in Reallocating Water-Intensive Production by Fader et al. 2011Situation in Finland Based on Our Research and Cited LiteratureGlobal Impact Based on Our Research and Cited Literature
Importers would increase their dependency on other countries [12].Finland already imports around a third of its consumed food [64], but the increased cattle production exports could act as a buffer against certain global shocks.Population growth and meat consumption are increasing rapidly, and therefore water-scarce countries could focus on growing less water-intensive products (e.g., vegetarian protein) [39,76], that can be used for animal and human consumption. Finland’s exports could then only meet the increased demand for cattle products.
Many countries do not have the financial means to import the goods they would need, and are already today involuntarily out of the virtual land and water markets [77].Finnish primary production has high expenses, due to the climatic constraints, and the country is very dependent on subsidies [78].Due to the high productions cost [79], Finnish cattle products might not be accessible in the countries that would benefit most of the virtual water embedded in the trade.
Increasing imports, especially in countries with poorly developed rural infrastructure, could favour urban consumers, while putting pressure on the domestic agricultural sector, causing rural poverty and rural-urban migration [16].Finnish agriculture is going through structural changes [66], and increasing cattle production would empower agriculture and enrich the landscape.Our study focused only on the environmental aspect, and excluded the social and economic viewpoints. These should be studied in detail, together with needed legislation and political will, to understand the potential of our scenarios fully.
Increasing exports could lead to increasing deforestation and land and water contamination [80].Even though the quantity of fresh water is not the limiting factor to increased cattle production in Finland [33], quality problems, such as increased pollutants and nutrient leaching [81], still need to be taken into consideration. Quantifying net global environmental impacts would require an analysis of the impacts of increased production in exporting locations and impacts of reduced production in importing locations.
High water and land productivities are frequently linked to high input use (fertilizers, pesticides), potentially leading to high pollution rates if not properly regulated [77].Regulation and sustainable agricultural practices are needed to guide farmers and consumers towards more sustainable production and consumption. There is a potential to increase production in current areas with an inefficient production by closing the yield gap and by integrated farm water management [23], and therefore optimizing water savings on water-stressed locations would be beneficial.

