Development of Damage Prediction Formula for Natural Disasters Considering Economic Indicators


Abstract
:1. Introduction
2. Literature Review
3. Methods
3.1. Multiple Regression Analysis
3.2. Correlation Analysis
4. Materials
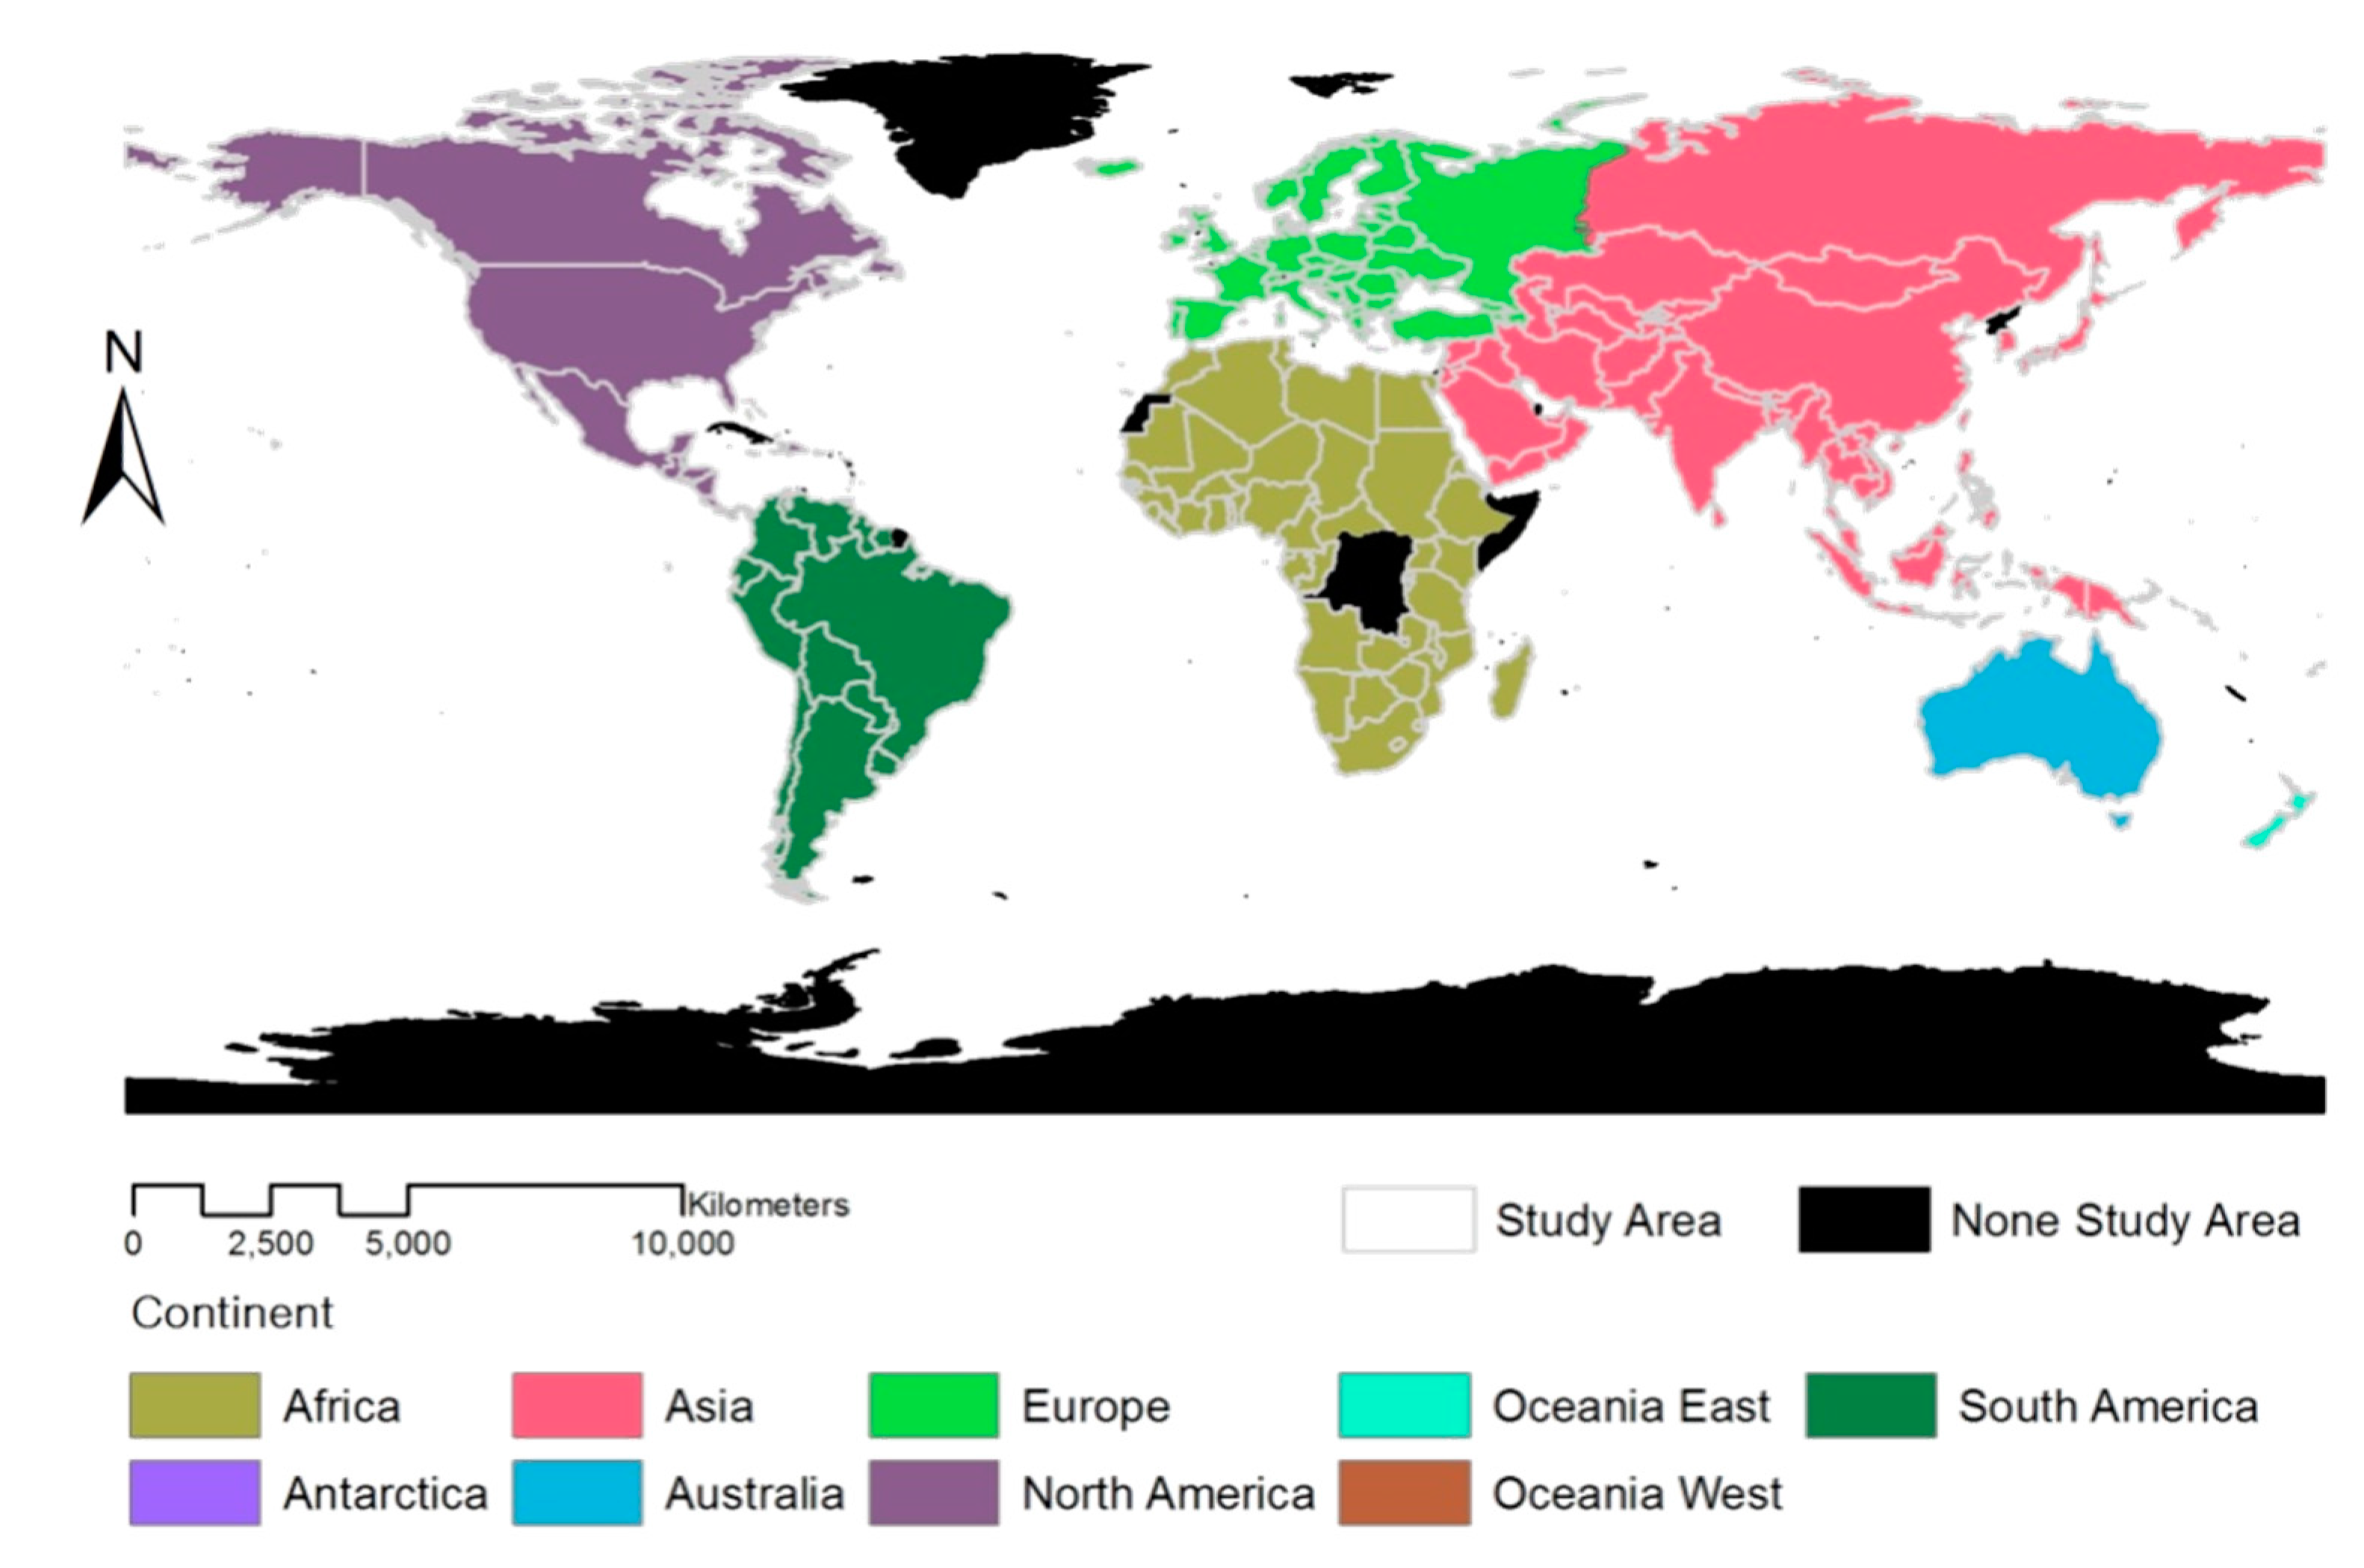
4.1. Study Area
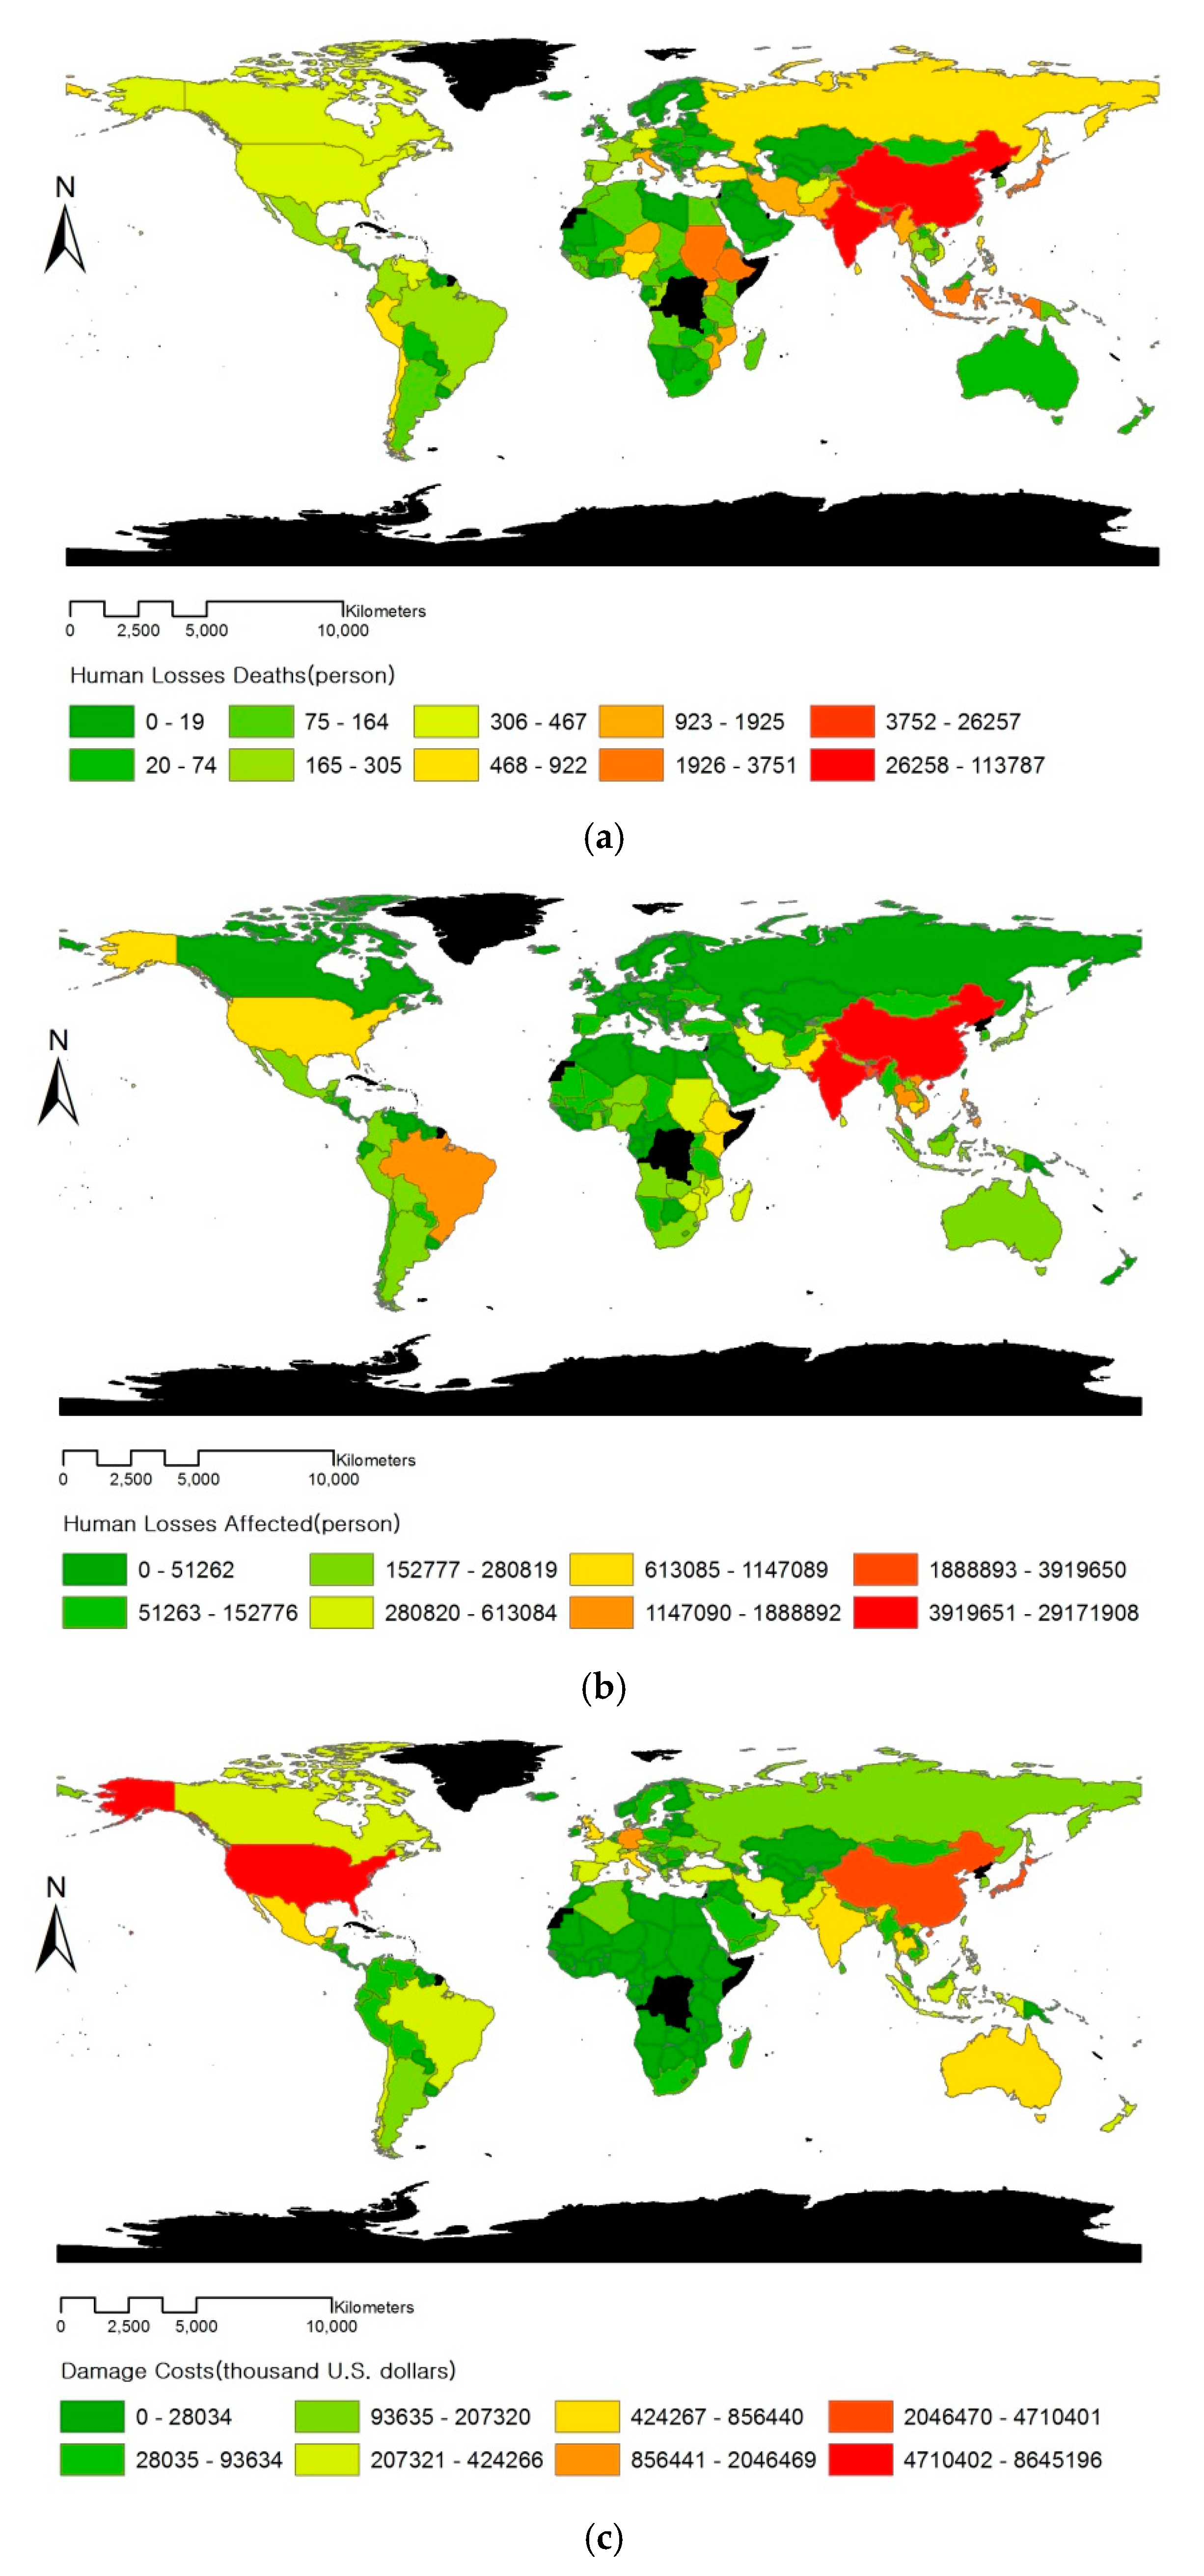
4.2. Damage Status of Natural Disasters
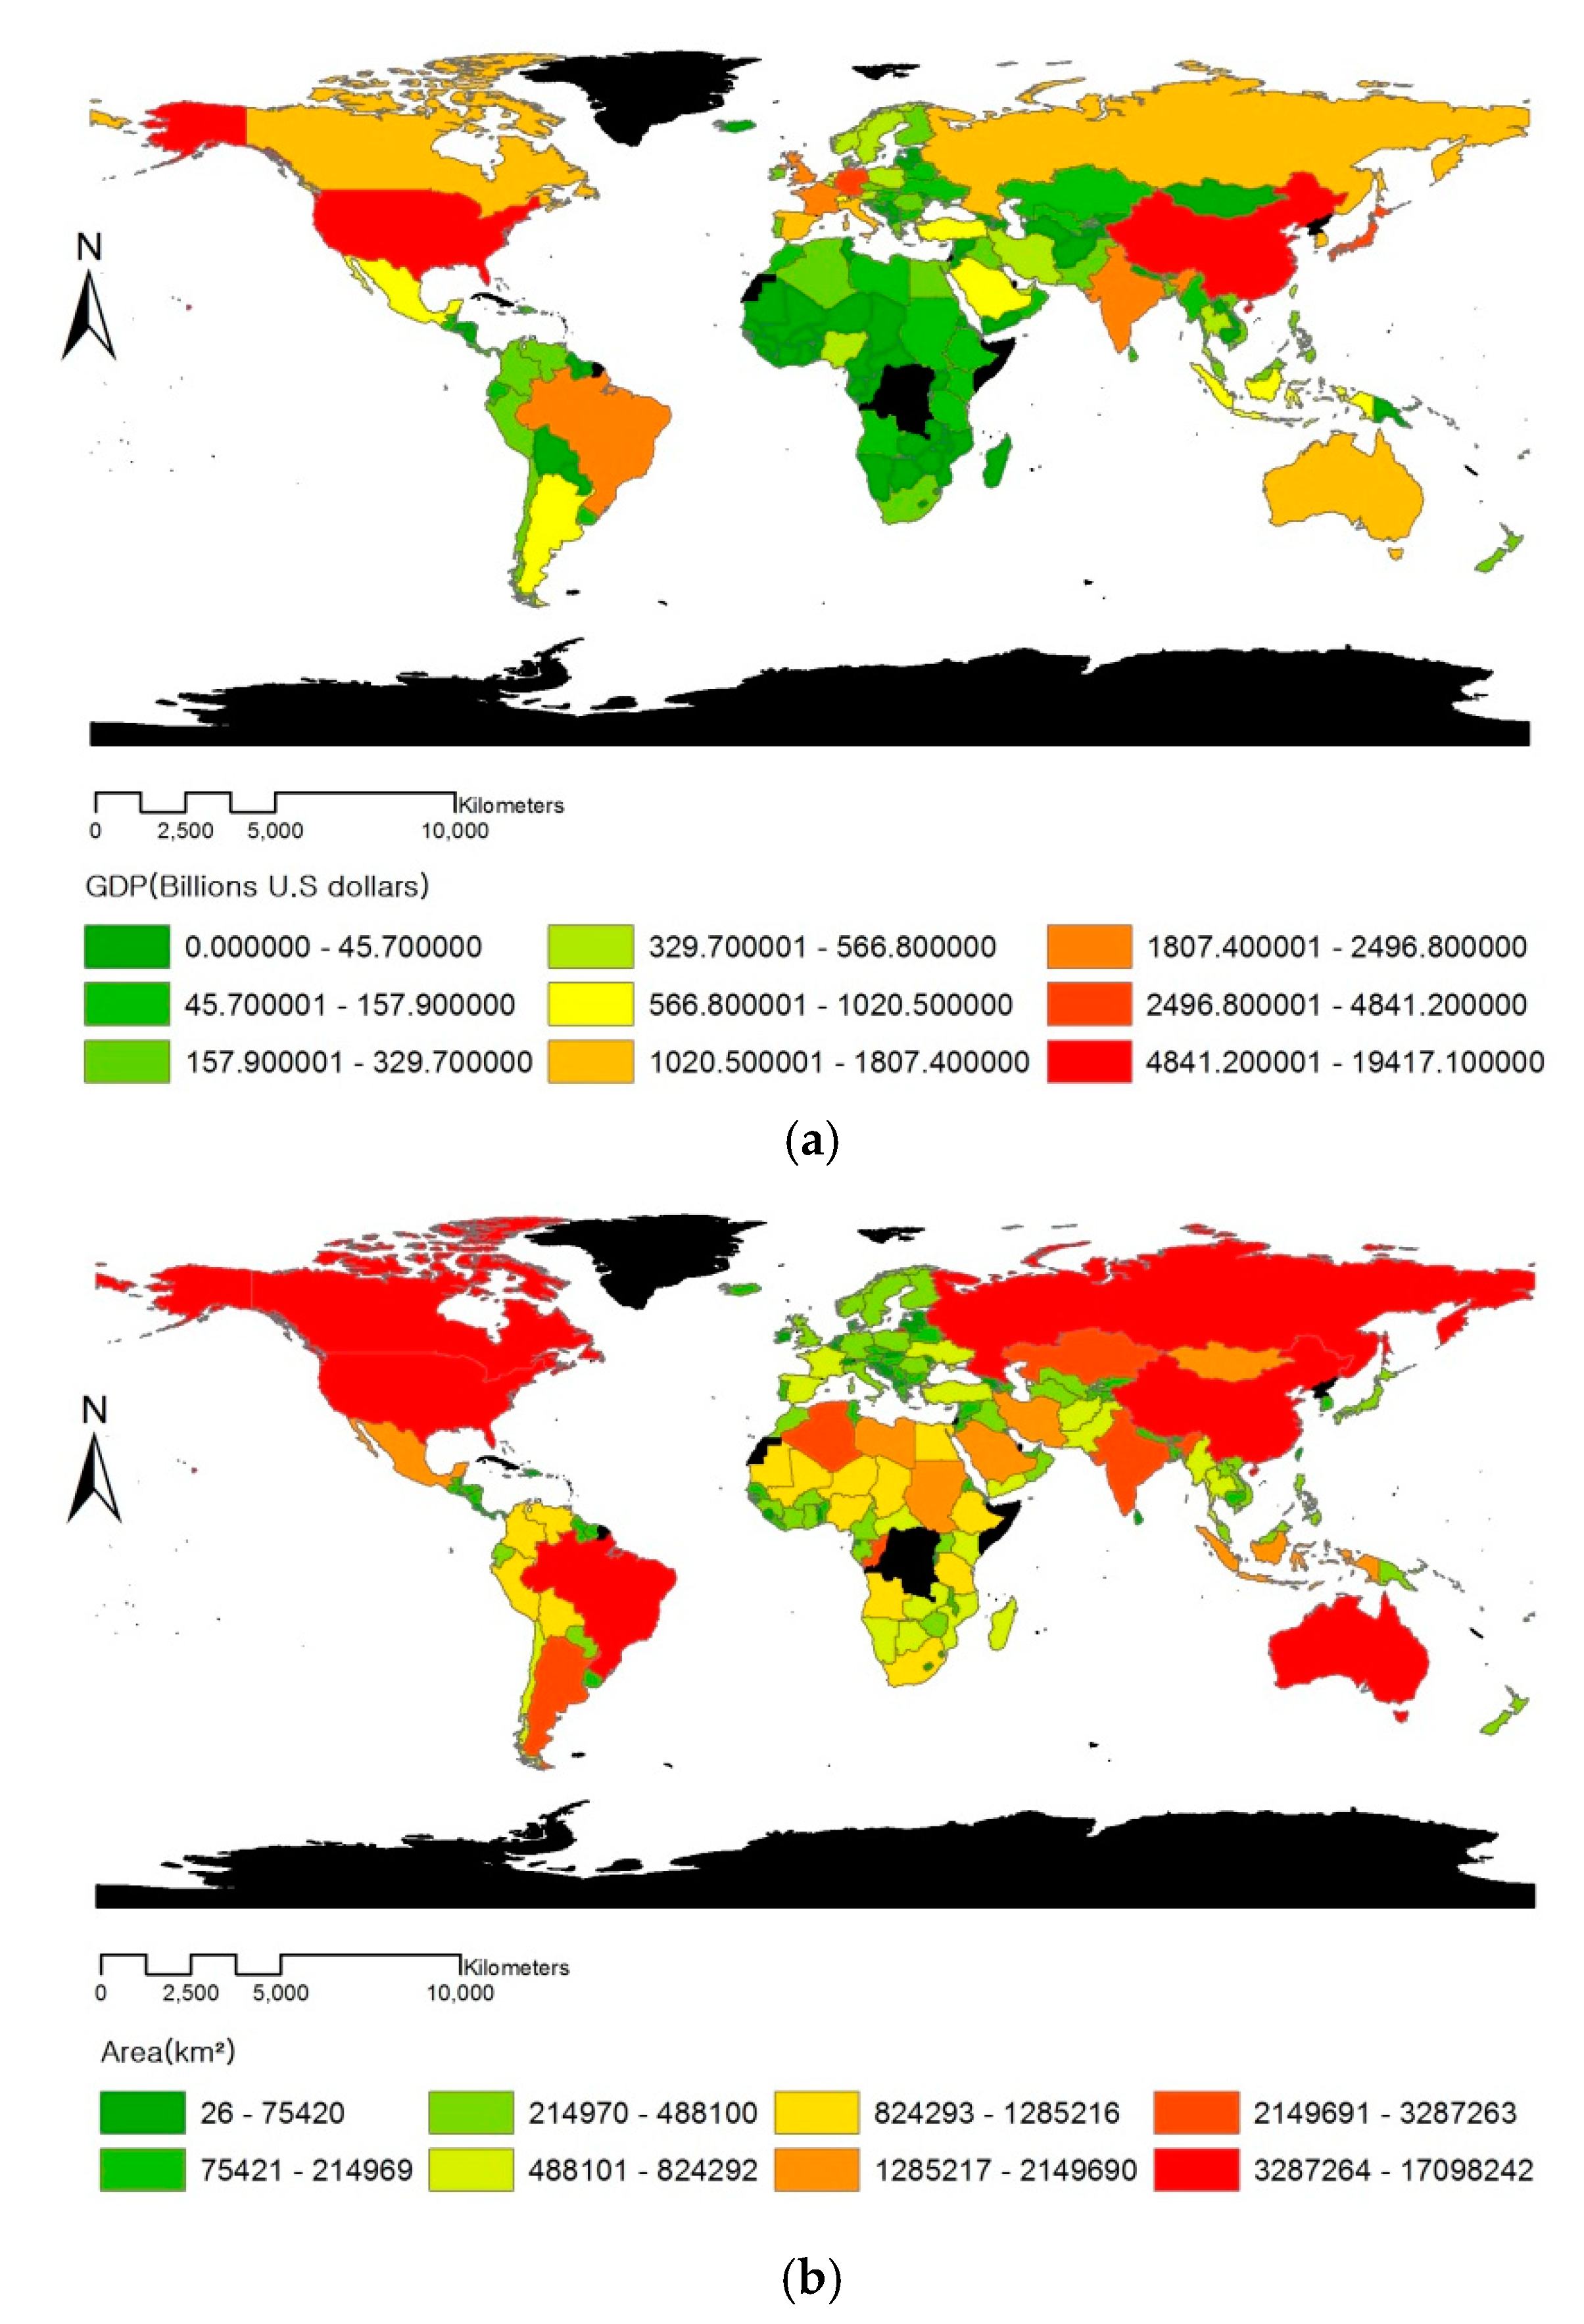
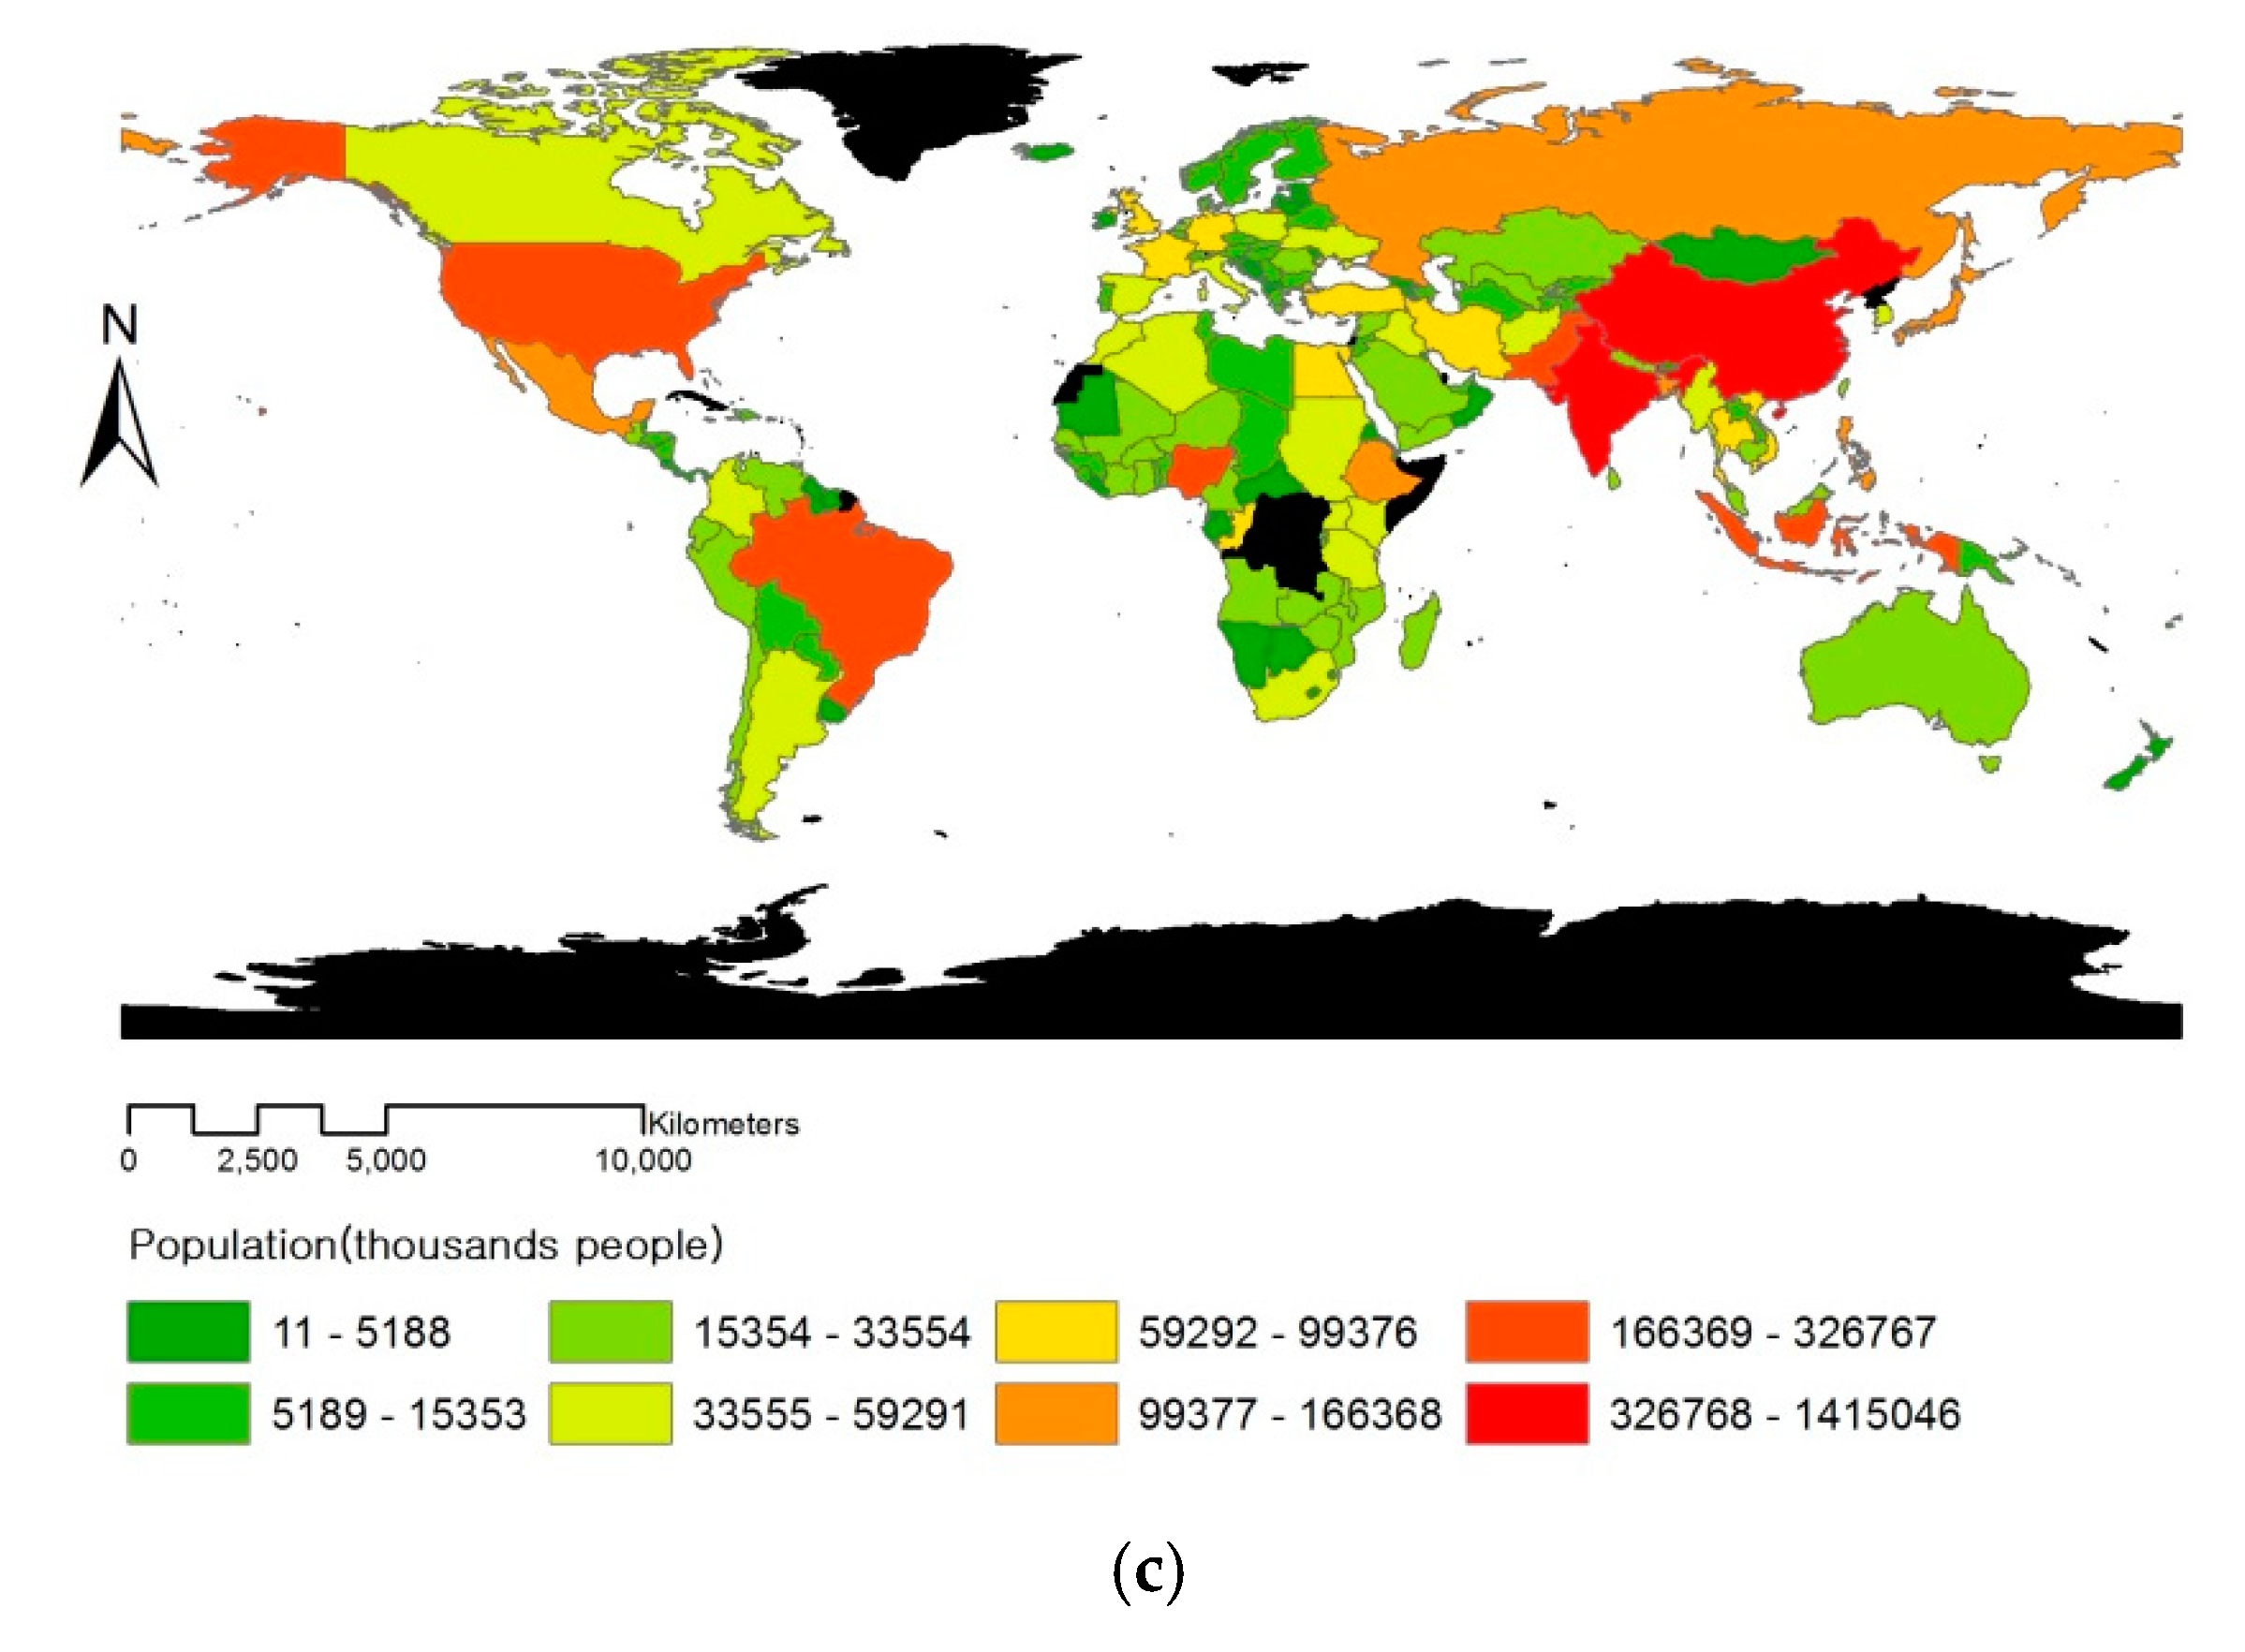
4.3. Indicators’ Status by Country
5. Results
5.1. Correlation Analysis
5.2. Development of Damage Prediction Equation Considering Human Damage
5.3. Development of Damage Prediction Equation Considering Damage Costs
6. Discussion
7. Conclusions
Author Contributions
Funding
Acknowledgments
Conflicts of Interest
Appendix A

| No | Country | No | Country | No | Country | No | Country | No | Country |
|---|---|---|---|---|---|---|---|---|---|
| 1 | Afghanistan | 39 | Cote d’Ivoire | 77 | Iran | 115 | Myanmar | 153 | South Africa |
| 2 | Albania | 40 | Croatia | 78 | Iraq | 116 | Namibia | 154 | South Sudan |
| 3 | Algeria | 41 | Cyprus | 79 | Ireland | 117 | Nepal | 155 | Spain |
| 4 | Angola | 42 | Czech Republic | 80 | Israel | 118 | Netherlands | 156 | Sri Lanka |
| 5 | Antigua and Barbuda | 43 | Democratic Republic of the Congo | 81 | Italy | 119 | New Zealand | 157 | Sudan |
| 6 | Argentina | 44 | Denmark | 82 | Jamaica | 120 | Nicaragua | 158 | Suriname |
| 7 | Armenia | 45 | Djibouti | 83 | Japan | 121 | Niger | 159 | Swaziland |
| 8 | Australia | 46 | Dominica | 84 | Jordan | 122 | Nigeria | 160 | Sweden |
| 9 | Austria | 47 | Dominican Republic | 85 | Kazakhstan | 123 | Norway | 161 | Switzerland |
| 10 | Azerbaijan | 48 | Ecuador | 86 | Kenya | 124 | Oman | 162 | Syria |
| 11 | Bahamas | 49 | Egypt | 87 | Kiribati | 125 | Pakistan | 163 | Taiwan |
| 12 | Bahrain | 50 | El Salvador | 88 | Korea | 126 | Palau | 164 | Tajikistan |
| 13 | Bangladesh | 51 | Equatorial Guinea | 89 | Kuwait | 127 | Panama | 165 | Tanzania |
| 14 | Barbados | 52 | Eritrea | 90 | Kyrgyzstan | 128 | Papua New Guinea | 166 | Thailand |
| 15 | Belarus | 53 | Estonia | 91 | Lao People’s Democratic Republic | 129 | Paraguay | 167 | Timor-Leste |
| 16 | Belgium | 54 | Ethiopia | 92 | Latvia | 130 | Peru | 168 | Togo |
| 17 | Belize | 55 | Fiji | 93 | Lebanon | 131 | Philippines | 169 | Tonga |
| 18 | Benin | 56 | Finland | 94 | Lesotho | 132 | Poland | 170 | Trinidad and Tobago |
| 19 | Bhutan | 57 | France | 95 | Liberia | 133 | Portugal | 171 | Tunisia |
| 20 | Bolivia | 58 | FYR Macedonia | 96 | Libya | 134 | Puerto Rico | 172 | Turkey |
| 21 | Bosnia and Herzegovina | 59 | Gabon | 97 | Lithuania | 135 | Republic of Congo | 173 | Turkmenistan |
| 22 | Botswana | 60 | Gambia | 98 | Luxembourg | 136 | Romania | 174 | Tuvalu |
| 23 | Brazil | 61 | Georgia | 99 | Macao | 137 | Russian Federation | 175 | Uganda |
| 24 | Brunei Darussalam | 62 | Germany | 100 | Madagascar | 138 | Rwanda | 176 | Ukraine |
| 25 | Bulgaria | 63 | Ghana | 101 | Malawi | 139 | Saint Kitts and Nevis | 177 | United Arab Emirates |
| 26 | Burkina Faso | 64 | Greece | 102 | Malaysia | 140 | Saint Lucia | 178 | United Kingdom |
| 27 | Burundi | 65 | Grenada | 103 | Maldives | 141 | Saint Vincent and the Grenadines | 179 | United States of America |
| 28 | Cabo Verde | 66 | Guatemala | 104 | Mali | 142 | Samoa | 180 | Uruguay |
| 29 | Cambodia | 67 | Guinea | 105 | Marshall Islands | 143 | Sao Tome and Principe | 181 | Uzbekistan |
| 30 | Cameroon | 68 | Guinea-Bissau | 106 | Mauritania | 144 | Saudi Arabia | 182 | Vanuatu |
| 31 | Canada | 69 | Guyana | 107 | Mauritius | 145 | Senegal | 183 | Venezuela |
| 32 | Central African Republic | 70 | Haiti | 108 | Mexico | 146 | Serbia | 184 | Vietnam |
| 33 | Chad | 71 | Honduras | 109 | Micronesia | 147 | Seychelles | 185 | Yemen |
| 34 | Chile | 72 | Hong Kong SAR | 110 | Moldova | 148 | Sierra Leone | 186 | Zambia |
| 35 | China | 73 | Hungary | 111 | Mongolia | 149 | Singapore | 187 | Zimbabwe |
| 36 | Colombia | 74 | Iceland | 112 | Montenegro | 150 | Slovakia | ||
| 37 | Comoros | 75 | India | 113 | Morocco | 151 | Slovenia | ||
| 38 | Costa Rica | 76 | Indonesia | 114 | Mozambique | 152 | Solomon Islands |
| Country Name | GDP (Billions) | Area (km²) | Population (thousands people) | Human Losses Deaths (person) | Human Losses Affected (person) | Damage Costs (thousand U.S. dollars) |
|---|---|---|---|---|---|---|
| Afghanistan | 20.6 | 652,230 | 36,373 | 380 | 151,400 | 9,426.9 |
| Albania | 12.3 | 28,748 | 2,934 | 4 | 81,879 | 658.3 |
| Algeria | 173.9 | 2,381,741 | 42,008 | 109 | 21,389 | 109,396.7 |
| Angola | 122.4 | 1,246,700 | 30,774 | 164 | 195,955 | 324.3 |
| Antigua and Barbuda | 1.5 | 443 | 103 | 0 | 1866 | 11,670.6 |
| Argentina | 628.9 | 2,780,400 | 44,689 | 157 | 203,752 | 156,586.6 |
| Armenia | 10.7 | 29,743 | 2934 | 0 | 19,795 | 10,072.7 |
| Australia | 1,359.7 | 7,741,220 | 24,772 | 28 | 205,784 | 667,795.9 |
| Austria | 383.5 | 83,871 | 8752 | 12 | 1100 | 100,348.0 |
| Azerbaijan | 38.6 | 86,600 | 9924 | 4 | 143,071 | 11,733.3 |
| Bahamas | 9.2 | 13,880 | 399 | 1 | 447 | 36,359.8 |
| Bahrain | 34.3 | 760 | 1,567 | 111 | 0 | 0.0 |
| Bangladesh | 248.9 | 148,460 | 166,368 | 26,257 | 3,919,650 | 173,796.3 |
| Barbados | 4.8 | 430 | 286 | 1 | 173 | 1701.6 |
| Belarus | 54.7 | 207,600 | 9452 | 3 | 6384 | 7107.2 |
| Belgium | 462.7 | 30,528 | 11,499 | 24 | 127 | 20,361.5 |
| Belize | 1.8 | 22,966 | 382 | 22 | 3,913 | 7,436.1 |
| Benin | 8.8 | 112,622 | 11,486 | 33 | 115,689 | 190.8 |
| Bhutan | 2.3 | 38,394 | 817 | 11 | 3236 | 129.6 |
| Bolivia | 39.3 | 1,098,581 | 11,216 | 42 | 164,184 | 72,648.4 |
| Bosnia and Herzegovina | 16.8 | 51,197 | 3504 | 3 | 83,186 | 48,328.2 |
| Botswana | 15.6 | 581,730 | 2333 | 13 | 29,369 | 982.1 |
| Brazil | 2,140.9 | 8,515,770 | 210,868 | 184 | 1,507,355 | 321,219.7 |
| Brunei Darussalam | 12.3 | 5765 | 434 | 0 | 0 | 2,000.0 |
| Bulgaria | 52.3 | 110,879 | 7037 | 4 | 800 | 16,139.8 |
| Burkina Faso | 12.3 | 274,200 | 19,752 | 160 | 122,876 | 1677.6 |
| Burundi | 3.4 | 27,830 | 11,216 | 29 | 114,809 | 375.0 |
| Cabo Verde | 1.6 | 4033 | 553 | 735 | 769 | 35.3 |
| Cambodia | 21.0 | 181,035 | 16,246 | 82 | 764,997 | 51970.3 |
| Cameroon | 29.5 | 475,440 | 24,678 | 128 | 22,436 | 110.6 |
| Canada | 1,600.3 | 9,984,670 | 36,954 | 451 | 22,675 | 280,353.0 |
| Central African Republic | 2.0 | 622,984 | 4737 | 21 | 5133 | 2.8 |
| Chad | 9.6 | 1,284,000 | 15,353 | 96 | 104,295 | 871.8 |
| Chile | 251.2 | 756,102 | 18,197 | 549 | 111,438 | 367,669.4 |
| China | 11,795.3 | 9,596,960 | 1,415,046 | 113,787 | 29,171,908 | 4,710,401.3 |
| Colombia | 306.4 | 1,138,910 | 49,465 | 305 | 161,920 | 63,968.5 |
| Comoros | 0.7 | 2235 | 832 | 6 | 4,636 | 426.8 |
| Costa Rica | 59.8 | 51,100 | 4953 | 21 | 17,787 | 12,593.4 |
| Cote d’Ivoire | 36.9 | 322,463 | 24,906 | 19 | 732 | 0.0 |
| Croatia | 50.1 | 56,594 | 4165 | 39 | 945 | 38,579.5 |
| Cyprus | 19.6 | 9251 | 1189 | 2 | 107 | 262.5 |
| Czech Republic | 196.1 | 78,867 | 10,625 | 27 | 73,743 | 271,227.8 |
| Democratic Republic of the Congo | 41.1 | 2,344,858 | 84,005 | 213 | 45,146 | 600.0 |
| Denmark | 304.2 | 43,094 | 5754 | 1 | 0 | 136,753.7 |
| Djibouti | 2.1 | 23,200 | 971 | 10 | 55,357 | 168.2 |
| Dominica | 0.5 | 751 | 74 | 24 | 2232 | 25,262.0 |
| Dominican Republic | 76.9 | 48,670 | 10,883 | 66 | 85,847 | 34,029.9 |
| Ecuador | 97.4 | 283,561 | 16,863 | 134 | 46,799 | 51,055.3 |
| Egypt | 236.5 | 1,001,450 | 99,376 | 133 | 4139 | 16,274.7 |
| El Salvador | 27.5 | 21,041 | 6,412 | 66 | 38,967 | 57,869.1 |
| Equatorial Guinea | 11.7 | 28,051 | 1314 | 15 | 946 | 0.0 |
| Eritrea | 6.1 | 117,600 | 5188 | 0 | 351,418 | 322.8 |
| Estonia | 23.4 | 45,228 | 1307 | 1 | 13 | 16,250.0 |
| Ethiopia | 78.4 | 1,104,300 | 107,535 | 3,751 | 725,147 | 13,683.7 |
| Fiji | 4.9 | 18,274 | 912 | 7 | 23,337 | 14,927.1 |
| Finland | 234.5 | 338,145 | 5543 | 0 | 25 | 625.0 |
| France | 2420.4 | 643,801 | 65,233 | 233 | 38,007 | 399,501.8 |
| FYR Macedonia | 11.0 | 25,713 | 2085 | 3 | 51,262 | 16,366.5 |
| Gabon | 14.2 | 267,667 | 2068 | 5 | 4435 | 0.0 |
| Gambia | 1.0 | 11,300 | 2164 | 4 | 13,559 | 6.6 |
| Georgia | 13.7 | 69,700 | 3907 | 3 | 35,518 | 28,034.2 |
| Germany | 3,423.3 | 357,022 | 82,293 | 347 | 20,595 | 2,046,468.9 |
| Ghana | 42.8 | 238,533 | 29,464 | 22 | 221,455 | 1,522.8 |
| Greece | 193.1 | 131,957 | 11,142 | 28 | 11,900 | 145,918.4 |
| Grenada | 1.1 | 344 | 108 | 1 | 1275 | 18,843.8 |
| Guatemala | 70.9 | 108,889 | 17,245 | 728 | 111,744 | 38,176.4 |
| Guinea | 6.9 | 245,857 | 13,053 | 107 | 12,760 | 0.0 |
| Guinea-Bissau | 1.2 | 36,125 | 1907 | 30 | 2,998 | 0.0 |
| Guyana | 3.6 | 214,969 | 782 | 1 | 27,197 | 14,425.5 |
| Haiti | 7.9 | 27,750 | 11,113 | 2293 | 177,206 | 104,567.6 |
| Honduras | 21.8 | 112,090 | 9417 | 277 | 62,888 | 50,328.9 |
| Hong Kong SAR | 332.3 | 1,108 | 7429 | 219 | 1310 | 11,928.1 |
| Hungary | 125.3 | 93,028 | 9689 | 22 | 5349 | 40,841.7 |
| Iceland | 23.0 | 103,000 | 338 | 1 | 152 | 1,868.1 |
| India | 2,454.5 | 3,287,263 | 1,354,052 | 77,390 | 20,345,983 | 789,199.2 |
| Indonesia | 1,020.5 | 1,904,569 | 266,795 | 2,179 | 276,959 | 268,204.8 |
| Iran | 368.5 | 1,648,195 | 82,012 | 1,439 | 411,553 | 225,914.6 |
| Iraq | 189.4 | 438,317 | 39,340 | 3 | 16,610 | 957.8 |
| Ireland | 294.2 | 70,273 | 4,804 | 1 | 179 | 19,372.9 |
| Israel | 340.0 | 20,770 | 8453 | 2 | 44,365 | 31,973.4 |
| Italy | 1,807.4 | 301,340 | 59,291 | 1,247 | 35,632 | 856,440.4 |
| Jamaica | 14.3 | 10,991 | 2899 | 23 | 24,538 | 24,306.1 |
| Japan | 4,841.2 | 377,915 | 127,185 | 2,075 | 167,674 | 3,902,597.5 |
| Jordan | 40.5 | 89,342 | 9904 | 8 | 4675 | 5,307.9 |
| Kazakhstan | 157.9 | 2,724,900 | 18,404 | 9 | 32,066 | 11,422.8 |
| Kenya | 75.1 | 580,367 | 50,951 | 125 | 1,147,089 | 4812.7 |
| Kiribati | 0.2 | 811 | 118 | 0 | 1,974 | 0.0 |
| Korea | 1498.1 | 99,720 | 51,164 | 110 | 83,383 | 199,308.0 |
| Kuwait | 127.0 | 17,818 | 4197 | 0 | 29 | 0.0 |
| Kyrgyzstan | 6.9 | 199,951 | 6133 | 18 | 87,537 | 8375.4 |
| Lao People’s Democratic Republic | 15.0 | 236,800 | 6961 | 28 | 198,207 | 11,107.9 |
| Latvia | 27.8 | 64,589 | 1930 | 7 | 7 | 23,250.0 |
| Lebanon | 53.9 | 10,400 | 6094 | 10 | 18,442 | 2,704.9 |
| Lesotho | 2.4 | 30,355 | 2263 | 3 | 79,869 | 20.4 |
| Liberia | 2.2 | 111,369 | 4854 | 148 | 43,078 | 1,270.3 |
| Libya | 54.4 | 1,759,540 | 6471 | 5 | 29 | 674.3 |
| Lithuania | 42.8 | 65,300 | 2876 | 5 | 37,143 | 14,932.0 |
| Luxembourg | 60.0 | 2,586 | 590 | 6 | 0 | 15,035.7 |
| Macao | 45.7 | 28 | 632 | 0 | 167 | 56,800.0 |
| Madagascar | 10.4 | 587,041 | 26,263 | 100 | 347,624 | 4,6436.0 |
| Malawi | 6.2 | 118,484 | 19,165 | 61 | 613,084 | 8833.1 |
| Malaysia | 309.9 | 329,847 | 32,042 | 27 | 73,918 | 44,322.7 |
| Maldives | 3.6 | 298 | 444 | 10 | 1,928 | 14,885.3 |
| Mali | 14.3 | 1,240,192 | 19,108 | 38 | 67,701 | 0.0 |
| Marshall Islands | 0.2 | 181 | 53 | 0 | 1382 | 196.0 |
| Mauritania | 5.1 | 1,030,700 | 4540 | 2 | 106,530 | 569.4 |
| Mauritius | 12.2 | 2040 | 1268 | 2 | 19,111 | 14,877.3 |
| Mexico | 987.3 | 1,964,375 | 130,759 | 267 | 230,682 | 593,654.0 |
| Micronesia | 0.3 | 702 | 106 | 3 | 5,869 | 583.3 |
| Moldova | 7.4 | 33,851 | 4041 | 5 | 152,776 | 42,114.9 |
| Mongolia | 10.3 | 1,564,116 | 3122 | 25 | 76,182 | 32,789.6 |
| Montenegro | 4.2 | 13,812 | 629 | 0 | 1144 | 0.0 |
| Morocco | 105.6 | 446,550 | 36,192 | 135 | 33,290 | 18,818.0 |
| Mozambique | 11.2 | 799,380 | 30,529 | 1714 | 557,839 | 18,542.7 |
| Myanmar | 72.4 | 676,578 | 53,856 | 1263 | 83,202 | 41,960.5 |
| Namibia | 11.8 | 824,292 | 2,588 | 15 | 90,509 | 5,430.3 |
| Nepal | 23.3 | 147,181 | 29,624 | 394 | 208,241 | 77,751.8 |
| Netherlands | 762.7 | 41,543 | 17,084 | 63 | 8833 | 88,667.2 |
| New Zealand | 198.0 | 268,838 | 4750 | 74 | 6704 | 307,300.4 |
| Nicaragua | 13.7 | 130,370 | 6285 | 154 | 40,911 | 24,553.2 |
| Niger | 7.7 | 1,267,000 | 22,311 | 1700 | 258,194 | 2365.6 |
| Nigeria | 400.6 | 923,768 | 195,875 | 573 | 280,819 | 14,663.8 |
| Norway | 392.0 | 323,802 | 5353 | 1 | 88 | 7407.9 |
| Oman | 71.3 | 309,500 | 4830 | 7 | 807 | 126,146.3 |
| Pakistan | 305.0 | 796,095 | 200,814 | 1925 | 995,626 | 308,793.1 |
| Palau | 0.3 | 459 | 22 | 0 | 625 | 0.0 |
| Panama | 59.5 | 75,420 | 4163 | 7 | 6957 | 5825.0 |
| Papua New Guinea | 21.2 | 462,840 | 8418 | 84 | 48,654 | 3104.7 |
| Paraguay | 28.7 | 406,752 | 6897 | 6 | 67,429 | 2843.6 |
| Peru | 207.1 | 1,285,216 | 32,552 | 922 | 221,854 | 60,997.6 |
| Philippines | 329.7 | 300,000 | 106,512 | 619 | 1,888,892 | 233,112.3 |
| Poland | 482.9 | 312,685 | 38,105 | 26 | 4212 | 93,633.9 |
| Portugal | 202.8 | 92,090 | 10,291 | 78 | 4089 | 146,062.2 |
| Puerto Rico | 99.7 | 9104 | 3659 | 15 | 9302 | 717,280.0 |
| Republic of Congo | 8.3 | 342,000 | 5400 | 19 | 4054 | 1.3 |
| Romania | 189.8 | 238,391 | 19,581 | 45 | 18,668 | 55,590.2 |
| Russian Federation | 1560.7 | 17,098,242 | 143,965 | 616 | 44,289 | 112,730.0 |
| Rwanda | 8.9 | 26,338 | 12,501 | 22 | 140,238 | 0.2 |
| Saint Kitts and Nevis | 1.0 | 261 | 56 | 0 | 159 | 7832.2 |
| Saint Lucia | 1.4 | 616 | 180 | 1 | 5476 | 2442.9 |
| Saint Vincent and the Grenadines | 0.8 | 389 | 110 | 15 | 822 | 1622.6 |
| Samoa | 0.8 | 2,831 | 198 | 9 | 7659 | 15,694.8 |
| Sao Tome and Principe | 0.4 | 964 | 209 | 9 | 4148 | 0.0 |
| Saudi Arabia | 707.4 | 2,149,690 | 33,554 | 12 | 606 | 31,518.5 |
| Senegal | 15.4 | 196,722 | 16,294 | 14 | 97,034 | 4,011.5 |
| Serbia | 37.7 | 77,474 | 8762 | 9 | 19,136 | 207,320.2 |
| Seychelles | 1.5 | 455 | 95 | 0 | 1301 | 2050.0 |
| Sierra Leone | 4.1 | 71,740 | 7720 | 156 | 7448 | 781.4 |
| Singapore | 291.9 | 697 | 5792 | 2 | 849 | 0.0 |
| Slovakia | 89.1 | 49,035 | 5450 | 10 | 2829 | 37,409.5 |
| Slovenia | 43.5 | 20,273 | 2081 | 18 | 3936 | 44,235.3 |
| Solomon Islands | 1.2 | 28,896 | 623 | 9 | 5180 | 581.4 |
| South Africa | 317.6 | 1,219,090 | 57,398 | 23 | 219,750 | 55,949.7 |
| South Sudan | 4.8 | 644,329 | 12,919 | 49 | 1,006,103 | 0.0 |
| Spain | 1232.4 | 505,370 | 46,397 | 266 | 105,370 | 424,266.1 |
| Sri Lanka | 84.0 | 65,610 | 20,950 | 655 | 502,821 | 73,366.6 |
| Sudan | 115.9 | 1,861,484 | 41,512 | 2096 | 443,066 | 7156.4 |
| Suriname | 3.6 | 163,820 | 568 | 0 | 904 | 1.3 |
| Swaziland | 3.9 | 17,364 | 1391 | 21 | 89,478 | 1645.3 |
| Sweden | 507.0 | 450,295 | 9983 | 1 | 11 | 83,073.7 |
| Switzerland | 659.4 | 41,277 | 8544 | 21 | 148 | 122,384.5 |
| Syria | 24.6 | 185,180 | 18,284 | 4 | 38,409 | 898.0 |
| Taiwan | 566.8 | 35,980 | 23,694 | 197 | 35,277 | 198,705.5 |
| Tajikistan | 7.2 | 144,100 | 9107 | 79 | 241,980 | 64,478.0 |
| Tanzania | 51.2 | 947,300 | 59,091 | 89 | 121,856 | 3998.2 |
| Thailand | 432.9 | 513,120 | 69,183 | 239 | 1,707,325 | 83,4014.4 |
| Timor-Leste | 2.7 | 14,874 | 1324 | 2 | 8486 | 250.0 |
| Togo | 4.6 | 56,785 | 7991 | 23 | 22,258 | 13.5 |
| Tonga | 0.4 | 747 | 109 | 0 | 2880 | 1731.0 |
| Trinidad and Tobago | 21.7 | 5128 | 1373 | 1 | 682 | 822.1 |
| Tunisia | 40.3 | 163,610 | 11,659 | 16 | 9650 | 7226.2 |
| Turkey | 793.7 | 783,562 | 81,917 | 801 | 77,849 | 239,218.3 |
| Turkmenistan | 42.4 | 488,100 | 5851 | 1 | 53 | 12,483.8 |
| Tuvalu | 0.0 | 26 | 11 | 0 | 140 | 0.0 |
| Uganda | 27.2 | 241,038 | 44,271 | 1750 | 55,397 | 685.2 |
| Ukraine | 95.9 | 603,550 | 44,009 | 57 | 109,685 | 128,831.3 |
| United Arab Emirates | 407.2 | 83,600 | 9542 | 0 | 188 | 0.0 |
| United Kingdom | 2496.8 | 243,610 | 66,574 | 26 | 11,629 | 566,472.4 |
| United States of America | 19,417.1 | 9,833,517 | 326,767 | 373 | 964,231 | 8,645,195.8 |
| Uruguay | 58.1 | 176,215 | 3470 | 1 | 5134 | 7196.1 |
| Uzbekistan | 68.3 | 447,400 | 32,365 | 4 | 32,602 | 2500.0 |
| Vanuatu | 0.8 | 12,189 | 282 | 5 | 6929 | 418.6 |
| Venezuela | 251.6 | 912,050 | 32,381 | 467 | 16,517 | 54,319.8 |
| Vietnam | 215.8 | 331,210 | 96,491 | 411 | 1,450,242 | 332,328.8 |
| Yemen | 27.2 | 527,968 | 28,915 | 43 | 22,152 | 67,092.6 |
| Zambia | 23.1 | 752,618 | 17,609 | 35 | 235,579 | 522.5 |
| Zimbabwe | 15.3 | 390,757 | 16,913 | 161 | 469,882 | 24,132.6 |
References
- Costanza, R.; Farley, J. Ecological economics of coastal disasters: Introduction to the special issue. Ecol. Econ. 2007, 63, 249–253. [Google Scholar] [CrossRef]
- Alexander, L.V.; Zhang, X.; Peterson, T.C.; Caesar, J.; Gleason, B.; Klein Tank, A.M.G.; Haylock, M.; Collins, D.; Trewin, B.; Rahimzadeh, F.; et al. Global observed changes in daily climate extremes of temperature and precipitation. J. Geophys. Res. Atmos. 2006, 111. [Google Scholar] [CrossRef]
- Easterling, D.R.; Meehl, G.A.; Parmesan, C.; Changnon, S.A.; Karl, T.R.; Mearns, L.O. Climate Extremes: Observations, Modeling, and Impacts. Science 2000, 289, 2068–2074. [Google Scholar] [CrossRef] [PubMed]
- Kunkel, K.E.; Andsager, K.; Easterling, D.R. Long-Term Trends in Extreme Precipitation Events over the Conterminous United States and Canada. J. Clim. 1999, 12, 2515–2527. [Google Scholar] [CrossRef]
- Moberg, A.; Jones, P.D.; Lister, D.; Walther, A.; Brunet, M.; Jacobeit, J.; Alexander, L.V.; Della-Marta, P.M.; Luterbacher, J.; Yiou, P.; et al. Indices for daily temperature and precipitation extremes in Europe analyzed for the period 1901–2000. J. Geophys. Res. Atmos. 2006, 111. [Google Scholar] [CrossRef]
- Loayza, N.V.; Olaberría, E.; Rigolini, J.; Christiaensen, L. Natural Disasters and Growth: Going Beyond the Averages. World Dev. 2012, 40, 1317–1336. [Google Scholar] [CrossRef]
- Daniell, J.E.; Khazai, B.; Wenzel, F.; Vervaeck, A. The CATDAT damaging earthquakes database. Nat. Hazards Earth Syst. Sci. 2011, 11, 2235–2251. [Google Scholar] [CrossRef]
- Pielke, R.A., Jr.; Landsea, C.W. Normalized Hurricane Damages in the United States: 1925–95. Weather Forecast. 1998, 13, 621–631. [Google Scholar] [CrossRef]
- Kousky, C. Informing climate adaptation: A review of the economic costs of natural disasters. Energy Econ. 2014, 46, 576–592. [Google Scholar] [CrossRef]
- Neumayer, E.; Barthel, F. Normalizing economic loss from natural disasters: A global analysis. Glob. Environ. Chang. 2011, 21, 13–24. [Google Scholar] [CrossRef]
- Pielke, R.A.; Gratz, J.; Landsea, C.W.; Collins, D.; Saunders, M.A.; Musulin, R. Normalized Hurricane Damage in the United States: 1900–2005. Nat. Hazards Rev. 2008, 9, 29–42. [Google Scholar] [CrossRef]
- Mendelsohn, R.; Saher, G. The Global Impact of Climate Change on Extreme Events; The word bank: Washington, DC, USA, 2011. [Google Scholar]
- Wildavsky, A.B. Searching for Safety; Transaction Publ.: Piscataway, NJ, USA, 1988. [Google Scholar]
- Toya, H.; Skidmore, M. Economic development and the impacts of natural disasters. Econ. Lett. 2007, 94, 20–25. [Google Scholar] [CrossRef]
- Padli, J.; Shah Habibullah, M.; Baharom, A.H. Economic impact of natural disasters’ fatalities. Int. J. Soc. Econ. 2010, 37, 429–441. [Google Scholar] [CrossRef]
- Pielke, R.A.; Agrawala, S.; Bouwer, L.M.; Burton, I.; Changnon, S.; Glantz, M.H.; Hooke, W.H.; Klein, R.J.T.; Kunkel, K.; Mileti, D.; et al. Clarifying the Attribution of Recent Disaster Losses a Response to Epstein and McCarthy. Bull. Am. Meteorol. Soc. 2005, 86, 1481–1483. [Google Scholar]
- Kellenberg, D.K.; Mobarak, A.M. Does rising income increase or decrease damage risk from natural disasters? J. Urban Econ. 2008, 63, 788–802. [Google Scholar] [CrossRef]
- Barredo, J.I. Normalised flood losses in Europe: 1970–2006. Nat. Hazards Earth Syst. Sci. 2009, 9, 97–104. [Google Scholar] [CrossRef]
- Kahn, M.E. The Death Toll from Natural Disasters: The Role of Income, Geography, and Institutions. Rev. Econ. Stat. 2005, 87, 271–284. [Google Scholar] [CrossRef]
- Crespo Cuaresma, J.; Hlouskova, J.; Obersteiner, M. Natural Disasters as Creative Destruction? Evidence from Developing Countries. Econ. Inq. 2008, 46, 214–226. [Google Scholar] [CrossRef]
- Schumacher, I.; Strobl, E. Economic development and losses due to natural disasters: The role of hazard exposure. Ecol. Econ. 2011, 72, 97–105. [Google Scholar] [CrossRef]
- Horwich, G. Economic Lessons of the Kobe Earthquake. Econ. Dev. Cult. Chang. 2000, 48, 521–542. [Google Scholar] [CrossRef]
- Cavallo, E.; Galiani, S.; Noy, I.; Pantano, J. Catastrophic Natural Disasters and Economic Growth. Rev. Econ. Stat. 2013, 95, 1549–1561. [Google Scholar] [CrossRef]
- Neumayer, E.; Plümper, T.; Barthel, F. The political economy of natural disaster damage. Glob. Environ. Chang. 2014, 24, 8–19. [Google Scholar] [CrossRef]
- Noy, I.; Nualsri, A. Fiscal storms: public spending and revenues in the aftermath of natural disasters. Environ. Dev. Econo. 2011, 16, 113–128. [Google Scholar] [CrossRef]
- Kellenberg, D.; Mobarak, A.M. The Economics of Natural Disasters. Annu. Rev. Resour. Econ. 2011, 3, 297–312. [Google Scholar] [CrossRef]
- Noy, I.; Vu, T.B. The economics of natural disasters in a developing country: The case of Vietnam. J. Asian Econ. 2010, 21, 345–354. [Google Scholar] [CrossRef]
- Xiao, Y. LOCAL ECONOMIC IMPACTS OF NATURAL DISASTERS*. J. Reg. Sci. 2011, 51, 804–820. [Google Scholar] [CrossRef]
- Paul, S.; Sharif, H. Analysis of Damage Caused by Hydrometeorological Disasters in Texas, 1960–2016. Geosciences 2018, 8, 384. [Google Scholar] [CrossRef]
- Bettin, G.; Zazzaro, A. The Impact of Natural Disasters on Remittances to Low- and Middle-Income Countries. J. Dev. Stud. 2018, 54, 481–500. [Google Scholar] [CrossRef]
- Strobl, E. The economic growth impact of natural disasters in developing countries: Evidence from hurricane strikes in the Central American and Caribbean regions. J. Dev. Econ. 2012, 97, 130–141. [Google Scholar] [CrossRef]
- Raschky, P.A. Institutions and the losses from natural disasters. Nat. Hazards Earth Syst. Sci. 2008, 8, 627–634. [Google Scholar] [CrossRef]
- Strömberg, D. Natural Disasters, Economic Development, and Humanitarian Aid. J. Econ. Perspect. 2007, 21, 199–222. [Google Scholar] [CrossRef]
- Kantha, L. Time to replace the Saffir-Simpson hurricane scale? Eos Trans. AGU 2006, 87, 3–6. [Google Scholar] [CrossRef]
- Nordhaus, W.D. The Economics of Hurricanes and Implications of Global Warming. Clim. Chang. Econ. 2010, 1, 1–20. [Google Scholar] [CrossRef]
- Bouwer, L.M.; Botzen, W.J.W. How Sensitive are us Hurricane Damages to Climate? Comment on a Paper by W. D. Nordhaus. Clim. Chang. Econ. 2011, 2, 1–7. [Google Scholar] [CrossRef]
- Murnane, R.J.; Elsner, J.B. Maximum wind speeds and US hurricane losses. Geophys. Res. Lett. 2012, 39. [Google Scholar] [CrossRef]
- Alice, R.Z.; Jonathan, H.J. Dependence of US hurricane economic loss on maximum wind speed and storm size. Environ. Res. Lett. 2014, 9, 064019. [Google Scholar] [CrossRef]
- Dorland, C.; Tol, R.S.J.; Palutikof, J.P. Vulnerability of the Netherlands and Northwest Europe to Storm Damage under Climate Change. Clim. Chang. 1999, 43, 513–535. [Google Scholar] [CrossRef]
- Pielke, R.A., Jr.; Downton, M.W. Precipitation and Damaging Floods: Trends in the United States, 1932–97. J. Clim. 2000, 13, 3625–3637. [Google Scholar] [CrossRef]
- Cavallo, E.; Powell, A.; Becerra, O. Estimating the Direct Economic Damages of the Earthquake in Haiti*. Econ. J. 2010, 120, F298–F312. [Google Scholar] [CrossRef]
- Song, Y.; Park, M. A Study on Estimation Equation for Damage and Recovery Costs Considering Human Losses Focused on Natural Disasters in the Republic of Korea. Sustainability 2018, 10, 3103. [Google Scholar] [CrossRef]
| Natural Disaster | Year | Occurrence (count) | Human Losses from Deaths (person) | Human Losses Affected (person) | Damage Costs (thousand U.S. dollars) | |
|---|---|---|---|---|---|---|
| Start | Last | |||||
| Biological | 1900 | 2017 | 1469 | 7,092,578 | 30,600,098 | 230,132 |
| Epidemic | 1900 | 2017 | 1385 | 7,092,578 | 27,797,898 | 7 |
| Insect infestation | 1913 | 2010 | 84 | 2,802,200 | 230,125 | |
| Climatological | 1900 | 2017 | 1096 | 10,495,636 | 2,641,353,720 | 244,017,541 |
| Drought | 1900 | 2017 | 682 | 10,491,621 | 2,634,639,788 | 162,823,266 |
| Wildfire | 1911 | 2017 | 414 | 4015 | 6,713,932 | 81,194,275 |
| Geophysical | 1900 | 2017 | 1579 | 2,490,032 | 197,244,930 | 803,217,465 |
| Earthquake | 1901 | 2017 | 1302 | 2,419,173 | 190,655,568 | 799,086,117 |
| Mass movement | 1903 | 2017 | 44 | 4525 | 19,028 | 209,000 |
| Volcanic activity | 1900 | 2017 | 233 | 66,334 | 6,570,334 | 3,922,348 |
| Hydrological | 1900 | 2017 | 5408 | 7,023,742 | 3,768,424,346 | 760,376,834 |
| Flood | 1900 | 2017 | 4714 | 6,970,760 | 3,754,212,078 | 751,065,236 |
| Landslide | 1909 | 2017 | 694 | 52,982 | 14,212,268 | 9,311,598 |
| Meteorological | 1900 | 2017 | 4401 | 1,567,887 | 1,207,507,452 | 1,392,003,696 |
| Extreme temperature | 1936 | 2017 | 541 | 182,776 | 103,047,180 | 63,186,343 |
| Storm | 1900 | 2017 | 3860 | 1,385,111 | 1,104,460,272 | 1,328,817,353 |
| Sum | 1900 | 2017 | 13,953 | 28,669,875 | 7,845,130,546 | 3,199,845,668 |
| Parameter | Correlation | GDP | Area | Population | Human Losses Deaths | Human Losses Affected | Damage Costs |
|---|---|---|---|---|---|---|---|
| GDP | Pearson | 1.000 | 0.552 ** | 0.554** | 0.443 ** | 0.461 ** | 0.968 ** |
| Kendall | 1.000 | 0.390 ** | 0.551** | 0.307 ** | 0.135 ** | 0.496 ** | |
| Spearman | 1.000 | 0.547 ** | 0.736** | 0.440 ** | 0.201 ** | 0.672 ** | |
| Significant (2-tailed) | 0.00 | 0.00 | 0.00 | 0.00 | 0.00 | ||
| N | 187 | 187 | 187 | 187 | 187 | 187 | |
| Area | Pearson | 0.552 ** | 1.000 | 0.446 ** | 0.329 ** | 0.348 ** | 0.455 ** |
| Kendall | 0.390 ** | 1.000 | 0.605 ** | 0.412 ** | 0.388 ** | 0.233 ** | |
| Spearman | 0.547 ** | 1.000 | 0.790 ** | 0.578 ** | 0.553 ** | 0.339 ** | |
| Significant (2-tailed) | 0.00 | 0.00 | 0.00 | 0.00 | 0.00 | ||
| N | 187 | 187 | 187 | 187 | 187 | 187 | |
| Population | Pearson | 0.554 ** | 0.446 ** | 1.000 | 0.939 ** | 0.952 ** | 0.490 ** |
| Kendall | 0.551 ** | 0.605 ** | 1.000 | 0.567 ** | 0.457 ** | 0.362 ** | |
| Spearman | 0.736 ** | 0.790 ** | 1.000 | 0.760 ** | 0.649 ** | 0.512 ** | |
| Significant (2-tailed) | 0.00 | 0.00 | 0.00 | 0.00 | 0.00 | ||
| N | 187 | 187 | 187 | 187 | 187 | 187 | |
| Human Losses Deaths | Pearson | 0.443 ** | 0.329 ** | 0.939 ** | 1.000 | 0.991 ** | 0.383 ** |
| Kendall | 0.307 ** | 0.412 ** | 0.567 ** | 1.000 | 0.469 ** | 0.328 ** | |
| Spearman | 0.440 ** | 0.578 ** | 0.760 ** | 1.000 | 0.653** | 0.473 ** | |
| Significant (2-tailed) | 0.00 | 0.00 | 0.00 | 0.00 | 0.00 | ||
| N | 187 | 187 | 187 | 187 | 187 | 187 | |
| Human Losses Affected | Pearson | 0.461 ** | 0.348 ** | 0.952 ** | 0.991 ** | 1.000 | 0.401 ** |
| Kendall | 0.135 ** | 0.388 ** | 0.457 ** | 0.469 ** | 1.000 | 0.229 ** | |
| Spearman | 0.201 ** | 0.553 ** | 0.649 ** | 0.653 ** | 1.000 | 0.332 ** | |
| Significant (2-tailed) | 0.00 | 0.00 | 0.00 | 0.00 | 0.00 | ||
| N | 187 | 187 | 187 | 187 | 187 | 187 | |
| Damage Costs | Pearson | 0.968 ** | 0.455 ** | 0.490 ** | 0.383 ** | 0.401 ** | 1.000 ** |
| Kendall | 0.496 ** | 0.233 ** | 0.362 ** | 0.328 ** | 0.229 ** | 1.000 ** | |
| Spearman | 0.672 ** | 0.339 ** | 0.512 ** | 0.473 ** | 0.332 ** | 1.000 ** | |
| Significant (2-tailed) | 0.00 | 0.00 | 0.00 | 0.00 | 0.00 | ||
| N | 187 | 187 | 187 | 187 | 187 | 187 |
| Model Summary | ||||||
|---|---|---|---|---|---|---|
| R | R Square | Adjusted R Square | Standard Error of the Estimate | |||
| 0.946a | 0.894 | 0.893 | 3340.632 | |||
| ANOVAb | ||||||
| Sum of Squares | df | Mean Square | F | Significance | ||
| Regression | 17288446415.82 | 3 | 5762815471.940 | 516.390 | 0.000a | |
| Residual | 2042246931.16 | 183 | 11159819.296 | |||
| Total | 19330693346.98 | 186 | ||||
| Coefficientsb | ||||||
| Unstandardized Coefficients | Standardized Coefficients | t | Significance | VIF | ||
| B | Standard Error | Beta | ||||
| (Constant) | −975.7353 | 261.839 | −3.726 | 0.000 | ||
| GDP | −0.4389 | 0.185 | −0.075 | −2.369 | 0.019 | 1.734 |
| Area | 0.0004 | 0.00 | −0.084 | −2.846 | 0.005 | 1.499 |
| Population | 0.0702 | 0.002 | 1.018 | 34.518 | 0.000 | 1.505 |
| Model Summary | ||||||
|---|---|---|---|---|---|---|
| R | R Square | Adjusted R Square | Standard Error of the Estimate | |||
| 0.957a | 0.916 | 0.915 | 763048.108 | |||
| ANOVAb | ||||||
| Sum of Squares | df | Mean Square | F | Significance | ||
| Regression | 1.161 × 10¹⁵ | 3 | 3.869 × 10¹⁴ | 664.504 | 0.000a | |
| Residual | 1.066 × 10¹⁴ | 183 | 5.822 × 10¹¹ | |||
| Total | 1.267 × 10¹⁵ | 186 | ||||
| Coefficientsb | ||||||
| Unstandardized Coefficients | Standardized Coefficients | t | Significance | VIF | ||
| B | Standard Error | Beta | ||||
| (Constant) | –205644.9682 | 59807.681 | –3.438 | 0.001 | (Constant) | |
| GDP | –96.7326 | 42.312 | –0.065 | –2.286 | 0.023 | GDP |
| Area | –0.0954 | 0.035 | –0.071 | –2.721 | 0.007 | Area |
| Population | 18.0191 | 0.465 | 1.020 | 38.769 | 0.000 | Population |
| Model Summary | ||||||
|---|---|---|---|---|---|---|
| R | R Square | Adjusted R Square | Standard Error of the Estimate | |||
| 0.973a | 0.947 | 0.946 | 183379.653 | |||
| ANOVAb | ||||||
| Sum of Squares | df | Mean Square | F | Significance | ||
| Regression | 1.098 × 10¹⁴ | 3 | 3.659 × 10¹³ | 1088.215 | 0.000a | |
| Residual | 6.154 × 10¹² | 183 | 3.363 × 10¹⁰ | |||
| Total | 1.159 × 10¹⁴ | 186 | ||||
| Coefficients b | ||||||
| Unstandardized Coefficients | Standardized Coefficients | t | Significance | VIF | ||
| B | Standard Error | Beta | ||||
| (Constant) | 17968.0283 | 14373.290 | 1.250 | 0.213 | ||
| GDP | 476.6021 | 10.169 | 1.051 | 46.869 | 0.000 | 1.734 |
| Area | –0.0425 | 0.008 | –0.105 | –5.046 | 0.000 | 1.499 |
| Population | –0.2442 | 0.112 | –0.046 | –2.187 | 0.030 | 1.505 |
© 2019 by the authors. Licensee MDPI, Basel, Switzerland. This article is an open access article distributed under the terms and conditions of the Creative Commons Attribution (CC BY) license (http://creativecommons.org/licenses/by/4.0/).
Share and Cite
Song, Y.S.; Park, M.J. Development of Damage Prediction Formula for Natural Disasters Considering Economic Indicators. Sustainability 2019, 11, 868. https://doi.org/10.3390/su11030868
Song YS, Park MJ. Development of Damage Prediction Formula for Natural Disasters Considering Economic Indicators. Sustainability. 2019; 11(3):868. https://doi.org/10.3390/su11030868
Chicago/Turabian StyleSong, Young Seok, and Moo Jong Park. 2019. "Development of Damage Prediction Formula for Natural Disasters Considering Economic Indicators" Sustainability 11, no. 3: 868. https://doi.org/10.3390/su11030868
APA StyleSong, Y. S., & Park, M. J. (2019). Development of Damage Prediction Formula for Natural Disasters Considering Economic Indicators. Sustainability, 11(3), 868. https://doi.org/10.3390/su11030868