Article

The Effects of Saline Stress on the Growth of Two Shrub Species in the Qaidam Basin of Northwestern China

College of Soil and Water Conservation, Beijing Forestry University, Beijing 100083, China
*
Author to whom correspondence should be addressed.
Sustainability 2019, 11(3), 828; https://doi.org/10.3390/su11030828
Submission received: 13 January 2019 / Revised: 31 January 2019 / Accepted: 31 January 2019 / Published: 5 February 2019

Abstract

:
Soil salinization is a serious issue in the Qaidam Basin and significantly limits economic development. To explore the salt tolerance of two shrubs in this area, we determined several parameters, including the Soil and Plant Analyzer Development (SPAD), net photosynthetic rate (Pn), transpiration rate (Tr), intercellular carbon dioxide (Ci, μmol mol−1), stomatal conductance (Gs, umol m−2s−1), and water use efficiency (WUE) under different salt concentrations (0, 100, 200, 300, and 400 mmol·L−1). In addition, the shrubs of Elaeagnus angustifolia and Lycium barbarum of salt tolerance were evaluated. The photosynthetic parameters of E. angustifolia were more sensitive to salinity than those of L. barbarum, and SPAD, Pn, Tr, and WUE of E. angustifolia decreased significantly with increasing salt concentrations (p < 0.05), while in L. barbarum, SPAD, Pn, and Tr decreased significantly with increasing salt concentrations (p < 0.05), but the WUE of L. barbarum showed no significantly variation under the salt concentration gradient. The results of correlation matrix of photosynthetic index also indicated that the minimum salt tolerance of E. angustifolia and L. barbarum were 108.4 and 246.3 mmol·L−1, respectively. Our results provide a scientific basis for the selection of salt-tolerant plant species in of northwest China.

1. Introduction

Soil salinization has become an issue of global concern [1] and significantly threatens food and resource security [2,3,4]. It not only leads to the destruction of resources and the loss of agricultural production, but also negatively impacts the environment and economic development [5,6].
In China, the total area of saline-alkaline soil accounts for about 3.69 × 10⁵ km2, and the potential saline soil area is about 1.73 × 10⁵ km2 [7]. Several engineering water conservancy measures, chemical measures, biological measures, and comprehensive measures are available to improve and use saline-alkaline land [8,9,10]. Of these, biological measures, such as the planting of suitable plants, are the most cost-effective approach to utilize and improve saline-alkali land [11]. Salt-tolerant plants can improve saline-alkaline soil structure, increase soil nutrients, and therefore improve the ecological environment [12]; in addition, such an approach can promote economic development.
The most direct effect of salinity on plants is growth inhibition via impacting water absorption, thereby leading to reduced plant height, lower DBH, fresh and dry weight, and inhibited plant organ differentiation [13,14,15,16]. In addition, the increase in pH caused by high saline levels also negatively impacts plant growth via changes in metabolism, nutrient absorption, and ion balance [17]. Previous studies on the impacts of soil salinity have mostly focused on plant ion metabolism, hormone responses, enzyme activity, water physiology, and growth characteristics [18,19,20,21], while only a few studies investigated photosynthesis under NaCl salt stress [22,23]. Most commonly, salt stress is induced by excessive amounts of NaCl in the soil, which is a frequent problem in northern China. Several plant species, such as Elaeagnus angustifolia, Lycium barbarum, Suaeda salsa, and Tamarix chinensis, can grow on saline-alkaline soils, and it is of particular importance to investigate the adaptability of different plant species to salt stress, facilitating the selection of salt-tolerant plant species.
The Qaidam Basin is an important industrial production base in northwestern China and one of the largest areas with saline-alkaline soil, low annual precipitation and high salinity. The species E. angustifolia and L. barbarum are largely cultivated in the area and are of significant economic importance. However, in recent years, yields have been declining due to increasing salt stress. In this context, we determined the photosynthetic parameters of E. angustifolia and L. barbarum to: (i) explore the adaptability and physiological mechanism of salt tolerance under NaCl salt stress; (ii) to evaluate the maximum salt tolerance threshold of these species under NaCl salt stress. The overall aim of the study is to provide a scientific basis for species selection in ecological construction programs.

2. Materials and Methods
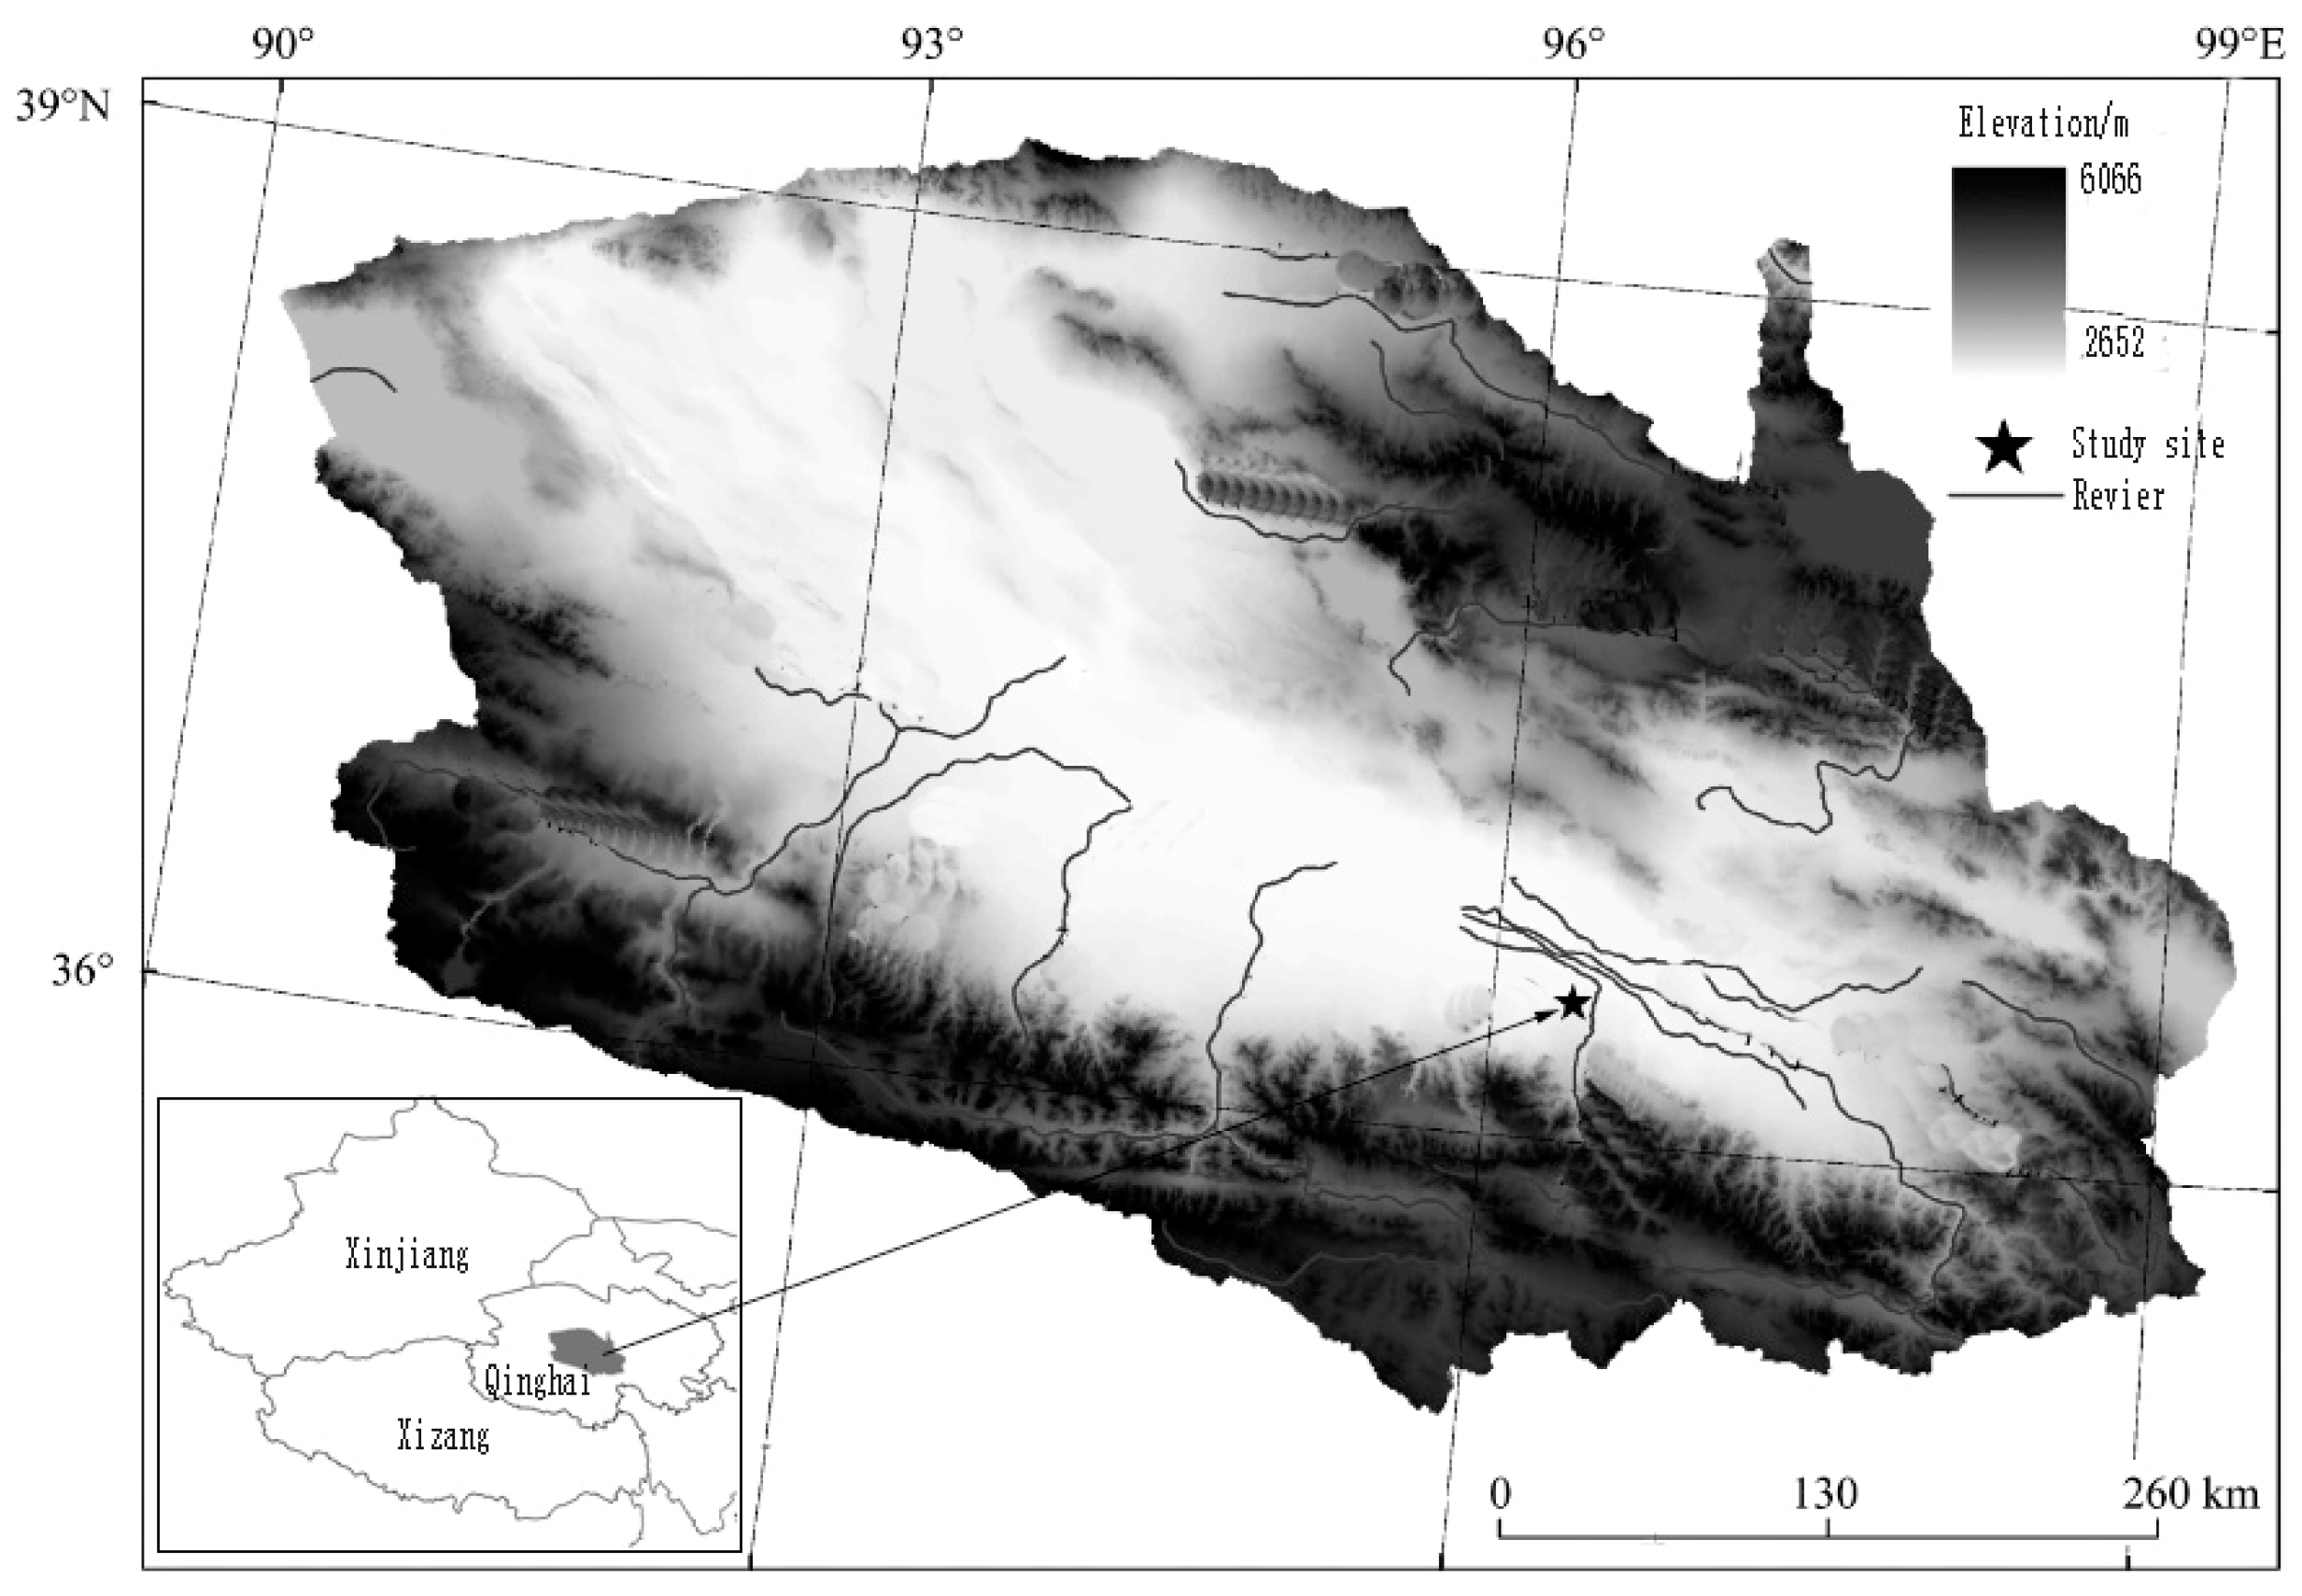
2.1. Study Sites

The study area was located at the Nomuhong Farm (96°15′–96°35′ E, 36°20′–36°30′ N) in Qinghai Province, China, 637 km from Xining and 147 km from Golmud City. The area is an arid desert with a plateau continental climate. The farm covers an area of 5 km from north to south and 30 km from east to west, with a total area of 91.3 km2 at an elevation of 2790 m (Figure 1). The growing season is relatively short and extends from June to September. Average annual rainfall is 43.5 mm, with an annual potential evapotranspiration of 2849.7 mm. Solar radiation is strong, and the area receives more than 3100 h of sunshine per year. Average annual temperature is 4.9°C, with distinct differences between day and night. Annual maximum and minimum temperatures are 35.8 and −31°C, respectively. The frost-free period is 70 days, and the salt mainly consists of chloride salt and sulfate. The soil layer in the study area is thicker, and the soil is mainly gray brown desert soil and saline desert soil. The soil PH in the study was 8.1. The soil C, N, P and K were 0.69 g/kg, 0.05 g/kg, 6.15 mg/kg and 254.4 mg/kg. The vegetation mainly consists of desert species such as Elaeagnus angustifolia, Lycium barbarum, Tamarix hispida, and Nitraria tangutorum.

2.2. Experimental Design

On April 20, 2016, 180 shrubs (90 of E. angustifolia and 90 of L. barbarum), with relatively uniform growth were selected and each plant was transplanted into a plastic basin with a diameter of 32 cm and a height of 30 cm. The basins placed in the greenhouse of the Nomuhong Farm. At the bottom of the basins, a hole was drilled manually and covered with gauze to prevent soil loss. Each plastic basin was placed in a 2-mm sieve with a mass of 1.8 ± 0.05 kg, rinsed, and air-dried. Hoagland nutrient solution was regularly applied during the cultivation period, and the plants were irrigated to ensure adequate growth. On July 2, 2016, shrubs with consistent growth (average height and diameter at breast height, DBH) were selected for the determination of the initial growth parameters (Table 1).
Prior to the application of salt stress, according to the water holding capacity in the field and the related drought stress test, the soil water content of all seedlings was maintained at about 17%. For the salt stress treatment, one control group (CK) and four NaCl salt treatment groups were subjected to each treatment, using six replicates. Dissolve NaCl solvent in water to prepare solution in proportion. The salt concentrations were 0 (CK), 100 (S1), 200 (S2), 300 (S3), and 400 (S4) mmol·L−1.
The salt solution was prepared for the corresponding mass of analytically pure NaCl and Hoagland nutrient solution (pH = 6). To prevent salt-exciting reactions, the salt concentration was treated by adding 50 mmol·L−1 per day until the predetermined concentration of each treatment was reached. The same amount of Hoagland nutrient solution was added to the control group. To obtain the response of salt date to salt stress in the natural environment, the shrubs were moved to the open space every morning for natural light irradiation and were placed back into the greenhouse at night. Every evening, the plants were weighted and soil moisture was determined with ECH2O soil moisture sensor (Decagon, USA). Water was supplemented accordingly.

2.3. Determination of Meteorological Parameters

Three Davis Vantage Pro 2 small weather stations were set up next to the greenhouse to continuously determine relative humidity (RH, %), solar radiation (Rs, W·m−2), and temperature (T, °C) at an interval of 15 min. Saturated vapor pressure difference (VPD, kpa) was calculated by formula as follows:
VPD = 0.611 × e 12.27 × T 237.3 × T × ( 1 RH 100 )
where T is the temperature and RH is the relative humidity.

2.4. Determination of Physiological and Biochemical Indicators

2.4.1. Leaf SPAD Value

Soil and Plant Analyzer Development (SPAD) values can reflect the relative content of chlorophyll and were measured by the portable SPAD-502 m emitting red light (650 nm) and infrared light (940 nm) via transmission. The relative content of chlorophyll (SPAD value) can be obtained by the difference of the optical density between the two wavelengths [18]. To prevent interference by different parts of plant leaves, three leaves in the middle of each plant were selected for the measurement, and each measurement was repeated three times.

2.4.2. Photosynthetic and Transpiration Processes

After 20 days of shrub growth, on a sunny day, the photosynthetic parameters of leaves at the same leaf position were measured using a Licor-6400 portable photosynthesis system at intervals of 2 h. Determination times were 7:00, 9:00, 11:00, 13:00, 15:00 17:00, and 19:00. The measured parameters included net photosynthetic rate (Pn, umolm−2s−1), transpiration rate (Tr, umol m−2s−1), intercellular carbon dioxide (Ci, μmol mol−1), and stomatal conductance (Gs, umol m−2s−1). Five groups of data were recorded continuously after the numerical stability of each index measurement. Because the default leaf area of the Licor-6400 portable photosynthetic meter is 6 cm2, to ensure the reliability and accuracy of the data, the observed results had to be recalculated. At the end of the experiment, scanners were used to scan the labeled leaves, and the leaf area was calculated by the pixel ratio. The photosynthetic indices were recalculated using the LI6400 Sim 5.3 software (LI-COR, Washington, DC, USA), and the water use efficiency (WUE) of the leaves was calculated as follows:
WUE = P n T r
where WUE is the water use efficiency and Pn (umolm−2s−1) and Tr (umolm−2s−1) are net photosynthetic rate and transpiration rate, respectively.

2.4.3. Measurement of Light Response

After 20 days of shrub growth, the leaves at the same leaf position were clamped using the Licor-6400 portable photosynthesizer with a red-blue light source for photosynthesis response measurement. Prior to observation, the temperature of the photosynthesizer was adjusted to 25 °C, while the CO2 level was set to 380 μmol·mol−1. The gradient of photosynthetic active radiation was 2500, 2000, 1800, 1600, 1400, 1200, 1000, 800, 600, 400, 200, 150, 100, 50, and 0 μmol·mol−1. The leaves used for measurement were first induced by light at 1500 μmol·mol−1 light intensity for 30 min, and subsequently, the automatic program of the instrument was used to carry out light induction.
The plant light response curve can be fit in two ways, namely by non-right hyperbola fitting and by right hyperbola fitting. Previous studies have shown that non-rectangular hyperbola fitting has more physiological significance [8]; it was therefore used in the present study. The calculation formula is as follows:
P n = AQY × I × P nmax ( AQY × I + P nmax ) 2 4 × I × AQY × K × P nmax 2 K RD
where Pn and Pnmax are the net photosynthetic rate and the maximum net photosynthetic rate (μmol·m−2·s−1), respectively; I is the photosynthetic active radiation (μmol·m−2·s−1); K is the curved angle; AQY is the initial quantum efficiency (mol·mol−1); RD is the dark breathing rate (μmol·m−2·s−1). When the regression curve intersects with the x-axis (I), the corresponding light intensity represents the light compensation point (LCP), and when Pn takes the maximum value, the corresponding light intensity represents the light saturation point (LSP).

2.5. Statistical Analysis

All statistical analyses were performed using the software package SPSS 16.0 (IBM, New York, NY, USA). Descriptive statistics was used to calculate the mean and standard deviations for each set of replicates. All data was tested for normal distribution and homogeneity of the variance analysis to ensure that the data met the requirements of the variance analysis. Firstly, a two-way ANOVA was used to analyze the differences in SPAD, Pn, Tr, and WUE, with treatment and species as independent factors. The LSD method was used to compare the SPAD, Pn, Tr, and WUE when necessary.

3. Results and Discussion

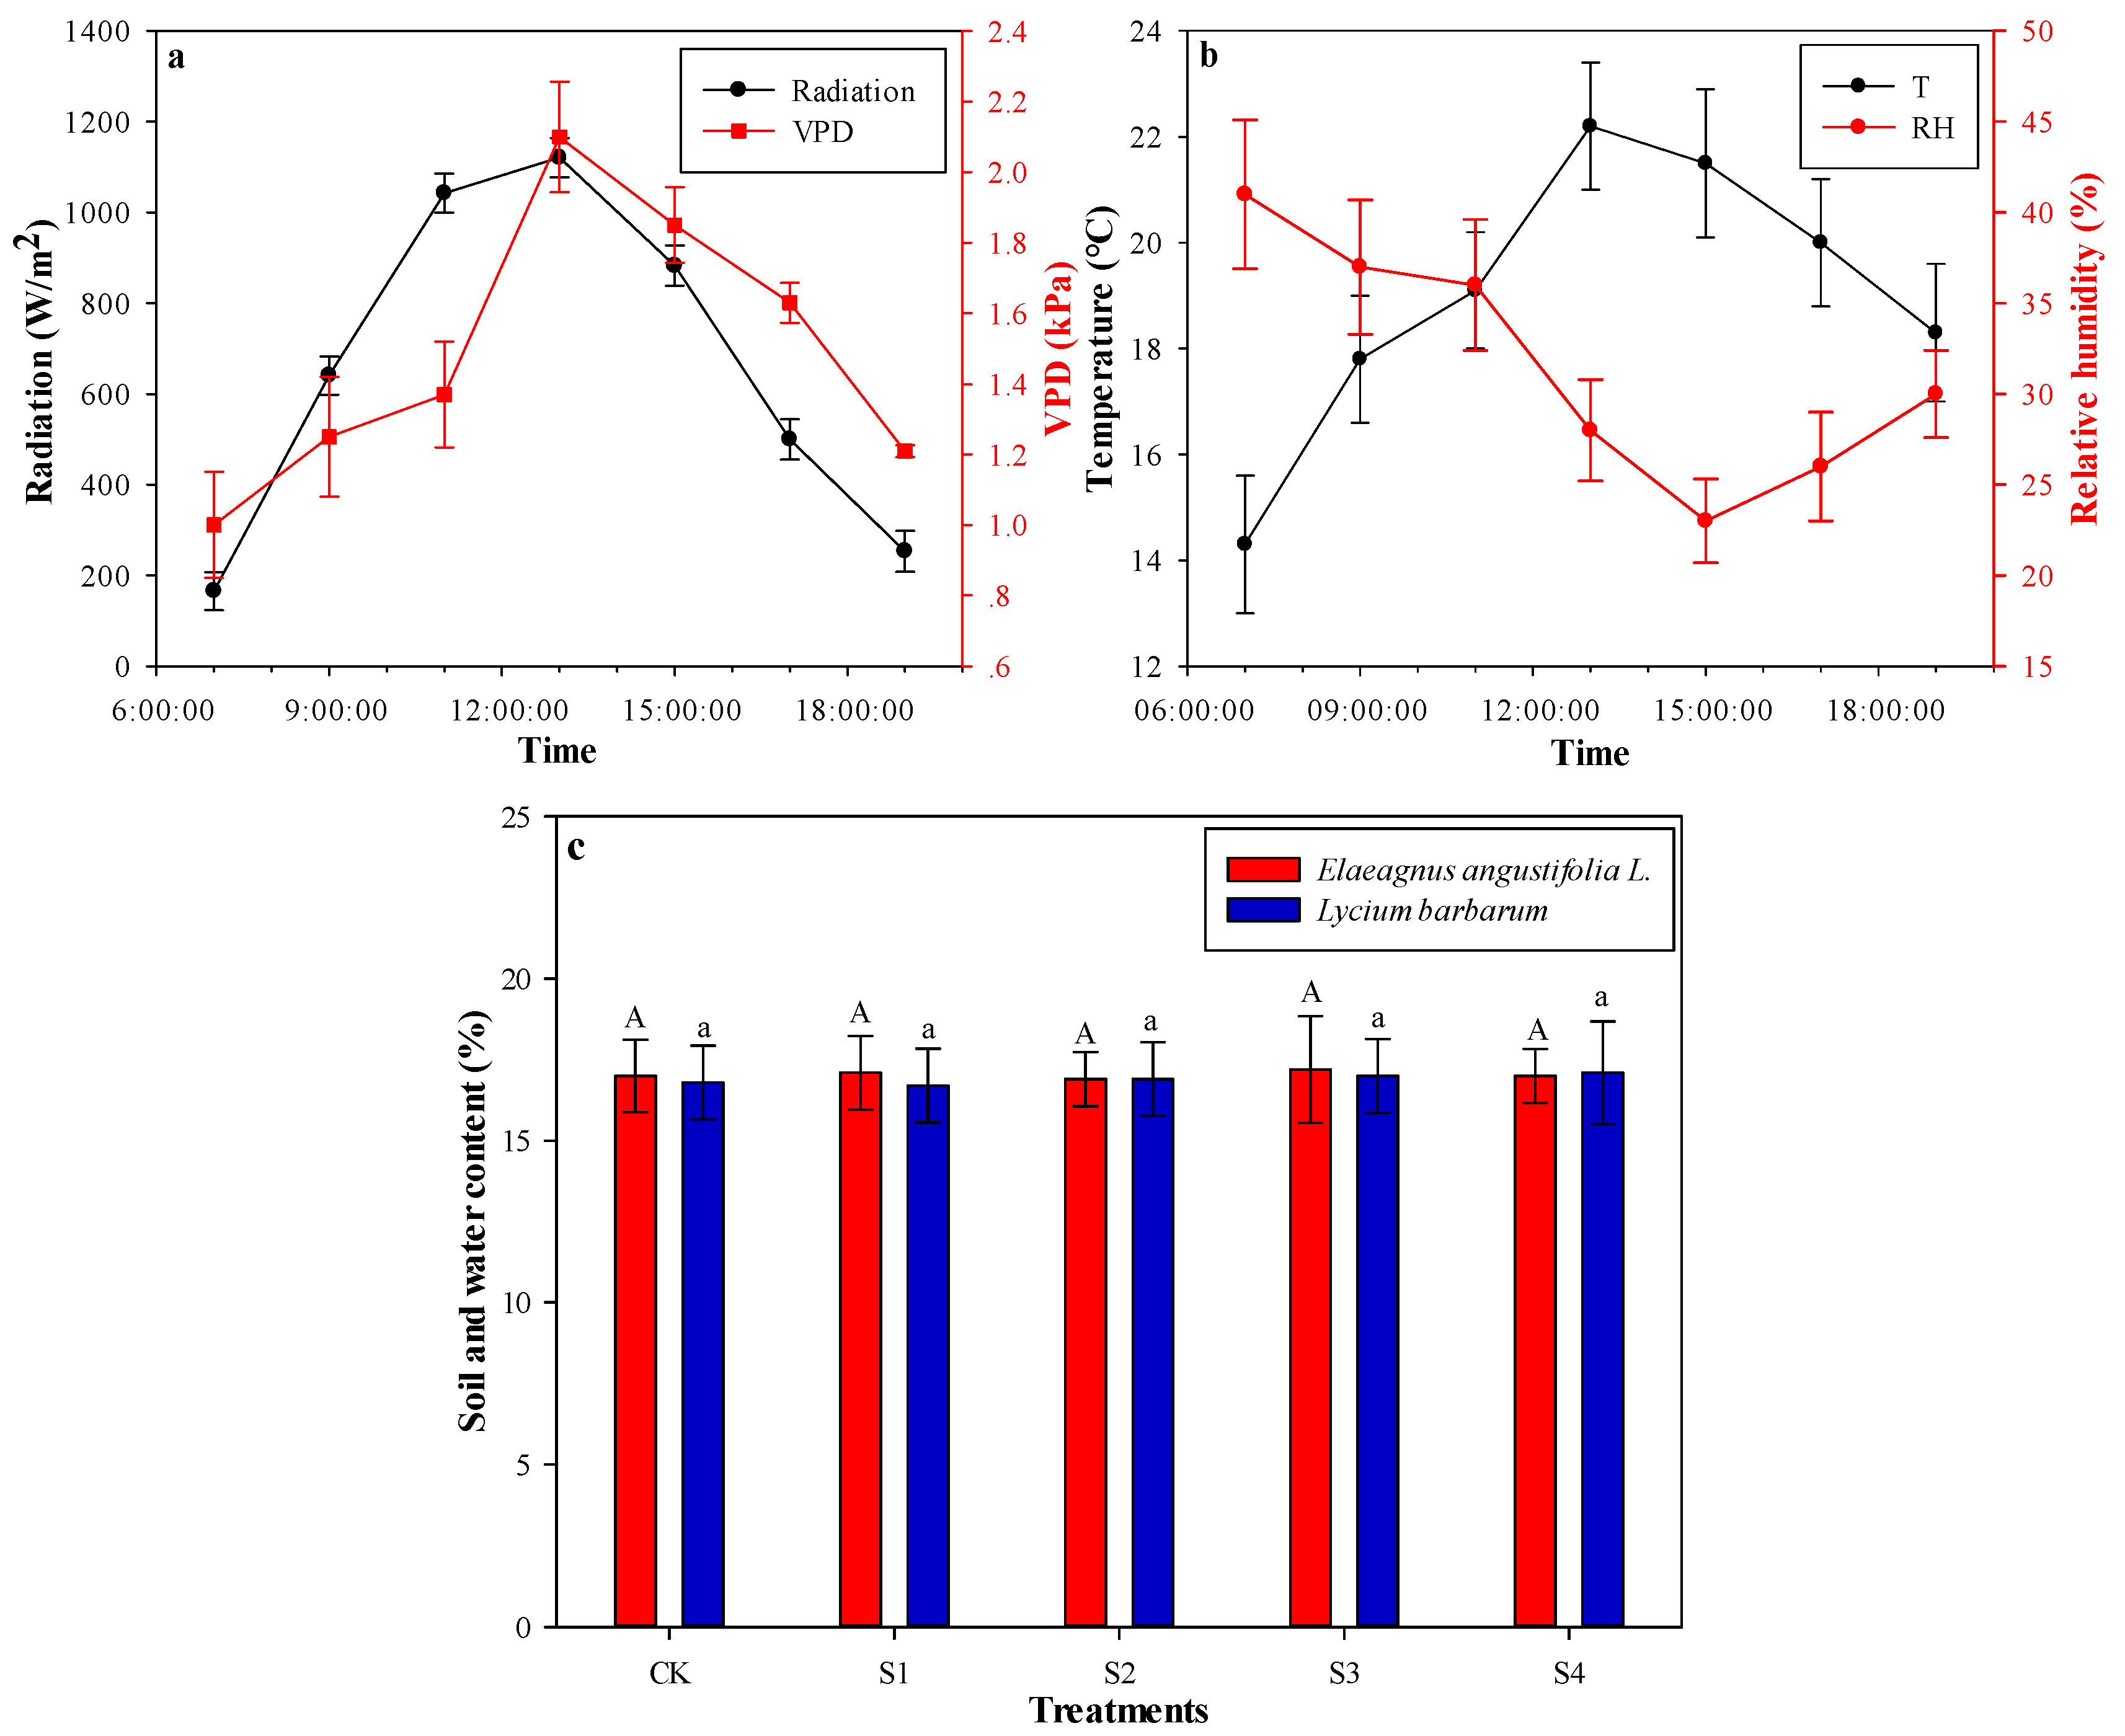
3.1. Basic Meteorological Characteristics

The daily average values of radiation and VPD were 657.3 W·m−2 and 1.48 KPa, respectively. The variation of solar radiation was a single peak, reaching its maximum of 1123 W·m−2 at 13:00 (Figure 2). Similar to radiation, the variation of saturated water vapor pressure also consisted of a single peak, reaching its maximum of 2.01 KPa at 13:00. Average daily temperature was 19.0 °C, with a maximum of 22.2 °C at 13:00 and a minimum of 14.3 °C at 7: 00 am. Relative humidity was negatively correlated with the above-mentioned indices; it first decreased and then increased. Generally, at 15:00, humidity was 27%. The soil and water content of CK in E. angustifolia and L. barbarum were 17.0% and 16.8%, respectively. There was no significant difference in soil water content among the four treatments of E. angustifolia and L. barbarum, respectively.

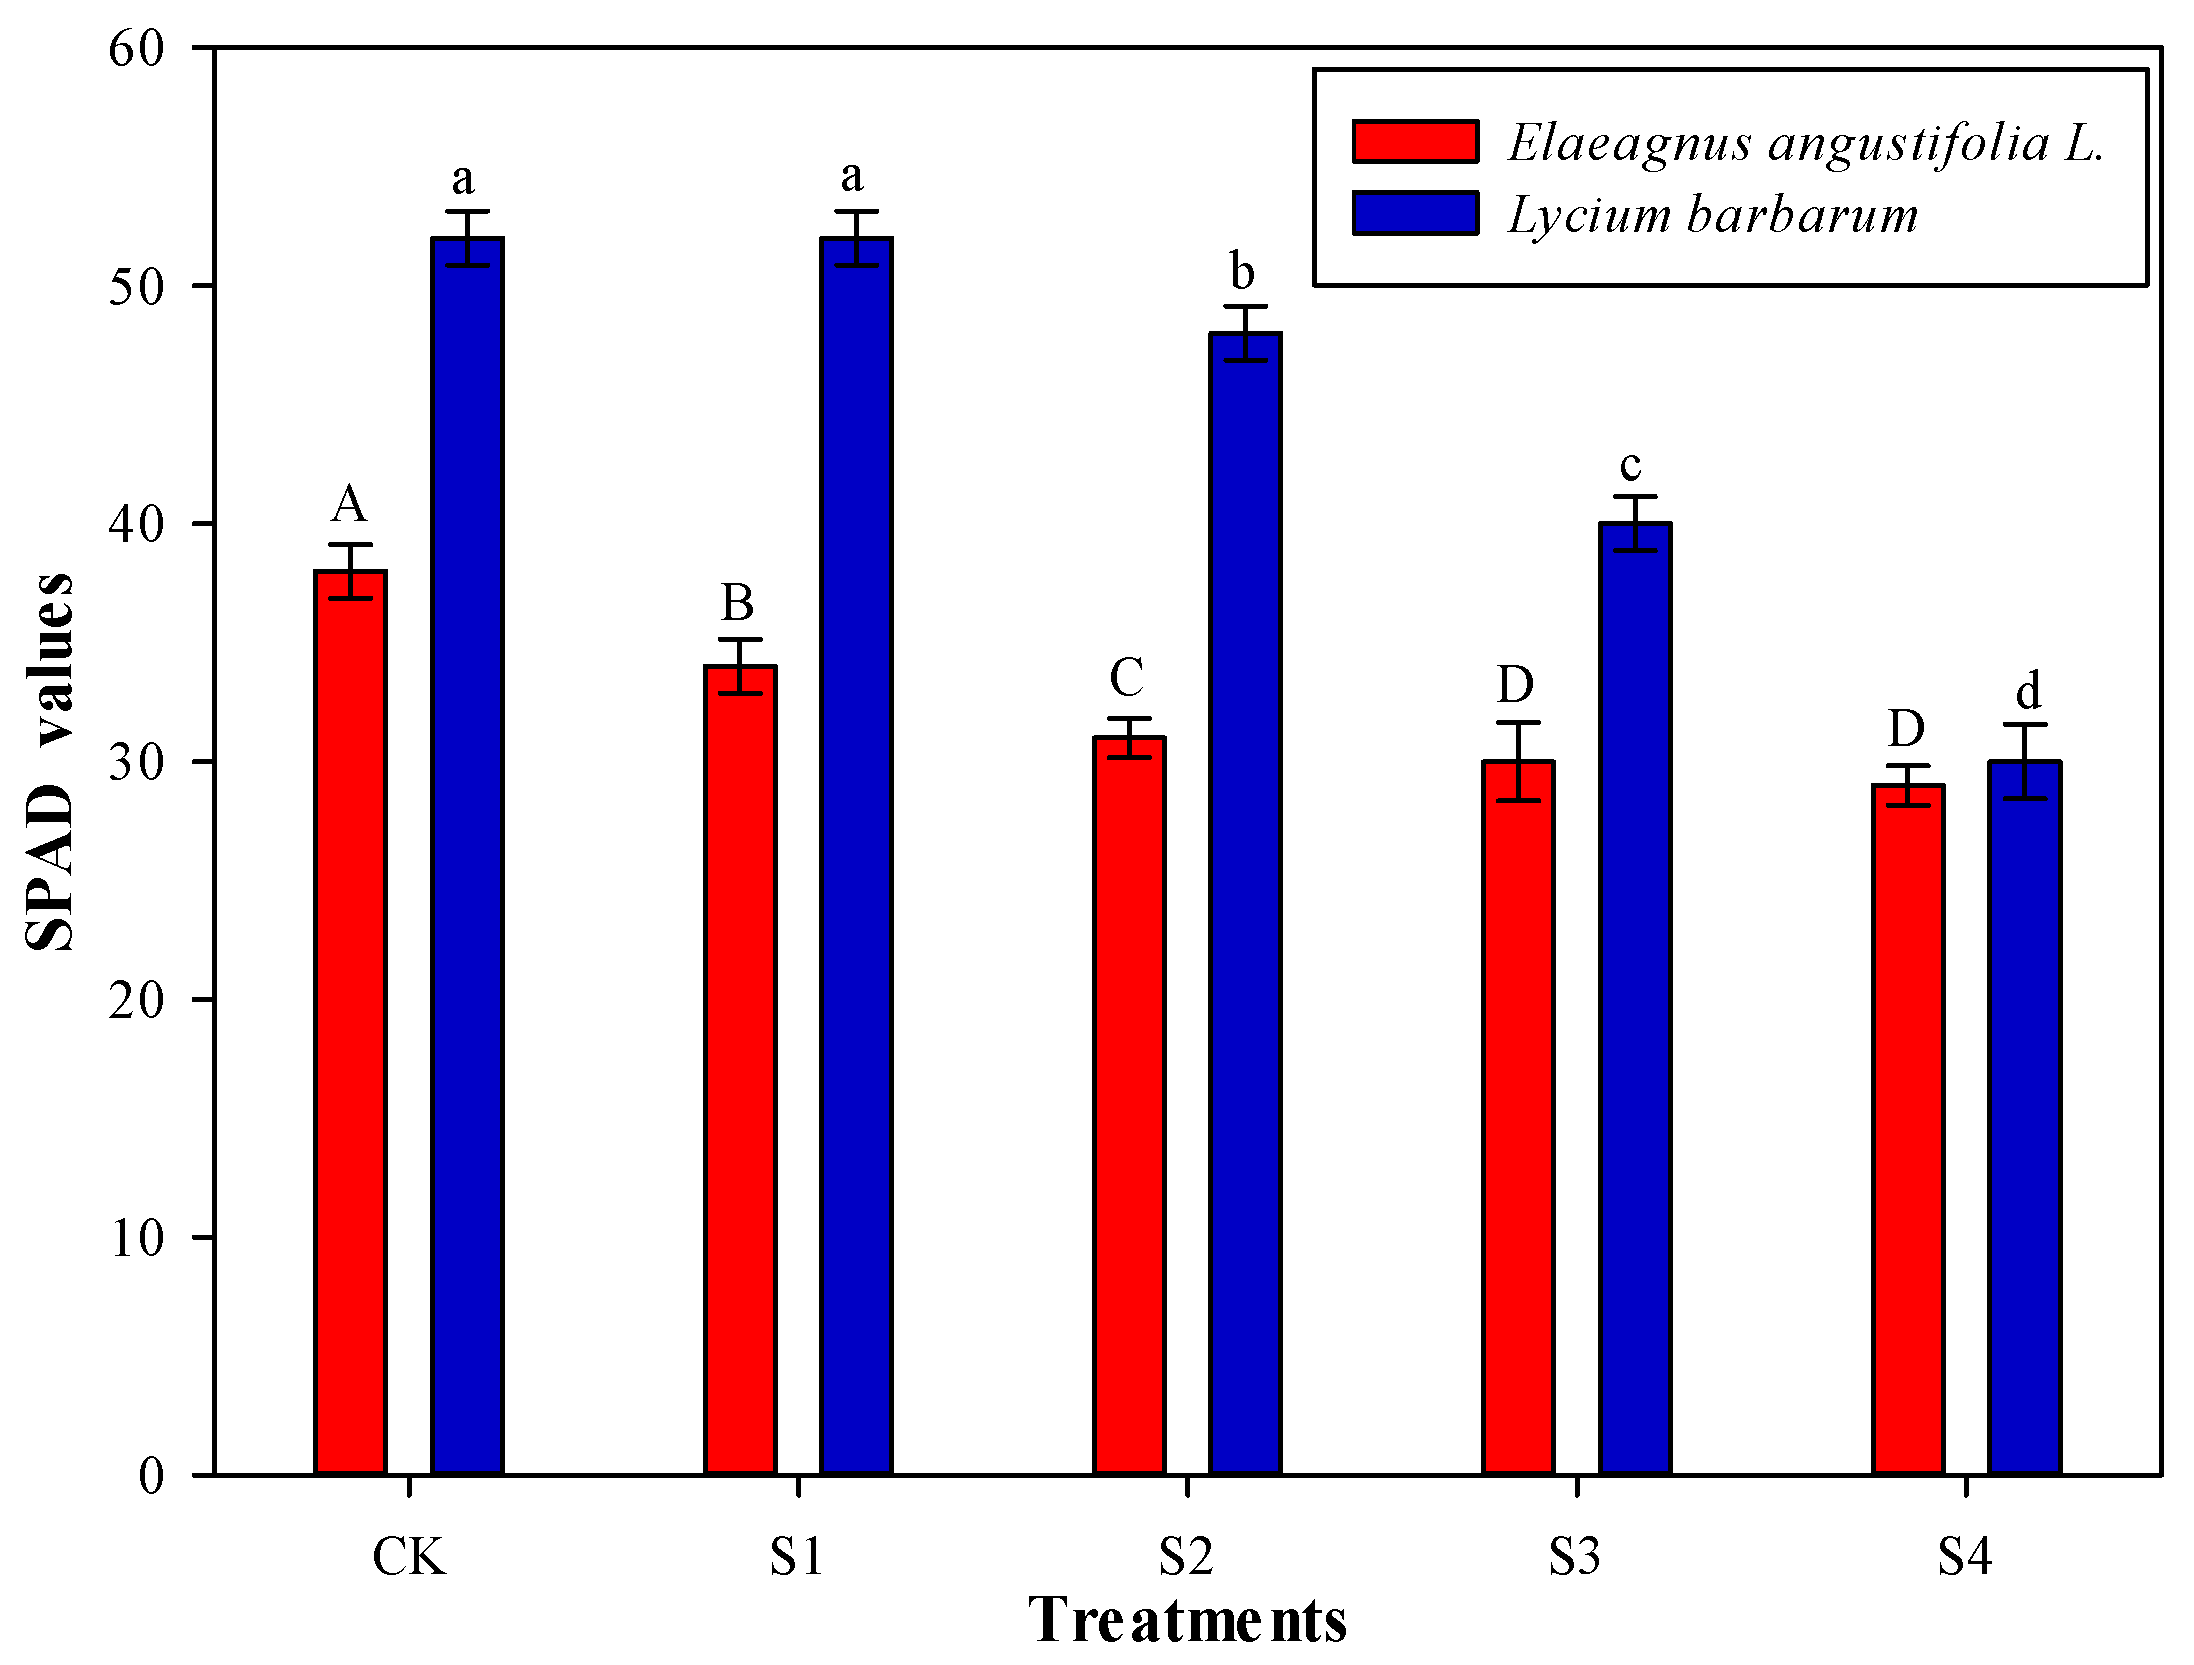
3.2. Effects of Salt Stress on Chlorophyll Content of Shrubs

The SPAD value can be used as an indicator to reflect the differences in chlorophyll content per unit area of the leaf, which can indicate the relative level of chlorophyll [24] and allows an assumption about the functioning of the entire photosynthetic system [3]. Previous studies have shown that the SPAD value measured by the SPAD chlorophyll meter is highly correlated with the chlorophyll content [25]. The SPAD value indicates that the chlorophyll content can not only perform the non-destructive measurement very conveniently, but also that the scientific data is scientifically rigorous [26]. In general, the SPAD value of E. angustifolia was higher than that of L. barbarum. With increasing salt stress, the SPAD values decreased (Figure 3). At a salt concentration of 100 mmol·L−1, the SPAD values were significantly lower than those of the control group (p < 0.05), indicating that salt stress can significantly reduce the chlorophyll content in leaves of E. angustifolia and L. barbarum. In E. angustifolia under salt stress, the chlorophyll content decreased significantly with increasing salt concentration (p < 0.05). The chlorophyll content of L. barbarum at salt concentrations of 200 and 300 mmol·L−1 was 15.2 and 30.7% lower, respectively, than that of the control group. However, there was no significant difference in SPAD values of L. barbarum at salt concentrations of 300 and 400 mmol·L−1. With increasing salt stress, the SPAD value of E. angustifolia decreased more rapidly than that of L. barbarum, indicating a greater damage to E. angustifolia. Wang et al. have reported that the effects of salt stress on chlorophyll are species-specific, and other studies have shown that salt stress can inhibit the chlorophyll synthesis of plants, which is similar to the inhibition of growth and closely related to salt concentration [26,27]. At higher salt concentrations, plant chlorophyll content generally decreases [28]. Gouveianeto et al. have suggested that the main reason for the decrease in chlorophyll content caused by high salt concentrations is the blocking of the electron transport [29].

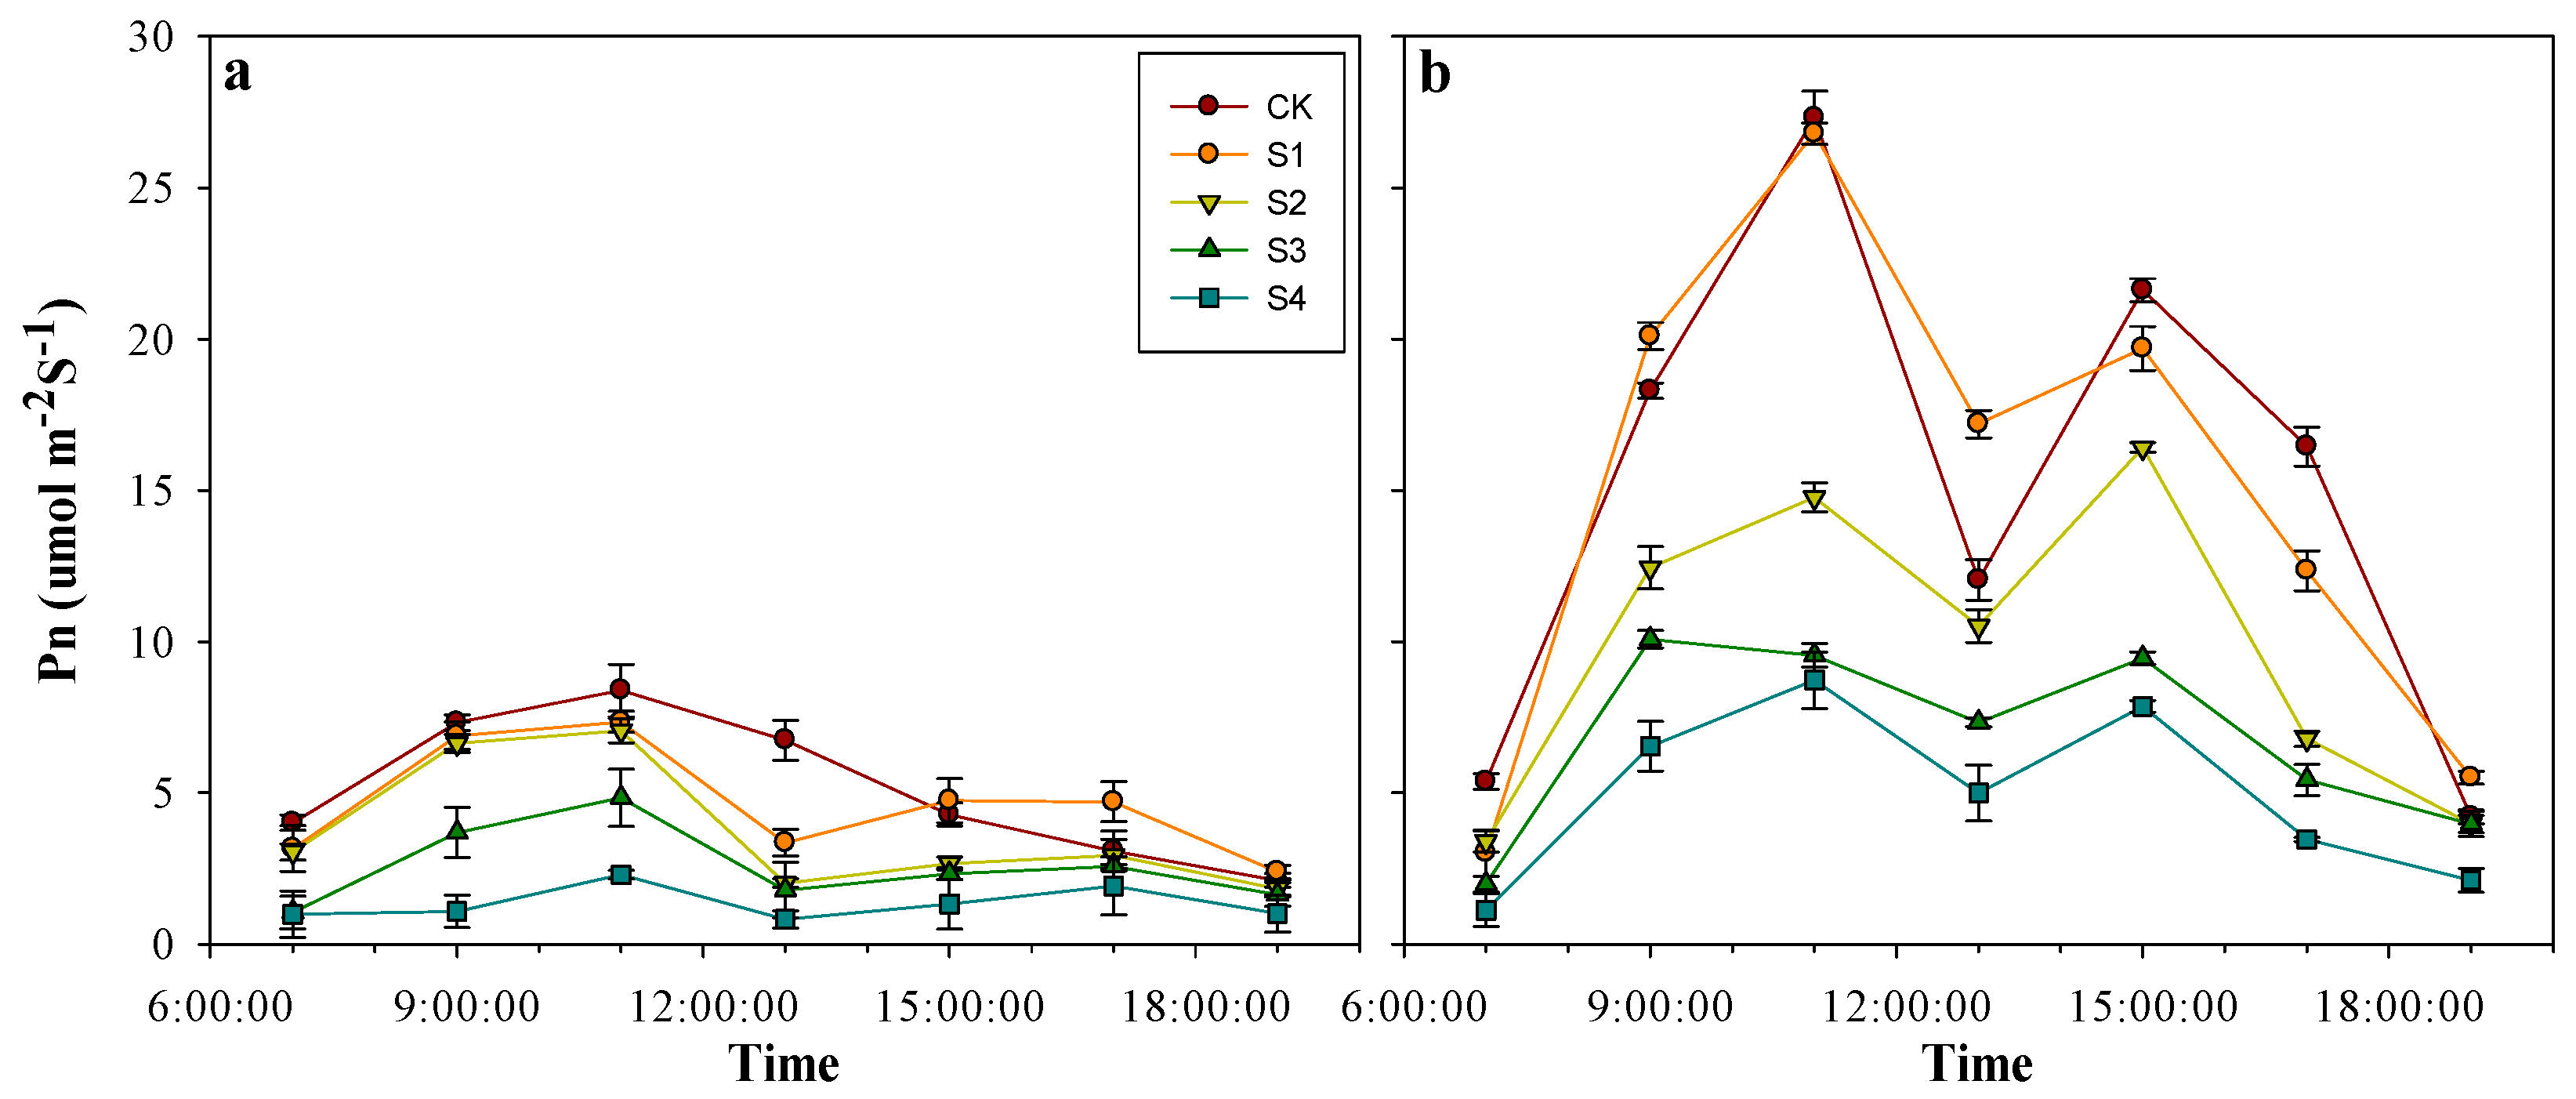
3.3. Effects of Salt Stress on Photosynthesis

Numerous studies have shown that salt-alkaline stress can inhibit plant photosynthesis, which is similar to the inhibition of growth and is closely related to the salt concentration [30,31,32]. The net photosynthetic rates of E. angustifolia and L. barbarum decreased with increasing salt stress (p < 0.05) (Figure 4), indicating inhibition of photosynthesis. Doubnerová and Ryšlaváhave suggested that when the salt concentration in the soil exceeds a certain threshold, photosynthesis is inhibited [33]. According to our results, the diurnal variation of photosynthesis rate of E. angustifolia and L. barbarum represented a bimodal curve. The photosynthetic lunch break of the control is about 13:00. The photosynthetic lunch break of the salt treatment occurs at around 11:00. The second peak appeared at around 15:00, although the photosynthetic rate of the first peak was significantly larger than that of the second peak. The daily mean value of the net photosynthetic rate also decreased with increasing salt stress, with values for E. angustifolia at 100, 200, 300, and 400 mmol·L−1 of 5.22, 4.47, 3.31, and 2.14 μmol∙m−2∙s−1, being 8.14, 21.43, 41.88, and 62.33% lower than those of the control group, respectively (p < 0.05).
For L. barbarum, the diurnal variation of the net photosynthetic rate showed a “double peak” curve under salt stress. With increasing temperature, solar radiation, and saturated water vapor pressure difference, the net photosynthetic rate of L. barbarum in each treatment group increased rapidly from 7:00 to 11:00 and reached its peak value for the first time at 11:00, with values of 27.23, 26.80, 14.78, 9.56, and 8 μmol∙m−2∙s−1, respectively (p < 0.05). The net photosynthetic rate of L. barbarum was significantly lower than that of the control group when the concentration was higher than 100 mmol·L−1. At 11:00–15:00, the solar radiation and temperature reached the highest values, and stomatal regulation was carried out by L. barbarum to prevent excessive water loss. At 15:00, the second photosynthesis peak occurred, with 21.62 μmol∙m−2∙s−1, 19.70 μmol∙m−2∙s−1, 11.42 μmol∙m−2∙s−1, 9.46 μmol∙m−2∙s−1 and 7.85 μmol∙m−2∙s−1 at 0 mmol·L−1, 100 mmol·L−1, 200 mmol·L−1, 300 mmol·L−1, and 400 mmol·L−1, respectively.
The salt concentration of 100 mmol·L−1 had no significant effect on net photosynthesis of L. barbarum. However, at concentration above 100 mmol·L−1, the net photosynthesis rate of L. barbarum showed a significant downward trend and decreased by 41.1%, 55.5%, and 66.3% at 200 mmol·L−1, 300 mmol·L−1, and 400 mmol·L−1, respectively (p < 0.05). The maximum net photosynthesis rate of L. barbarum decreased more significantly than that of E. angustifolia, indicating a stronger effect of NaCl on L. barbarum. Several studies have suggested two main reasons for the decrease in net photosynthetic rate under saline-alkaline stress, namely stomatal restriction caused by partial closure of stomata and decreased cell viability [34,35,36]. The decrease in intercellular carbon dioxide concentration and stomatal conductance were the main reasons for the decreased photosynthesis rates [37].

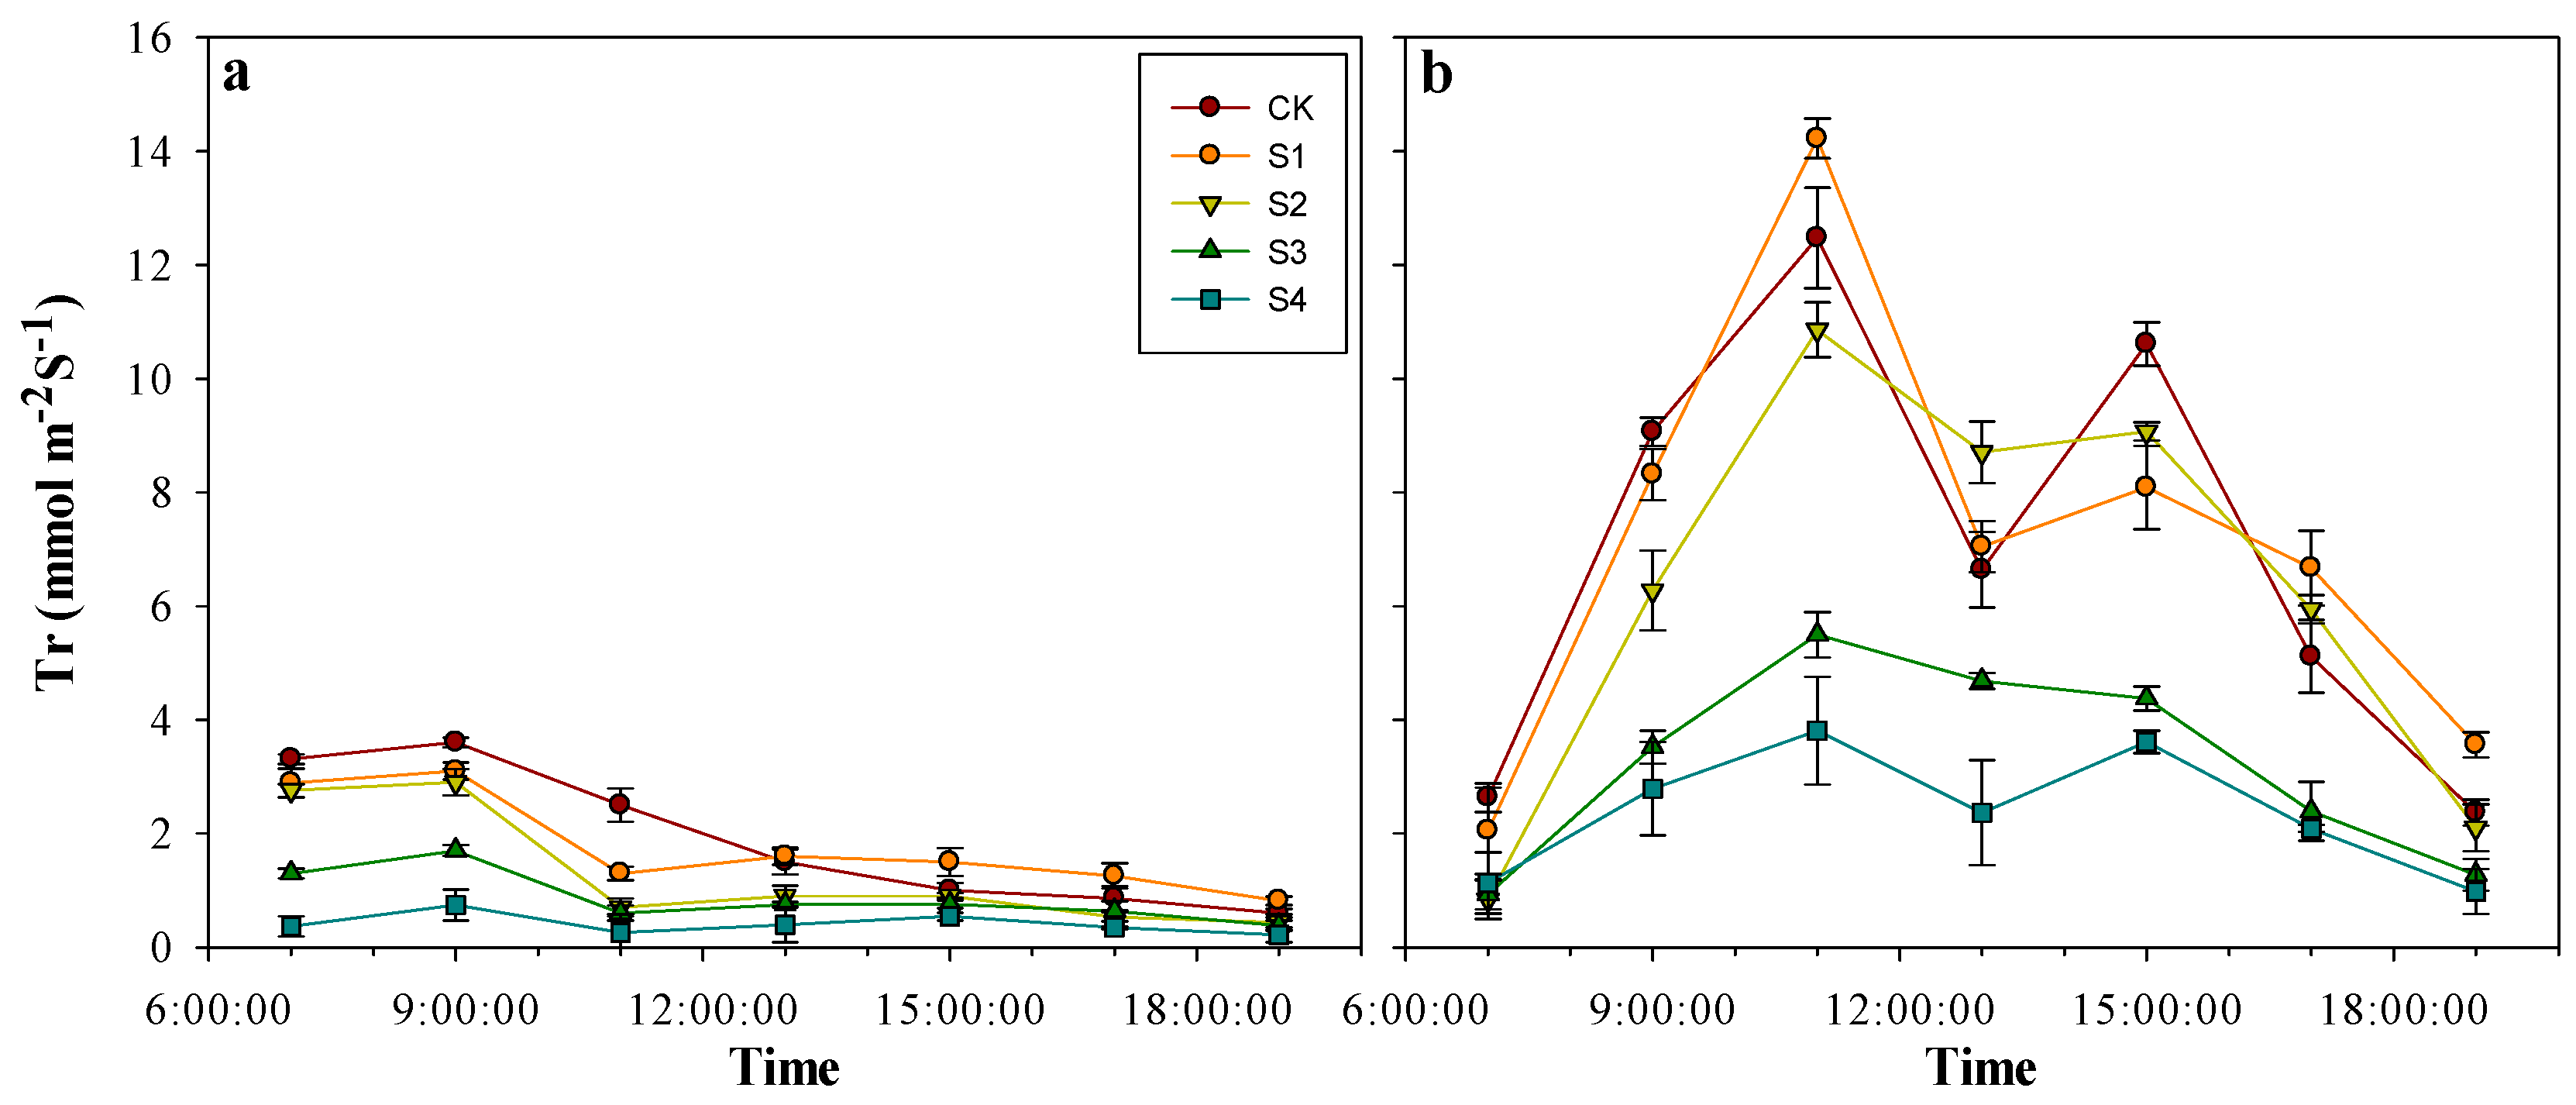
3.4. Effects of Salt Stress on Transpiration

Transpiration was the main pathway of water loss and reflects the potential of plant water consumption and adaptability to the environmental changes. With increasing salt stress, the peak value of the transpiration rate of E. angustifolia decreased gradually (Figure 5). The diurnal variation in transpiration rate of E. angustifolia was comparable to that in net photosynthesis rate, which showed a bimodal curve. The two peaks appeared at the same time under different treatments (p < 0.05). The first peak was around 11:00 a.m., while the second and lower peak was observed at about 15:00. The daily mean values of the S1 to S4 treatments were 70.74%, 60.52%, 36.25%, and 22.14% lower than that of the control group, respectively (p < 0.05).
For L. barbarum, the diurnal variation in transpiration rate showed a “double peak” curve under salt stress. With increasing temperature, solar radiation, and saturated water vapor pressure difference, the net transpiration rate of L. barbarum in each treatment group increased rapidly from 7:00 to 11:00 and reached its peak value for the first time at 11:00, with peak values of 15.48 mmol∙m−2∙s−1, 14.22 mmol∙m−2∙s−1, 10.86 mmol∙m−2∙s−1, 5.50 mmol∙m−2∙s−1, and 3.81 mmol∙m−2∙s−1, respectively. The transpiration rate of L. barbarum was significantly lower than that of the control group when the concentration was higher than 100 mmol·L−1. At 11:00–15:00, solar radiation and temperature reached the highest values, and L. barbrum carried out stomatal regulation to prevent excessive water loss. At 15:00, the second transpiration peaks occurred, with 16.61, 15.09, 7.07, 4.38, and 3.61 mmol∙m−2∙s−1 at 0, 100, 200, 300, and 400 mmol·L−1, respectively (p < 0.05). The transpiration rates of L. barbarum were decreased by 39.8, 68.3, and 75.4% at 200, 300, and 400 mmol·L−1, respectively (p < 0.05). The maximum net photosynthetic rate of L. barbarum decreased more significantly than that of E. angustifolia, again indication a more distinct effect of NaCl on L. barbarum. Andriani et al. have also found that the transpiration rate of shrubs decreased gradually under salt stress [38]. According to Farquhar’s classical theory, when both intercellular carbon dioxide concentration and stomatal conductance show a downward trend at the same time, the reason for the inhibition of plant photosynthesis under stress is stomatal limitation, in contrast to non-stomatal limitation [39]. According to a previous study, the decrease in intercellular carbon dioxide concentration and stomatal conductance are the main reasons for the decrease in transpiration rate [40].

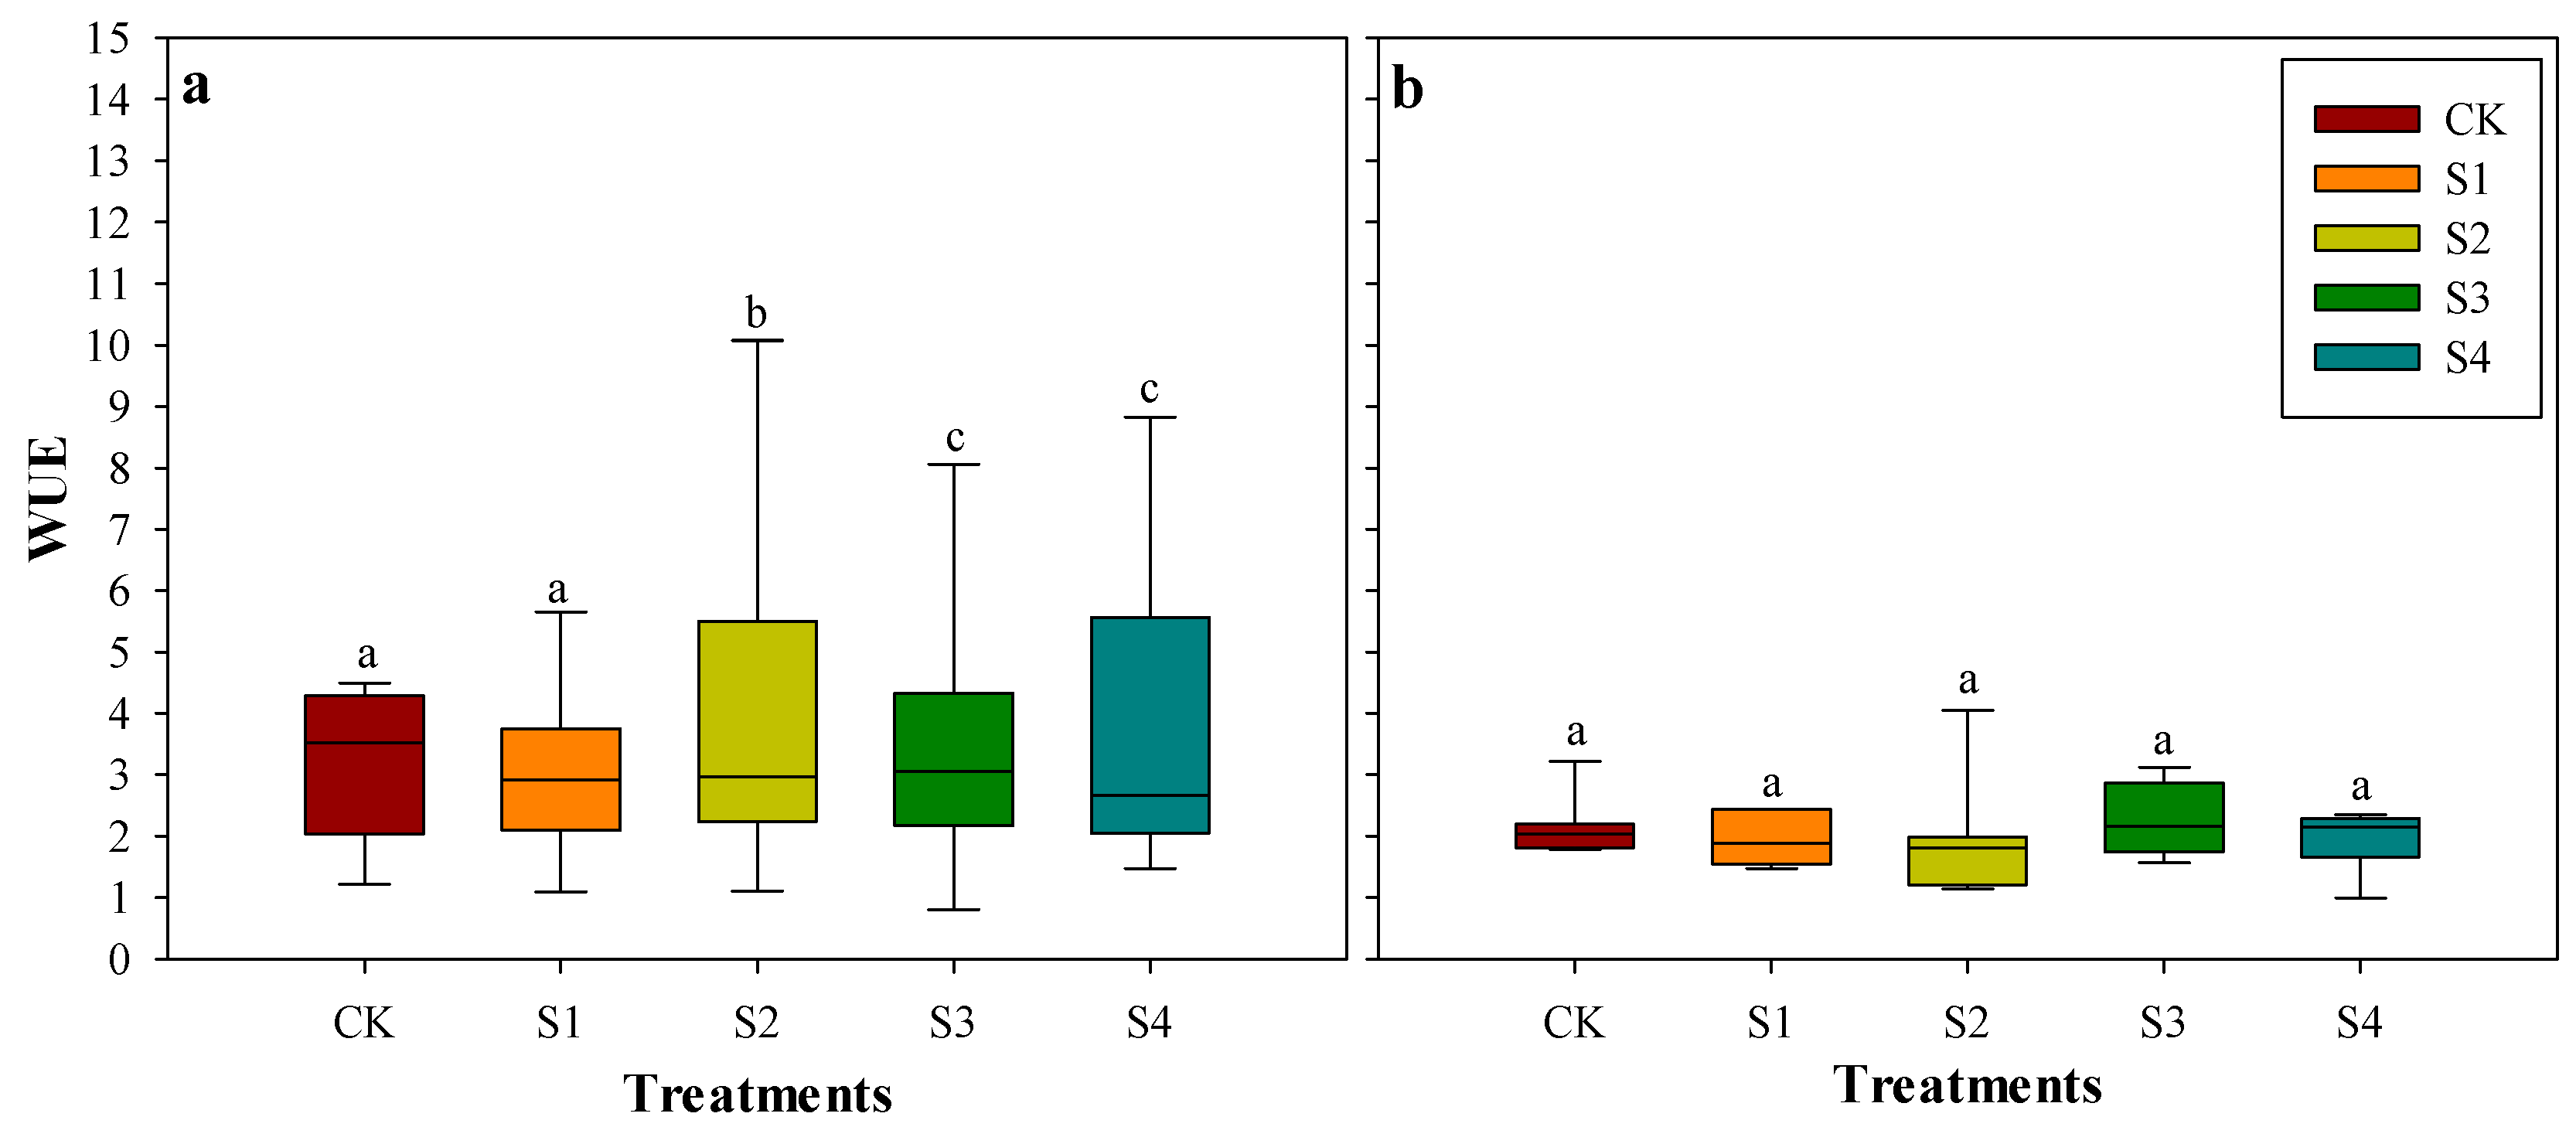
3.5. Effects of Salt Stress on Water Use Efficiency

The WUE of E. angustifolia under salt stress was significantly higher than that of the control (p < 0.05; Figure 6). The daily mean values of WUE of E. angustifolia under the treatments S1-S4 were 109.41, 119.74, 135.28, and 156.01%, respectively. Although NaCl salt stress can reduce the photosynthesis and transpiration rates of E. angustifolia, it improves water use efficiency in this species, and the difference between the two species will gradually increase with increasing NaCl concentrations. Yue et al. and Farissi et al. have found similar variation in Kosteletzfkya virginica L. Presl and Quercus aliena [41,42]. Since E. angustifolia is a salt-tolerant plant species [43], under salt stress, it reduces its water consumption and therefore improves its water use efficiency. However, the WUE of L. barbarum under salt stress was not significantly different from that of the control group (p > 0.05).

3.6. Evaluation of the Effect of Saline Stress on E. angustifolia and L. barbarum

The use of only one indicator does not adequately reflect salt tolerance [44], making it necessary to comprehensively compare and analyze multiple indicators [45]. Different scholars also use different methods for the evaluation of salt tolerance in different plant species [45]. In this study, 10 photosynthetic indices, including T, SPAD, Pn, Gs, Ci, Tr, Pnmax, AQY, RD, LCP, and LSP, were determined under salt-alkaline stress. The correlation between the above indices and salt concentration was analyzed, and the chlorophyll contents with the highest correlation coefficient and net photosynthetic rate were selected to characterize the overall photosynthetic system (Table 2). The results showed that under NaCl stress, with increasing salt concentrations, the salt tolerance of E. angustifolia and L. barbarum was increased. Chlorophyll content and net photosynthetic rate were fitted with the salt-alkaline concentration, and the salt concentration was taken as the salt-alkaline tolerance threshold when each index exceeded 50% of that of the control group. The threshold was calculated via a regression equation. The thresholds of the effects of salt stress on chlorophyll content and net photosynthetic rate were 128.4 and 108.4 mmol·L−1, respectively. The minimum value of 108.4 mmol·L−1 was taken as the salt tolerance threshold of E. angustifolia. The thresholds of the effects of salt stress on chlorophyll content and net photosynthetic rate were 263.2 and 246.3 mmol·L−1, respectively, and the minimum value of 246.3 mmol·L−1 was taken as the salt tolerance threshold of L. barbarum. The salt tolerance of L. barbarum was higher than that of E. angustifolia under NaCl concentrations of 100, 200, 300, and 400 mmol·L−1.

4. Conclusions

The pioneering tree species of jujube and alfalfa in the afforestation of saline-alkali land in northwestern China have already exerted important ecological, economic and social benefits. The salinization of the Qaidam Basin has become increasingly serious and significantly limits the economic development of the region. The photosynthetic parameters of the shrub species E. angustifolia were more sensitive to salinity than those of L. barbarum. The decrease in photosynthetic parameters of both shrub species was due to the combination of stomatal and non-stomatal constraints. The results of correlation matrix of photosynthetic index also indicated that the minimum salt tolerance of E. angustifolia and L. barbarum were 108.4 mmol·L−1 and 246.3 mmol·L−1, respectively. According to the salt tolerance thresholds of different plant species, suitable species can be selected for revegetation programs to facilitate the improvement of saline-alkaline soils. For example, ideal planting and development conditions for E. angustifolia could be in the 0-108.4 mmol·L−1 of soil salt concentration; but it was more suitable to plant L. barbarum in 108.4-246.3 mmol·L−1 of soil salt concentration. In field production, when the salt and alkali concentration of soil solution exceeds this threshold, irrigation should be carried out in time.

Author Contributions

T.Z. wrote the paper; Z.Z. conceived and designed the experiments; Y.L. analyzed the data; K.H. performed the experiments and collected the data.

Funding

The study was supported by Province key scientific and technological Projects, Qinghai province, China (Grant No. 2014-NK-A4-4).

Acknowledgments

We thank LetPub (www.letpub.com) for its linguistic assistance during the preparation of this manuscript.

Conflicts of Interest

The authors declare no conflict of interest.

References

  1. Jesus, J.; Castro, F.; Niemelä, A.; Borges, M.T.; Danko, A.S. Evaluation of the impact of different soil salinization processes on organic and mineral soils. Water Air Soil Pollut. 2015, 226, 1–12. [Google Scholar] [CrossRef]
  2. Satoshi, Y. Responses of crops to soil salinization in south Baja California, Mexico. J. Plant Nutr. 2008, 31, 1800–1810. [Google Scholar] [CrossRef]
  3. Zhou, H.; Li, W. The effects of oasis ecosystem hydrological processes on soil salinization in the lower reaches of the tarim river, China. Ecohydrology 2013, 6, 1009–1020. [Google Scholar] [CrossRef]
  4. Haj-Amor, Z.; Hashemi, H.; Bouri, S. Soil salinization and critical shallow groundwater depth under saline irrigation condition in a Saharan irrigated land. Arabian J. Geosci. 2017, 10, 301. [Google Scholar] [CrossRef]
  5. Schofield, R.V.; Kirkby, M.J. Application of salinization indicators and initial development of potential global soil salinization scenario under climatic change. Glob. Biogeochem. Cycles. 2003, 17. [Google Scholar] [CrossRef]
  6. Qin, Y.; Druzhinina, I.S.; Pan, X.; Yuan, Z. Microbially mediated plant salt tolerance and microbiome-based solutions for saline agriculture. Biotechnol. Adv. 2016, 34, 1245–1259. [Google Scholar] [CrossRef]
  7. Wang, M.; Xie, B.; Fu, Y.; Dong, C.; Hui, L.; Guang, H.L.; Liu, H. Effects of different elevated CO2 concentrations on chlorophyll contents, gas exchange, water use efficiency, and psii activity on C3 and C4 cereal crops in a closed artificial ecosystem. Photosynth. Res. 2015, 126, 351–362. [Google Scholar] [CrossRef]
  8. Berguerand, N.; Marinkovic, J.; Vilches, T.B.; Thunman, H. Use of alkali-feldspar as bed material for upgrading a biomass-derived producer gas from a gasifier. Chem. Eng. J. 2016, 295, 80–91. [Google Scholar] [CrossRef]
  9. Tao, Y.; Wu, G.L.; Zhang, Y.M. Dune-scale distribution pattern of herbaceous plants and their relationship with environmental factors in a saline-alkali desert in central Asia. Sci. Total Environ. 2017, 576, 473–480. [Google Scholar] [CrossRef]
  10. Martín-Alfonso, J.E.; López-Beltrán, F.; Valencia, C.; Franco, J.M. Effect of an alkali treatment on the development of cellulose pulp-based gel-like dispersions in vegetable oil for use as lubricants. Tribol. Int. 2018, 123. [Google Scholar] [CrossRef]
  11. Peng, M.; Jia, H.; Wang, Q. The effect of land use on bacterial communities in saline-alkali soil. Curr. Microbiol. 2017, 74, 325–333. [Google Scholar] [CrossRef] [PubMed]
  12. Ramos-Alemán, F.; González-Jasso, E.; Pless, R.C. Use of alternative alkali chlorides in RT and PCR of polynucleotides containing G quadruplex structures. Analytical Biochem. 2018, 543, 43. [Google Scholar] [CrossRef] [PubMed]
  13. Czinkota, I.; Issa, I.; Rétháti, G.; Kovács, B. Determination of the behaviour and the transport parameters of chromium in soil-water systems. Agrokémia És Talajtan. 2007, 55, 287–294. [Google Scholar] [CrossRef]
  14. Patel, A.D.; Panchal, N.S.; Pandey, I.B.; Pandey, A.N. Growth, water status and nutrient accumulation of seedlings of jatropha curcas l. (euphorbiaceae) in response to soil salinity. Anales De Biología 2010, 52, 59–71. [Google Scholar] [CrossRef]
  15. Zhou, H.; Li, W. Effect of water resource on soil salinization of oasis in the lower reaches of tarim river, China. Proced. Environ. Sci. 2011, 11, 925–933. [Google Scholar] [CrossRef]
  16. Laplante, S.R.; Fader, L.D.; Fandrick, K.R.; Fandrick, D.R.; Hucke, O.; Kemper, R.; Miller, S.P.F.; Edwards, P.J. Assessing atropisomer axial chirality in drug discovery and development. J. Med. Chem. 2011, 54, 7005. [Google Scholar] [CrossRef] [PubMed]
  17. Guo, W.; Cong, Y.; Hussain, N.; Wang, Y.; Liu, Z.; Jiang, L.; Liang, Z.; Chen, K. The remodeling of seedling development in response to long-term magnesium toxicity and regulation by aba-della signaling in arabidopsis. Plant Cell Physiol. 2014, 55, 1713–1726. [Google Scholar] [CrossRef]
  18. Patel, N.T.; Pandey, A.N. Effect of soil salinity on growth, water status and nutrient accumulation in seedlings of suaeda nudiflora (chenopodiaceae). Anales De Biología 2009, 31, 61–70. [Google Scholar] [CrossRef]
  19. Fraga, T.I.; Carmona, F.D.C.; Anghinoni, I.; Marcolin, E. Attributes of irrigated rice and soil solution as affected by salinity levels of the water layer atributos de arroz irrigado e da solução do solo influenciados por níveis de salinidade da lâmina de água de irrigação. Revista Brasileira De Ciência Do Solo 2010, 34, 1049–1057. [Google Scholar] [CrossRef]
  20. Darlington, A.M.; Jarisz, T.A.; Dewaltkerian, E.L.; Roy, S.; Sun, K.; Azam, M.S. Separating the ph-dependent behavior of water in the stern and diffuse layers with varying salt concentration. J. Phys. Chem. C. 2017, 121. [Google Scholar] [CrossRef]
  21. Aryal, D.; Ganesan, V. Reversal of salt concentration dependencies of salt and water diffusivities in polymer electrolyte membranes. Acs Macro Lett. 2018, 7, 739–744. [Google Scholar] [CrossRef]
  22. Caruso, C.; Maucieri, C.; Berruti, A.; Borin, M.; Barbera, A.C. Responses of Different Panicum miliaceum L. Genotypes to Saline and Water Stress in a Marginal Mediterranean Environment. Agronomy 2018, 8, 8. [Google Scholar] [CrossRef]
  23. Maucieri, C.; Caruso, C.; Bona, S.; Borin, M.; Barbera, A.C.; Cavallaro, V. Influence of salinity and osmotic stress on germination process in an old sicilian landrace and a modern cultivar of Triticum Durum Desf. Cereal Res. Commun. 2018, 46, 253–262. [Google Scholar] [CrossRef]
  24. Ibrahim, M.H.; Jaafar, H.Z.E. Relationship between extractable chlorophyll content and spad values in three varieties of kacip fatimah under greenhouse conditions. J. Plant Nutr. 2013, 36, 1366–1372. [Google Scholar] [CrossRef]
  25. Anand, M.H.; Byju, G. Chlorophyll meter and leaf colour chart to estimate chlorophyllcontent, leaf colour, and yield of cassava. Photosynthetica 2008, 46, 511–516. [Google Scholar] [CrossRef]
  26. Wang, X.; Geng, S.; Ma, Y.; Shi, D.; Yang, C.; Wang, H. Growth, photosynthesis, solute accumulation, and ion balance of tomato plant under sodium- or potassium-salt stress and alkali stress. Agron. J. 2015, 65, 927–928. [Google Scholar] [CrossRef]
  27. Bergmann, I.; Geiß-Brunschweiger, U.; Hagemann, M.; Schoor, A. Salinity tolerance of the chlorophyll b -synthesizing cyanobacterium prochlorothrix hollandica, strain sag 10.89. Microb. Ecol. 2008, 55, 685–696. [Google Scholar] [CrossRef] [PubMed]
  28. Yildirim, E.; Turan, M.; Guvenc, I. Effect of foliar salicylic acid applications on growth, chlorophyll, and mineral content of cucumber grown under salt stress. J. Plant Nutr. 2008, 31, 593–612. [Google Scholar] [CrossRef]
  29. Gouveianeto, A.S.; Silva, E.A.J.; Oliveira, R.A.; Moura, D.S.; Cunha, P.C.; Costa, E.B.; Câmara, T.J.R.; Willadino, L.G. Water deficit and salt stress diagnosis through led induced chlorophyll fluorescence analysis in jatropha curcas l. oil plants for biodiesel. J. Fluoresc. 2011, 22, 623–630. [Google Scholar] [CrossRef]
  30. Yang, C.W.; Wang, P.; Li, C.Y.; Shi, D.C.; Wang, D.L. Comparison of effects of salt and alkali stresses on the growth and photosynthesis of wheat. Photosynthetica 2008, 46, 107–114. [Google Scholar] [CrossRef]
  31. Wang, Y.; Yan, L. Land exploitation resulting in soil salinization in a desert–oasis ecotone. Catena. 2013, 100, 50–56. [Google Scholar] [CrossRef]
  32. Silva, E.N.D.; Ribeiro, R.V.; Ferreirasilva, S.L.; Viégas, R.A.; Silveira, J.A.G. Salt stress induced damages on the photosynthesis of physic nut young plants. Scientia Agricola. 2011, 68, 62–68. [Google Scholar] [CrossRef]
  33. Doubnerová, V.; Ryšlavá, H. What can enzymes of C4, photosynthesis do for C3, plants under stress? Plant Sci. 2011, 180, 575–583. [Google Scholar] [CrossRef] [PubMed]
  34. Andriani, A.; Tachibana, S.; Itoh, K. Effects of saline-alkaline stress on benzo[a]pyrene biotransformation and ligninolytic enzyme expression by Bjerkandera adusta, SM46. World J. Microbiol. Biotechnol. 2016, 32, 1–16. [Google Scholar] [CrossRef] [PubMed]
  35. Mercedes-Martín, R.; Rogerson, M.R.; Brasier, A.T.; Vonhof, H.B.; Prior, T.J.; Fellows, S.M.; Reijmer, J.J.G.; Billing, I.; Pedleya, H.M. Growing spherulitic calcite grains in saline, hyperalkaline lakes: Experimental evaluation of the effects of Mg-clays and organic acids. Sediment. Geol. 2016, 335, 93–102. [Google Scholar] [CrossRef]
  36. Krishnamurthy, S.L.; Sharma, P.C.; Sharma, D.K.; Ravikiran, K.T.; Singh, Y.P.; Mishra, V.K.; Burman, D.; Maji, B.; Mandal, S.; Sarangi, S.K.; et al. Identification of mega-environments and rice genotypes for general and specific adaptation to saline and alkaline stresses in India. Sci. Rep. 2017, 7, 7968. [Google Scholar] [CrossRef] [PubMed]
  37. Sorokin, D.Y.; Kolganova, T.V.; Khijniak, T.V.; Jones, B.E.; Kublanov, I.V. Diversity of cultivated aerobic poly-hydrolytic bacteria in saline alkaline soils. Peerj 2017, 2017, 3796. [Google Scholar] [CrossRef]
  38. Noormets, A.; Sôber, A.; Pell, E.J.; Dickson, R.E.; Podil, G.K.; Sôber, J.; Isebrands, J.G.; Karnosky, D.F. Stomatal and non-stomatal limitation to photosynthesis in two trembling aspen (populus tremuloides michx.) clones exposed to elevated CO2 and/or O3. Plant Cell Environ. 2010, 24, 327–336. [Google Scholar] [CrossRef]
  39. Varonea, L.; Ribas-Carbob, M.; Cardonac, C.; Galléb, A.; Medranob, H.; Gratania, L.; Flexasb, J. Stomatal and non-stomatal limitations to photosynthesis in seedlings and saplings of mediterranean species pre-conditioned and aged in nurseries: Different response to water stress. Environ. Exp. Botany. 2012, 75, 235–247. [Google Scholar] [CrossRef]
  40. Yue, L.J.; Li, S.X.; Ma, Q.; Zhou, X.R.; Wu, G.Q.; Bao, A.K.; Zhang, J.L.; Wang, S.M. NaCl stimulates growth and alleviates water stress in the xerophyte zygophyllum xanthoxylum. J. Arid Environ. 2012, 87, 153–160. [Google Scholar] [CrossRef]
  41. Farissi, M.; Faghire, M.; Bargaz, A.; Bouizgaren, A.; Makoudi, B.; Ghoulam, C. Growth, nutrients concentrations, and enzymes involved in plants nutrition of alfalfa populations under saline conditions. J. Agric. Sci. Technol. 2014, 16, 301–314. [Google Scholar] [CrossRef]
  42. Jiao, Y.; Bai, Z.; Xu, J.; Zhao, M.; Khan, Y.; Hu, Y.; Shi, L. Metabolomics and its physiological regulation process reveal the salt-tolerant mechanism in Glycine soja seedling roots. Plant Physiol. Biochem. 2018, 126, 187–196. [Google Scholar] [CrossRef] [PubMed]
  43. Lee, K.B.; Kang, J.G.; Li, J.; Lee, D.B.; Park, C.W.; Kim, J.D. Evaluation of salt-tolerance plant for improving saline soil of reclaimed land. Korean J. Soil Sci. Fertil. 2007, 40, 173–180. [Google Scholar]
  44. Zhang, X.; Lu, G.; Long, W.; Zou, X.; Li, F.; Nishio, T. Recent progress in drought and salt tolerance studies in brassica crops. Breed Sci. 2014, 64, 60–73. [Google Scholar] [CrossRef] [PubMed]
  45. Talei, D.; Yusop, M.K.; Kadir, M.A.; Abdullah, M.P.; Valdiani, A. Response of king of bitters (andrographis paniculata nees.) seedlings to salinity stress beyond the salt tolerance threshold. Aust. J. Crop Sci. 2012, 6, 1059–1067. [Google Scholar]
Figure 1. Geographic map of the study area.
Sustainability 11 00828 g001
Figure 2. Daily variations in meteorological factors and soil and water content at a typical sunny day. The (a), (b) and (c) were the variation of radiation, temperature and soil and water content, respectively. The data in figure were mean ± S.D.
Sustainability 11 00828 g002
Figure 3. Mean (± S.D.) SPAD values of the shrub species E. angustifolia and L. barbarum at different salt concentrations. The SPAD is Soil and Plant Analyzer Development. The CK, S1, S2, S3, S4 were the salt concentrations were 0, 100, 200, 300 and 400 mmol·L−1, respectively. Uppercase and lowercase letters indicate significant differences among treatments for E. angustifolia and L. barbarum, respectively, at p < 0.05 with T test.
Sustainability 11 00828 g003
Figure 4. Changes in mean (± S.D.) net photosynthetic rates of the shrub species E. angustifolia and L. barbarum at different salt concentrations throughout the day. The (a) and (b) in bold are represented E. angustifolia and L. barbarum respectively.
Sustainability 11 00828 g004
Figure 5. Changes in mean (± S.D.) transpiration rates of the shrub species E. angustifolia and L. barbarum at different salt concentrations throughout the day. The (a) and (b) in bold are represented E. angustifolia and L. barbarum respectively.
Sustainability 11 00828 g005
Figure 6. Changes in mean (± S.D.) water use efficiency of the shrub species E. angustifolia and L. barbarum at different salt concentrations throughout the day. The (a) and (b) in bold are represented E. angustifolia and L. barbarum respectively. Lowercase letters indicate significant differences among treatments for E. angustifolia and L. barbarum, respectively, at p < 0.05 with T test.
Sustainability 11 00828 g006
Table 1. Growth parameters of the different shrub species.
SpeciesHeight (cm)DBH (cm)CKS1S2S3S4
NaClECNaClECNaClECNaClECNaClEC
Elaeagnus angustifolia57.94 ± 0.781.27 ± 0.08001004720095300145400196
Lycium barbarum40.28 ± 0.491.26 ± 0.06
DBH is diameter at breast height; CK is control check; S1, S2, S3, S4 are NaCl at concentrations of 100, 200, 300 and 400 mmol·L−1, respectively. The unit of the NaCl and EC were mmol·L−1 and us·cm−1, respectively.
Table 2. Correlation matrix of the photosynthetic indices of the shrub species Elaeagnus angustifolia and Lycium barbarum at different salt concentrations.
Species TSPADPnGsCiTrPnmaxAQYRDLCPLSP
Elaeagnus angustifolia L.T1----------
SPAD−0.99 **1---------
Pn−0.99 **0.99 **1--------
Gs−0.99 **0.99 **0.99 **1-------
Ci−0.99 **0.99 **0.99 **0.99 **1------
Tr−0.110.70.04−0.006−0.0121-----
Pnmax0.98 **−0.99 **−0.99 **−0.99 **−0.99 **−0.071----
AQY0.98 **−0.95 **−0.96 **−0.96 **−0.95 **−0.15−0.91 **1---
RD0.73 *−0.67 *−0.68 *−0.70 *−0.67 *−0.13−0.91 **−0.68 *1--
LCP−0.480.530.550.570.58−0.790.560.76 *0.581-
LSP0.64 *−0.65 *−0.62 *−0.58−0.59−0.45−0.59−0.74 *−0.590.291
Lycium barbarumT1----------
SPAD−0.95 **1---------
Pn−0.93 **−0.93 **1---- ---
Gs−0.84 *−0.81 *−0.94 **1-------
Ci0.86 *0.81 *0.670.491------
Tr−0.89 *−0.85 *−0.9 *−0.94 **0.611-----
Pnmax−0.9 **−0.9 **−0.95 **−0.95 **0.61−0.96 **1----
AQY−0.88 *−0.9 **−0.95 **−0.93 **0.66−0.9 *−0.9 *1---
RD−0.84 *−0.83 *−0.84 *−0.89 *0.6−0.97 **−0.95 **−0.84 *1--
LCP0.710.87 *0.670.5−0.78 *0.590.660.70.641-
LSP−0.89 *−0.74 *−0.79 *−0.730.69−0.79−0.74−0.71−0.69 *0.371
T, SPAD, Pn, Gs, Ci, Tr, Pnmax, AQY, RD, LCP and LSP are the temperature, soil and plant analyzer development, net photosynthetic rate, stomatal conductance, intercellular carbon dioxide, transpiration rate, maximum net photosynthetic rate, initial quantum efficiency, dark breathing rate, light compensation point and light saturation point, respectively. ** p < 0.01; * p < 0.05.

