Article

Feasibility of Using Modified Silty Clay and Extruded Polystyrene (XPS) Board as the Subgrade Thermal Insulation Layer in a Seasonally Frozen Region, Northeast China

School of Transportation, Jilin University, Changchun 130022, China
*
Author to whom correspondence should be addressed.
Sustainability 2019, 11(3), 804; https://doi.org/10.3390/su11030804
Submission received: 18 December 2018 / Revised: 29 January 2019 / Accepted: 30 January 2019 / Published: 3 February 2019

Abstract

:
To achieve the purposes of storing industry solid wastes and enhancing subgrade stability in seasonally frozen regions, Structure III, which utilized the modified silty clay (SC) and extruded polystyrene (XPS) board as a novel subgrade thermal insulation layer (NSTIL), was presented. The above modified SC consisted of oil shale industry solid waste, fly ash and SC. In terms of environmental impact, the average single pollution index, the Nemerow integrated pollution index and national standards were carried out to estimate whether the modified SC could be used as a subgrade filler. These results show that, although the modified SC will produce pollution to the environmental background, the concentration of each hydrochemical constituent from the modified SC meets the corresponding national standards in China. In terms of the thermal insulation capability, the numerical simulation of coupling moisture and temperature was applied to analyze that of Structures I, II and III. The research results show that the numerical results of the Structure I are approximated to the official website information of Jilin province, indicating that the above numerical simulation is effective for coupling moisture and temperature of frozen soil. Both modified SC and NSTIL have the advantage of good thermal insulation property, but the thermal insulation property of the NSTIL is greater. Furthermore, the NSTIL at the top of the Structure III can protect the SC of the experimental road from the damage of frost heave. The research results are of great significance for reducing environmental pollution caused by oil shale industry solid waste and fly ash, increasing the utilization rate of industrial waste and enhancing the subgrade stability in seasonally frozen regions.

1. Introduction

In China, seasonally-frozen soil and short-term frozen soil affect 54% and 21% of the land area, respectively [1]. Jilin province is located in the seasonally frozen region in northern China (Figure 1). Frost heave and thaw settlement in freeze-thaw cycles of the subgrade are common mechanisms, causing adverse effects on the life-cycle service performance of subgrade and leading to road pavement structure damage in seasonally frozen ground [2,3]. The physical changes during the freeze-thaw cycles, such as heat transfer, water migration, and stress redistribution, can all cause freezing-thawing deformation [4,5]. Engineering studies on seasonally frozen soil focus on methods to minimize frost heave and thaw settlement, e.g., by controlling soil moisture content, controlling fine particle content, using the non-frost-susceptible base materials, setting insulation layer, and lowering the groundwater table [6,7]. When setting up the insulation layer in subgrade, extruded polystyrene (XPS) board is a common material. XPS board has been used in railway structures in Finland since the 1970s [8]. In the 1970s, expanded polystyrene board was also used in the frost insulation of tracks, but its use was discontinued in 1980 because of bad experiences regarding its moisture resistance. Since 1981, XPS boards have only been used in Finland for the frost insulation of tracks [8]. Zhao [9] analyzed the engineering performance changes of XPS boards and expanded polystyrene boards in compression, heat preservation, heat insulation, waterproof rate, and influence on subgrade deformation. The results proposed that, as a new type of subgrade insulation material, the XPS board was technically feasible and economically reasonable.
Oil shale industry solid waste (OSW) is a byproduct applying oil shale to produce shale oil, and shale oil is considered as a substitute for conventional oil [10]. Fly ash (FA), also known as pulverized fuel ash in the United Kingdom, is a coal combustion product which is composed of the particulates (fine particles of burned fuel) that are driven out of coal-fired boilers together with the flue gases [11]. Jinlin province is one of the most important energy production and consumption regions in northeast China. The accumulations of OSW and FA are increasing year on year and have become an urgent problem to be solved [12,13]. In 2015, Jinlin province consumed 94,000 tons of shale oil and 94.95 million tons of coal, and planned to consume 200,000 tons of shale oil and 92.75 million tons of coal in 2020 [14]. Despite the lack of accurate data on OSW and FA, they are projected to be huge, based on the consumption of shale oil and coal. For example, the Wangqing Oil Shale Industrial Park located in Yanbian Korean Autonomous Prefecture, Jilin province (Figure 1), the production line of shale dry distillation can produce 105 tons of OSW per year [15].
OSW and FA have attracted much attention and research on environmental issues [16,17]. For recycling of OSW and FA and reducing the environmental problems caused by them, soil stabilization is an effective measure [18,19]. The stabilized soils often possess better stability and greater strength [20,21], or higher resistance against freeze-thaw effect [22]. Saravanan and Thomas [20] presented the laboratory study of expansive clay soil with a different percentage of FA. Their research results indicated that strength properties of the expansive clay soil increased by 21.1% with the Optimum Content (10 %) of FA. Brooks [21] upgraded expansive soil as a construction material using rice husk ash and FA; results indicated that as the FA content increased from 0 to 25%, failure stress and strain were increased by 106% and 50% respectively. A few attempts have also been made to utilize OSW in soil stabilization. Turner [19] undertook an experimental study on compacted samples of soil treated with water and OSW; research indicated that significant increases in strength, freeze-thaw durability, and resilient modulus were obtained by treating a silty sand with OSW. Mymrin and Ponte [23] proved that some kinds of OSW from thermal power plants had significant binding properties, and clayey soils strengthened with OSW possess high structural strength, water and frost resistance and can be used for building road bases. In previous literature, research on the application of soils stabilized by both OSW and FA is scarce [10]. Zhang et al. [10] modified silty clay (SC) by OSW and FA and conducted a series of experiments to research mechanical properties of the modified SC, and research results showed the feasibility using the modified SC for road construction in seasonally frozen areas; However, they only analyzed that feasibility in terms of mechanical properties of the modified SC, while the environmental effects and thermal insulation properties of the modified SC by OSW and FA in subgrade have not been explored.
Based on what has been mentioned above, the purpose of this study is to (1) based on the experimental road using the modified SC as the subgrade thermal insulation layer, present the NSTIL consisted of the modified SC and XPS board to achieve the purposes of storing industry solid wastes (OSW and FA) and enhancing subgrade stability in seasonally frozen regions. (2) implement the environmental pollution assessment of utilizing the NSTIL as the soil-replacing layer of subgrade. (3) discuss the thermal insulation capability using the NSTIL in seasonally frozen regions, based on the numerical simulation analysis of coupling moisture-temperature calculation for three kinds of subgrade structures named Structure I, Structure II and Structure III. The difference between the Structure II and Structure I is that the Structure II uses the modified SC as the subgrade thermal insulation layer, and the difference between the Structure III and Structure II is that the Structure III contains the NSTIL (Figure 2).

2. Materials and Methods

2.1. Materials

The Structure III, which utilizes the NSTIL, is shown in Figure 2. This design of the Structure III is inspired by Stuctures I and II (Figure 2) of the experimental road belonging to Jilin Province Expressway Company Limited, and the NSTIL consists of the modified SC and XPS board.
The authors conducted a survey of the experimental road which was composed of the test section (Structure II) and the reference section (Structure I) from July 1 to August 10, 2018 (Figure 1, Figure 2). The moisture sensor (Figure 2), 52 mm in length with an accuracy of ±2%, based on the frequency domain reflection principle, together with a temperature sensor (precision: ±0.05 °C, range: −30 °C~30 °C), was embedded into the subgrade (Figure 2). The difference between the Structure II and Structure I is that the modified SC, which is used as the subgrade thermal insulation layer, is overlaid on the top of gravel soil layer in the Structure II, and the difference between the Structure III and Structure II is that the Structure III utilizes the NSTIL as a subgrade thermal insulation layer (Figure 2).
The modified SC consists of OSW, FA and SC. The SC is a typical subgrade material in northeast China. The SC strength is acceptable to engineers but is significantly reduced with increasing moisture content. Its CBR (California bearing ratio) value soaked after 96 h is 1%, which is far lower than the allowable value of subgrade filling in Chinese specifications [24]. The physical properties of SC obtained by parallel tests are listed in Table 1.
The OSW was obtained from oil shale semi-coke provided by Fuyu-Changchunling Oil Industrial Park (Figure 1). The oil shale semi-coke is black solids characterized by a considerable carbon content, a high number of mineral compounds, and a small amount of sulfide [25]. FA was obtained from Changchun power plant of Jilin Province, and its classification was Class F Grade 1 [26]. The chemical compositions of OSW and FA are shown in Table 2.
In the experimental road, to make the modified SC, the materials were mixed at the dry mass ratio of OSW/FA/SC of 2:1:2 in the optimum moisture of 15%. This dry mass ratio and optimum moisture were determined by a series of conventional physical and mechanical property tests [10,27]. The modified SC at this ratio possesses the highest CBR value, great shear strength, appropriate physical properties, and greater stability after F-T cycles than unmodified SC. Its CBR value after soaking for 96 h is about 40%, which meets the standard of subgrade for highest-grade highway [24]. Some physical properties of the modified SC, obtained from references [10,27], are listed in Table 1. References [10,27] need to be read if researchers are interested in the details about the shear strength and stability of the modified SC after F-T cycles.
The XPS board was produced by Harbin Xin Hai Trading Co., Ltd. Its thickness is 10cm in the NSTIL, which was decided by the relevant research results [28]. The volumetric water absorption is 0.3% (immersed in 100 h); the thermal conductivity is 0.03 W·m−1K−1, and the unconfined compressive strength is 370 kPa, which is suitable for the standard of subgrade for highest-grade highway [24]. The testing methods of XPS board physical properties will be shown in Section 2.2.

2.2. Samples and Test Methods

Three modified SC samples, two gravel soil samples, and one SC sample were collected at two sampling cross-sections from the Structure I and Structure II. Sampling cross-section 1 is in the Structure I, and Sampling cross-section 2 is in the Structure II, and the locations of two cross-sections are shown in Figure 2. Information about samples’ density ρ , volumetric water content θ and PH were measured in situ when they were collected. The three modified SC samples were collected at the depths of 5 cm, 15 cm and 25 cm from cross-section 1, respectively. The two gravel soil samples were collected at the depths of 50 cm from cross-sections 1 and 2, respectively. The SC sample was collected at the depths of 80 cm from cross-section 1.
The SC sample was considered as the background sample. Twenty-nine hydrochemical constituents (Na+, K+, Ca2+, Mg2+, NH4+, TFe, Cl, SO42−, HCO3, CO32−, NO3, F−1, PO43−, Pb, Zn, Sn, Sb, Bi, Cd, Ni, Co, Ba, Ag, Al, Si4+, Cu, Cr, As, Hg) of samples’ lixivium were analyzed at Testing Center of Jilin University. The lixivium was produced according to national standards [29]. Concentrations of major cations (Na+, K+, Ca2+, Mg2+, TFe, Pb, Zn, Sn, Sb, Bi, Cd, Ni, Co, Ba, Ag, Al, Si4+, Cu, Cr, As, Hg) were measured by inductively coupled plasma mass spectrometry (ICP-MS, Agilent Technologies, CA). Concentrations of major anions (Cl, SO42−, NO3, F−1, PO43−) and NH4+ were measured by ion chromatography (IC). Concentrations of cations and anions were validated using the ionic balance method, and all samples had an ionic balance precision better than 95%.
The XPS boards’ and above samples’ thermal conductivity, specific heat capacity were analyzed at Key Laboratory of Groundwater Resources and Environment, Ministry of Education, Jilin University. QTM transient thermal conductivity equipment and BRR specific heat capacity equipment were employed in the test. QTM employs a transient strip heat source, which are certified by China Metrology Accreditation, and BRR adopts high precision thermocouples and meters of testing temperature, and the above two apparatuses has been widely used in the study of geotechnical thermal physical properties [30,31].

2.3. Research Methods

2.3.1. Environmental Pollution Assessment Methods of the NSTIL

To assess the environmental impact which engineers utilized modified SC as the component of NSTIL, the average single pollution index ( P i ) for each hydrochemical constituent and Nemerow integrated pollution index ( N i ) of each hydrochemical constituent were attributed to the sampling site. The P i were defined as follows:
P i = C i / S i
where Ci denotes the measured average concentration of each hydrochemical constituent from three samples of modified SC, Si is the background value obtained from the background sample, the P i of each hydrochemical constituent was classified as: non-pollution ( P i < 1); low level of pollution (1 ≤ P i < 2); moderate level of pollution (2 ≤ P i < 3); strong level of pollution (3 ≤ P i < 5) and very strong level of pollution ( P i > 5) [32].
The N i of each hydrochemical constituent for three modified SC samples was defined as follows:
N i = P i a v e 2 + P i max 2 2
where P i a v e 2 is the average P i value of each hydrochemical constituent, and P i max 2 is the maximum P i value of each hydrochemical constituent. The N i was classified as: non-pollution ( N i ≤ 0.7); warning line of pollution (0.7 < N i ≤ 1); low level of pollution (1 < N i ≤ 2); moderate level of pollution (2 < N i ≤ 3) and high level of pollution ( N i > 3) [33].

2.3.2. Numerical Simulation of Coupling Moisture and Temperature in Subgrade under Freeze-Thaw Cycles

Heat Transport Equation

In this study, we only focus on the one-dimensional water flow and heat transport in order to highlight the difference of thermal insulation capability among Structures I, II and III.
The ice-water phase change occurring in the unit body is regarded as the heat source, and then the heat transport of transient flow in a variably saturated porous medium is described as follows [34,35]:
C ( θ ) T t L · ρ i θ i t = λ ( θ ) 2 T
where the first term on the left-hand side represents changes in the energy, and the second represents changes in the latent heat of the frozen phase. The term on the right-hand side represents the soil heat flow of the modified SC by heat conduction. The volumetric heat capacity of the soil, C ( θ ) is defined as the sum of the volumetric heat capacities of the solid ( C s ), liquid ( C l ), and ice ( C i ) phase multiplied by their respective volumetric fractions θ :
C ( θ ) = θ s ρ s C s + θ l ρ l C l + θ i ρ i C i θ s + θ l + θ i
where θ s , ρ s , C s are the volumetric content, density and specific heat of solid grains, respectively; θ l , ρ l , C l are the volumetric content, density and specific heat of liquid, respectively; θ i , ρ i , C i are the volumetric content, density and specific heat of ice, respectively.
λ ( θ ) is the effective thermal conductivity of porous medium and is usually calculated by the logarithmic law [36]:
λ ( θ ) = ( λ s ) θ s ( λ l ) θ l ( λ i ) θ i
where λ s , λ l , λ i are the thermal conductivities of the solid grains, water and ice, respectively. Furthermore, L is the latent heat of freezing and T is the transient temperature of porous medium.

Water Flow Equation

Based on Richards equation [37], and considering the blocking effect of ice [38], the variably saturated water flow for freeze-thaw action is described as follows:
θ l t + ρ i ρ l · θ i t = [ D ( θ l ) θ l + k z ( θ l ) ]
where k z ( θ l ) is the hydraulic conductivity of unsaturated porous medium along the direction of gravity. D ( θ l ) is defined as the ratio of hydraulic conductivity k z ( θ l ) to specific moisture capacity c ( θ l ) and is called hydraulic diffusivity for unsaturated porous medium.
D ( θ l ) = k z ( θ l ) c ( θ l ) · I
where I is the impedance factor that reduces the hydraulic conductivity for the liquid phase of partially frozen soil and can be calculated as follows [38]:
I = 10 10 θ i

Dynamic Equilibrium Equation of Phase Transition

The above Equations (3) and (6) includes three unknown parameters ( T , θ l , θ i ), so another equation has to be applied to build the relationship between T , θ l and θ i so that they can be solved. Xu et al. [39,40] obtained the empirical relationship of unfrozen water content by experimental data, which was described as Equation (9):
w 0 w u = ( T T f ) B , T < T f
where T f is the freezing temperature; w 0 is the initial water content and w u is the unfrozen water content, which are described by the gravimetric content; furthermore, B is an empirical parameter. A similar function, but expressed in terms of the volumetric content rather than the gravimetric content, was considered later by Bai et al. [41], which was described as Equation (10):
θ i θ u = { ρ w ρ i ( T T f ) B ( T < T f ) 0 ( T T f ) }
Taken together, the coupled moisture-temperature differential equations of frozen soil are composed of Equations (3), (6) and (10), and they have been validated by Bai et al. [41].

Model Setup

A commercial FEM (Finite-Element Method) program, called Comsol Multiphysics (version 5.0) was used as a numerical tool, and a PC with 64-bit version of Windows 10, with Intel i5 3.1 GHz processor, 8GB of RAM, was used to run the simulations.
The three kinds of structures of excavation subgrade (Figure 2) were simulated to obtain the temperature-moisture distribution. In order to highlight the difference in the thermal insulation capability among Structures I, II and III, they were set into one-dimensional models, and depths were 10.7 m, including the replacement thickness for 0.7 m and the thickness of the SC for 10 m (Figure 2). The replacement thickness of filling materials, which was corresponding to those above three kinds of structures of excavation subgrade, was shown in Figure 2. The physical properties of the filling materials and SC, and the main parameters for FEM calculation were listed in Table 3.
In this study, initial values and boundary conditions were used. At the beginning of the simulation period, the initial conditions were set in the models according to the temperature and moisture measured from the experimental road by moisture sensors.
The bottom thermal boundary of the model was set as a temperature equal to 8.0 °C, which was also called as Dirichlet boundary. The top thermal boundary condition of the model was obtained by the temperature measurement data in Fuyu city (Figure 1), which was a sine function that changed with time [42,43]:
T = 6.5 + 0.048 365 · t + 21.5 sin ( 2 π 365 · t + 5 12 π )
where t is the time interval from July 1, 2018.
The top boundaries of models were set as the impermeable boundaries on which water flow exchange was zero, and the bottom water flow boundaries of models were fixed moisture boundaries on which the volumetric content of liquid was always equaled to 23.6%.

3. Results and Discussion

3.1. Environmental Pollution Assessment of the NSTIL

Based on the measuring data from the three samples of the modified SC obtained from the experimental road, the average single pollution index ( P i ) and Nemerow integrated pollution index ( N i ) were applied to conduct the quantitative analysis of environmental pollution caused by modified SC.
The P i values vary greatly among hydrochemical constituents of the modified SC samples. The P i values for NH4+, Pb, Zn, Cd, Ni, Co, Al, Cu, and Cr in the modified SC samples of the experimental road range from 0.0867 to 0.9167, indicating that the SC under the experimental road is uncontaminated. The P i values for TFe, PH, Cl, Ag and Hg in the modified SC samples range from 1.0000 to 1.8722, indicating that the SC under the experimental road is slightly contaminated. The P i values for Sb and As in modified SC samples range from 2.0000 to 2.6507, indicating that the SC under the experimental road is moderately contaminated. The P i value for Na+ is 3.7745, indicating that the SC under the experimental road is strongly contaminated. The P i values for TDS, Water Hardness (CaCO3), NO3 and Ba range from 6.8693 to 8.5790, indicating that the SC under the experimental road is very strongly contaminated. The analysis results show that the average single pollution index ( P i ) ascends from 0.0867 (Cu) to 8.5790 (Water Hardness) in the order of Table 4. The result of the pollution assessment assessed by the Nemerow integrated pollution index ( N i ) is similar to that of the average single pollution index. The N i values for the modified SC samples of the experimental road range from 0.0995 to 8.7430, indicating that the SC at the bottom of the experimental road is affected by non-pollution ( N i ≤ 0.7) to a high level of pollution ( N i > 3).
Compared with the Standard for Groundwater Quality in China published by China’s State Administration for Quality Supervision and Inspection and Quarantine [44], the maximum concentration of each hydrochemical constituent from the three samples of the modified SC is all lower than the national thirdly standard (Table 4). In the above Standard for Groundwater Quality, the groundwater that meets the national thirdly standard can be used as the drinking water source [44]. Compared with the Environmental Quality Standard for Soils published by the Ministry of Ecology and Environment of China [45], the maximum concentrations of Cu, Pb, Zn, Cd, Ni, Cr, Hg and As are lower than the national primary standard of agricultural soil with an order of Cu < Pb < Zn < Cd < Ni < Cr < Hg < As (Figure 3).
Based on the above analysis, we know that the modified SC will produce different degrees of pollution according to values of P i and N i , but the concentration of each hydrochemical constituent from the modified SC meets the national standards. Furthermore, when the XPS board is placed at the bottom of the modified SC, without considering the seams of adjacent boards, it will protect the silty clay from the contamination of the modified SC. The reason for this is that the XPS board can block the polluted water from the modified SC layer into silty clay layer because its permeability is almost 0.

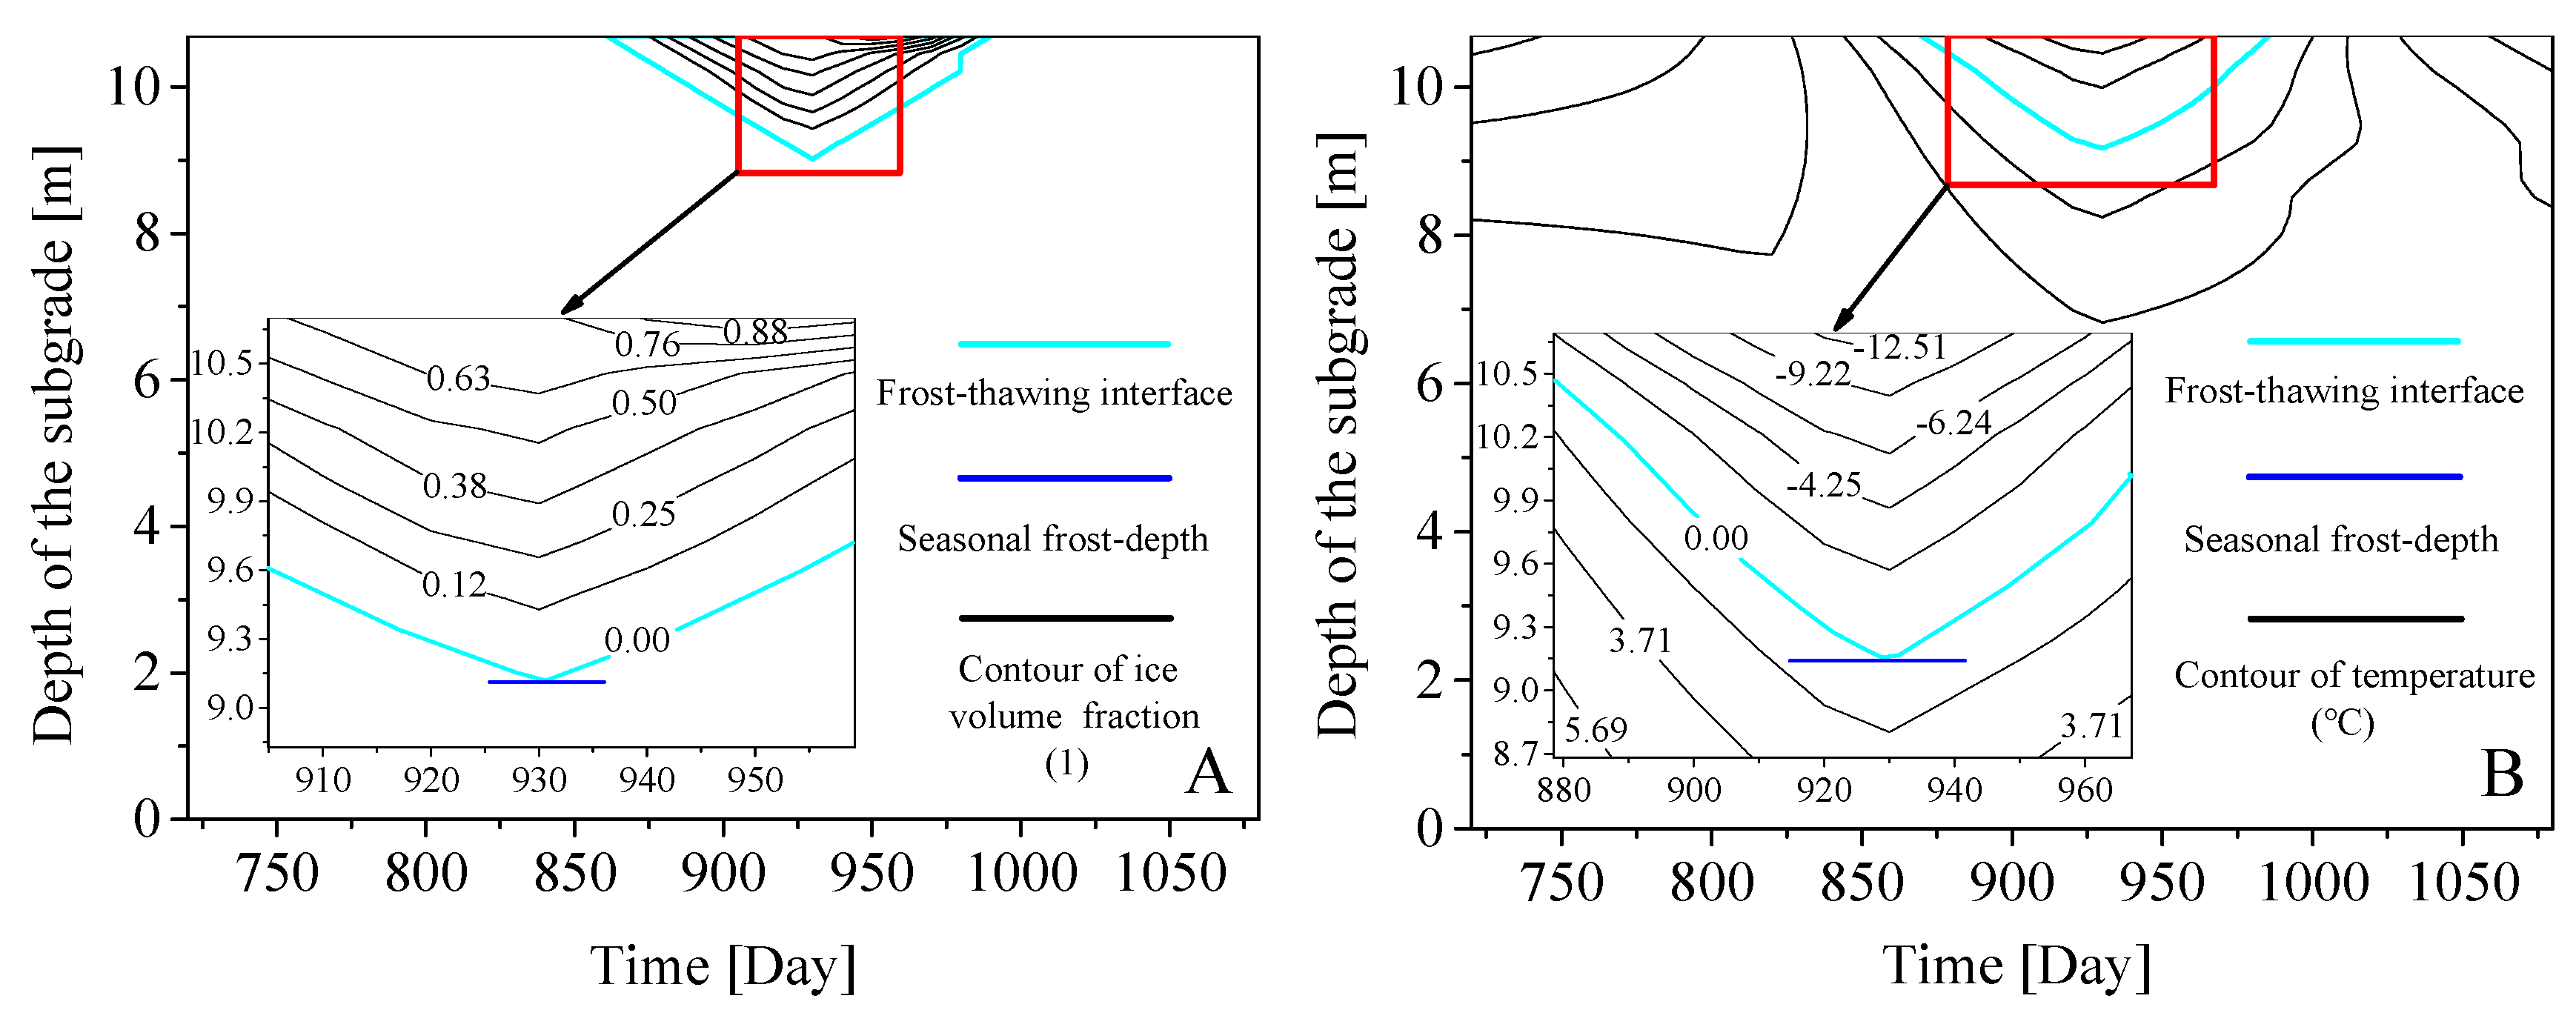
3.2. Numerical Results on Freezing-Thawing Zones of the Structure I

Figure 4, Figure 5 and Figure 6 present the numerical results of Structures I, II and III obtained from the model operated for 730 to 1095 days, which are corresponding dates from July 1, 2020 to July 1, 2021.
The subgrade starts to freeze on the 850th day (the early November, 2020), and the frost-depth continues to increase to 1.5 m until the 930th day (the late January, 2021). From the 930th to 980th day (late March, 2021), the frost-depth of subgrade continues to decrease from 1.5 to 0 m. The reason for the above phenomenon can be shown by Figure 4. The frost-thawing interface and frost-depth in Figure 4B is the same as that of Figure 4A; this is because the ice content of subgrade is controlled by the temperature of subgrade. Within the scope of frost-thawing interface, the temperature drops from 0.00 to −12.51 °C (Figure 4B) and the ice volume fraction goes from 0.00 to 0.88 (Figure 4A), indicating that when the subgrade temperature is below zero, the ice volume fraction of subgrade increases with the decrease of subgrade temperature. The numerical results of the Structure I are approximated to the official website information of Jilin province, which reported that the seasonal frost-depth of Jinlin province varied from 1.3 to 2.0 m, and that the soil surface was frozen in mid-November and then thawed between late March and early April [46], indicating that the coupled moisture-temperature differential equations in this paper are effective for coupling moisture and temperature of frozen soil.

3.3. Numerical Results on Freezing-Thawing Zones of the Structure II

Compared with the numerical results of the Structure I, the Structure II, which replaces sand gravel of 30 cm depth with the modified SC (Figure 2), shows the elementary thermal insulation capacity (Figure 5C,D).
The frost-depth of the Structure II reaches the maximum value of 1.2 m on the 950th day (Figure 5C,D). Compared with the seasonal frost-depth of the Structure I, that of the Structure II is reduced by 0.3 m and the time when its frost-depth reaches the seasonal frost-depth is 30 days later. The main reason for these differences is that the thermal conductivity of the modified SC in the Structure II is smaller and its specific heat capacity is larger than those of sand gravel in the Structure I (Table 3). In comparison to sand gravel, the smaller thermal conductivity of the modified SC means that it takes longer to transfer the same amount of heat, and the larger specific heat capacity means that more heat is needed to change the same temperature.

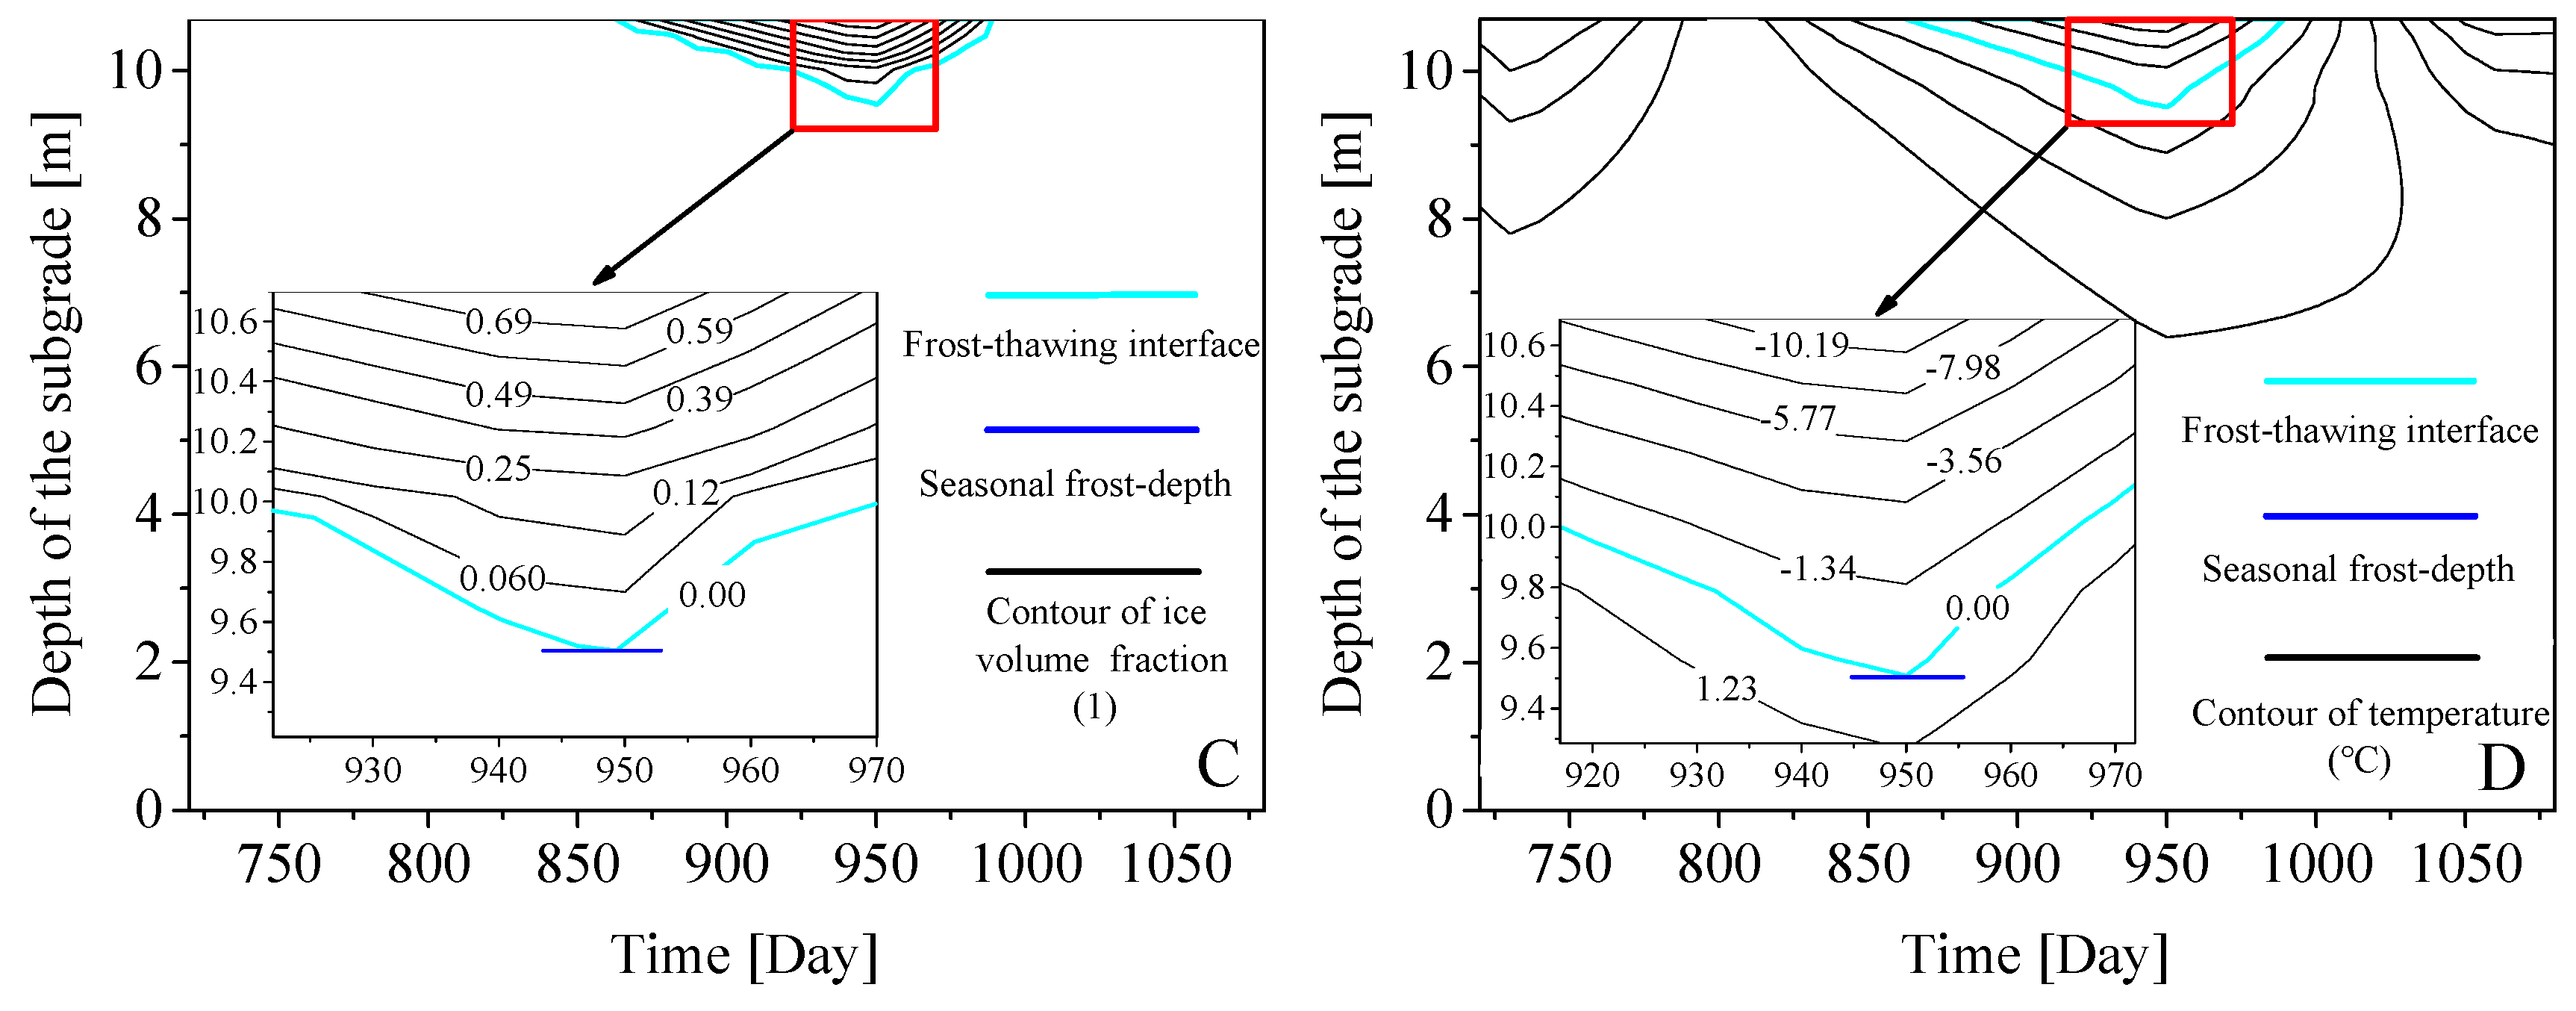
3.4. Numerical Results on Freezing-Thawing Zones of the Structure III

Compared with the numerical results of Structures I and II, the Structure III, which combines XPS board with the modified SC as the NSTIL, shows the excellent thermal insulation capacity (Figure 6E,F).
For the Structure III, the time when subgrade starts to freeze is consistent with that of Structures I and II, but the seasonal frost-depth is smaller and the time when the frost-depth of subgrade reaches the seasonal frost-depth is longer than those of Structures I and II. The frost-depth of the Structure III reaches the maximum value of 0.6 m on the 970th day. In comparison to Structures II and I, the seasonal frost-depth of the Structure III is reduced by 0.6 m and 0.9 m respectively, and the time when its frost-depth reaches the seasonal frost-depth is delayed for 30 days and 50 days correspondingly. The main reason for these differences is that the thermal conductivity of the XPS board in the Structure III is smaller, and its specific heat capacity is larger than those of sand gravel and the modified SC (Table 3). The secondary reason for these is that the permeability of the XPS board approaches 0 (Table 3) so that it therefore impedes thermal convection.

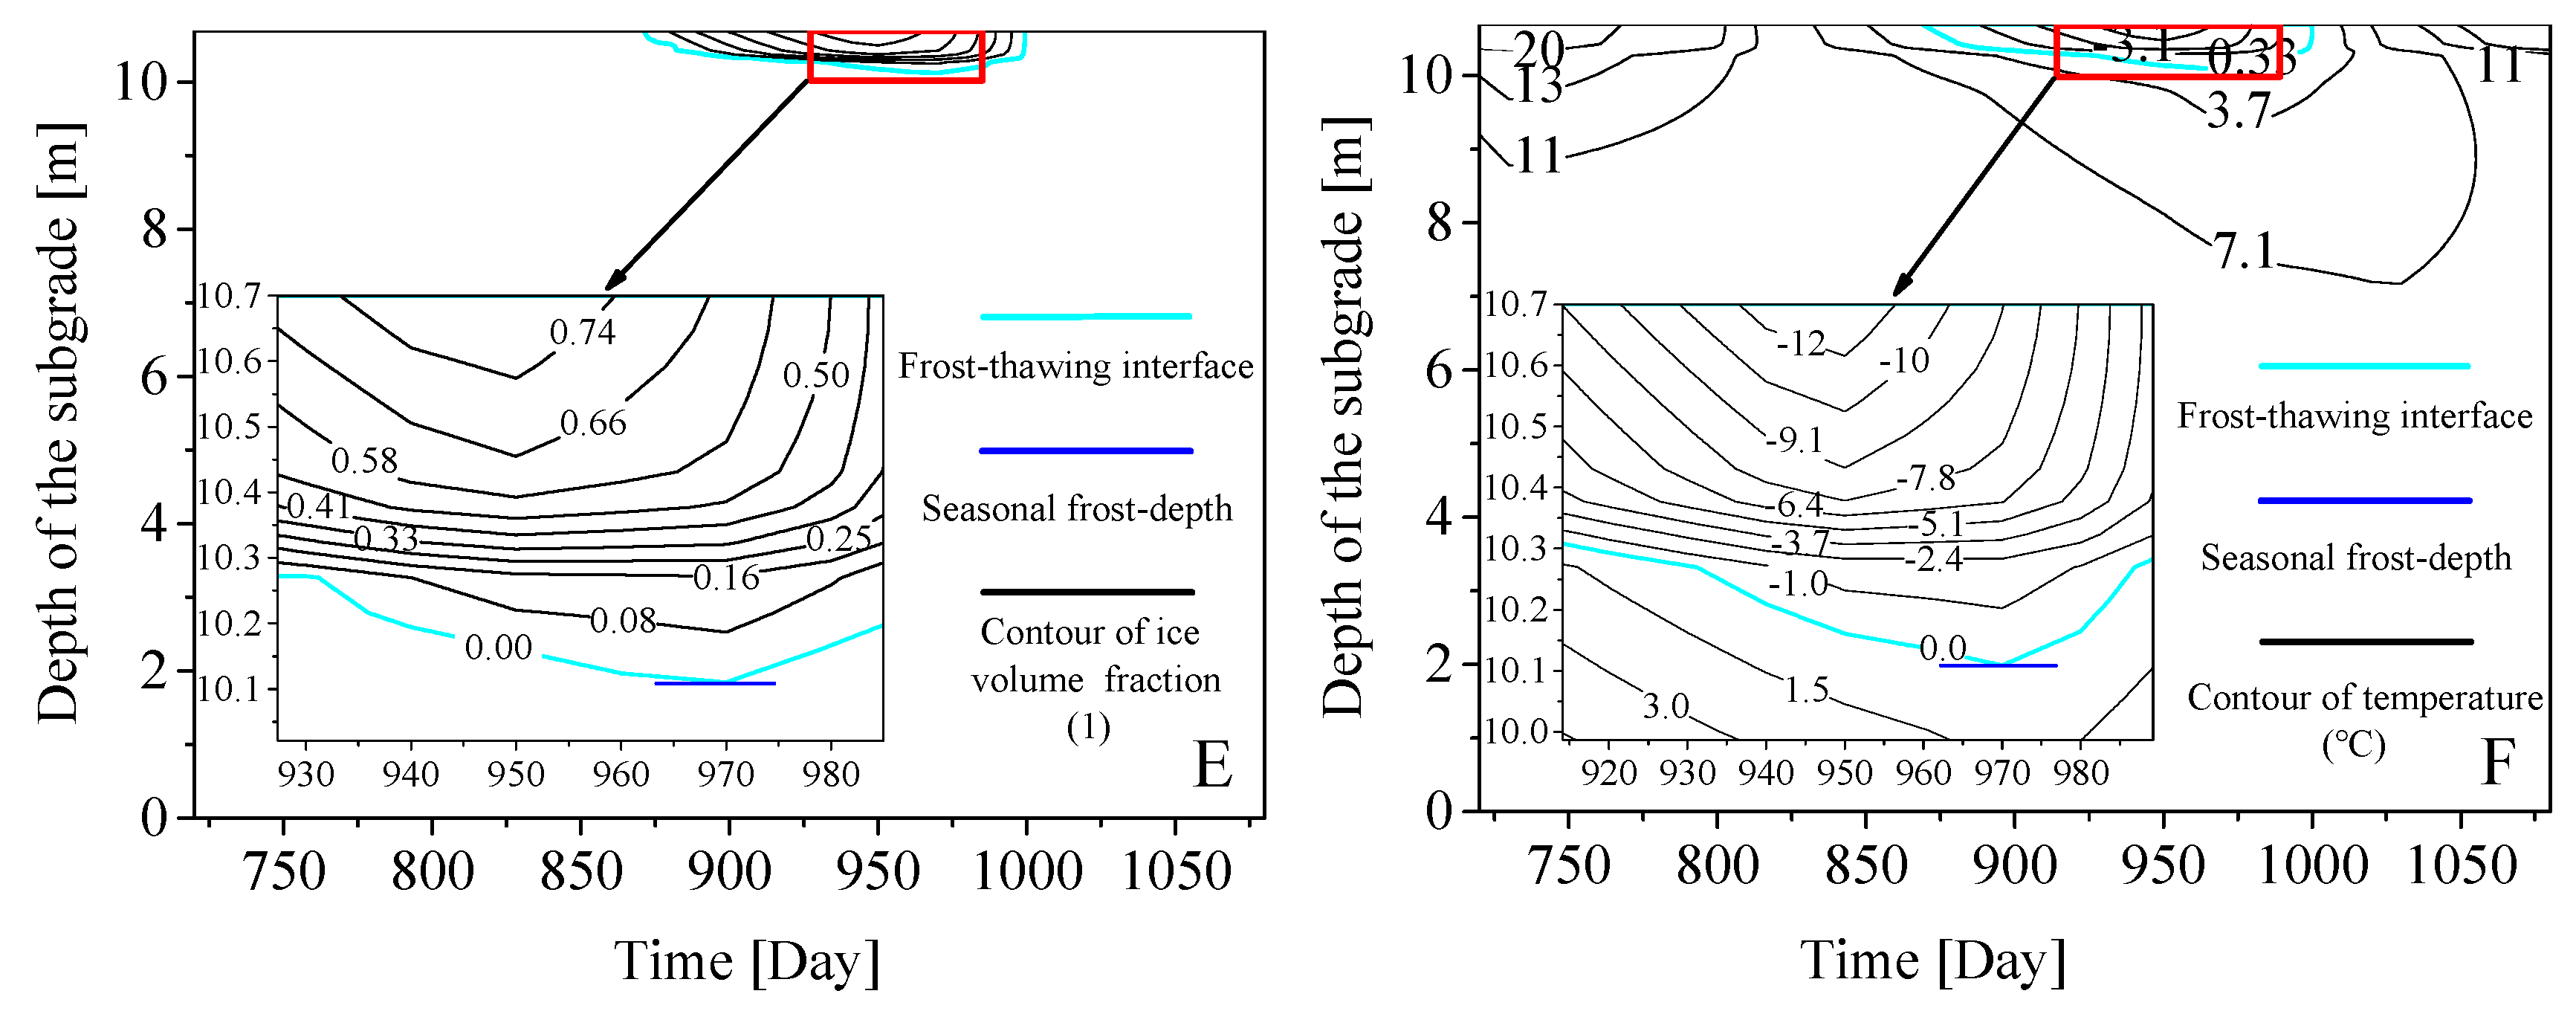
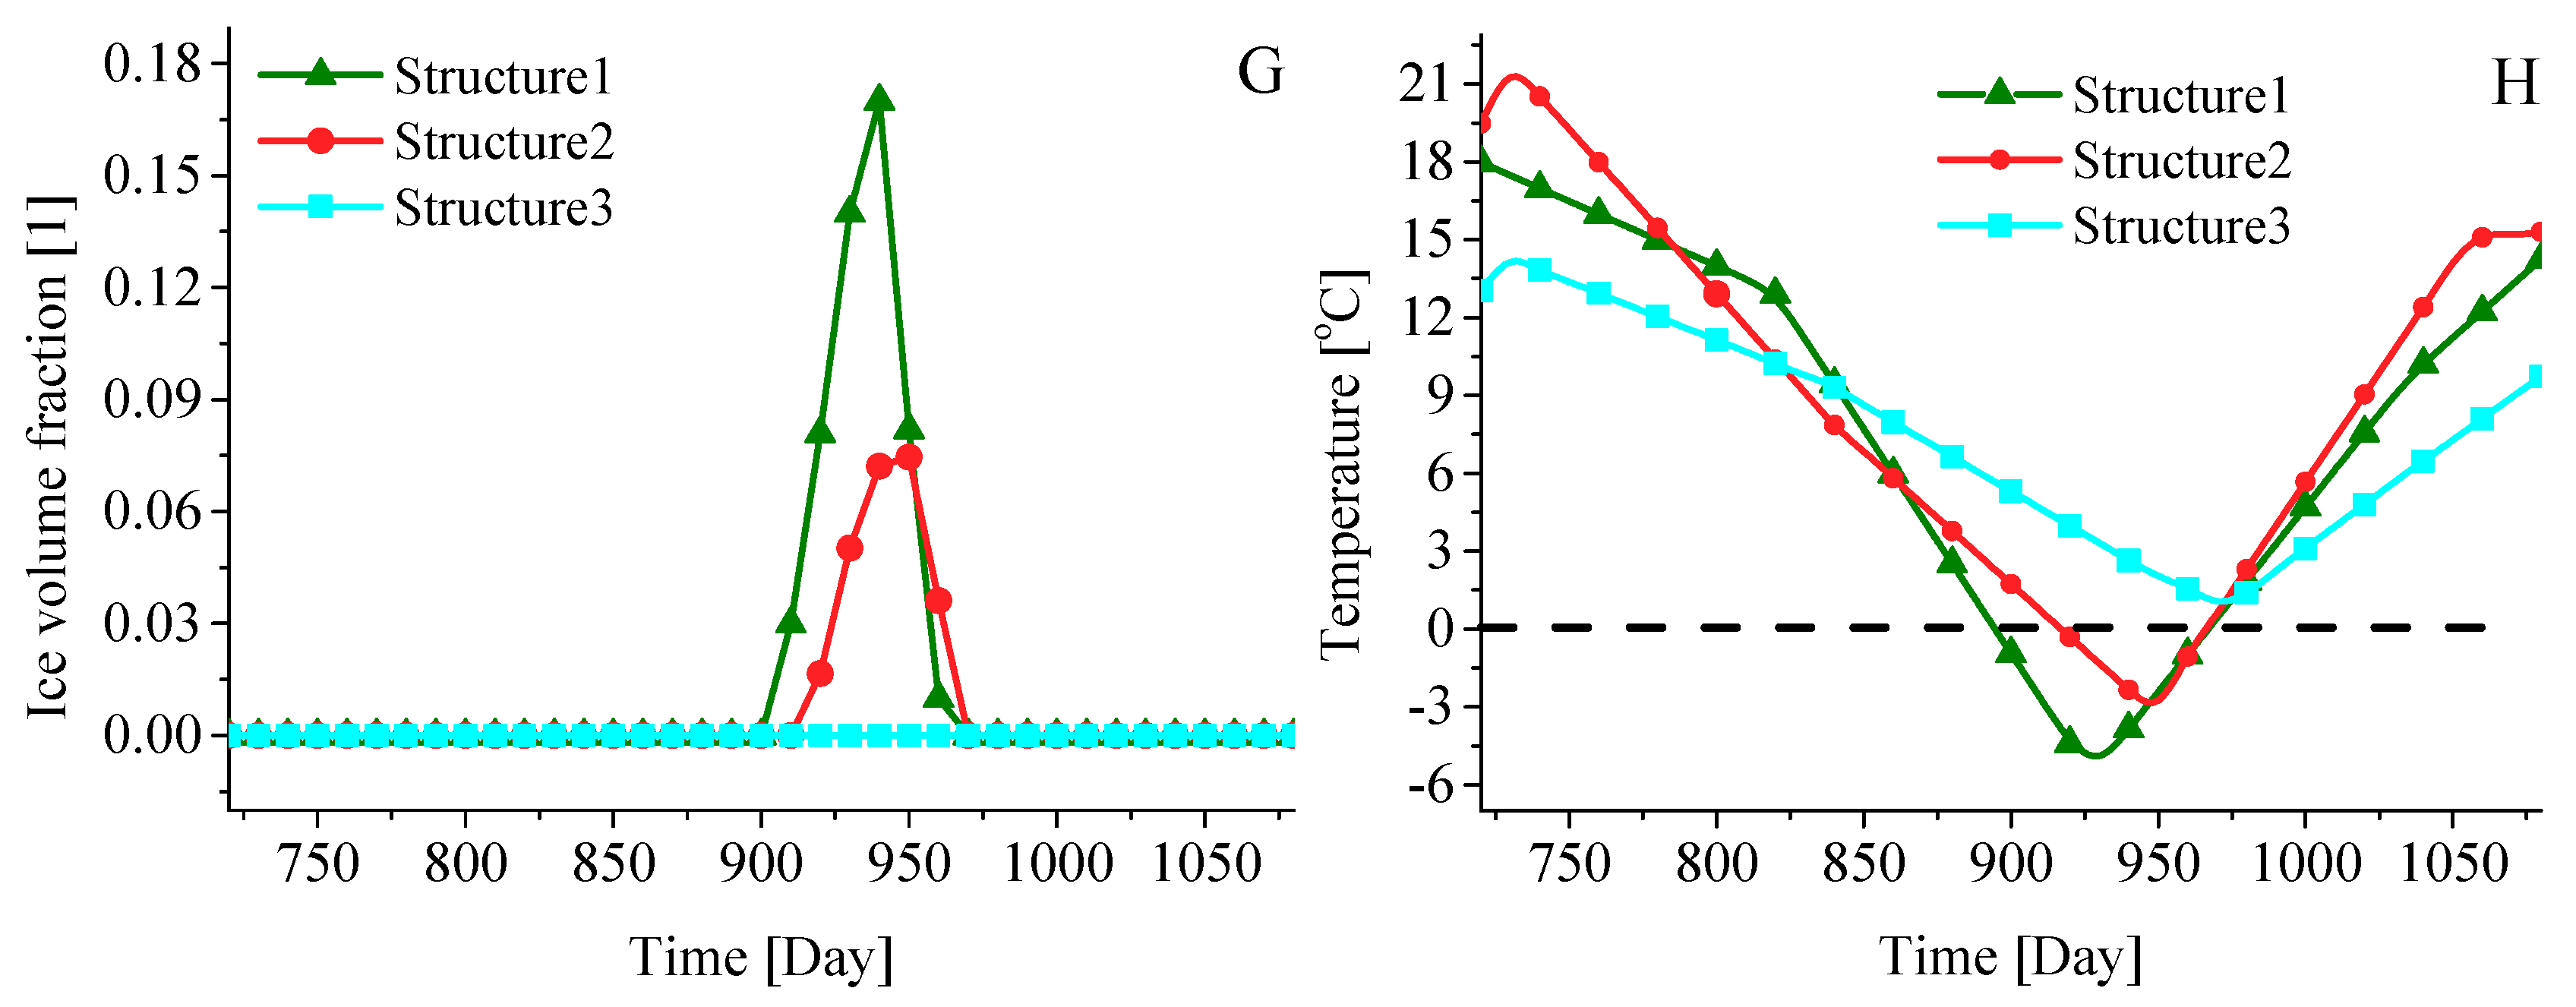
3.5. The Changes of Ice Volume Fraction and Temperature at the Interface between Sand Gravel and Silty Clay for Structures I, II and III

The bottom layer of the experimental road consists of the SC, whose physical properties are listed in Table 1. According to previous studies [5,6], the above SC is defined as the SC of low liquid limit and is sensitive to frost heave.
For Structures I, II and III, the depth of the interface between sand gravel and SC is 70 cm. Figure 7 presents the changes of ice volume fraction and temperature at this interface from 730 to 1095 days. At this interface, the SC of the Structure I starts to freeze on the 890th day (Figure 7G) and its ice volume fraction reaches maximum of 0.18 when its temperature attains to the minimum of −5.2 °C on the 930th day. For the Structure II, on the 950th day, the SC of this interface reaches the maximum of ice volume fraction equal to 0.07; meanwhile, its temperature attains a minimum of −2.8 °C. Compared with Structures I and II, the SC of the Structure III does not form ice and its lowest temperature is 1.0 °C.
Based on the above-mentioned analysis, we can consider that the Structure III can protect the SC from the damage of frost heave, and the effect of frost heave on the SC of the Structure I is greater than that of the Structure II.

4. Conclusions

Compared with previous research in the modified SC that consists of SC, OSW and FA, we identified the thermal insulation capability of the modified SC for the first time, and the numerical simulation of coupling moisture-temperature was carried out to quantify the thermal insulation capability of the novel thermal insulation layer (NSTIL) consisted of the modified SC and XPS board, and the average single pollution index, the Nemerow integrated pollution index and national standards were carried out to estimate environmental pollution of the NSTIL. The research results lead to the following conculsions:
(1)
According to the average single pollution index ( P i ) and Nemerow integrated pollution index ( N i ), the modified SC, which is used as the thermal insulation layer of the experimental subgrade, will produce pollution to the environmental background of the experimental road.
(2)
Compared with the national standards, the concentration of each hydrochemical constituent of the modified SC is all lower than the national tertiary standard for the Standard for Groundwater Quality in China, and its concentrations of Cu, Pb, Zn, Cd, Ni, Cr, Hg and As are lower than the national primary standard of agricultural soil for the Environmental Quality Standard for Soils in China, indicating that the modified SC can be used as the soil-replacing layer of subgrade. Furthermore, in the NSTIL, the Extruded Polystyrene (XPS) board is placed at the bottom of the modified SC. This structure enables XPS board to prevent the SC layer from the pollution of the modified SC layer.
(3)
The numerical results of the Structure I are approximated to the official website information of Jilin province, indicating that the coupled moisture-temperature differential equations are effective for coupling moisture and temperature of frozen soil. The seasonal frost depths of Structures II and III are 0.3 m and 0.9 m lower than that of the Structure I, respectively, and the time when their frost-depth reach the seasonal frost-depth is delayed for 30 days and 50 days, correspondingly. Moreover, the Structure III can protect the silty clay of the experimental road from the damage of frost heave, and the effect of frost heave on the silty clay of the Structure I is greater than on that of the Structure II.
(4)
Both of the modified SC and NSTIL have the advantage of good thermal insulation property, but the thermal insulation property of the NSTIL is greater. The research results are of great significance for reducing environmental pollution caused by OSW and FA, increasing the utilization rate of industrial waste and enhancing the subgrade stability in the seasonally frozen regions, and show the good feasibility and application prospect using modified SC and XPS board as the subgrade thermal insulation layer in seasonally frozen regions.

Author Contributions

Q.L. and H.W. conceived and designed the novel subgrade insulation layer; F.W. and L.H. collected and tested samples of experimental road; Y.Z. and S.H. contributed to constructing the model of coupling moisture and temperature; F.W., H.W. and Q.L. wrote and revised the paper.

Funding

This work was supported by National Natural Science Foundation of China (51578263); Transportation Science & Technology Program of Jilin Province (2015-1-11).

Conflicts of Interest

The authors declare no conflict of interest.

References

  1. Ran, Y.; Li, X.; Cheng, G.; Zhang, T.; Wu, Q.; Jin, H.; Jin, R. Distribution of Permafrost in China: An Overview of Existing Permafrost Maps. Permafr. Periglac. Process. 2012, 23, 322–333. [Google Scholar] [CrossRef]
  2. Vaitkus, A.; Gražulytė, J.; Skrodenis, E.; Kravcovas, I. Design of frost resistant pavement structure based on road weather stations (RWSs) data. Sustainability 2016, 8, 1328. [Google Scholar] [CrossRef]
  3. Liu, S.; Yang, J.; Chen, X.; Yang, G.; Cai, D. Application of Mastic Asphalt Waterproofing Layer in High-Speed Railway Track in Cold Regions. Appl. Sci. 2018, 8, 667. [Google Scholar] [CrossRef]
  4. Özgan, E.; Serin, S.; Ertürk, S.; Vural, I. Effects of Freezing and Thawing Cycles on the Engineering Properties of Soils. Soil Mech. Found. Eng. 2015, 52, 95–99. [Google Scholar] [CrossRef]
  5. Lu, J.; Zhang, M.; Zhang, X.; Pei, W.; Bi, J. Experimental study on the freezing–thawing deformation of a silty clay. Cold Reg. Sci. Technol. 2018, 151, 19–27. [Google Scholar] [CrossRef]
  6. Kraszewski, C.; Rafalski, L. Laboratory Examination of Frost-heaving Properties of Road Unbound Mixtures Based on Fines Content and Plasticity Index. Procedia Eng. 2016, 143, 836–843. [Google Scholar] [CrossRef] [Green Version]
  7. Haghi, N.; Nassiri, S.; Shafiee, M.; Bayat, A. Using Field Data to Evaluate Bottom Ash as Pavement Insulation Layer. Transp. Res. Rec. J. Transp. Res. Board 2014, 2433, 39–47. [Google Scholar] [CrossRef]
  8. Nurmikolu, A.; Kolisoja, P. Extruded polystyrene (XPS) foam frost insulation boards in railway structures. In Proceedings of the International Conference on Soil Mechanics and Geotechnical Engineering, Osaka, Japan, 12–15 September 2005; Aa Balkema Publishers: Rotterdam, The Netherlands, 2005; p. 1761. [Google Scholar]
  9. Liping, Z. Study of Application of XPS Board in Frozen Subgrade Works. Master’s Thesis, University of Changan, Xi’an, China, 2009. [Google Scholar]
  10. Wei, H.; Zhang, Y.; Wang, F.; Che, G.; Li, Q. Experimental Research on Resilient Modulus of Silty Clay Modified by Oil Shale Ash and Fly Ash after Freeze-Thaw Cycles. Appl. Sci. 2018, 8, 1298. [Google Scholar] [CrossRef]
  11. US EPA. Using Coal Ash in Highway Construction: A Guide to Benefits and Impacts; US EPA: Washington, DC, USA, 2005.
  12. Gobinath, V.; Student, P.G.; Stalin, V.K. Performance of Geogrid Reinforced Rubber Waste as Subgrade Material. In Proceedings of the Geo-Frontiers Congress, Dallas, TX, USA, 13–16 March 2011; pp. 4498–4504. [Google Scholar]
  13. Kua, T.A.; Arulrajah, A.; Horpibulsuk, S.; Du, Y.J.; Suksiripattanapong, C. Engineering and environmental evaluation of spent coffee grounds stabilized with industrial by-products as a road subgrade material. Clean Technol. Environ. Policy 2016, 19, 1–13. [Google Scholar] [CrossRef]
  14. Energy Administration of Jilin Province. The 13th Five-Year Plan for Energy Development of Jilin Province; Energy Administration of Jilin Province: Changchun, China, 2017.
  15. Zhang, F.-Q.; Li, W.-Q.; Guan, X.; Xu, X.-D. Application Research of Oil Shale Ash in Construction of Road. J. Jilin Inst. Archit. Civ. Eng. 2012, 2, 009. [Google Scholar]
  16. Vallner, L.; Gavrilova, O.; Vilu, R. Environmental risks and problems of the optimal management of an oil shale semi-coke and ash landfill in Kohtla-Järve, Estonia. Sci. Total Environ. 2015, 524–525, 400–415. [Google Scholar] [CrossRef] [PubMed]
  17. Fulekar, M.H.; Dave, J.M. Disposal of fly ash—An environmental problem. Int. J. Environ. Stud. 1986, 26, 191–215. [Google Scholar] [CrossRef]
  18. Dahale, P.P.; Nagarnaik, P.B.; Gajbhiye, A.R. Utilization of Solid Waste for Soil Stabilization: A Review. Electron. J. Geotech. Eng. 2012, 17, 2443–2461. [Google Scholar]
  19. Turner, J.P. Soil Stabilization Using Oil-Shale Solid Waste. J. Geotech. Eng. 1994, 120, 646–660. [Google Scholar] [CrossRef]
  20. Saravanan, R.; Thomas, R.S.; Joseph, M. A study on soil stabilization of clay soil using fly ash. Int. J. Res. Civ. Eng. Archit. Des. 2013, 1, 33–37. [Google Scholar]
  21. Brooks, R.M. Soil stabilization with fly ash and rice husk ash. Int. J. Res. Rev. Appl. Sci. 2009, 1, 209–217. [Google Scholar]
  22. Yilmaz, F.; Kamiloğlu, H.A.; Şadoğlu, E. Soil Stabilization with Using Waste Materials against Freezing Thawing Effect. Acta Phys. Pol. 2015, 128, B–392–B–395. [Google Scholar] [CrossRef]
  23. Mymrin, V.A.; Ponte, H.A. Oil-shale fly ash utilization as independent binder of natural clayey soils for road and airfield base construction. Part. Sci. Technol. 2005, 23, 99–107. [Google Scholar] [CrossRef]
  24. MOT China. Specifications for Design of Highway Subgrades (JTG D30-2015); China Communications Press: Beijing, China, 2015; p. 7.
  25. Taciuk, W. Does oil shale have a significant future? Oil Shale 2013, 30, 1–5. [Google Scholar] [CrossRef]
  26. Ministry of Housing Urban-Rural Development of Republic of China. Technical Code for Application of Fly Ash Concrete; China Planning Press: Beijing, China, 2014; Volume GB/T 50146-2014.
  27. Cui, J.H. Research on Stability of Subgrade Soil Modified by Oil Shale Waste Residue and Fly Ash; Jilin University: Chang Chun, China, 2018. [Google Scholar]
  28. Zhang, Y.P.; Wei, H.B.; Jia, J.K.; Chen, Z. Numerical evaluation on application of roadbed with composite cold resistance layer inseasonal frozen area. J. Jilin Univ. (Eng. Ed.) 2018, 48, 121–128. [Google Scholar]
  29. Ministry of Ecology and Environment of the People’s Republic of China. Solid Waste-Extraction Procedure for Leaching Toxicity; Horizontal Vibration Method; China Environmental Science Press: Beijing, China, 2010; Volume HJ 557-2009.
  30. Galson, D.A.; Wilson, N.P.; Schärli, U.; Rybach, L. A comparison of the divided-bar and QTM methods of measuring thermal conductivity. Geothermics 1987, 16, 215–226. [Google Scholar] [CrossRef]
  31. Zhang, Y.; Gao, P.; Yu, Z.; Fang, J.; Li, C. Characteristics of ground thermal properties in Harbin, China. Energy Build. 2014, 69, 9. [Google Scholar] [CrossRef]
  32. Jiang, X.; Lu, W.X.; Yang, Q.C.; Yang, Z.P. Potential ecological risk assessment and prediction of soil heavy metal pollution around coal gangue dump. Nat. Hazards Earth Syst. Sci. 2014, 14, 1977–2010. [Google Scholar] [CrossRef]
  33. Yang, Z.P.; Wen-Xi, L.U.; Long, Y.Q.; Liu, X.R. Prediction and Precaution of Heavy Metal Pollution Trend in Urban Soils of Changchun City. Urban Environ. Urban Ecol. 2010, 23, 1–4. [Google Scholar]
  34. Wei, C.; Zhu, W.; Chen, S.; Ranjith, P. A Coupled Thermal–Hydrological–Mechanical Damage Model and Its Numerical Simulations of Damage Evolution in APSE. Materials 2016, 9, 841. [Google Scholar] [CrossRef] [PubMed]
  35. Nassar, I.N.; Horton, R. Simultaneous Transfer of Heat, Water, and Solute in Porous Media: I. Theoretical Development. Soil Sci. Soc. Am. J. 1992, 56, 1350–1356. [Google Scholar] [CrossRef]
  36. Michalowski, R.L.; Zhu, M. Frost heave modelling using porosity rate function. Int. J. Numer. Anal. Methods Geomech. 2006, 30, 703–722. [Google Scholar] [CrossRef]
  37. Lu, N.; Likos, W.J. Unsaturated Soil Mechanics; John Wiley & Sons: New York, NY, USA, 2004. [Google Scholar]
  38. Taylor, G.S.; Luthin, J.N. A model for coupled heat and moisture transfer during soil freezing. Rev. Can. De Géotechn. 1978, 15, 548–555. [Google Scholar] [CrossRef]
  39. Xu, X.; Wang, J.; Zhang, L. Frozen Soil Physics; Science Press: Beijing, China, 2010; pp. 105–107. [Google Scholar]
  40. Xu, X.Z.; Oliphant, J.L.; Tice, A.R. Prediction of unfrozen water content in frozen soils by a two-point or one-point method. In Proceedings of the 4th International Symposium on Ground Freezing, Sapporo, Japan, 5–7 August 1985; Volume 2, pp. 83–87. [Google Scholar]
  41. Bai, Q.B.; Xu, L.I.; Tian, Y.H.; Fang, J.H. Equations and numerical simulation for coupled water and heat transfer in frozen soil. Chin. J. Geotech. Eng. 2015, 37, 131–136. [Google Scholar]
  42. Tan, Y.Q.; Hui-Ning, X.U.; Zhou, C.X.; Zhang, K.; Chen, F.C. Temperature distribution characteristic of subgrade in seasonally frozen regions. J. Harbin Inst. Technol. 2011, 43, 98–102. [Google Scholar]
  43. Cao, Y.; Sheng, Y.; Jichun, W.U.; Jing, L.I.; Ning, Z.; Xiaoying, H.U.; Feng, Z.; Wang, S. Influence of upper boundary conditions on simulated ground temperature field in permafrost regions. J. Glaciol. Geocryol. 2014, 36, 802–810. [Google Scholar]
  44. General Administration of Quality Supervision Inspection and Quarantine of the People’s Republic of China. Standard for Groundwater Quality; China Environmental Science Press: Beijing, China, 2017; Volume GB/T 14848-2017.
  45. Ministry of Ecology and Environment of the People’s Republic of China. Soil Environmental Quality in Risk Control Standard for Soil Contamination of Agricultural Land; China Environmental Science Press: Beijing, China, 2018; Volume GB15618-2018.
  46. Meteorological Bureau of Jilin Province. Agricultural Meteorological Report of Jilin Province from 2010 to 2018. Available online: http://www.jlqx.gov.cn/ydqhbh/kjcx/ (accessed on 6 September 2018).
Figure 1. The location of the experimental road and oil sha industrial parks within Jilin province.le.
Sustainability 11 00804 g001
Figure 2. Structures I, II, III and the moisture sensors in the experimental road.
Sustainability 11 00804 g002
Figure 3. The comparison diagram between heavy-metal content of the modified SC and the national primary standard of agricultural soil [45].
Sustainability 11 00804 g003
Figure 4. The numerical results of the Structure I from 730 to 1095 days. (A) The distribution of ice volume fraction. (B) The distribution of temperature.
Sustainability 11 00804 g004
Figure 5. The numerical results of the Structure II from 730 to 1095 days. (C) The distribution of ice volume fraction. (D) The distribution of temperature.
Sustainability 11 00804 g005
Figure 6. The numerical results of the Structure III from 730 to 1095 days. (E) The distribution of ice volume fraction. (F) The distribution of temperature.
Sustainability 11 00804 g006
Figure 7. The changes of ice volume fraction and temperature at the interface between sand gravel and silty clay from 730 to 1095 days. (G) The changes of ice volume fraction at the depth of 70 cm. (H) The changes of temperature at the depth of 70 cm.
Sustainability 11 00804 g007
Table 1. The physical properties of SC and modified SC.
Physical PropertiesOSW: FA: SCSC
4:3:33:4:37:5:82:1:29:3:8
Plastic Limit [%]27.9626.9427.5420.2025.7722.40
Liquid Limit [%]40.5140.1742.7032.642.6034.00
Plasticity [%]12.5513.2315.1612.416.8311.60
Optimum Moisture [%]13.5018.0013.0015.0013.2012.20
Maximum Density [kg·m−3]155014601620152016901930
CBR Value soaking for 96h [%]17.0013.0031.0040.0033.001.00
Notes: (1) OSW = oil shale industry solid waste; (2) FA = fly ash; (3) SC = silty clay.
Table 2. The chemical compositions of OSW and FA.
SamplesThe Chemical Composition [%]
OSWCaOSiO2Al2O3Fe2O3MgONa2OK2OTiO2Loss on Ignition
6.4256.2813.447.222.492.311.840.598.56
FA0.92SiO3SiO2+Al2O3+Fe2O3Mg Ti Na and K compounds3.19
0.2488.646.01%
Table 3. The main parameters of filling materials and SC for FEM calculation.
Water Content w [%]Permeability k [m2]Thermal Conductivity
λ [W·m−1K−1]
Density
ρ [kg·m−3]
Specific Heat
C [J·kg−1K−1]
Modified SC15.66.5 × 10−140.6515201647
XPS board0.31.0 × 10−190.03455346
Sand Gravel16.05.5 × 10−121.061800840
SC23.65.5 × 10−140.931640940
Water//0.589804180
Ice//2.229171874
Notes: XPS = extruded polystyrene.
Table 4. Hydrochemical data of samples and statistical results of pollution assessment for each hydrochemical constituent.
ConstituentS1S2S3Aver-valueMaxi-valueBack-valueStan-value APiNi
Cu0.00440.00260.00520.00410.00520.04691.00000.08670.0995
Pb0.00110.00080.00100.00100.00110.00880.01000.10990.1177
Co0.00030.00040.00060.00040.00060.00230.05000.18840.2275
Zn0.04090.03110.00350.02520.04090.13171.00000.19120.2579
Cd0.00030.00010.00050.00030.00050.00080.00500.3750.5154
Ni0.00300.00280.00330.0030.00330.00690.02000.43960.4593
Al0.10300.06160.08180.08210.1030.10260.20000.80050.9079
Cr0.01340.02590.01640.01860.02590.02260.05000.82150.9971
NH4+0.08000.04000.10000.07330.10000.08000.50000.9171.096
Hg0.00010.00010.00010.00010.00010.00010.0011.00001.0000
PH8.26008.28008.28008.27338.28007.46008.50001.10901.1100
Ag0.00030.00020.00030.00030.00030.00020.05001.25001.3807
TFe0.00300.05700.06100.04030.06100.02700.30001.4941.915
Cl6.97005.22007.37006.52007.37003.4830250.0001.8721.998
Sb0.00030.00050.00040.00040.00050.00020.00502.00002.2639
As0.00710.00770.00660.00710.00770.00280.01002.54762.6507
Na+24.710026.860028.260026.610028.26007.0500200.0003.77503.8930
Ba0.07500.09670.08590.08590.09670.01250.70006.86937.3155
NO33.44303.54402.66203.21603.54400.443020.0007.26007.6390
TDS570.503609.471590.911590.295609.471072.86401000.008.10108.2300
WH389.446422.194408.863406.834422.19447.4200450.0008.57908.7430
Notes: (1) Concentrations are in mg · L 1 ; (2) S1 = sample 1; S2 = sample 2; S3 = sample 3; (3) Aver-value = Average value; Maxi-value = Maximum value; Back-value = Background value; Stan-value A = Standard value A; (4) WH = Water Hardness; (5) The Standard values A were obtained from the national thirdly standard of the Standard for Groundwater Quality [44].

