Article

Identification of Salt and Drought Biochemical Stress Markers in Several Silene vulgaris Populations

1
Institute of Plant Biology and Biotechnology, Unit of Botany and Plant Physiology, Faculty of Biotechnology and Horticulture, University of Agriculture in Krakow, Al. 29 Listopada 54, 31-425 Krakow, Poland
2
Institute for Plant Molecular and Cellular Biology (IBMCP, UPV-CSIC), Universitat Politècnica de València, Camino de Vera s/n, 46022 Valencia, Spain
3
Mediterranean Agroforestry Institute (IAM, UPV), Universitat Politècnica de València, Spain, Camino de Vera s/n, 46022 Valencia, Spain
4
The New Zealand Institute for Plant & Food Research Limited (PFR), Mt Albert Research Centre, Private Bag 92169, Auckland, New Zealand
5
Department of Land Reclamation and Environmental Development, Faculty of Environmental Engineering and Land Surveying, University of Agriculture in Krakow, 30-059 Krakow, Poland
*
Author to whom correspondence should be addressed.
Sustainability 2019, 11(3), 800; https://doi.org/10.3390/su11030800
Submission received: 6 January 2019 / Revised: 26 January 2019 / Accepted: 31 January 2019 / Published: 3 February 2019
(This article belongs to the Section Sustainable Agriculture)

Abstract

:
This study attempted to determine short-term responses to drought and salt stress in different Silene vulgaris genotypes and to identify potential abiotic stress biochemical indicators in this species. Four populations from contrasting habitats were subjected to drought and three levels of salinity under controlled greenhouse conditions. The determination of several growth parameters after the stress treatments allowed for ranking the tolerance to stress of the four analyzed populations on the basis of their relative degree of stress-induced growth inhibition. This was then correlated with changes in the leaf levels of monovalent ions (Na+, Cl, and K+), photosynthetic pigments (chlorophylls a and b, carotenoids), osmolytes (total soluble sugars, proline), and non-enzymatic antioxidants (total phenolic compounds and flavonoids). Despite the observed differences, all four populations appeared to be relatively tolerant to both stress conditions, which in general did not cause a significant degradation of photosynthetic pigments and did not generate oxidative stress in the plants. Drought and salinity tolerance in S. vulgaris was mostly dependent on the use of Na+ and K+ for osmotic adjustment under stress, a mechanism that appeared to be constitutive, and not stress-induced, since relatively high concentrations of these cations (without reaching toxic levels) were also present in the leaves of control plants. The inhibition of additional transportation of toxic ions to the leaves, in response to increasing external salinity, seemed to be a relevant mechanism of tolerance, specifically to salt stress, whereas accumulation of soluble sugars under drought conditions may have contributed to tolerance to drought.

1. Introduction

Abiotic stresses are known to reduce plants´ vegetative growth and reproductive success by decreasing the energy generated from photosynthesis and diverting resources and metabolic precursors from primary metabolism and biomass accumulation toward activation of the stress response mechanism [1]. These stresses include cold, heat, and alkalinity, among others: However, drought and soil salinity are the environmental factors with the strongest negative impact on crop productivity worldwide and largely determine the distribution of wild plant species in nature [2,3,4,5,6,7,8,9]. This has resulted in substantial scientific efforts being invested in the elucidation of abiotic stress tolerance mechanisms in plants, to help mitigate those adverse effects on crop yields [10,11,12,13]. Data generated from these studies have contributed to define appropriate strategies for breeding of enhanced crop stress tolerance [14,15,16]. Paradoxically, most studies on abiotic stress tolerance mechanisms have been conducted in model plants, such as Arabidopsis thaliana, or in some major crops, which are relatively sensitive to stress [17,18,19]. Lately, however, more emphasis is being placed on deciphering stress response mechanisms of some minor crops and many wild species with a wide spectrum of tolerance, some of them closely related to crop and model plant species. Some of these studies have found differences in the efficiency of stress responses in closely related species, or in different cultivars, ecotypes, or even individual populations of the same species [20].
In this work, we attempted to investigate drought and salt stress response mechanisms in four populations of Silene vulgaris Moench, the bladder campion, a perennial, edible plant from the Caryophyllaceae family (subfamily Silenoidae): More importantly, we also tried to identify suitable biochemical stress markers for the rapid and efficient selection of tolerant genotypes in this species and its relatives. This species is known for the use of its raw young shoots in salads or is cooked in a similar manner as spinach in Spain [21], Italy [22], and Turkey [23]. In the last decades, wild edible plants have become increasingly popular and a trend in gastronomy [24]. In the Mediterranean area, in particular, which has high plant diversity, the traditional use of wild edible plants is quite common [25]. In Italy alone, about 700 wild species belonging to 93 botanical families, including S. vulgaris, are consumed as vegetables or spices [26].
S. vulgaris grows in moderately nutrient-poor dry or semi-dry grasslands, and even in moderately moist ruderal areas. It is a frequent species in the Mediterranean region, mostly on coastal sands and rocks mainly covered with gravel. The bladder campion also grows in North America, Asia, and North Africa [27,28,29,30].
The habitat variability of organisms is in accordance with assumptions of evolutional ecology, and in the case of vascular plants, this approach may be expressed by strong ecotype or population variability within a given species. An increase in the level of abiotic stress, derived from climate change or from more direct human interventions, would most likely have a negative effect on plant fitness and reproductive success. The work of some authors has shown that populations growing in different habitats are often genetically distinct and display differences in drought and salt tolerance [6,31]. The exceptional adaptability of S. vulgaris [32,33] has led to the occurrence of distinct ecotypes adapted to extremely unfavorable habitat conditions. Apart from ecotypes tolerant to lead [34,35,36], there are others that are known to tolerate high concentrations of zinc, cadmium, arsenic, and copper [30,35,37,38,39,40,41]. Tolerance to chromium, nickel, and cobalt [42,43,44] has also been documented in other closely related Silene species, such as S. cobaltica [45] or S. paradoxa [46]. Tolerance to Ni has been described as an example of nonspecific co-tolerance of S. vulgaris to different metals [47,48].
Our recent studies have shown that species belonging to the Silene genus exhibit considerable interspecific variation in salinity and drought tolerance, and we have demonstrated a relatively elevated salt tolerance in S. vulgaris due to blocking of Na+ transport to the shoots. Moreover, we have noted that responses conveying tolerance to drought in Silene were not general, but were confined to particular populations [49]. Less is known regarding variations in salt and drought tolerance within each species: More importantly, the underlying mechanisms of variation are not fully elucidated. To investigate and describe in more detail drought and salt tolerance mechanisms in S. vulgaris, we undertook studies on the response to such stresses in different S. vulgaris populations.
Four populations of S. vulgaris, originating from different stands and climate regions, were selected for this work to check whether their responses to salt and water stress would differ according to their origin. Inhibition of growth under controlled salt and drought conditions was used as a criterion to establish the relative degree of tolerance of the studied populations. We hypothesized that stress tolerance in Silene populations would be dependent on the efficiency of the mechanisms activated to maintain cellular osmotic balance and to alleviate oxidative stress under the applied stress treatments. Furthermore, we expected to correlate differences in tolerance level with the populations’ geographical distributions and the ecological characteristics of their natural habitats. The main aim of the work was meant to identify salt and drought stress biochemical markers in S. vulgaris associated with the most relevant mechanisms of stress tolerance in this species, which would facilitate the selection of tolerant genotypes. For this, we measured the contents of several metabolites associated with specific stress responses, such as monovalent ions, proline and total soluble sugars (as putative osmolytes involved in osmotic adjustment), malondialdehyde (MDA, a reliable marker of oxidative stress), and total phenolic compounds and flavonoids (as examples of relevant non-enzymatic antioxidants), in leaves of the stressed plants and the corresponding controls.

2. Materials and Methods

2.1. Plant Material and Stress Treatments

In this study, we applied drought and salt stress treatments to plants of four different populations of S. vulgaris. The first population (Mog.) came from a calcareous mountain area in Mogente (Province of Valencia, Spain); the second (Ref. ES) came from the Botanical Garden of Valencia (Spain); the third (Serp.) was obtained from a population growing on serpentine soils contaminated with heavy metals, such as nickel (Ni), iron (Fe), cobalt (Co), and chromium (Cr) (near the village of Wiry, in Lower Silesia, southwestern Poland); and the fourth (Ref. PL) was from a nutrient-poor, semi-dry, but not heavy-metal polluted grassland located close to the previous population. The source habitats of the investigated populations differ in terms of their climatic conditions (Table 1).
Seeds from the four populations were sown separately in 1 L pots (Ø = 11 cm) filled with a mixture of peat (50%), perlite (25%), and vermiculite (25%), and were placed in plastic trays (8 pots per tray). Five weeks after sowing, the stress treatments were initiated, with eight biological replicas (plantlets) per population, and were prolonged for 5 additional weeks. The substrate was kept moderately moist, using Hoagland and Arnon’s nutrient solution [50]. The plants were grown in the greenhouse of the Institute for Plant Molecular and Cellular Biology (IBMCP), Valencia, Spain, under the following controlled conditions: Long-day photoperiod (16 h of light), temperature (23 °C during the day and 17 °C at night). Humidity ranged between 50% and 80% during the course of the treatments. Drought and salt stress were investigated in parallel. Control plants were watered twice per week for 5 weeks by adding 1.5 L of the nutrient solution to each tray containing 8 pots. Salt stress was applied by watering the plants in the same way but using solutions supplemented with NaCl to final concentrations of 150 or 300 mM. A gradual increase of the salt concentration was not tested, and no supplementary calcium was added in the growth solution with NaCl. Water stress treatments were performed by withholding irrigation of the pots for 5 weeks: After this period, the water content of the pot substrates dropped below 5%, as shown by direct measurements with a WET-2 sensor (Delta-T Devices, Cambridge, UK).

2.1.1. Growth Parameters

The relative stress-induced inhibition of vegetative growth was estimated by comparing a number of growth parameters between the control and the stressed plants, per each population, after 5 weeks of treatment: Stem length (SL, cm), leaf fresh weight (FW, g), dry weight (DW, g), and water content percentage (WC%). Total leaf fresh weight (FW) and dry weight (DW) was measured for each plant. DW was obtain by drying samples at 65 °C for 72 h. The water content percentage was calculated as WC% = [(FW − DW) × 100].
Since plants of the investigated populations differ somewhat in size, to better compare the effects of salt and drought on plant growth of the different taxa, SL and FW of water-stressed plants were expressed as a percentage of the average values of the corresponding controls, considered to be 100% in each case: 38.13 cm and 5.01 g (Mog.), 27.5 cm and 3.91 g (Ref. ES), 15.75 cm and 4.41 g (Serp.), and 23.5 cm and 1.18 g (Ref. PL).

2.1.2. Monovalent Ion Content

Leaf contents of sodium, chloride, and potassium ions were measured in water solution (0.1 g of dried material in 15 mL of water) by heating in a water bath for 1 h at 95 °C and then filtrated through 0.45 µm nylon filter [51]. Cations were quantified with a PFP7 flame photometer (Jenway Inc., Burlington, VT, USA), and Cl was determined using a Merck Spectroquant Nova 60 spectrophotometer and its associated test kit (Merck, Darmstadt, Germany).

2.1.3. Photosynthetic Pigments

Chlorophylls a and b (chl a and chl b) and total carotenoids (Caro) were determined as described by Lichtenthaler and Wellburn [52]. Fresh leaf material (100 mg) was extracted with 10 mL of ice-cold 80% (v/v) acetone and shaken overnight. Samples were centrifuged for 10 min at 12,000 rpm, and the absorbance was measured at 663, 646, and 470 nm. Chlorophylls and carotenoid concentrations were calculated using the equations described by Lichtenthaler and Wellburn [52]:
Chlorophyll a (chl a; µg·mL−1) = 12.21 A663 − 2.81·A646;
Chlorophyll b (chl b; µg·mL−1) = 20.13·A646 − 5.03·A663;
Total carotenoids (µg·mL−1) = (1000·A470 − 3.27·[chl a] − 104·[chl b])/229.
The calculated values were finally converted to mg·g−1 DW.

2.1.4. Lipid Peroxidation and Non-Enzymatic Antioxidants

Malondialdehyde (MDA) was determined as reported by Hodges et al. [53], except that the plant extracts were prepared from dried leaf material in 80% methanol (instead of ethanol) [54]. Methanol extracts were mixed with 0.5% thiobarbituric acid (TBA) prepared in 20% trichloroacetic acid (TCA)—or with 20% TCA without TBA for the controls—and then incubated at 95 °C for 15 min. The sample was centrifuged, and the supernatant’s absorbance was measured at 532 nm. The nonspecific absorbance at 600 and 440 was retracted, and MDA level was calculated with the equations described by Hodges et al. [53], and expressed as nmol g−1 DW.
Total phenolic compounds (TPCs) were quantified according to Blainski et al. [55] by measuring the absorbance of the methanol extracts at 765 nm after reacting with the Folin–Ciocalteu reagent: results were expressed in equivalents of gallic acid used as a standard (mg equiv GA g−1 DW). Total flavonoids (TFs) were determined according to the protocol described by Zhisen et al. [56], based on reaction of the methanol extracts with NaNO2 followed by AlCl3 at a basic pH. Absorbance of the samples was measured at 510 nm using catechin as a standard. This procedure also detects other phenolics containing a catechol group, but to simplify, in the text we refer to the AlCl3-reactive compounds as “total flavonoids” and express their contents in ‘equivalents of catechin’ (mg equiv C g−1 DW).

2.1.5. Proline Determination

Free proline (Pro) content was determined according to the ninhydrin-acetic acid method described by Bates et al. [57]. Leaf samples was extracted in 3% aqueous sulfosalicylic acid and mixed with acid ninhydrin solution. The samples were incubated in a boiling water bath for 1 h at 95 °C. After stopping the reaction on ice, Pro was extracted with toluene. The absorbance of the supernatant was read at 520 nm and Pro amounts was expressed as μmol g−1 DW.

2.1.6. Total Soluble Sugars Quantification

Total soluble sugars (TSSes) were quantified according to the method described by Dubois et al. [58]. Dry leaf material was mixed with 80% methanol on orbital shaker overnight: 100 μL of the extract was mixed with 0.5 mL of 5% phenol and 2.5 mL of concentrated sulfuric acid before absorbance reading were taken at 490 nm. TSS contents were expressed as “mg equivalent of glucose” per gram of DW.

2.1.7. Statistical Analyses

The experimental setup was based on a completely randomized design (CRD). Experimental data was analyzing using. The program Statgraphics Centurion v.16. Before the analysis of variance, the validity of normality assumption was checked by the Shapiro–Wilk test and the homogeneity of variance using the Levene test. If the ANOVA requirements were met, the significance of the differences among salt treatments was tested by one-way ANOVA at a 95% confidence level and posthoc comparison were made using tthe Tukey HSD. All mean values mentioned throughout the text include the standard deviation (SD).
In addition, all measured parameters in plants treated with three levels of NaCl and water stress were correlated using principal component analysis (PCA), separately for all variables related to growth parameters on the one side and those related to biochemical parameters on the other. The Barletta test was used to verify which populations in dependent variables were significantly different. The Kaiser–Meyer–Olkin (KMO) coefficient is a measure of how suited biochemical parameters are for multivariate analysis. The KMO coefficient (a test for sampling adequacy) explained the intercorrelation among variables and was appropriate for subjecting all variables to multivariate analysis (0.563). Principal component analysis showed the presence of two main gradients of biochemical indicators variables (p < 0.01). The positions of the vectors of independent variables were proportional to the loading factors. The multivariate analysis was carried out with PQ Stat version 1.6.6.
Canonical variate analysis (CVA) was employed to explain the relative importance of particular explanatory variables and to underline differences between populations. The results of the CVA discriminated the total (overall) assemblage structure and the relationships between physiological and biochemical parameters. Finally, the pattern of the independent variables for drought and salinity are shown in a plot. Multivariate analysis of variation (MANOVA) was applied, because the groups of variables were independent.
The multiple regression model included all parameters and all treatment combinations in order to verify the differences between populations. Verification of the assumptions was performed using a coefficient of determination (R2) to compare the variables in populations.
The canonical variate analysis and regression model were computed using the statistical software PAST, version 3.2.

3. Results

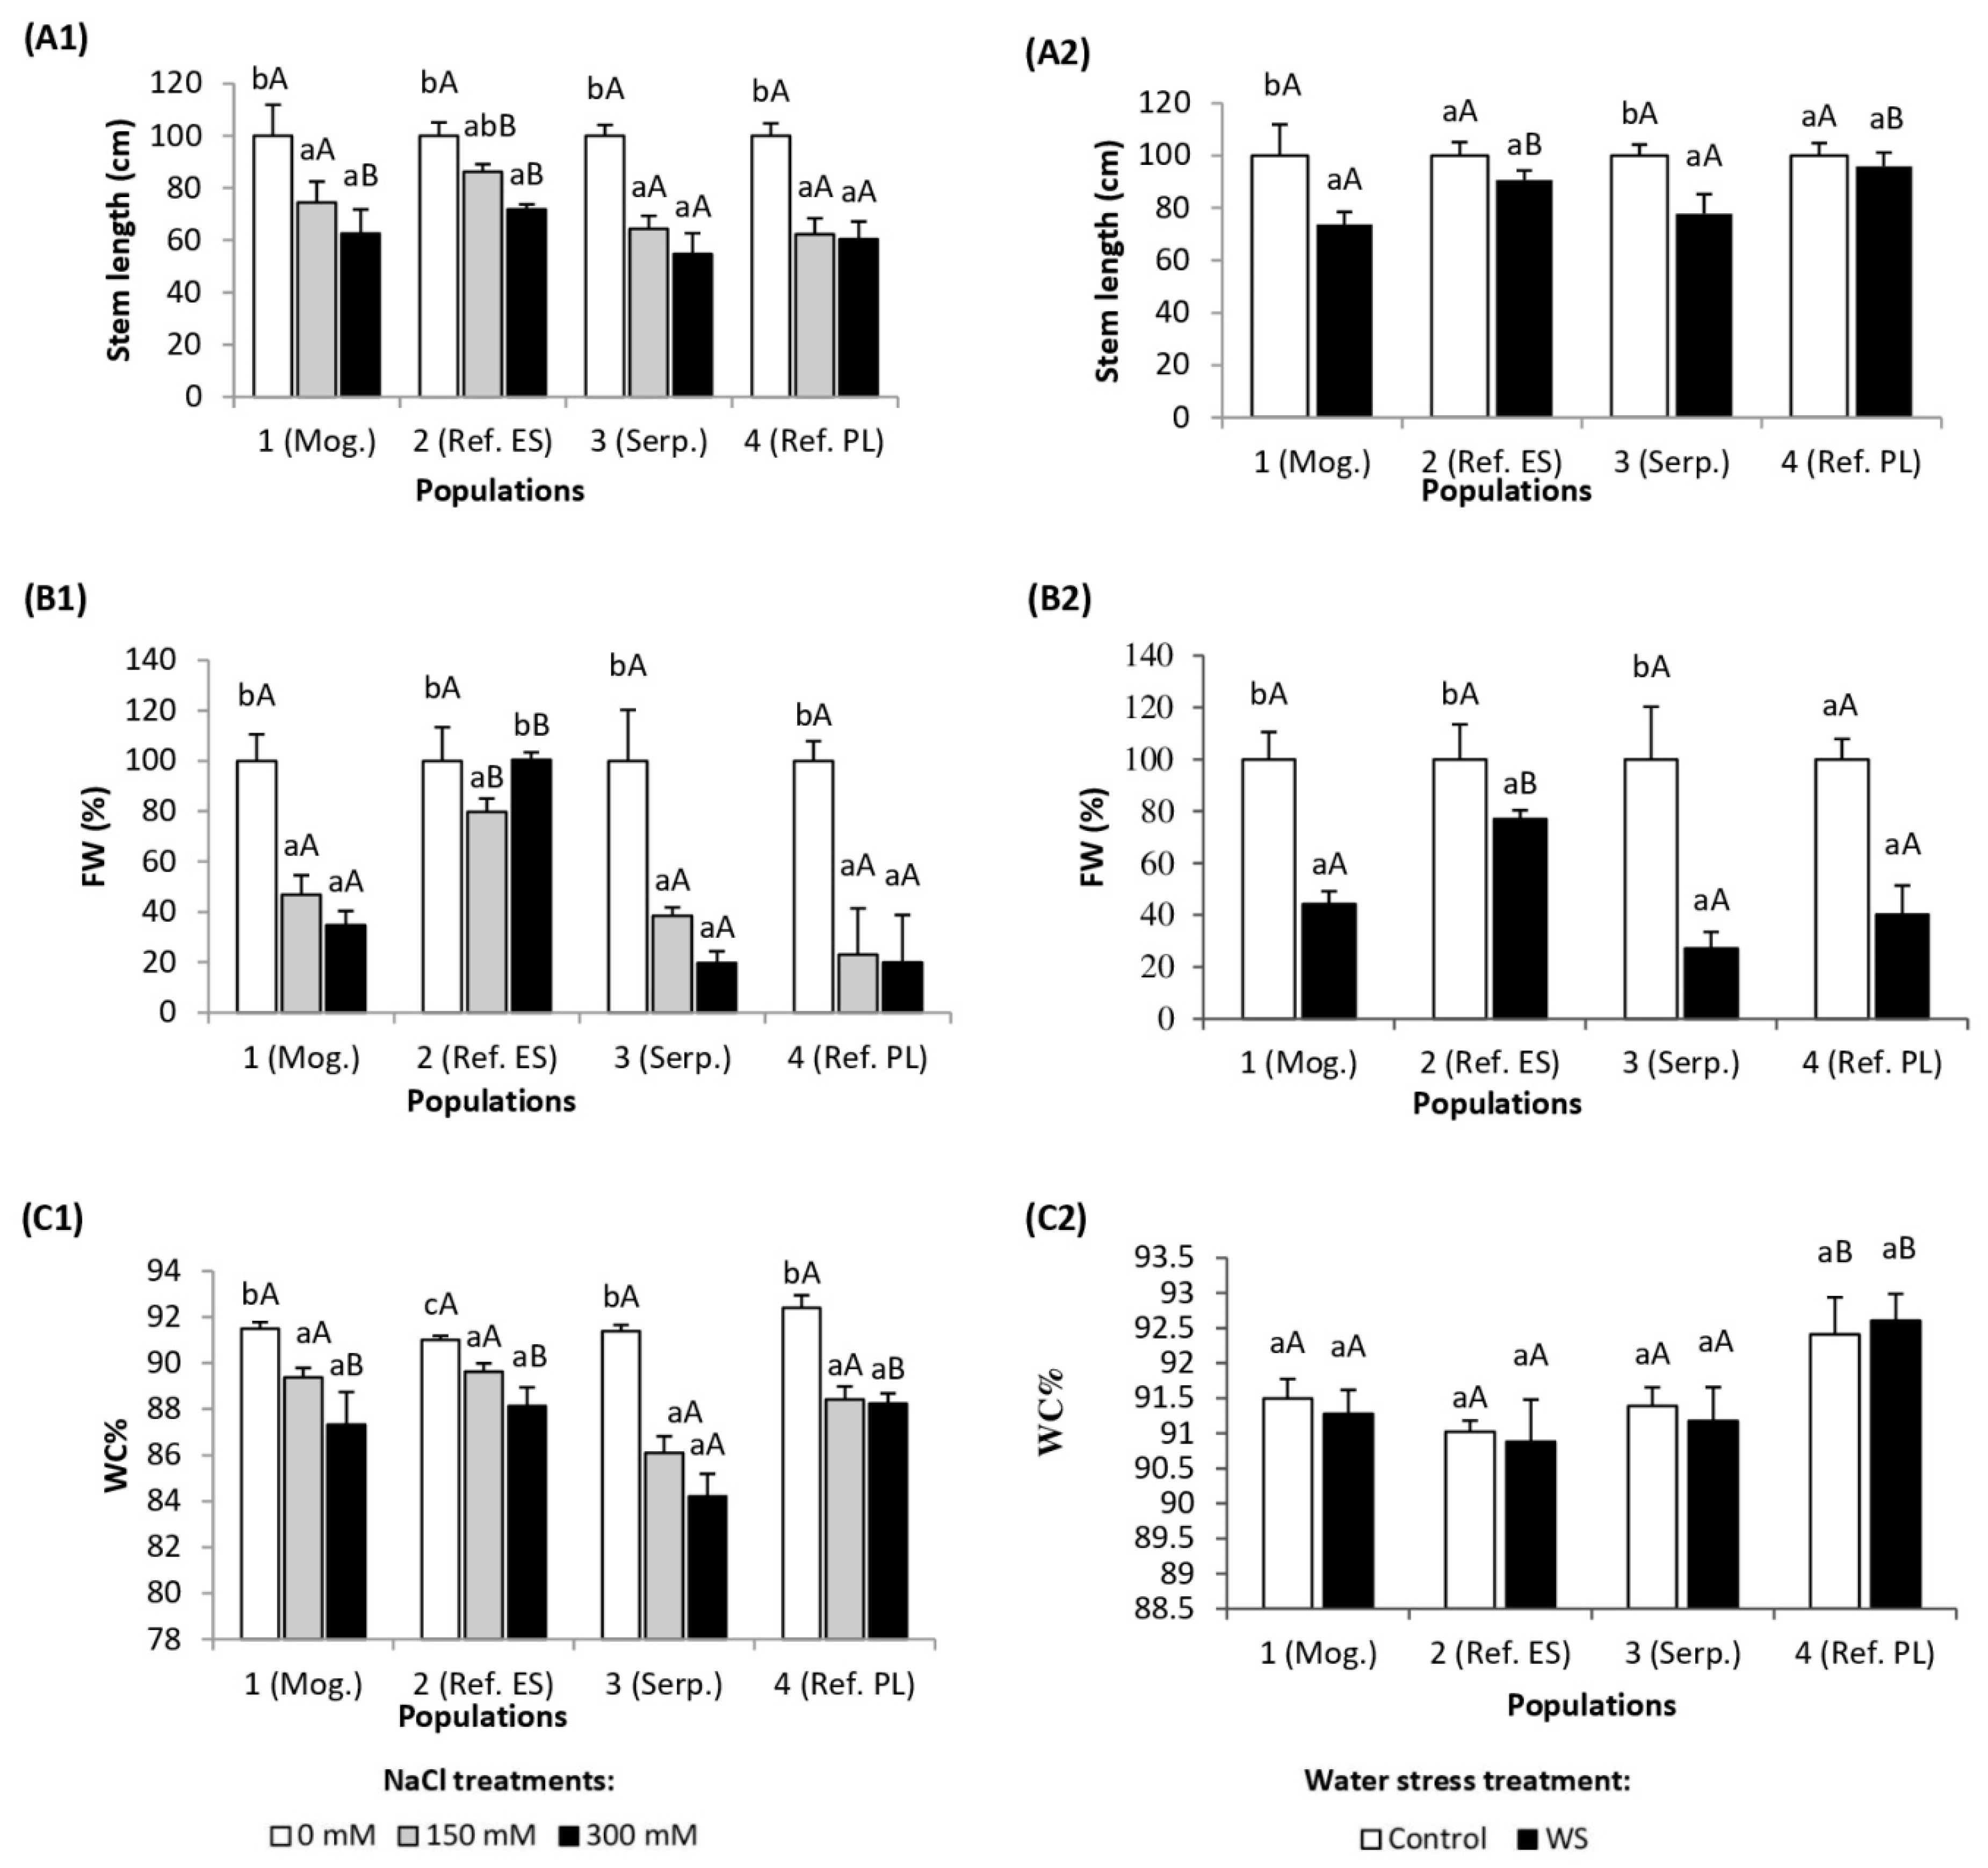
3.1. Growth Parameters

In all studied S. vulgaris populations, salt stress caused a reduction of the stem length compared to the corresponding control plants. However, in population 2 (Ref. ES), a significant reduction was observed only under the highest applied salt concentration (300 mM NaCl), while in the other three populations this effect was already noticeable at 150 mM NaCl (Figure 1(A1)). Under the effect of 150 mM NaCl treatment, the leaf fresh weight of populations 1 (Mog.), 3 (Serp.), and 4 (Ref. PL) was reduced to less than 50% of their respective controls, and to 35–20% in the presence of 300 mM NaCl. In contrast, in the plants of population 2 (Ref. ES), leaf fresh mass was not affected by the salt treatment at 300 mM NaCl, but a small decrease was observed at 150 mM (Figure 1(B1)). Regarding water content in leaves, salt stress caused a significant dehydration in all studied populations, although no differences were observed between the 150 and 300 mM NaCl treatments in populations 1 (Mog.), 3 (Serp.), and 4 (Ref. PL) (Figure 1(C1)). The highest WC% decrease (7%) was noted in population 3 (Serp.) (Figure 1(C1)). Here again, population 2 (Ref. ES) showed a smaller reduction of mean water contents in response to salt at both tested NaCl concentrations (Figure 1(C1)). Taken together, these data suggest that Ref. ES was the population most tolerant to salt stress (under the tested experimental conditions), partly due to a higher relative tolerance to salinity-induced leaf dehydration.
Under drought, stem reduction occurred only in plants of populations 1 (Mog.) and 3 (Serp.) (26% and 22%, respectively), whereas no significant differences with the controls were observed in plants of populations 2 and 4 (Figure 1(A2)). Significant reductions of leaf fresh weight were detected in all studied populations (55%, 23%, 73%, and 60%, respectively) (Figure (1B2)). The drought conditions used in the experiment did not result in a significant dehydration of the leaves, since their water content percentage remained unchanged in the plants of all four studied populations (Figure 1(C2)). Therefore, although the differences between populations were smaller than those observed in the case of salt stress, Ref. ES also seemed to be the most tolerant to water stress.

3.2. Ion Content in Leaves

Na+ content in leaves increased in parallel to increasing external salinity in three populations: 1 (Mog.), 3 (Serp.), and 4 (Ref. PL), reaching concentrations of 545, 645, and 765 µmol g−1 DW, respectively, in the presence of 300 mM NaCl (Figure 2(A1)). In population 2 (Ref. ES), Na+ concentration amounted to about 400–450 µmol −1 DW both in control and salt-stressed plants, irrespective of applied NaCl concentration. Salt-induced accumulation of chloride ions occurred in all four studied populations (Figure 2(B1)). In the presence of 300 mM external NaCl, the lowest Cl content was determined in plants of populations 1 (Mog.) and 2 (Ref. ES) (370 and 255 µmol g−1 DW, respectively). In populations 3 (Serp.) and 4 (Ref. PL), Cl concentration reached values higher than 700 µmol g−1 DW (Figure 2(B1)). Leaf K+ content decreased significantly only in population 4 (Ref. PL) and only in the presence of 300 mM NaCl (Figure 2(C1)). In this genotype, the overall content of K+ ions was the highest among the tested populations (Figure 2(C1)). Leaf K+ concentration in control plants of population 2 (Ref. ES) was significantly lower than in the other populations. K+/Na+ ratios decreased in the four populations with increasing salinity, with population 2 (Ref. ES) showing the smallest relative reduction and populations 3 (Serp.) and 4 (Ref. PL) the largest (Figure 2(D1)).
Water stress treatments did not change the levels of Na+ in the leaves, as expected, except for a small reduction in population 2 (Ref. ES) (Figure 2(A2)). However, differences between populations were observed in other ions, such as a significant increase of leaf Cl content recorded in population 1 (Mog.) (Figure 2(B2)). The lowest concentration of potassium ions was recorded in population 2 (Ref. ES) in both control and drought-stressed plants compared to the other studied populations. On the other hand, K+ content increased only in population 2 (Ref. ES) (Figure 2(C2)). The K+/Na+ ratio did not change significantly under drought conditions in any of the studied populations (Figure 2(D2)).
It is worth mentioning the high leaf concentrations of Na+ (between ca. 300 and more than 400 µmol g−1 DW) and K+ (800–1100 µmol g−1 DW, approximately) measured in control, nonstressed plants of the four populations (Figure 2).

3.3. Photosynthetic Pigments

As expected, the applied salt stress caused, in most cases, the degradation of chlorophylls a and b, although the reduction in relation to the control was statistically significant only in the plants of population 3 (Serp.), amounting to 57% chl b. In contrast, an increase in chlorophyll content was observed in stressed plants of population 1 (Mog.) (Figure 3(A1),(B1)). Regarding carotenoid levels, no clear pattern of salt-induced changes was detected in the different S. vulgaris genotypes: The plants of population 1 showed an increase at both salt concentrations tested and no significant variations were observed in those of population 2 and 3, whereas a significant decline in Caro leaf concentrations was noted in plants of population 4 treated with 150 mM NaCl, but not in the presence of 300 mM NaCl (Figure 3(C1)).
Drought caused a significant increase in the content of chlorophylls a and b in the leaves of populations 1 (Mog.) and 4 (Ref. PL), whereas only chl. a increased in plants of population 3 (Serp.) in response to the stress treatment, and no changes were recorded in population 2 (Ref. ES) (Figure 3(A2),(B2)). Total carotenoid levels increased significantly in population 1 (Mog.) under water stress conditions, but did not vary in the remaining three populations (Figure 3(C2)).

3.4. Lipid Peroxidation and Non-Enzymatic Antioxidants

Malondialdehyde (MDA), a product of membrane lipid peroxidation and a reliable biomarker of oxidative stress, increased significantly, by about 30% over the nonstressed controls, only in plants of population 3 (Serp.) and only in the 300 mM NaCl treatment: In the other three S. vulgaris populations, MDA concentrations did not vary in response to increasing external salinity, except for a small (but significant) decrease in plants of population 2 (Ref. ES) (Figure 4(A1)). It should be pointed out that plants of populations 1 (Mog.) and 3 (Serp.) had a relatively higher MDA level in the leaves than plants representing populations 2 (Ref. ES) and 4 (Ref. PL), both in the presence of salt and in the nonstressed controls (Figure 4(A1)).
Total phenolic compound (TPC) leaf levels were similar in nonstressed plants of the four selected populations, and increased about two-fold in the presence of salt in populations 1 (Mog.) and 3 (Serp.), while TPC contents did not vary significantly in populations 2 (Ref. ES) and 4 (Ref. PL) (Figure 4(B1)). Regarding total flavonoids (TFs), different patterns of salt-induced variation were observed in the studied S. vulgaris populations: Their concentrations increased 1.4-fold in plants of population 2 (Ref. ES) treated with 300 mM NaCl, decreased by 50% in plants of population 4 (Ref. PL) at the two salt concentrations tested, and did not vary significantly in the other two populations (Figure 4(C1)).
In the water stress treatment, MDA leaf contents decreased by ca. seven-fold, compared to the corresponding control, in plants of population 4 (Ref. PL), and did not change significantly in the remaining three populations (Figure 4(A2)). TPC leaf contents increased significantly only in treated plants of population 1 (Mog.), while drought did not affect TPC levels of plants of the other three populations (Figure 4(B2)). Regarding total flavonoid (TF) leaf contents, the general pattern of variation was similar to that of MDA: A significant drought-induced decrease, of about 2.5-fold, was detected only in plants of population 4 (Ref. PL) (Figure 4(C2)).

3.5. Osmolytes

Proline (Pro) is a ubiquitous osmolyte known to accumulate in the leaves of most plants affected by biotic and abiotic stresses, and the four studied S. vulgaris populations were no exception. In the presence of 300 mM NaCl, a significant increase in Pro content was detected in populations 1 (Mog.), 2 (Ref. ES), and 3 (Serp.), reaching 5, 1.5, and 8-fold higher values, respectively, than the corresponding controls (Figure 5A1). In contrast, plants of population 4 (Ref. PL) did not accumulate Pro in response to the salt treatments (Figure 5(A1)). The accumulation of total soluble sugars (TSSes) was enhanced in the leaves of the salt-stressed plants of all studied populations. The highest relative increase and absolute concentration of TSSes (55 mg equiv glucose·g−1 DW) were measured in the leaves of the stressed plants of population 3 (Serp.); those of population 2 (Ref. ES) reached similar TSS levels under salt stress conditions, but showed the lowest relative increase, since TSS contents in the nonstressed controls were significantly higher than in plants of the other populations (Figure 5(B1)).
Under the applied water stress treatment, leaf Pro concentrations remained unchanged in plants of populations 1 (Mog.) and 3 (Serp.), in comparison to their respective controls, while Pro levels decreased significantly in plants of populations 2 (Ref. ES) and 4 (Ref. PL) (Figure 5(A2)). The level of TSSes increased in the leaves of drought-stressed plants of populations 1 (Mog.) and 2 (Ref. ES.), while no such change was recorded in populations 3 (Serp.) and 4 (Ref. PL) (Figure 5(B2)).

3.6. Correlations between Growth and Biochemical Parameters in S. vulgaris Populations under Salinity and Drought Stress

To further analyze the results obtained in each set of experiments, correlations between all variables measured in the plants were determined (independently for the salt and water stress treatments) by performing a canonical variate analysis (CVA) and principal component analyses (PCAs).
The CVA was carried out to determine the strength of relationships among biochemical stress markers of the studied populations. In the CVA, sets of variables (biochemical and physiological traits) were combined to produce the highest correlation between populations. The CVA enabled the isolation of groups and revealed that all populations were discriminated (varied within features) (Figure 6A,B). A convex hull indicated the statistically significant positions of particular populations (MANOVA test, p < 0.05, F = 2.43).
The PCA corresponding to the salt stress treatments showed that two components had an eigenvalue equal to or greater than 1 and explained approximately a 62% cumulative percentage of variance. The first component (x axis), which explained 43.43% of variance, was clearly determined by the content of sodium and chloride ions in the leaves. The vectors of the biomarker variables shows very small angles with the x axis, indicating a highly correlation with salinity, either positive (for those variables increasing in parallel with increasing Na+ and Cl concentrations (proline and total soluble sugars)) or negative for stem length, relative fresh weight, and relative water content (in agreement with the salt-induced inhibition of growth and leaf dehydration). The second component (y axis), which explained another 18.3% of variance, was related to the content of photosynthetic pigments. As expected, the levels of photosynthetic pigments (chlorophyll a, chlorophyll b, and carotenoids) were positively correlated with each other, with the corresponding vectors close to the positive part of the y axis, but negatively correlated with MDA concentration (Figure 7A).
In the PCA analysis for the drought treatments, two components explained almost 53% of the total variance. A positive correlation between the K+/Na+ ratio and MDA content was determined. The contents of chlorophyll a, carotenoids, TPC, osmolytes (TSS and proline), and Na+ were negative related to each other (Figure 7B).
Additionally, a regression analysis was performed to check the relationship between the stress treatments and the biochemical stress markers measured in the plants (Table 2). For drought stress, the highest coefficients of determination (R2 > 0.9) were calculated for MDA and total flavonoid content. The best-fitting model was detected in population 3 (Serp.) for salinity (Table 2a) and in population 4 (Ref. PL) for drought (Table 2b).

4. Discussion

Plant adaptation or tolerance to drought and salinity involves complex physiological traits, metabolic pathways, and molecular networks. Physiological and biochemical responses are based on a series of conserved mechanisms, such as the control of ion transport, protection of the photosynthetic machinery, maintenance of cellular osmotic balance, and activation of antioxidant systems [12,59,60,61].
Many studies have reported that plant tolerance to salt and water stress may vary among different genotypes within the same species [62,63]. In this study, we analyzed intraspecific responses of different S. vulgaris populations adapted to grow in distinct environmental conditions. Particular individuals were therefore expected to represent different levels of tolerance to salinity and water stress. Investigations of intraspecific variation to salinity and drought stress provided an opportunity to better understand species-specific mechanisms of stress responses [11], including the relative importance and variation of biochemical and physiological adaptations within species.
Contrasting genotypes of different species have been used to characterize their response to abiotic stresses such as salinity and drought at the transcriptional [64,65], proteomic [66,67], or metabolomic [68,69] levels, but without a clear explanation of the reasons for selecting such genotypes. In our studies, we selected the populations based on ecological diversity: They originated from habitats with different characteristics. The first and ubiquitous response of plants under environmental stress is inhibition of growth, best quantified by the relative reduction of the dry weight and water content of the plant aerial part, compared to the nonstressed plants. Growth inhibition is also a consequence of activation of defense mechanisms by plants [11,12,70,71]. According to the relative degree of stress-induced growth inhibition, the Spanish reference population (2, Ref. ES) proved to be the most salt- and drought-tolerant, whereas population 3 (Serp.) from Poland appeared to be the most sensitive: The other two populations exhibited intermediate degrees of tolerance to both stresses. The concept of ecotype refers to populations of a particular species that are evolutionally adapted to specific natural habitats [72], but in some extreme environmental conditions, such as salt and drought stress applied at the same time, the reaction of a given genotype may be different from the expected one because of population fitness flexibility [73]. This may be the possible explanation for the ascertained low level of tolerance in the serpentine population under both drought and salt stress conditions.
Growth parameters are reliable indicators to evaluate the effect of stress on plants, but they can be complemented with suitable biochemical stress markers, which include a large array of compounds that can be easily identified and quantified in plant material, using simple, sensitive, and nondestructive methods [31,74,75,76]. Furthermore, correlation of specific stress marker levels with the relative tolerance of the selected populations provides information on the tolerance mechanisms.
One of the salt tolerance strategies in plants is the control of ion transport to photosynthetic tissues. Glycophytes usually block the transport of toxic Na+ and Cl ions to aboveground organs [77,78,79,80]. We can assume that such a response also takes place in the studied S. vulgaris genotypes, although our experiments did not allow for defining where this blockage takes place, during ion uptake at the root level or during ion transport from roots to stems and leaves. Plants representing three of the four studied populations accumulated substantial amounts of sodium ions in the leaves in response to increasing NaCl concentrations, with the highest relative increase observed in the most sensitive genotype (population 3, Serp.): The most tolerant population 2 (Ref. ES), however, was able to maintain the same sodium concentration in the leaves irrespective of the external salinity. Although in many studies, salt stress responses and tolerance mechanisms have been investigated with a focus on Na+ toxicity and accumulation [81], Cl ions similarly interfere with metabolic processes, in particular in photosynthetic tissues [82]. In our work, the highest Cl levels occurred in salt-sensitive populations 3 (Serp.) and 4 (Ref. PL). In contrast, Cl concentration was the lowest in the leaves of the two studied Spanish populations, 1 (Mog.) and 2 (Ref. ES). This negative correlation between ionic accumulation in the leaves of stressed plants and tolerance indicates that the inhibition of sodium and chloride transport to the leaves was indeed relevant for salt tolerance in S. vulgaris. This was in agreement with our previous reports on salt tolerance in different species of the Silene genus [49]. Consequently, the joint statistical analysis by PCA of the “ion contents” variables showed highly significant correlations with the salt treatments (in leaves), positive for Na+ and Cl (which increased with increasing salinity) and negative for growth parameters. In any case, it is clear that Na+ and Cl- should not reach toxic concentrations in the cytosol and must be predominantly sequestered into the vacuole, according to the generally accepted “ion compartmentalization hypothesis” [83,84].
Although plant salt tolerance through blocking toxic ions transport and their accumulation is well characterized, the importance of Na+ exclusion and vacuolar Na+ sequestration, as well as the molecular regulation of Na+ transporters/channels in response to salt stress, should be investigated in future research. Increases in Na+ levels in plants are usually associated with a decrease in K+ levels. These two cations compete for the same binding sites, and Na+ inhibits K+ uptake into the cell by occupying its protein membrane transport channels. In addition, Na+ uptake induces depolarization of the plasma membrane, causing the activation of outward K+ channels and, as a consequence, the loss of cellular K+ [79,85]. Unexpectedly, in our study we did not observe changes in the K+ level between untreated and salt-treated plants in three of the four studied populations. The exception was population 4 (Ref. PL), where the content of K+ dropped when plants were treated with a 300-mM NaCl concentration. In fact, we have previously reported on such a reaction to high salinity in S. vulgaris [49].
Ion homeostasis was less affected in S. vulgaris plants subjected to drought stress than under salt stress. Chloride contents increased significantly in population 1 (Mog.) under drought treatment, while in the plants of the three other studied populations, Cl increase was not statistically significant. The increase in chloride ions can be explained as an adaptive response of the plants to drought stress because this nutrient is important for osmoregulation and charge balance. The overall chloride concentration in the whole plant is insufficient to be an effective osmoregulator [86,87]. Potassium content increased only in drought-stressed plants of the most tolerant population 2 (Ref. ES). These results could be explained by assuming that K+ transport to the leaves contributes to drought tolerance in S. vulgaris. Numerous reports have confirmed that maintaining adequate plant K+ is critical for plant drought tolerance [88,89]. Additionally, a close relationship between K+ nutritional status and plant drought tolerance has been demonstrated by Wang et al. [90]. In any case, the high concentrations of Na+ and K+ measured in the leaves of control, nonstressed plants of the four selected populations point to the presence in S. vulgaris of constitutive mechanisms of defense against drought and salinity, which could partly explain its higher tolerance to these stresses compared to most major crops.
A decrease in chlorophylls is a frequent response of plants to salinity and drought. Several comparative analyses of genetically related taxa have shown that the degradation of photosynthetic pigments usually correlates negatively with their relative degree of tolerance [91,92,93]. Accordingly, in this study, degradation of chlorophylls under salt stress occurred only in the least tolerant population 3 (Serp.). Drought stress caused an increase in chlorophylls in all studied populations, which we explain as a defense reaction against oxidative stress caused by drought. Chlorophylls are located in chloroplasts, where reactive oxygen species (ROS) production can be accelerated under drought conditions, and some previous studies have also reported an increase in chlorophyll level under water stress [94]. It has also been shown that concentration of chlorophyll a is higher when compared to chlorophyll b in drought-stressed plants, which was confirmed in the present work. Carotenoids are pigments with several functions in plants: Besides their direct role in photosynthesis, they are antioxidant compounds involved in oxidative stress defense [52]. Maintaining constant carotenoid levels in the presence of salt, as observed in the most tolerant population (Ref. ES), may be considered to be a strategy to counteract the oxidative stress caused by salinity.
Abiotic stresses, including drought and salinity, generally cause oxidative stress. Among symptoms of oxidative damage is the degradation of cell membranes, and MDA, which is a product of membrane lipid peroxidation, is considered to be a reliable marker of oxidative stress [95]. In S. vulgaris, an increase in MDA concentration under salinity occurred only in the less tolerant population 3 (Serp.), indicating that this population was affected by salt-induced oxidative stress. In stressed plants of the other three studied populations, membrane lipid peroxidation showed no significant change from its control levels, irrespective of the applied salt concentration. Interestingly, MDA levels did not increase in drought-treated plants, and even recorded a decline in population 4 (Ref. PL). Therefore, we can assume that the investigated populations were not significantly affected by oxidative stress under the drought conditions used in our experiments, as they probably possess active defense mechanisms to avoid the generation of reactive oxygen species (ROS).
Plants use a number of enzymatic and non-enzymatic antioxidants to prevent oxidative damage and keep ROS concentrations within a narrow functional range [96]. Phenolic compounds and total flavonoids, belonging to non-enzymatic antioxidants, fulfill various functions in plants. As structural components of cell walls they participate in the regulation of growth and developmental processes as well as in defense mechanisms against biotic and abiotic stress due to their strong antioxidant character and ROS scavenging activity [96,97]. Flavonoids represent the main group of polyphenols, with a wide array of biological roles, including lipid peroxidation inhibition [97,98,99]. Salt-induced increases in antioxidant phenolic levels have been reported in different plant species [100,101]. In S. vulgaris, a significant increase in total phenolic compounds was observed only in populations 1 (Mog) and 3 (Serp.), and an increase in antioxidant flavonoids was only detected in population 2 (Ref. ES) as a response to salt stress. The lack of clear results was probably related to other functions of these compounds that masked their possible participation as antioxidants in stress defense mechanisms. In any case, concerning the aim of this study, it is important to point out the lack of correlation of total phenolic compound contents with the salt stress applied to the S. vulgaris populations, thus excluding the use of these compounds as salt stress biochemical indicators in this species.
The accumulation of Na+ in the vacuole, to avoid its toxic effects in the cytosol, requires the synthesis and accumulation of organic solutes for osmotic adjustment [102]. Accumulation in the cytosol of various osmolytes, including sugars, sugar alcohols, and amino acids and their derivatives (such as proline and glycine betaine) is a common response to osmotic stress accompanying numerous abiotic stressors [103,104,105]. It has been repeatedly reported that accumulation of Pro in response to the same stress treatment is strongly dependent on plant genotype. Some authors have reported that more tolerant taxa accumulate higher Pro levels than related sensitive taxa under the same conditions [106,107,108], whereas in other studies a negative correlation or no correlation at all was found between Pro levels and the relative degree of tolerance of the investigated taxa [109,110]. The latter seems to be the case in S. vulgaris populations, where salt-induced changes in Pro contents could not be clearly correlated with their relative degree of tolerance. In the case of the water stress treatments, the plants of two populations even showed a significant reduction of Pro levels under drought conditions. More importantly, the absolute Pro concentrations were in all cases too low to have any significant osmotic effect on the plants. Thus, Pro did not seem to be directly involved in the mechanisms of stress tolerance in S. vulgaris and cannot be considered to be a reliable stress marker in this species. The accumulation of soluble sugars has also been observed in many plant species exposed to salt or drought, and these compounds may play a pivotal role in osmotic adjustment [88,111,112]. The results of the present study indicated that all investigated populations accumulated TSSes in response to salt stress: However, the highest TSS level was measured in the less salt tolerant population, whereas the smallest relative increase over control values was observed in the most tolerant. Therefore, it seems logical to assume that accumulation of TSS is activated as a response to salt stress in S. vulgaris, but it does not contribute to salt tolerance in this species. An increase in TSS content under water stress conditions was noted only in the two Spanish S. vulgaris populations, reaching higher absolute values in the most tolerant (2, Ref. ES), which may indicate the activation of specific defense mechanisms against drought in these populations. The accumulation of soluble sugars in drought-stressed plants appears to be controlled by several mechanisms affecting sugar formation and transfer in the leaves [113].
To summarize, salt and drought tolerance mechanisms in S. vulgaris seem to depend mainly on the accumulation in leaves of relatively high Na+ concentrations—probably stored mostly in the vacuoles, without reaching toxic levels in the cytoplasm—as well as very high K+ concentrations: Both inorganic cations should contribute significantly to cellular osmotic balance under stress. These mechanisms appear to be constitutive, since these ions were present at high concentrations also in the leaves of nonstressed plants. The accumulation of high leaf Na+ concentrations under low soil salinity conditions has been described for several halophytes, both in field [54] and greenhouse [111] experiments, and also (to a lesser extent) in typical glycophytes, such as some Phaseolus cultivars [20]. In S. vulgaris, specific mechanisms of tolerance to salinity seem to be based on the inhibition of additional transportation of toxic ions to the aerial parts of the plants, whereas accumulation of soluble sugars may contribute to tolerance to drought.
Considering its higher tolerance to salinity and drought compared to other major crops, S. vulgaris represents a promising candidate, as a “minor” vegetable cash crop, for sustainable “saline” and “arid” agriculture. The plant could be cultivated in marginal or salinized land with limited irrigation or using low-quality, saline water for irrigation: In this way, it would not compete with conventional crops for increasingly scarce resources such as fertile land and high-quality irrigation water.

Author Contributions

Conceptualization, A.K., A.W., E.H.-F., and M.B.; methodology, A.K., M.A.H., and W.H.; validation, A.W. and E.H.-F.; investigation, A.K., M.A.H., and M.B.; data curation, A.K.; writing—original draft preparation, A.K., A.W., and E.H.-F.; writing—review and editing, A.K., M.B., M.A.H., and O.V.; supervision, O.V.

Funding

This research was supported in part by the Ministry of Science and Higher Education of the Republic of Poland as DS 3500/ZBiFR-IBRiB-WBiO-UR and the Erasmus+ Program granted for Aleksandra Koźmińska to complete her doctoral studies.

Conflicts of Interest

The authors declare no conflicts of interest.

References

  1. Grime, J.P. Evidence for the existence of three primary strategies in plants and its relevance to ecological and evolutionary theory. Am. Nat. 1977, 111, 1169–1194. [Google Scholar] [CrossRef]
  2. Bartels, D.; Sunkar, R. Drought and salt tolerance in plants. Crit. Rev. Plant Sci. 2005, 24, 23–58. [Google Scholar] [CrossRef]
  3. Rengasamy, P. Soil processes affecting crop production in salt-affected soils. Funct. Plant Biol. 2010, 37, 613–620. [Google Scholar] [CrossRef]
  4. Rahman, M.M.; Hagare, D.; Maheshwari, B.; Dillon, P. Impact of prolonged drought on salt accumulation in the root zone due to recycled water irrigation. Water Air Soil Pollut. 2015, 226, 90. [Google Scholar] [CrossRef]
  5. Martínez-Fernández, J.; González-Zamora, A.; Sánchez, N.; Gumuzzio, A.; Herrero-Jimenéz, C.M. Satelite soil moisture for agricultural drought monitoring: Assessment of the SMOS derived Soil Water Deficit Index. Remote Sens. Environ. 2016, 177, 277–286. [Google Scholar] [CrossRef]
  6. Vicente, O.; Al Hassan, M.; Boscaiu, M. Contribution of osmolyte accumulation to abiotic stress tolerance in wild plants adapted to different stressful environments. In Osmolytes and Plants Acclimation to Changing Environment: Emerging Omics Technologies; Iqbal, N., Nazar, R., Khan, N.A., Eds.; Springer: New Delhi, India, 2016; pp. 13–25. [Google Scholar]
  7. Laiskhanov, S.U.; Otarov, A.; Savin, I.Y.; Tanirbergenoc, S.I.; Mamutov, Z.U.; Diusekov, S.N.; Zhogolev, A. Dynamics of soil salinity in irrigation areas in South Kazakstan. Pol. J. Environ. Stud. 2016, 25, 2469–2475. [Google Scholar] [CrossRef]
  8. López-Jurado, J.; Baolo, F.; Maetos-Naranjo, E. Deciphering the ecophysiological traits involved during water stress acclimation and recovery of the threatened wild carnation, Dianthus inoxianus. Plant Physiol. Biochem. 2006, 109, 397–405. [Google Scholar] [CrossRef]
  9. Lopez, R.R.; Winter, J.M.; Elliott, J.; Ruane, A.C.; Porter, Ch.; Hoogenboom, G. Integrating growth stage deficit irrigation into a process based crop model. Agric. For. Meteorol. 2017, 243, 84–92. [Google Scholar] [CrossRef]
  10. Yeah, C.-H.; Kaplinsky, N.J.; Hu, C.; Charng, Y.-Y. Some like it hot, some like it warm: Phenotyping to explore thermotolerance diversity. Plant Sci. 2012, 195, 10–23. [Google Scholar] [CrossRef] [Green Version]
  11. Zaher-Ara, T.; Boroomand, N.; Sadat-Hosseini, M. Physiological and morphological response to drought stress in seedlings of ten citrus. Trees 2016, 30, 985–993. [Google Scholar] [CrossRef]
  12. Nxele, X.; Klein, A.; Ndimba, B.K. Drought and salinity stress alters ROS accumulation, water retention, and osmolyte content in sorghum plants. S. Afr. J. Bot. 2017, 108, 261–266. [Google Scholar] [CrossRef]
  13. Ohama, N.; Sato, H.; Shinozaki, K.; Yamaguchi-Shinozaki, K. Transcriptional regulatory network of plant heat stress response. Trends Plant Sci. 2018, 22, 53–65. [Google Scholar] [CrossRef] [PubMed]
  14. Ashraf, M. Inducing drought tolerance in plants: Recent advances. Biotech. Adv. 2010, 28, 169–183. [Google Scholar] [CrossRef] [PubMed]
  15. Fita, A.; Rodríguez-Burruezo, A.; Boscaiu, M.; Prohens, J.; Vicente, O. Breeding and domesticating crops adapted to drought and salinity: A new paradigm for increasing food production. Front. Plant Sci. 2015, 6, 978. [Google Scholar] [CrossRef] [PubMed]
  16. Gorim, L.Y.; Vanderberg, A. Evaluation of wild lentil species as genetic resources to improve drought tolerance in cultivated lentil. Front. Plant Sci. 2017, 8, 1129. [Google Scholar] [CrossRef] [PubMed]
  17. Ariga, H.; Katori, T.; Yoshihara, R.; Hase, S.; Nozawa, S.; Narumi, I.; Iuchi, S.; Kobayashi, M.; Tezuka, K.; Hayashi, T.; et al. Arabidopsis sos1 mutant in a salt-tolerance accession revealed an importance of salt acclimation ability in plant salt tolerance. Plant Signal. Behav. 2013, 8, e24779. [Google Scholar] [CrossRef] [PubMed]
  18. Rejeb, K.B.; Lefebre-De Vos, D.; Le DIsquet, I.; Leprince, A.S.; Bordeneave, M.; Maldiney, R.; Jdey, A.; Abdelly, C.; Savouré, A. Hydrogen peroxide produced by NADPH oxidases increases proline accumulation during salt or mannitol stress in Arabidopsis thaliana. New Phytol. 2015, 208, 1138–1148. [Google Scholar] [CrossRef] [PubMed]
  19. Kumar, D.; Al Hassan, M.; Naranjo, M.; Agrawal, V.; Boscaiu, M.; Vicente, O. Effects of salinity and drought on growth, ionic relations, compatible solutes and activation of antioxidant system in oleander (Nerium oleander L.). PLoS ONE 2017, 12, e0185017. [Google Scholar] [CrossRef] [PubMed]
  20. Al Hassan, M.; Morosan, M.; López-Gresa, M.P.; Prohens, J.; Vicente, O.; Boscaiu, M. Salinity-induced variation in biochemical markers provides insight into the mechanisms of salt tolerance in common (Phaseolus vulgaris) and runner (P. coccineus) beans. Int. J. Mol. Sci. 2016, 17, 1582. [Google Scholar] [CrossRef] [PubMed]
  21. Alarcón, R.; Ortiz, L.T.; García, P. Nutrient and fatty acid composition of wild edible bladder campion populations [Silene vulgaris (Moench.) Garcke. Int. J. Food Sci. Technol. 2006, 41, 1239–1242. Available online: https://onlinelibrary.wiley.com/doi/abs/10.1111/j.1365-2621.2006.01187.x (accessed on 16 October 2006). [CrossRef]
  22. Ranfa, A.; Bodesmo, M. An Ethnobotanical investigation of traditional knowledge and uses of edible wild plants in the Umbria Region, Central Italy. J. Appl. Bot. Food Qual. 2017, 90, 246–258. [Google Scholar] [CrossRef]
  23. Kurt, B.Z.; Gazioğlu, I.; Sevgi, E.; Sönmez, F. Anticholinesterase, Antioxidant, Antiaflatoxigenic Activities of Ten Edible Wild Plants from Ordu Area, Turkey. Iran. J. Pharm. Res. 2018, 17, 1047–1056. [Google Scholar] [PubMed]
  24. Ceccanti, C.; Landi, M.; Benvenuti, S.; Pardossi, A.; Guidi, L. Mediterranean Wild Edible Plants: Weeds or “New Functional Crops”? Molecules 2018, 23, 2299. [Google Scholar] [CrossRef]
  25. Boari, F.; Cefola, M.; Di Gioia, F.; Pace, B.; Serio, F.; Cantore, V. Effect of cooking methods on antioxidant activity and nitratecontent of selected wild Mediterranean plants. Int. J. Food Sci. Nutr. 2013, 64, 870–876. [Google Scholar] [CrossRef] [PubMed]
  26. Disciglio, G.; Tarantino, A.; Frabboni, L.; Gagliardi, A.; Giuliani, M.M.; Tarantino, E.; Gatta, G. Qualitative characterization of cultivated and wild edible plants: Mineral elements, phenols content and antioxidant capacity. Ital. J. Agron. 2017, 12, 1036. [Google Scholar] [CrossRef]
  27. Friedrich, H.C. Caryophyllaceae. In Illustriete Flora von Mitteleuropa; Heigi, G., Ed.; Parey: Berlin, Germany, 1979; Volume 3. [Google Scholar]
  28. Bargish, T.A.; Rahmani, F. SRAP markers based genetic analysis of Silene species. J. Trop. Biol. Conserv. 2016, 13, 57–70. [Google Scholar] [CrossRef]
  29. Sebasky, M.E.; Keller, S.K.; Taylor, D.R. Investigating past range dynamics for a weed of cultivation, Silene vulgaris. Ecol. Evol. 2016, 6, 4800–4811. [Google Scholar] [CrossRef]
  30. Leuscher, C.; Ellenberg, H. Ecology of Central European Non-Forest Vegetation: Coastal to Alpine, Natural to Man-Made Habitats; Springer International Publishing: Cham, Swittzerland, 2018. [Google Scholar]
  31. Schiop, S.T.; Al Hassan, M.; Sestras, A.F.; Boscaiu, M.; Sestras, R.E.; Vicente, O. Identification of salt stress biomarkers in Romanian Carpathian populations of Picea abies (L.) Karst. PLoS ONE 2015, 10, e0135419. [Google Scholar] [CrossRef]
  32. Bratteler, M.; Lexter, C.; Widmer, A. Genetic architecture of traits associated with serpentine adaptation in Silene vulgaris (Caryophyllaceae). J. Evol. Biol. 2006, 19, 1149–1156. [Google Scholar] [CrossRef]
  33. Sandner, T.M.; Matthies, D. Fluctuating asymmetry of leaves is a poor indicator of environmental stress and genetic stress by inbreding Silene vulgaris. Ecol. Indic. 2017, 79, 247–253. [Google Scholar] [CrossRef]
  34. Wierzbicka, M.; Panufnik, D. The adaptation of Silene vulgaris to the growth on a calamine waste heap (S. Poland). Environ. Pollut. 1998, 101, 415–426. [Google Scholar] [CrossRef]
  35. Ciarkowska, K.; Hanus-Fajerska, E. Remediation of soil-free grounds contaminated by zinc, lead and cadmium with the use of metallophytes. Pol. J. Environ. Stud. 2008, 17, 707–712. [Google Scholar]
  36. Nadgórska-Socha, A.; Kandziora-Ciupa, M.; Ciepał, R.; Walasek, K. Effects of Zn, Cd, Pb on physiological response of Silene vulgaris plants from selected populations. Pol. J. Environ. Stud. 2011, 20, 599–604. [Google Scholar]
  37. Verkleji, J.A.C.; Prast, J.E. Cadmium tolerance and co-tolerance in Silene vulgaris (Moench) Gracke. New. Phytol. 1989, 111, 637–645. [Google Scholar] [CrossRef]
  38. Hanus-Fajerska, E.; Czura, A.; Grabski, K.; Tukaj, Z. The effect of conditioned medium obtained from Scenedesmus subspicatus on suspension culture of Silene vulgaris. Acta Physiol. Plant. 2009, 31, 881–887. [Google Scholar] [CrossRef]
  39. Ernst, W.H.O.; Nelissen, H.J.M. Life-cycle phases of a zinc- and cadmium resistant ecotype of Silene vulgaris in risk assessment of polymetallic mine soils. Environ. Pollut. 2000, 107, 329–338. [Google Scholar] [CrossRef]
  40. Nadgórska-Socha, A.; Ciepał, R. Phytoextraction of zinc, lead and cadmium with Silene vulgaris (Moench) Gracke in the post industrial area. Ecol. Chem. Eng. 2009, 16, 831–837. [Google Scholar]
  41. Baloun, J.; Nevrtalova, E.; Kovacova, V.; Hudzieczek, V.; Cegan, R.; Vyskot, B.; Hobza, R. Characterization of the HMA7 gene and transcriptomic analysis of candidate genes for copper tolerance in two Silene vulgaris ecotypes. J. Plant Physiol. 2014, 171, 1188–1196. [Google Scholar] [CrossRef]
  42. Pradas del Real, A.E.; García-Gonzalo, P.; Alarcón, R.; González-Rodrígez, A.; Lobo, M.C.; Pèrez-Sanz, A. Effect of genotype, Cr (III) and Cr(VI) on plant growth and micronutrient status in Silene vulgaris Moench). Span. J. Agric. Res. 2013, 11, 685–694. [Google Scholar] [CrossRef]
  43. Pradas del Real, A.E.; García-Gonzalo, P.; Lobo, M.C.; Pèrez-Sanz, A. Chromium speciation modifies root exudation in two genotypes of Silene vulgaris. Environ. Exp. Bot. 2014, 107, 1–6. [Google Scholar] [CrossRef]
  44. García-Gonzalo, P.; Pradas del Real, A.E.; Lobo, M.C.; Pèrez-Sanz, A. Different genotypes of Silene vulgaris (Moench) Garcke grown on chromium-contaminated soils influence root organic acid composition and rhizosphere bacterial communities. Environ. Sci. Pollut. Res. 2017, 24, 25713–25724. [Google Scholar] [CrossRef]
  45. Baker, A.J.M.; Brooks, R.R.; Pease, A.J.; Malaisse, F. Studies on copper and cobalt tolerance in three closely related taxa within genus Silene L. (Carypyhyllaceae). Plant Soil. 1983, 73, 377–385. [Google Scholar] [CrossRef]
  46. Gonelli, C.; Galardi, F.; Gabbrielli, R. Nickel and copper tolerance and toxicity in three Tuscan populations of Silene paradoxa. Physiol. Plant. 2001, 113, 507–514. [Google Scholar] [CrossRef]
  47. Paliouris, G.; Hutchinson, T.C. Arsenic, cobalt and nickel tolerances in two populations of Silene vulgaris (Moench) Gracke from Ontario, Canada. New Phytol. 1991, 117, 449–459. [Google Scholar] [CrossRef]
  48. Krämerm, U. Conceptualizing plant systems evolution. Curr. Opin. Plant Biol. 2018, 42, 66–75. [Google Scholar] [CrossRef]
  49. Koźmińska, A.; Al Hassan, M.; Hanus-Fajerska, E.; Naranjo, M.A.; Boscaiu, M.; Vicente, O. Comparative analysis of water deficit and salt tolerance mechanisms in Silene. S. Afr. J. Bot. 2018, 117, 193–206. [Google Scholar] [CrossRef]
  50. Hoagland, D.R.; Arnon, D.I. The water culture method for growing plants without soil. Calif. Agric. Exp. Stn. Circ. 1950, 347, 1–32. [Google Scholar]
  51. Weimberg, R. Solute adjustments in leaves of two species of wheat at two different stages of growth in response to salinity. Physiol. Plant. 1987, 70, 381–388. [Google Scholar] [CrossRef]
  52. Lichtenthaler, H.K.; Wellburn, A.R. Determinations of total carotenoids and chlorophylls a and b of leaf extracts in different solvents. Biochem. Soc. Trans. 1983, 11, 591–592. [Google Scholar] [CrossRef]
  53. Hodges, D.M.; DeLong, J.M.; Forney, C.F.; Prange, R.K. Improving the thiobarbituric acid-reactive-substances assay for estimating lipid peroxidation in plant tissues containing anthocyanin and other interfering compounds. Planta 1999, 207, 604–611. [Google Scholar] [CrossRef]
  54. Gil, R.; Bautista, I.; Boscaiu, M.; Lidón, A.; Wankhade, S.; Saánchez, H.; Llinares, J.; Vicente, O. Responses of five Mediterranean halophytes to seasonal changes in environmental conditions. AoB Plants 2014, 6. [Google Scholar] [CrossRef] [PubMed]
  55. Blainski, A.; Lopes, G.C.; Palazzo de Mello, J.C. Application and analysis of the Folin Ciocalteu method for the determination of the total phenolic content from Limonium brasiliense L. Molecules 2013, 18, 6852–6865. [Google Scholar] [CrossRef] [PubMed]
  56. Zhishen, J.; Mengcheng, T.; Jianming, W. The determination of flavonoid contents in mulberry and their scavenging effects on superoxide radicals. Food Chem. 1999, 64, 555–559. [Google Scholar] [CrossRef]
  57. Bates, L.S.; Waldren, R.P.; Teare, I.D. Rapid determination of free proline for water stress studies. Plant Soil. 1973, 39, 205–207. [Google Scholar] [CrossRef]
  58. Dubois, M.; Gilles, K.A.; Hamilton, J.K.; Reberd, P.A.; Smith, F. Colorimetric method for determination of sugars and related substances. Anal. Chem. 1956, 28, 350–356. [Google Scholar] [CrossRef]
  59. Flowers, T.J.; Colmer, T.D. Salinity tolerance in halophytes. New Phytol. 2008, 179, 945–963. [Google Scholar] [CrossRef] [PubMed]
  60. Gupta, B.; Huang, B. Mechanism of Salinity Tolerance in Plants: Physiological, Biochemical, and Molecular Characterization. Int. J. Genom. 2014, 2014, 701596. [Google Scholar] [CrossRef]
  61. Nardini, A.; Lo Gullo, M.A.; Trifilò, P.; Salleo, S. The challenge of the Mediterranean climate to plant hydraulics: Responses and adaptations. Environ. Exp. Bot. 2014, 103, 68–79. [Google Scholar] [CrossRef]
  62. Siddiqui, M.H.; Al-Khaishany, M.Y.; Al-Qutami, M.A.; Al-Whaibi, M.H.; Grover, A.; Ali, H.M.; Stace, C.A. Plant Taxonomy and Biosystematics; PWN: Warszawa, Poland, 1993; p. 340. [Google Scholar]
  63. Yang, L.; Fountain, J.C.; Wang, H.; Ni, X.; Ji, P.; Lee, R.D.; Kemerait, R.C.; Scully, B.T.; Guo, B. Stress sensitivity is associated with differential accumulation of reactive oxygen and nitrogen species in maize genotypes with contrasting levels of drought tolerance. Int. J. Mol. Sci. 2015, 16, 24791–24819. [Google Scholar] [CrossRef]
  64. Ouyang, B.; Yang, T.; Li, H.X.; Zhang, L.; Zhang, Y.; Zhang, J.; Fei, Z.; Ye, Z. Identification of early salt stress response genes in tomato root by suppression subtractive hybridization and microarray analysis. J. Exp. Bot. 2007, 58, 507–520. [Google Scholar] [CrossRef] [Green Version]
  65. Beritognolo, I.; Harfouche, A.; Brilli, F.; Prosperini, G.; Gaudet, M.; Brosche, M.; Salani, F.; Kuzminsky, E.; Auvinen, P.; Paulin, L.; et al. Comparative study of transcriptional and physiological responses to salinity stress in two contrasting Populus alba L. genotypes. Tree Physiol. 2011, 31, 1335–1355. [Google Scholar] [CrossRef] [PubMed]
  66. Ma, H.; Song, L.; Shu, Y.; Wang, S.; Wang, Z.; Yu, T.; Gu, W.; Ma, H. Comparative proteomic analysis of seedling leaves of different salt tolerant soybean genotypes. J. Proteom. 2012, 75, 1529–1546. [Google Scholar] [CrossRef] [PubMed]
  67. Cui, D.; Wu, D.; Liu, J.; Li, D.; Xu, C.; Li, S.; Li, P.; Zhang, H.; Liu, X.; Jiang, C.; et al. Proteomic analysis of seedling roots of two maize inbred lines that differ significantly in the salt stress response. PLoS ONE 2015, 10, e0116697. [Google Scholar] [CrossRef]
  68. Widodo, W.; Patterson, J.H.; Newbigin, E.; Tester, M.; Bacic, A.; Roessner, U. Metabolic responses to salt stress of barley (Hordeum vulgare L.) cultivars, Sahara and Clipper, which differ in salinity tolerance. J. Exp. Bot. 2009, 60, 4089–4103. [Google Scholar] [CrossRef] [PubMed]
  69. Zhao, X.Q.; Wang, W.S.; Zhang, F.; Deng, J.L.; Li, Z.K.; Fu, B.Y. Comparative metabolite profiling of two rice genotypes with contrasting salt stress tolerance at the seedling stage. PLoS ONE 2014, 9, e108020. [Google Scholar] [CrossRef]
  70. Zhu, J.K. Plant salt tolerance. Trends Plant Sci. 2001, 6, 66–71. [Google Scholar] [CrossRef]
  71. Grossi, D.; Rustioni, L.; Di Lorenzo, G.S.; Failla, O.; Brancadoro, L. Water deficit effects on grapevine woody tissue pigmentations. Hort. Sci. Prague 2016, 43, 188–194. [Google Scholar] [CrossRef] [Green Version]
  72. Rajakaruna, N. Lessons on evolution from the study of edaphic specialization. Bot. Rev. 2018, 84, 39–78. [Google Scholar] [CrossRef]
  73. Vasseur, F.; Bresson, J.; Wang, G.; Schwab, R.; Weigl, D. Image-based method for phenotyping growth dynamics and fitness components in Arabidopsis thaliana. Plant Methods 2018, 14, 63. [Google Scholar] [CrossRef]
  74. Andarde, E.R.; Ribeiro, V.N.; Azvedo, C.V.G.; Chiorato, A.F.; Williams, T.C.R.; Carbonell, S.A.M. Biochemical indicators of drought tolerance in the common bean (Phaseolus vulgaris L.). Euphytica 2016, 210, 277–289. [Google Scholar] [CrossRef]
  75. Baha, H.; Tekaya, M.; Drine, S.; Gusami, F.; Touil, L.; Enneb, H.; Triki, T.; Cheour, F.; Ferchichi, A. Impact of salt stress on morpho-physiological and biochemical parameters of Solanum lycopersicum cv. Microtom leaves. S. Afr. J. Bot. 2017, 108, 364–369. [Google Scholar] [CrossRef]
  76. Sen, A.; Ozturk, I.; Yaycili, O.; Alikamanoglu, S. Drought tolerance in irradiated wheat studied by genetic and biochemical markers. J. Plant Growth Regul. 2017, 36, 669–676. [Google Scholar] [CrossRef]
  77. Horie, T.; Karahara, I.; Katsuhara, M. Salinity tolerance mechanisms in glycophytes: An overview with the central focus on rice plants. Rice 2012, 5, 11. Available online: http://www.thericejournal.com/content/5/1/11 (accessed on 22 June 2012). [CrossRef] [Green Version]
  78. Baetz, U.; Eisenach, C.; Tohge, T.; Martinoia, E.; De Angeli, A. Vacuolar Chloride Fluxes Impact Ion Content and Distribution during Early Salinity Stress. Plant Physiol. 2016, 172, 1167–1181. [Google Scholar] [CrossRef] [PubMed]
  79. Assaha, D.V.M.; Ueda, A.; Saneoka, H.; Al-Yahai, R.; Yaish, M.W. The role of Na+ and K+ transporters in salt stress adaptations in glycophytes. Front. Physiol. 2017, 8, 509. [Google Scholar] [CrossRef] [PubMed]
  80. Wu, H. Plants salt tolerance and Na+ sensing and transport. Crop J. 2018, 6, 215–225. [Google Scholar] [CrossRef]
  81. Plett, D.C.; Møller, I.S. Na (+) transport in glycophytic plants: What we know and would like to know. Plant Cell Environ. 2010, 33, 612–626. [Google Scholar] [CrossRef]
  82. Flowers, T.J.; Troke, P.F.; Yeo, A.R. The mechanism of salt tolerance in halophytes. Annu. Rev. Plant Biol. 1977, 28, 89–121. [Google Scholar] [CrossRef]
  83. Wyn Jones, R.; Storey, R.; Leigh, R.A.; Ahmad, N.; Pollard, A. A hypothesis on cytoplasmic osmoregulation. In Regulation of Cell Membrane Activities in Plants; Marre, E., Ciferri, O., Eds.; Elsevier: Amsterdam, The Netherlands, 1977; pp. 121–136. [Google Scholar]
  84. Genc, Y.; Oldach, K.; Taylor, J.; Lyons, G.H. Uncoupling of sodium and chloride to assist breeding for salinity tolerance in crops. New Phytol. 2016, 210, 145–156. [Google Scholar] [CrossRef]
  85. Greenway, H.; Munns, R. Mechanisms of salt tolerance in non-halophytes. Ann Rev. Plant Physiol. 1980, 31, 149–190. [Google Scholar] [CrossRef]
  86. Hänsch, R.; Mendel, R. Physiological functions of mineral micronutrients (Cu, Zn, Mn, Fe, Ni, Mo, B, Cl). Curr. Opin. Plant Biol. 2009, 12, 259–266. [Google Scholar] [CrossRef] [PubMed]
  87. Maathuis, F.J.M. Physiological functions of mineral macronutrients. Curr. Opin. Plant Biol. 2009, 12, 250–258. [Google Scholar] [CrossRef] [PubMed]
  88. Moinuddin; Imas, P. Potassium uptake in relation to drought tolerance of chickpea under rain-fed conditions. J. Plant Nutr. 2004, 37, 1120–1138. [Google Scholar] [CrossRef]
  89. Zhang, X.; Wu, H.; Chen, L.; Liu, L.; Wan, X. Maintenance of mesophyll potassium and regulation of plasma membrane H+-ATPase are associated with physiological responses of tea plants to drought and subsequent rehydration. Crop J. 2018, 6, 611–620. [Google Scholar] [CrossRef]
  90. Wang, M.; Zheng, Q.; Shen, Q.; Guo, S. The critical role of potassium in plant stress response. Int. J. Mol. Sci. 2013, 14, 7370–7390. [Google Scholar] [CrossRef] [PubMed]
  91. Cicevan, R.; Al Hassan, M.; Sestras, A.F.; Boscaiu, M.; Zaharia, A.; Vicente, O.; Sestras, R. Comparative analysis of osmotic and ionic stress effects on seed germination in Tagetes (Asteraceae) cultivars. Prop. Ornam. Plants 2015, 15, 63–72. [Google Scholar]
  92. Al Hassan, M.; Chaura, J.; Donat-Torres, M.P.; Boscaiu, M.; Vicente, O. Antioxidant responses under salinity and drought in three closely related wild monocots with different ecological optima. AoB Plants 2017, 9. [Google Scholar] [CrossRef] [PubMed]
  93. Koźmińska, A.; Al Hassan, M.; Wiszniewska, A.; Hanus-Fajerska, E.; Boscaiu, M.; Vincente, O. Responses of succulents to drought: Comparative analysis of four Sedum (Crassulaceae) species. Sci. Hort. 2019, 243, 235–242. [Google Scholar] [CrossRef]
  94. Nikolaeva, M.K.; Maevskaya, S.N.; Shugaev, A.G.; Bukhov, N.G. Effect of drought on chlorophyll content and antioxidant enzyme activities in leaves of three wheat cultivars varying in productivity. Russ. J. Plant Physiol. 2010, 57, 87–95. [Google Scholar] [CrossRef]
  95. Del Rio, D.; Stewart, A.J.; Pellegrini, N. A review of recent studies on malondialdehyde as toxic molecule and biological marker of oxidative stress. Nutr. Metab. Cardiovasc. Dis. 2005, 15, 316–328. [Google Scholar] [CrossRef]
  96. Ozgur, M.; Oscan, T.; Akpinar-Bayizit, A.; Yilmaz-Ersan, L. Functional compounds and antioxidant properties of dried green and red peppers. Afr. J. Agric. Res. 2011, 6, 5638–5644. [Google Scholar] [CrossRef]
  97. Cheynier, V.; Comte, G.; Davies, K.M.; Lattanzio, V.; Martens, S. Plant phenolics: Recent advances on their biosynthesis, genetics, and ecophysiology. Plant Physiol. Biochem. 2013, 72, 1–20. [Google Scholar] [CrossRef] [PubMed]
  98. Di Ferdinando, M.; Brunetti, C.; Agati, G.; Tattini, M. Multiple functions of polyphenols in plants inhabiting unfavourable Mediterranean areas. Environ. Exp. Bot. 2014, 103, 107–116. [Google Scholar] [CrossRef]
  99. Bautista, I.; Boscaiu, M.; Lidón, A.; Llinares, J.V.; Lull, C.; Donat, M.P.; Mayoral, O.; Vicente, O. Environmentally induced changes in antioxidant phenolic compounds levels in wild plants. Acta Physiol. Plant. 2016, 38, 9. [Google Scholar] [CrossRef]
  100. Chandna, R.; Azooz, M.M.; Ahmad, P. Recent advances of metabolomics to reveal plant response during salt stress. In Salt Stress in Plants. Signalling, Omics and Adaptations; Ahmad, P., Azooz, M.M., Prasad, M.N.V., Eds.; Springer: New York, NY, USA; Heidelberg, Germany; Dordrecht, The Netherlands; London, UK, 2013; pp. 1–14. [Google Scholar]
  101. Falcinelli, B.; Sileoni, V.; Marconi, O.; Perretti, G.; Quinet, M.; Lutts, S.; Benincasa, P. Germination under Moderate Salinity Increases Phenolic Content and Antioxidant Activity in Rapeseed (Brassica napus var oleifera Del.) Sprouts. Molecules 2017, 22, 1377. [Google Scholar] [CrossRef] [PubMed]
  102. Munns, R.; Tester, M.R. Mechanisms of salinity tolerance. Annu. Rev. Plant Biol. 2008, 59, 651–681. [Google Scholar] [CrossRef] [PubMed]
  103. Hasegawa, P.M.; Bressan, A.; Zhy, J.K.; Bohnert, H.J. Plant cellular and molecular responses to high salinity. Ann. Rev. Plant Phys. Plant Mol. Biol. 2000, 51, 463–499. [Google Scholar] [CrossRef]
  104. Chaves, M.M.; Flexas, J.; Pinheiro, C. Photosynthesis under drought and salt stress: Regulation mechanisms from whole plant to cell. AoB Plants 2009, 103, 551–560. [Google Scholar] [CrossRef]
  105. Rabbani, G.; Choi, I. Roles of osmolytes in protein folding and aggregation in cells and their biotechnological applications. Int. J. Biol. Macromol. 2018, 109, 483–491. [Google Scholar] [CrossRef]
  106. Ruiz-Lozano, J.M. Arbuscular mycorrhizal symbiosis and alleviation of osmotic stress. New perspectives for molecular studies. Mycorrhiza 2013, 13, 309–317. [Google Scholar] [CrossRef]
  107. Ashraf, M.; Foolad, M.R. Roles of glycine betaine and proline in improving plant abiotic stress resistance. Environ. Exp. Bot. 2007, 59, 206–216. [Google Scholar] [CrossRef]
  108. Cvikrová, M.; Gemperlová, L.; Martincová, O.; Vanková, R. Effect of drought and combined drought and heat stress on polyamine metabolism in proline-over-producing tobacco plants. Plant Physiol. Biochem. 2013, 73, 7–15. [Google Scholar] [CrossRef]
  109. Per, T.S.; Khan, N.A.; Reddy, P.S.; Masood, A.; Hasanuzzaman, M.; Khan, M.I.R.; Anjum, N.A. Approaches in modulating proline metabolism in plants for salt and drought stress tolerance: Phytohormones, mineral nutrients and transgenics. Plant Physiol. Biochem. 2017, 115, 126–140. [Google Scholar] [CrossRef] [PubMed]
  110. Vera Hernandez, F.P.; Ortega-Ramirez, M.A.; Martinez Nunez, M.; Ruiz-Rivas, M.; Rosas Cardenas, F. Proline as a probable biomarker of cold stress tolerance in sorgum (Sorghum bicolor). Mex. J. Biotechnol. 2018, 3, 77–86. [Google Scholar] [CrossRef]
  111. Al Hassan, M.; Pacurar, A.; López-Gres, M.P.; Donat-Torres, M.P.; Llinares, J.V.; Boscaiu, M.; Vicente, O. Effects of salt stress on three ecologically distinct Plantago species. PLoS ONE 2016, 11, e0160236. [Google Scholar] [CrossRef] [PubMed]
  112. Salehi, A.; Tasdighi, A.; Gholamhoseini, M. Evaluation of proline, chlorophyll, soluble sugar content and uptake of nutrients in the German chamomile (Matricaria chamomilla L.) under drought stress and organic fertilizer treatments. Asian Pac. J. Trop. Biomed. 2016, 6, 886–891. [Google Scholar] [CrossRef]
  113. Karimi, M.; Ahmadi, A.; Hashemi, J.; Abbasi, A.; Tavarini, S.; Guglielminetti, L.; Angelini, L.G. The effect of soil moisture depletion on Stevia (Stevia rebaudiana Bertoni) grown in greenhouse conditions: Growth, steviol glycosides content, soluble sugars and total antioxidant capacity. Sci. Hortic. 2015, 183, 93–99. [Google Scholar] [CrossRef]
Figure 1. (A) Stem length elongation (%), (B) leaf fresh weight (FW) (%), and (C) leaf water content percentage (WC%), in the four Silene vulgaris populations, after (1) five weeks of salt treatments with the indicated NaCl concentrations and (2) five weeks of drought treatment (mean ± SD, n = 6). For each population, different lowercase letters indicate significant differences between treatments, and different capital letters indicate significant differences between populations undergoing the same treatment, according to Tukey’s test (α = 0.05).
Sustainability 11 00800 g001
Figure 2. Leaf concentration of (A) sodium (Na+), (B) chloride (Cl), (C) potassium (K+), and (D) K+/Na+ ratios in the four S. vulgaris populations after (1) five weeks of salt treatments with the indicated NaCl concentrations and (2) five weeks of drought treatment (mean ± SD, n = 6). For each population, different lowercase letters indicate significant differences between treatments, and different capital letters indicate significant differences between populations undergoing the same treatment, according to Tukey’s test (α = 0.05).
Sustainability 11 00800 g002
Figure 3. Leaf concentrations of (A) chlorophyll a, (B) chlorophyll b, and (C) total carotenoids in the four S. vulgaris populations after (1) five weeks of salt treatments with the indicated NaCl concentrations and (2) five weeks of drought treatment (mean ± SD, n = 6). For each population, different lowercase letters indicate significant differences between treatments, and different capital letters indicate significant differences between populations undergoing the same treatment, according to Tukey’s test (α = 0.05).
Sustainability 11 00800 g003
Figure 4. Leaf concentration of (A) malondialdehyde (MDA), (B) total phenolic compounds (TPCs), and (C) total flavonoids (TFs) in the four S. vulgaris populations after (1) five weeks of salt treatments with the indicated NaCl concentrations and (2) five weeks of drought treatment (mean ± SD, n = 6). For each population, different lowercase letters indicate significant differences between treatments, and different capital letters indicate significant differences between populations undergoing the same treatment, according to Tukey’s test (α = 0.05).
Sustainability 11 00800 g004
Figure 5. Leaf concentration of (A) proline (Pro) and (B) total soluble sugars (TSSes) in the four S. vulgaris populations after (1) five weeks of salt treatments with the indicated NaCl concentrations and (2) five weeks of drought treatment (mean ± SD, n = 6). For each population, different lowercase letters indicate significant differences between treatments, and different capital letters indicate significant differences between populations undergoing the same treatment, according to Tukey’s test (α = 0.05).
Sustainability 11 00800 g005
Figure 6. Canonical variate analysis (CVA) charts showed a clear separation of studied data: (A) salinity and (B) drought. Blue squares represent population 1. Purple-filled squares describe population 2. Circles exhibit population 3. Green diamonds depict population 4.
Sustainability 11 00800 g006
Figure 7. Principal component analysis (PCA) (A) for salt stress and (B) for drought demonstrated that populations had an immediate correlation with biochemical stress markers. (A) Na, TSS, proline, and Cl were favorably linked for populations subjected to salt stress. K/Na, TF, and K revealed refusal relations. (B) MDA and K/Na were strongly related to populations exposed to water stress.
Sustainability 11 00800 g007
Table 1. Average meteorological data of the habitats of the studied populations.
Population CodeOriginLatitudeLongitudeAltitude (m a.s.l.)Annual Rainfall (mm)Mean Annual Day Temperature (°C)
1 Mog.Mogente stand (SE Spain)N38°52′W0°48′68051614.6
2 Ref. ESValencia—reference stand (SE Spain)N39°28′W0°23′1346817.4
3 Serp.Serpentine stand (SW Poland)N50°84′E16°48′21646115.4
4 Ref. PLPoznań—reference stand (SW Poland)N52°41′E16°93′6951115.7
Note: [Worldwide Bioclimatic Classification System, 1996–2018, S. Rivas-Martinez & S. Rivas-Saenz, Phytosociological Research Center, Spain; http://www.globalbioclimatics.org; http://www.meteoblue.com./pl/pogoda/prognoza/modelclimate].
Table 2. Coefficients of determination (R2), established by multiple regression between the measured biochemical parameters in all studied populations at the end of the (a) salt treatments and (b) water stress treatment.
(a) Salt Treatments
(a) Salt Treatments
R2
Populations
Biomarker1 (Mog.)2 (Ref. ES)3 (Serp.)4 (Ref. PL)p-Value
FW%0.310.490.450.530.12
SL (%)0.290.670.760.360.12
Na+0.340.920.870.750.15
Cl0.290.670.180.890.30
K+0.210.870.840.570.13
K+/Na+0.310.620.140.810.29
Chl. a0.130.570.170.750.13
Chl. b0.180.620.380.580.11
Caro.0.630.780.650.760.17
MDA0.240.790.190.340.16
TPC0.160.540.870.470.49
TF0.150.250.150.280.33
Pro0.330.620.840.370.35
TSS0.340.460.670.460.37
(b) Water Stress Treatment
R2
Populations
Biomarker1 (Mog.)2 (Ref. ES)3 (Serp.)4 (Ref. PL)p-Value
FW%0.520.380.580.420.35
SL (%)0.410.510.120.720.21
Na+0.450.460.230.940.71
Cl0.420.130.630.840.13
K+0.420.180.740.790.52
K+/Na+0.210.110.780.910.17
Chl. a0.330.650.760.560.3
Chl. b0.230.290.450.690.78
Caro.0.320.550.170.720.73
MDA0.210.280.330.590.93
TPC0.210.430.320.660.15
TF0.430.860.630.740.94
Pro0.290.150.830.590.54
TSS0.310.570.780.560.84

