Abstract
Rapid expansion in Mongolia has resulted in an inequality in livelihood, growing air pollution, and unevenly distributed social goods, which implies that the urbanization of Mongolia is experiencing a chronic imbalance. Using 21 Aimags and 1 capital in Mongolia as the research object, this paper provides a detailed assessment of the coupling coordination degree (CCD) to analyze the coupling and coordination relationship between urbanization and urban residents’ livelihood level. The results suggest that there is a serious imbalance in the coordination of urban development and urban residents’ livelihood among the Aimags of Mongolia. The high CCD values were mainly concentrated in the central regions of Mongolia, while the low values were clustered in the western and eastern areas. The spatial Durbin model was employed to analyze the driving forces of the CCD, and the results imply that the secondary industry share and the number of registered enterprises play significant roles in promoting coordination between urbanization and urban residents’ livelihood level. Here, we present an overview of how our analysis can provide useful insights for policymakers and decision makers.
1. Introduction
Urbanization concerns not only the construction of modern architecture, the concentration of populations, the expansion of urban land, and the increase in regional economies [1,2], but also the popularization of urban lifestyles and the generalization of relevant values [3,4]. Unprecedented global urban growth has changed human life and the world. According to the 2030 Sustainable Development Goals of the United Nations, in the next several decades, almost 60% of the world’s population will live in urban areas, and 95% of urban expansion will occur in the developing world [5]. Clearly, urbanization processes are extremely swift, especially in emerging countries [6,7]. Between 1990 and 2016, Mongolia’s urbanization ratio—the proportion of the urban population relative to the total population—increased from 52% [8] to 67.8% [9]. Mongolia’s government has exerted more effort (e.g., it implemented the “Law on Allocation of Land to Mongolian Citizens for Ownership” [10] and encouraged its citizens to migrate freely [11]) to improve its urbanization [12].
The goals of sustainable development are to end poverty, promote economic equality and sustainable consumption, ameliorate environmental problems, and allow people to experience justice and prosperity, etc. [5]. Accordingly, sustainable urban development emphasizes the welfare improvement of urban residents, the efficient development of the urban economy, the effective improvement of resource utilization, the effective amelioration of environmental issues, and the powerful promotion of social equity and justice [13]. Thus, one important goal of sustainable urban development is to improve the livelihood of urban residents, for instance, by improving the level of income, material goods, psychological and spiritual satisfaction, and necessities that are available to people [14]. However, the urbanization of Mongolia has not necessarily created improvement in the livelihood of urban residents. Along with ongoing urban expansion, non-negligible issues have constantly emerged in Mongolia, and a critical issue is the inequality in livelihood between urban citizens and rural migrants, who count as urban residents [7,15]. Currently, more than two million people live in cities: However, 60% of them live in ger areas (ger areas are peri-urban areas in Mongolia that mainly consist of Mongolian yurts and wood-fenced yards [12]), which suffer from limited infrastructure in terms of hygiene, traffic, and safety [15]. Therefore, the issue of the livelihood of the population that moves to cities, especially herdsman workers, is the epitome of the most typical sociological problems that the Mongolian government must face [12]. Although the government and international organizations (e.g., the Japan International Cooperation Agency (JICA) and the World Bank) have taken action, such as by extending the efficient period of land privatization [10] and revising the current urban plan [7,16] to control urban expansion and improve the livelihood of ger areas, the plans have only been presented on paper [17], and the goal of a modern and functioning life still has not been attained by some Mongolians [18].
The coordination between urbanization and urban residents’ livelihood level is the basis for sustainable urban development [19]. However, as one of the largest inland countries in the world, Mongolia is characterized by a chronic imbalance of urbanization. The problems of inequality in livelihood between urban citizens and rural migrants and growing air pollution epidemics have been put on the agenda in large cities such as Ulaanbaatar [20,21,22], while other regions exhibit low employment rates and low wages and salaries [12], poor living conditions, and limited and unevenly distributed social goods [23]. This is mainly due to a lack of coordination between urbanization and residents’ livelihood level. Previous studies have addressed Mongolia’s urban development based on Landsat, MODIS(Moderate Resolution Imaging Spectroradiometer), and other spatial analysis methods, but most of them have focused on urban expansion [7,24,25] and environmental changes [20,21,26]: Only a few studies have incorporated urban residents’ livelihood. Although some studies have shown that the excessive expansion of urban areas brings dramatic and critical changes to residents in terms of unfairness, environmental pollution, and congestion [20,22,26,27], the lack of coordination between urbanization and the livelihood level of urban residents in Mongolia has received relatively limited scholarly attention.
Coupling is a concept of physics, and it refers to the phenomenon in which two or more systems affect one another through various interactions [28]. Coupling between systems is either benign or unbenign [29], and coupling coordination can be seen as the coupling and coordination relationship between systems, which reflects whether the relationship is a benign interaction and optimizes circulation [30]. The coupling coordination degree (CCD) is a measure of the coupling coordination relationship between systems. The CCD is now widely used in studies of the relationship between urbanization and residents’ livelihood level [19,31,32,33]. By taking 284 cities in China as research objects, Zhang, et al. [19] analyzed the spatial-temporal evolution of the CCD between urbanization and residents’ livelihood and found that the spatial distribution of the CCD in China was not balanced, and high coordination areas were mainly distributed in the major cities. Additionally, they found that the industrial level, economic development level, and informatization level were important factors affecting CCD. Using the data of 150 counties in the Beijing, Tianjin and Hebei region from 2000–2012, He and Shao [32] found a lack of coordination between urbanization and residents’ livelihood level, and they emphasized that rapid urban expansion should be strictly controlled and residents’ livelihood level should be improved. Guo et al. [33] took Shandong Peninsula as a study area and analyzed coordination between urban expansion and residents’ livelihood level. They found that the rate of urban expansion was much higher than the increase in the residents’ livelihood level, and they suggested that in the process of urban development, it is necessary to strengthen infrastructure construction, optimize industrial structures, increase investment in science and technology, and continuously improve the livelihood level of residents. Despite the plethora of literature on the CCD between urbanization and the livelihood level of urban residents, it is mostly China that has been studied.
However, as mentioned above, Mongolia’s urbanization issue is complicated, and the extent to which the results of the practice and research in larger nations can be effectively applied to Mongolia is unclear. Therefore, a targeted theoretical exploration and empirical data analysis are meaningful for related practices, and analysis is badly needed for an overall evaluation of the CCD between urbanization and urban residents’ livelihood level in Mongolia. That said, how do we estimate the CCD? What is the spatiotemporal evolution feature of the CCD? What factors drive the CCD between urbanization and residents’ livelihood level? Based on these research questions, this paper used statistical data in the five periods of 2004, 2007, 2010, 2013, and 2016 and took 22 regions of Mongolia as its research object to measure the CCD between urbanization and residents’ livelihood level. With the help of the K-means clustering method and the spatial Durbin model (SDM), this study explored both the spatial patterns and the driving factors of the CCD.
The rest of this paper is organized as follows. A brief introduction of the study area is presented in Section 2. An explanation of the data sources and an interpretation of the study methods are presented in Section 3. In Section 4, the clustering analysis is laid out to analyze the spatial distribution of the CCD, and the SDM is used to investigate the driving forces of the CCD. The discussion of our results is presented in Section 5, after which Section 6 concludes the paper by summarizing the main findings and providing useful insights for policymakers.
2. Study Area
Our study area, Mongolia, covers an area of 1,564,116 km2 and is the 19th largest country in the world [27]. Mongolia contains 21 Aimags, which are provinces of Mongolia, and its capital is Ulaanbaatar (Figure 1). Urbanization in Mongolia is highly associated with massive rural migration and the rapid expansion of urban areas [20]. Since 1990, most rural migrants have poured into cities to seek their fortune [27,34,35]. In 2004, the number of net migrants (the net migration population of year i equals the number of newly arrived urban residents in year i subtracted from the natural increase in population in year i) was less than 10,000, increasing to more than 40,000 in 2010. Since then, the growth rate has dropped slightly, but in 2015, the number of net migrants still reached approximately 18,000, according to Mongolian Statistical Yearbooks. Meanwhile, Mongolia’s urbanization ratio increased from 59.1% in 2004 [36] to 67.8% in 2016 [9]. During the same period, the urban area grew by 106% in Ulaanbaatar, by 81% in Erdenet, and by 63% in Darkhan [21]: These are the three largest cities in Mongolia.
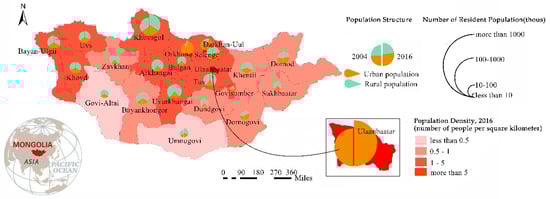
Figure 1.
Urbanization and the population density of Mongolia. Source: The map is from the Mongolia National Statistical Bureau (http://www.1212.mn/en/), and the population and urbanization data are from the Mongolia Statistical Yearbooks.
With the development of urbanization, Mongolia has experienced dramatic economic growth. According to the Mongolian Statistical Yearbooks, from 2004 to 2011, the average annual economic growth rate was approximately 9%, and it reached 17.5% in 2011. From 2012 to 2016, this rate slowed but still maintained an average annual growth rate of 7% [9]. Its large area, rapid urbanization, and dramatic economic growth have made Mongolia an appropriate area to explore the research questions in this study.
3. Materials and Methods
Based on major events that have occurred during the process of urbanization in Mongolia, for example, the land reforms (the “Law on Allocation of Land to Mongolian Citizens for Ownership” was implemented in 2003 [10], and the number of rural migrants entering Ulaanbaatar reached its peak in 2004 [7]. And then the Mongolian congress extended the validity of the “land use right” for up to another five years in 2013 [10]), the dzud disaster (the dzud disaster from 2009 to 2010 forced hundreds of nomads to move to cities [27]), and economic events (the Central Bank of Mongolia raised the benchmark interest rate to address the problem of inflation and the reduction of workers’ relative income in 2016 (http://pit.ifeng.com/a/20160903/49892274_0.shtml)), we selected data in the five periods of 2004, 2007, 2010, 2013, and 2016 to analyze the CCD between urbanization and residents’ livelihood level. The main data sources were the Statistical Yearbooks of Mongolia and the National Statistical Bureau of Mongolia (http://www.1212.mn/en/). We also collected firsthand data by interviewing local administration officials, academic scholars, and rural migrants.
3.1. The Indexes Used for the Evaluation of the Level of Urbanization and the Livelihood Level of Urban Residents
Previous research on urbanization has empirically used a single index, such as the population index [37], the land index [38,39], and the population density index [40], to measure the level of urbanization. The level of urbanization is the quantitative value of the degree of urbanization that relies on the connotation of urbanization. As mentioned above, the process of urbanization involves many aspects, such as the development of the economy and society, rural immigration, and land expansion [4]. Thus, composite indices such as the City Development Indicators [41] and the Urban Indicators Guidelines [42], which generally include population, economic, social, and other indicators [19,43], are more universally suitable for measuring the level of urbanization. Accordingly, we constructed composite indexes to evaluate the level of urbanization based on the City Development Indicators and the Urban Indicator Guidelines. The evaluation index system that was used in this study comprised three dimensions: A population index, an economic index, and a social index. Significantly, in addition to the population and economic indexes, traffic facilities and solid waste disposal are important indicators used to measure the level of urbanization [44]. The final evaluation index system is shown in Table 1, and the weight of each indicator was calculated through the entropy weight method using the steps shown in Section 3.2.

Table 1.
The indexes used to evaluate the level of urbanization.
Previous research on the livelihood level of residents originated in the United States in the 1930s [46], and was concentrated in the fields of medicine, psychology, and sociology. Since the 1970s, scholars have focused more on the application of “quality of life” research, particularly emphasizing the evaluation of livelihood level [47]. Some scholars have measured the livelihood level of residents from the two subjective aspects of “satisfaction” and “happiness” based on the subjective dimension of individual experience [48,49]. Other scholars have emphasized the use of objective evaluation indicators to measure the livelihood level of residents [50,51,52,53,54,55], such as the Calvert–Henderson quality of life indicators, including education, health, income, national security, public safety, leisure/recreation, employment, energy, environment, infrastructure, shelter, and human rights. In this paper, based on the availability of data, we constructed an assessment index system to measure the livelihood level of urban residents based on the Calvert–Henderson quality of life indicators. The evaluation index system that was used in this study is composed of the six dimensions of health, economy, living, education, culture, and security. The final assessment index system is shown in Table 2, and the entropy weight method was used to calculate the weight of each indicator using the steps shown in Section 3.2.
Table 2.
The assessment index system of the livelihood level of urban residents.
3.2. Evaluation of the Level of Urbanization and the Livelihood Level of Urban Residents
We used the entropy weight method to measure the level of urbanization and urban residents’ livelihood level. The entropy weight method is an objective weighting method [56], and entropy can be calculated based on the degree of variation of each indicator [57].
First, we calculated the entropy of each indicator as follows:
and
where is the indicator matrix, xij represents the value of indicator j in year I, is a constant, and .
Second, we calculated the coefficient of variation cj:
Third, we calculated the weight of indicator j as follows:
Finally, the level of urbanization or the livelihood level of urban residents L in year i could be calculated as follows:
3.3. Measuring the Coupling Coordination Degree
Mongolian urbanization and residents’ livelihood can be seen as two systems that affect each other and interact with one another. On the one hand, rapid urbanization in Mongolia causes social and economic development [21] and improves residents’ livelihood [22]. Meanwhile, it also creates environmental pollution, traffic congestion, and other serious problems that affect residents’ livelihood level [20,21,58]. On the other hand, promoting residents’ livelihood stimulates the government to improve urban infrastructure construction [10,15], and the expansion of urban land may gradually spiral out of control [7]. The CCD can be seen as the coupling and coordination relationship between the “level of urbanization” system and the “livelihood level of urban residents” system. The specific calculation steps that were used here are described as follows:
where C represents the coupling degree, U is the level of urbanization, L is the livelihood level of urban residents, K is the regulation factor, and (because there are two systems, namely, the “level of urbanization” system and the “livelihood level of urban residents” system) [28,59]:
Here, T represents the overall effect of the level of urbanization and the livelihood level of urban residents [19], a and b represent the contributions of the level of urbanization and the livelihood level of urban residents, respectively, and . Based on the equal importance of the level of urbanization and the livelihood level of urban residents, we assumed that their contributions were the same, and thus a and b are both equal to 0.5 [19,30]:
where D is the coupling coordination degree and . When the value of D is greater, the coupling and coordination between the level of urbanization and the livelihood level of urban residents is better [59].
3.4. Statistical Analyses
First, we calculated the level of urbanization and the livelihood level of urban residents for 22 regions in Mongolia using data from the five periods of 2004, 2007, 2010, 2013, and 2016. Then, we produced maps to visualize the spatiotemporal changes by the regions of the two indexes in the five periods in ArcGIS 10.2. Second, we calculated the CCD values in these five periods and conducted the K-means clustering method, using ArcGIS spatial visualization to explore the spatial patterns of the CCD. Finally, we used the SDM to analyze the main influencing factors of the CCD between urbanization and urban residents’ livelihood level.
Because the SDM takes into account the joint effects of the independent and dependent variables of the spatial lag on the dependent variables, it is the general form of the spatial autoregressive model (SAR) and the spatial error model (SEM). As the only model that can obtain unbiased coefficient estimation, it can better estimate the spillover effects produced by different observers and calculate the spatial spillover effects based on panel data [60]. We followed the procedure developed by LeSage and Pace [61] to estimate the model as follows:
where is a K × 1 vector of parameters; W is the spatial weights matrix; can be treated as a random variable or a set of fixed effects; can be treated as spatial fixed effects, time-period fixed effects, or spatial and time-period fixed effects; and is an error term.
4. Results
4.1. Spatiotemporal Changes in the Level of Urbanization and the Livelihood Level of Urban Residents
Understanding the spatiotemporal evolution of the urbanization level and residents’ livelihood level is the basis for analyzing the CCD between the two systems. According to the “Methods for Projections of Urban and Rural Population” [62], the level of urbanization is divided into the following four stages: The embryonic stage (), the preliminary stage (), the developing stage (), and the developed stage (). In addition, based on the relevant research [32,63], the livelihood level of urban residents is also divided into the following four stages: Lower livelihood level (), low livelihood level (), high livelihood level (), and higher livelihood level (). Figure 2 shows the spatiotemporal changes in the level of urbanization and the livelihood level of urban residents in the five periods of 2004, 2007, 2010, 2013, and 2016.
Figure 2.
Spatiotemporal changes in the level of urbanization and urban residents’ livelihood level. Note: (A) The level of urbanization in 2004; (B) the level of urbanization in 2007; (C) the level of urbanization in 2010; (D) the level of urbanization in 2013; (E) the level of urbanization in 2016; (F) urban residents’ livelihood level in 2004; (G) urban residents’ livelihood level in 2007; (H) urban residents’ livelihood level in 2010; (I) urban residents’ livelihood level in 2013; and (J) urban residents’ livelihood level in 2016.
4.1.1. Spatiotemporal Changes in the Level of Urbanization
In 2004, areas with relatively high urbanization levels were distributed in developed industrial regions, such as Orkhon, Ulaanbaatar, Darkhan-Uul, Govisumber, Dundgovi, and Umnugovi. Orkhon is rich in copper and molybdenum mines, and has several factories (e.g., a logging plant, a carpet factory, and a food factory) (interview with Professor Batbuyan, former director of the Institute of Geography and Geoecology MAS, 26 October 2017). In 2004, the per capita GDP of Orkhon was 3487.03 million tugrugs, which was more than five times the average level of Mongolia [36]. In addition, the five regions of Ulaanbaatar, Darkhan-Uul, Govisumber, Dundgovi, and Umnugovi are also rich in mineral resources, and industries are well developed [64,65,66,67]. Moreover, most of these areas are located along the Trans-Mongolian Railway [68], and the convenience of transportation also supports the economic development of these areas. From Table 1, we know that per capita GDP has contributed to a higher urbanization level. Thus, the developed economies in these regions have increased the level of urbanization in these regions. However, in most other areas where agriculture and animal husbandry are the leading industries, urbanization levels are in the embryonic and preliminary stages due to poor economic development, such as Uvs, Govi-Altai, and Zavkhan [69,70,71].
Since 2007, the urbanization level of the border areas has continuously improved (e.g., Govi-Altai, Bayan-Ulgii, Zavkhan, Umnugovi, Dornogovi, Sukhbaatar, and Dornod). The main reason has been the perennial opening of China and Mongolian border trade ports since 2005, which has promoted the development of mineral, tourism, transportation, and other industries in most parts of Mongolia [72]. The development of these industries has driven economic growth and increased the urbanization level of these regions. For instance, the Sibekulun port of Umnugovi is the only bilateral open port in Mongolia that corresponds to China’s Ceke port. The economic benefits that have been brought by foreign trade between the Sibekulun and Ceke ports have spread to five of Mongolia’s provinces: Umnugovi, Govi-Altai, Bayankhongor, Arkhangai, and Uvurkhangai [72,73]. Additionally, the other seven provinces of Govi-Altai, Bayan-Ulgii, Dornogovi, Sukhbaatar, Dornod, Selenge, and Zavkhan have also boosted economic development by promoting border trade with China or Russia [72,73], which increased their urbanization level from 2007 to 2016 (Figure 2C–E).
From 2010 to 2013, the level of urbanization in the regions with a rich coal industry (e.g., Umnugovi, Ulaanbaatar, and Selenge) was further improved by the development of the coal industry. For example, in Umnugovi, the per capita GDP in 2010 and 2013 reached 3,906.24 and 6817.46 million tugrugs, respectively, which was more than 1.2 and 1.4 times, respectively, the average level of Mongolia [74,75]. The level of urbanization of Umnugovi also rose from the developing stage to the developed stage (Figure 2C,D). However, after 2015, coal demand continued to decline, and the development of the coal industry was sluggish [76], which seriously affected the economic development of some regions in Mongolia, such as Umnugovi. In 2016, the per capita GDP of Umnugovi was 4406.13 million tugrugs [9], which was significantly lower than the average level of Mongolia. The urbanization level of Umnugovi also fell from the developed stage to the developing stage (Figure 2E). In contrast, regions such as Ulaanbaatar and Selenge maintained a relatively high level of urbanization through developed light industry [9].
4.1.2. Spatiotemporal Changes in the Livelihood Level of Urban Residents
From 2004 to 2007, areas with a low resident livelihood level were mainly located in areas with relatively poor infrastructure, such as Orkhon and Darkhan-Uul. Although the development of mining and manufacturing has increased the urbanization level of Orkhon and Darkhan-Uul, the large influx of rural migrants has caused severe infrastructure shortages (such as an inadequate water supply [23]), which has made the livelihood levels of the residents in these two areas low. However, the areas with border trade ports have improved the living standards of urban residents through trade in agricultural and animal husbandry products and mineral resources: Examples of these areas are Govi-Altai, Sukhbaatar, Umnugovi, Dornogovi, and Selenge [72]. Meanwhile, the four areas of Ulaanbaatar, Tov, Arkhangai, and Uvurkhangai, taking advantage of convenient roads and railways to provide livestock and mineral products to the surrounding areas, have also enhanced the livelihood level of urban residents (Figure 2F,G).
However, in 2010, the white dzud disaster (caused by a prolonged, extremely cold and snowy winter that made animals unable to find feed and caused them to die in large numbers [77,78,79]) occurred [22,80]. In the regions where animal husbandry is the main economic industry, the livelihood levels of urban residents were seriously affected, such as Dornogovi, Uvs, and Uvurkhangai [81] (Figure 2H). The dzud disaster forced a large number of herder families to migrate to sum centers (a sum is an administrative division unit higher than the village level [22]) or Aimag centers [22]. However, the influx of immigrants caused a serious infrastructure shortage, and most of the migrants were unable to have a stable livelihood in areas such as Selenge and Umnugovi [12,22]. Some migrants mentioned that only Ulaanbaatar had better basic services, especially healthcare and education for their children (interviews with migrants in a ger district of Ulaanbaatar on 27 October 2017).
From 2010 to 2016, with mass immigrants moving to regions with higher urbanization levels in the central and eastern regions (e.g., Selenge, Umnugovi, and Ulaanbaatar) [22,27], most of the western regions (e.g., Uvs, Uvurkhangai, and Bayankhongor) had relatively sufficient infrastructure (especially water supply) because of their reduced populations, and their livelihood levels were relatively higher than the livelihood levels of the eastern and central regions. Especially in Uvurkhangai and Bayankhongor, light industry was developed through convenient transportation (interview with Professor Batbuyan, former director of the Institute of Geography and Geoecology MAS on 28 October 2017). Although the urbanization levels in these areas was low, their relatively rich infrastructure made the livelihood levels of urban residents relatively high (Figure 2I,J).
4.2. Spatiotemporal Patterns of the CCD in the Five Periods of 2004, 2007, 2010, 2013, and 2016
The K-means clustering method is one of the most widely used algorithms in clustering analysis. K-means clustering aims to divide n observations into k clusters, and each observation belongs to the cluster that is closest to the mean value, which serves as the prototype of the cluster [82,83]. The K-means clustering method is an efficient heuristic algorithm that quickly converges to the local optimum [84]. Thus, we conducted the K-means clustering method and used ArcGIS spatial visualization to analyze the spatial patterns of the CCD between urbanization and urban residents’ livelihood level in Mongolia, as shown in Figure 3. Based on relevant research [19,32], the CCD is divided into four stages of moderate disorder (), mild disorder (), low-level coordination (), and high-level coordination ().
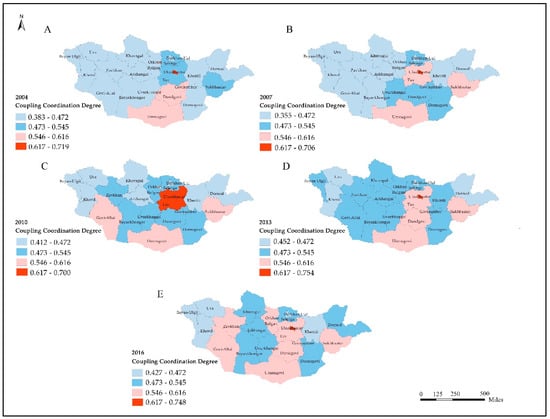
Figure 3.
Spatiotemporal patterns of the coupling coordination degree (CCD). (A) Spatial patterns of the CCD in 2004; (B) spatial patterns of the CCD in 2007; (C) spatial patterns of the CCD in 2010; (D) spatial patterns of the CCD in 2013; and (E) spatial patterns of the CCD in 2016.
The spatial patterns of the CCD were highly heterogeneous in the five periods of 2004, 2007, 2010, 2013, and 2016. In 2004 and 2007, the average CCD values existed in the moderate disorder stage. The high values of the CCD were clustered in the central part, while the low values of the CCD were clustered in the west and northeast of Mongolia. This result was approximately consistent with the spatial distribution of the level of urbanization. Some central regions have developed industries and are rich in infrastructure, and had both relatively high levels of urbanization and high livelihood levels of urban residents, such as Ulaanbaatar, Dundgovi, and Umnugovi. Thus, the values of the CCD in these regions were relatively high. However, in most of the west and northeast regions (e.g., Uvs, Bayan-Ulgii, Khovd, Knentii, and Dornod), where the economy is mainly based on animal husbandry [85,86,87], the livelihood levels of urban residents and the levels of urbanization were low. Although some Aimags with trade ports have improved their residents’ livelihood level through foreign trade (e.g., Govi-Altai and Zavkhan), their urbanization levels were still in the preliminary stage (Figure 2A,F). Therefore, the values of the CCD in the west and northeast regions were low.
In 2010, the average CCD value improved to reach 0.505, which reflected mild disorder. The spatial trend of the CCD data was less obvious in 2010 than in 2004 and 2007. Moreover, the spatial trend of the CCD was not consistent with the spatial distribution of the level of urbanization and urban residents’ livelihood level. The high CCD values were mainly clustered in the central and border areas of Mongolia (e.g., Ulaanbaatar, Tov, Govisumber, Govi-Altai, Umnugovi, and Sukhbaatar), while the low values were only clustered in the northwest and northeast (Figure 3C). Although the urbanization levels of Ulaanbaatar and Tov were not the highest, the CCD values of the two regions were the largest, which may be attributable to their residents’ relatively higher livelihood level. In contrast, although the urbanization level of Umnugovi was the highest, its CCD value was not the largest, which may be attributable to its low residents’ livelihood level. Furthermore, although the urban residents’ livelihood levels of several western Aimags were high, their urbanization levels were in the preliminary stage (e.g., Zavkhan, Arkhangai, and Bulgan). Thus, their CCD values were still lower than the central Aimags.
The spatial trend of the CCD data was much more obvious in 2013 and 2016, and the average CCD values increased to 0.522 and 0.521, respectively, but still exhibited mild disorder. In 2013 and 2016, the spatial patterns of the CCD were basically consistent with the spatial distribution of the level of urbanization. In 2013, the high CCD values were only clustered in the middle of Mongolia, including Ulaanbaatar, Tov, Dundgovi, and Umnugovi. Meanwhile, the median values of the CCD replaced the low values and took up several Aimags in the west, such as Arkhangai, Bayan-Ulgii, Khuvsgul, and Khentii (Figure 3D). The main reason may have been the relatively higher livelihood level of urban residents in some western regions (Figure 2I). However, in 2016, although the high CCD values exhibited an approximately striped distribution in the central and western areas from north to south, most western and eastern Aimags were still in the mild disorder stage, such as Bayankhongor, Arkhangai, Uvurkhangai, Selenge, and Dornod. The main reason may have been that the urbanization levels and livelihood levels in these Aimags were not consistent. Although some Aimags’ urbanization levels were in the preliminary stage, their livelihood levels were high (e.g., Uvurkhangai, Bayankhongor, and Uvurkhangai). In contrast, some Aimags’ urbanization levels were in the developing stage, and their livelihood levels were relatively low (e.g., Selenge, Dornod, and Dornogovi).
As shown in Figure 3A–E, the average CCD values in 2004 and 2007 existed in the moderate disorder stage, and the overall difference gradually narrowed to the mild disorder stage in 2013 and 2016. The distribution of the regions with high values of CCD expanded from a scattered distribution to an approximately striped distribution in the central areas, from north to south, whereas the distribution of the regions with low values decreased. The spatial patterns of the CCD were basically consistent with the spatial distributions of the level of urbanization in 2004, 2007, 2013, and 2016, but were different from the spatial distribution of urban residents’ livelihood level.
4.3. Driving Forces of the CCD
To promote sustainable urban development, it is essential to explore the driving forces of the CCD between urbanization and urban residents’ livelihood level [19]. Existing studies have shown that many influencing factors play a role in the CCD [88]. Based on previous research [19,30,88], we chose the following four indexes to further explore the driving forces of the CCD: 1) The level of economic development (because variable GDP has been used in previous analyses (see Table 1), here we selected the commercial unit per thousand of the urban population, the registered enterprises per thousand of the urban population, and the vehicles per thousand of the urban population to reflect the level of economic development); 2) the level of industrial development, including the proportion of secondary industry; 3) government policymaking actions, which consisted of urban construction and repair capital per square kilometer (urban construction and repair capital refer to economic investment in the creation, renewal, repair, or extension of fixed assets in terms of buildings, land improvements, or other improvements that are constructed by national enterprises such as roads, bridges, and dams, and it is an important indicator with which to measure urban construction [89]), and the expenditures of the local government per person; and 4) the degree of linkage between cities, approximated by the number of telephone lines per square kilometer.
By considering the availability of data, we took the CCD as an independent variable and the four indexes as dependent variables to further reveal the driving forces of the CCD in Mongolia (Table 3). These econometric analyses were conducted with Stata 12 and MATLAB based on Equation (9). Table 3 reports the Lagrange multiplier (LM) tests results to determine whether the SEM or the SAR was more appropriate. In column 1, both the LM test (no spatial lag) and the robust LM test (no spatial lag) of the nonspatial model showed that p < 0.05, which implies that the original hypothesis of no spatially lagged dependent variable could be rejected [90] and the SAR was more appropriate. Additionally, the hypothesis that time-period fixed effects are insignificant could be rejected with a likelihood ratio (LR) test (189.71, with 10 degrees of freedom, p < 0.01), which justified the extension of the model with time-period fixed effects.
Table 3.
Estimation results using panel data models without spatial interaction effects.
Moreover, to arrive at a scientific and credible conclusion, we also used the Wald test and the LR test to test whether the SDM could be simplified to the SAR. The results reported in Table 4 using the Wald test (46.53, with 7 degrees of freedom, p = 0.0000) and using the LR test (33.73, with 7 degrees of freedom, p = 0.0000) indicate that the original hypothesis (H0: ) could be rejected [90,91]. Thus, we chose the SDM to analyze the influencing factors of the CCD.
Table 4.
The regression results of the spatial Durbin model (SDM) with time-period specific effects.
We then used the Hausman test to determine whether the random effects model was more appropriate than the fixed effects model. The result of the Hausman test (Table 4) showed that p = 0.0549, which means that we accepted the original hypothesis of the random effects [92]. Thus, we chose the SDM with random spatial effects and fixed time-period effects to analyze the influencing factors of the CCD.
In the nonspatial model, the coefficients of the four explanatory variables RE, VH, SE, and TE were significantly different from zero. In the time-period fixed effects of this model (the penultimate column of Table 3), the variables of RE, SE, VH, and TE all had positive effects on the CCD. The elasticities of the four variables were 0.4462, 0.4285, 0.3285, and 0.3387, respectively. However, because the SDM specification of this model was more appropriate, these elasticities were biased. In the SDM with random spatial effects and fixed time-period effects, only the two variables RE and SE had a significantly positive effect on the CCD. Moreover, the coefficient estimates in the nonspatial model represented the marginal effects of a change in the explanatory variables on the explained variables, whereas the coefficients in the SDM did not. Thus, we needed to compare the parameter estimates in the nonspatial model in Table 3 with their counterparts in the direct and indirect effects estimates in Table 5. Because of the feedback effects generated by the impacts passing through adjacent regions and back to the regions themselves, the coefficient estimates of the explanatory variables in Table 4 were different from their direct effects in Table 5 [86]. The feedback effects were partly caused by the positive and significant coefficient of the spatially lagged dependent variable [W*Log (C)] and partly caused by the negative and significant coefficients of the spatially lagged values of the explanatory variables, such as [W*Log (RE)] and [W*Log (SE)] (see Table 4).
Table 5.
The direct, indirect, and total effects of variables based on the SDM.
In the SDM with random spatial effects and fixed time-period effects (Table 5), the direct effect of the RE was 0.2952 and of the SE was 0.3122, which implies that the RE elasticity of 0.0602 in the nonspatial model was underestimated by 23.5%, and the SE elasticity of 0.3872 was overestimated by 7.5%. Because the direct effect of the RE was 0.2952 and its coefficient estimate 0.2841 (the second column of Table 4), its feedback effect was 0.0111, or 1.11% of the direct effect. Similarly, the feedback effect of the SE was −0.0038, or −0.38% of the direct effect. Therefore, these feedback effects were relatively small.
In contrast, the indirect effects in the nonspatial model were set to zero by construction. However, the indirect effect of the RE in the SDM was approximately 34.89% of the direct effect of the RE. Similarly, the indirect effect of the SE was approximately −13.83% of the direct effect of the SE. However, based on T-statistics, these two indirect effects were insignificantly different from zero. Therefore, the coefficient of the spatial lagged value of the RE was significantly positive, but its indirect effect was insignificantly positive. Similarly, the coefficient of the spatial lagged value of the SE was significantly positive, but its indirect effect was insignificantly negative. This implies that if the secondary industry share and the registered enterprises per thousand of the urban population in an Aimag increased, the CCD would only increase in this Aimag (elasticity 5.28 and 2.92, respectively), but would not change in its neighboring Aimags.
5. Discussion
Previous studies have suggested that rapid expansion in Mongolia has resulted in an inequality in livelihood [7,15], growing air pollution [20], unevenly distributed social goods [21,23], etc., which implies that the urbanization of Mongolia is characterized by a chronic imbalance. However, few studies have incorporated the lack of coordination urbanization into Mongolian urban studies, and most studies have focused only on land expansion [25,95] and environmental changes [96]. This paper has explored the CCD between urbanization and urban residents’ livelihood level and its driving forces in detail. These results provide not only essential insights into understanding the lack of coordination between urbanization and urban residents’ livelihood level in Mongolia, but also effective insights for the government to promote the sustainable development of urbanization.
It is important to understand the spatiotemporal changes of the level of urbanization and the livelihood level of urban residents before conducting research on the CCD between the two systems. The results obtained with the entropy weight method demonstrated the spatiotemporal patterns of the two systems. The regions with a higher level of urbanization in Mongolia were mostly distributed in the central regions with developed industries and the border regions with developed foreign trade (Figure 1). However, an improvement of the urbanization level did not create a simultaneous improvement in the livelihood level of urban residents. The large-scale migration of herdsmen that was caused by natural disasters in 2010 [22,80] led to a shortage of infrastructure in some industrialized areas (e.g., Orkhon, and Darkhan-Uul), which seriously affected the livelihood levels of urban residents [10,15,23]. However, in some western regions (e.g., Zavkhan, Arkhangai, and Uvurkhangai), the infrastructure was relatively adequate due to the sharp decline in population. Meanwhile, with the rapid development of mining and transportation [97,98], the livelihood levels of urban residents in some western regions were relatively higher than those in the central and eastern regions.
Additionally, a serious imbalance in the coordination of urban development and urban residents’ livelihood among the Aimags of Mongolia was indicated by the spatial distribution of the CCD values from 2004 to 2016. The high CCD values were mainly clustered in the central areas of Mongolia (e.g., Ulaanbaatar, Tov, and Govisumber). The main reason for this finding may be that the central regions have more convenient transportation [68], are richer in mineral resources [99,100], and have higher levels of urbanization and livelihood. However, the CCD values of most of the central areas still existed in low-level coordination, which occurs mainly because most of the urban residents who live in ger areas of central areas remain unable to enjoy basic services [7,10,15] and suffer from poverty, environmental pollution, and disease [12,27,101].
Moreover, the CCD of some western regions is increasing every year, especially in the border areas, which is mainly attributable to the development of border trade. Since 2004, China and Mongolia have opened 18 trade ports that are mainly distributed in Govi-Altai, Umnugovi, and Sukhbaatar [102]. The trade between China and Mongolia has been increasing substantially. The trade volume in 2004 was $694 million and increased to $4.02 billion in 2010 [103]. In 2016, it continued to climb to $4.93 billion [104]. Additionally, the development of the border trade between Mongolia and Russia has also shown good momentum [72,73]. Border trade has promoted the urbanization level and residents’ livelihood level in several western Aimags, such as Govi-Altai, Umnugovi, and Zavkhan. From 2004 to 2016, their CCD values continued to rise, and they engaged in low-level coordination in 2016. However, volatile Mongolian policies, regime changes, and a lack of infrastructure at border ports have also seriously affected the development of some border regions [72,103], such as Bayan-Ulgii, Selenge, Bayankhongor, and Dornod, and their CCD values were still in the moderate and mild disorder stages.
The argument that the CCD is seriously affected by both the economic development level and the industrial development level was strongly demonstrated in the SDM. As shown in Table 4, the coefficient of the spatial lagged value of the secondary industry share was significantly positive in explaining the CCD. As we predicted, an increase in the secondary industry share in an Aimag will promote an increase in the CCD in this Aimag. The rapid development of industry is the main factor in Mongolia’s urban development. Since 2004, the development of the mining industry has led to rapid economic growth in Mongolia [22]. In addition, the real estate industry has expanded, and single-family dwellings are increasingly becoming the domicile of choice, which has promoted the development of satellite communities around the city [105]. Furthermore, the mining boom in 2009, combined with the dzud disaster, forced nomads to migrate to cities, especially Ulaanbaatar [80]. Although both the mining boom and real estate development have benefited urban elites more than urban residents [22,27], the development of a secondary industry has also provided employment opportunities for most urban residents to maintain their livelihoods. Therefore, industrial development can promote the level of urbanization and livelihood level of urban residents, and thus enhance the CCD. Additionally, the economic level is also the most powerful factor that can promote the improvement of the CCD, which was verified by our results, where the coefficient of the spatial lagged value of the registered enterprises per thousand urban residents on the CCD was significantly positive (see Table 4). As a key microeconomic sector, enterprises are of vital importance to urban development [106]. Moreover, enterprises mainly promote urban economic development by raising wages and stimulating consumption [106]. Accordingly, the development of enterprises promotes not only the level of urbanization but also the livelihood level of urban residents. Thus, the increase in the number of registered enterprises can promote improvement in the CCD. However, when we take environmental factors into account, it is essential to enhance the number of environmental enterprises to promote the improvement of the CCD.
To promote sustainable urban development in Mongolia, we argue that the key issue is encouraging the development of industries in regions according to local conditions to promote coordination between urbanization and urban residents’ livelihood. For instance, it is essential to develop light industry (e.g., leather processing or meat processing) in western and eastern sum centers or Aimag centers [22] and to encourage industrial transformation and vigorously develop processing, manufacturing (such as wood processing and food processing), and tourism industries in coal mining cities (e.g., Umnugovi). Additionally, local governments must encourage private investment and increase the number of registered enterprises to promote the improvement of the CCD. Furthermore, more professional and sustainable policies that improve basic urban services must be formulated and implemented both to improve the livelihood level of urban residents and to promote sustainable urban development in Mongolia.
As in all studies, our study had some limitations. For instance, because of the non-availability of the data, this paper did not consider the impact of the ecological environment (e.g., meteorological or hydrological factors) on the level of urbanization or the livelihood level of urban residents, nor did it consider the impact of subjective feelings (e.g., subjective well-being) on the livelihood level of urban residents. Environmental variables are one of the most important driving forces of urbanization [20,21], whereas climate change, such as dzud disasters, can seriously affect the livelihood level of residents in Mongolia [22,80,107]. Moreover, subjective feelings can reflect the satisfaction of residents with respect to urban planning [108] and urban development [109]. In future research, if data are available, it will be essential to conduct more comprehensive indicators (e.g., the sustainable urban development indicators [110], the Calvert–Henderson quality of life indicators [55], or the life satisfaction indicators [111]) to more synthetically reflect the level of urbanization and the livelihood level of urban residents. Furthermore, promoting an increase in the CCD between the level of urbanization and the livelihood level of urban residents is an important issue not only in Asian countries but also in rapidly developing countries in Europe and other continents. Thus, future studies may consider using one or two more developed countries’ data to test the verifiability and universality of the method and conclusion in this study.
6. Conclusions
This paper used observations from 21 Aimags and 1 capital of Mongolia to investigate the CCD between the level of urbanization and the livelihood level of urban residents. The results imply that there was a serious imbalance in the coordination of urban development and urban residents’ livelihood among the Aimags of Mongolia. The high values of the CCD were mainly concentrated in the central regions of Mongolia, while the low values were clustered in the western and eastern areas. To investigate the driving forces of the CCD, the SDM was conducted, and the results showed that both the secondary industry share and the number of registered enterprises played significant roles in promoting the coordination between urbanization and residents’ livelihood level. Therefore, we argue that promoting industrial development and regional economic development can effectively improve the CCD between the level of urbanization and the livelihood level of urban residents. Currently, the Mongolian government has made great efforts to promote heavy industry (e.g., mining and quarrying): However, light industry may be more effective in improving the livelihood of urban residents and promoting the development of western and eastern Aimag centers. Additionally, increasing the number of registered enterprises to promote regional economic development is a reliable strategy for improving the CCD. Furthermore, it is also necessary to improve resource utilization, protect the environment, and promote social equity and justice to eventually realize sustainable urban development in Mongolia.
Author Contributions
D.W. and D.C. conceived and designed the work; H.L., Y.X., and J.L. analyzed the data and created the maps; D.C. and N.C. drafted the manuscript; D.C. and H.L. wrote the review and edited.
Funding
This paper was supported by the Science & Technology Basic Resources Investigation Program of China’s “Multidisciplinary Joint Expedition for China-Mongolia-Russia Economic Corridor” (No. 2017FY101300, 2017FY101302) and the National Natural Science Foundation of China (No. 41771128).
Conflicts of Interest
The authors declare no conflicts of interest.
References
- Spence, M.; Patricia, C.A.; Buckley, R.M. Urbanization and Growth; World Bank Publications: Singapore, 2008. [Google Scholar]
- Xiang, B.W.; Zhang, H.W. The Relationship between the Long-run Equilibrium and Short-run Dynamic Effects of Urbanization and Economic Growth—An Empirical analysis based on penal data of provincial level in China. J. Huazhong Norm. Univ. (Humanit. Soc. Sci.) 2013, 52, 47–54. [Google Scholar]
- Song, J.; Huang, X. China’s Urbanization Knowledge; China City Press: Beijing, China, 2001. [Google Scholar]
- Yuan, Y.J.; Wu, S.H.; Yu, Y.N.; Tong, G.J.; Mo, L.J.; Yan, D.H.; Li, F.F. Spatiotemporal interaction between ecosystem services and urbanization: Case study of Nanjing City, China. Ecol. Indic. 2018, 95, 917–929. [Google Scholar] [CrossRef]
- United Nations. Sustainable Development Goal 11: Make Cities and Human Settlements Inclusive, Safe, Resilient and Sustainable. Available online: http://www.fjta.gov.cn/ar/https://www.un.org/sustainabledevelopment/cities (accessed on 23 September 2015).
- Agunbiade, M.E.; Rajabifard, A.; Bennett, R. The dynamics of city growth and the impact on urban land policies in developing countries. Int. J. Urban Sustain. Dev. 2012, 4, 146–165. [Google Scholar] [CrossRef]
- Tsutsumida, N.; Saizen, I.; Matsuoka, M.; Ishii, R. Addressing urban expansion using feature-oriented spatial data in a peripheral area of Ulaanbaatar, Mongolia. Habitat Int. 2015, 47, 196–204. [Google Scholar] [CrossRef]
- World Bank. World Development Indicator. 2015. Available online: http://data.worldbank.org (accessed on 1 March 2015).
- NRSO, National Registration and Statistics Office. Mongolian Statistical Yearbook—2016. Available online: http://www.1212.mn/en/ (accessed on 2 January 2018).
- Kamata, T.; Reichert, J.; Tsevegmid, T.; Kim, Y.; Sedgewick, B. Managing Urban Expansion in Mongolia: Best Practices in Scenario-Based Urban Planning. The International Bank for Reconstruction and Development. The World Bank. 2010. Available online: http://www-wds.worldbank.org/external/default/WDSContentServer/WDSP/IB/2010/06/15/000333037_20100615010420/Rendered/PDF/550280PUB0Urba100Box34943B01PUBLIC1.pdf (accessed on 31 January 2010).
- Narantuya, B. Internal migration trend in Mongolian. Mong. Popul. 2013, 23, 16. [Google Scholar]
- Yi, L.; Shi, T. Study on the Urbanization of Mongolian State “Herdsman Workers”—Field Survey of “Ger Horool” in Ulaanbaatar. J. Inn. Mong. Univ. Natl. (Soc. Sci.) 2016, 42, 33–38. [Google Scholar]
- Ren, Y. Sustainable urbanization: Imbed sustainable development within the urbanization process in China. Soc. Sci. 2017, 2, 66–71. [Google Scholar]
- Deng, W. Dictionary of Sociology; Shanghai Lexicographical Publishing House: Shanghai, China, 2009. [Google Scholar]
- Kamata, T.; Reichert, J.A.; Tsevegmid, T.; Kim, Y.; Sedgewick, B. Enhancing Policies and Practices for Ger Area Development in Ulaanbaatar; World Bank Publications: Herndon, VA, USA, 2010. [Google Scholar]
- JICA, Japan International Cooperation Agency. The Study on City Master Plan and Urban Development Program of Ulaanbaatar city (UBMPS) Final Report PART II: Ulaanbaatar City Master Planning 2030; Japan International Cooperation Agency: Tokyo, Japan, 2009.
- Byambadorj, T.; Amati, M.; Ruming, K.J. Twenty-first century nomadic city: Ger districts and barriers to the implementation of the Ulaanbaatar City master Plan. Asia Pac. Viewp. 2011, 52, 165–177. [Google Scholar] [CrossRef]
- Miller, J.E. Nomadic and domestic: Dwelling on the Edge of Ulaanbaatar. Dissertation for the Degree of Doctor of Philosophy in Geography, University of California, Los Angeles, CA, USA, 2013. [Google Scholar]
- Zhang, N.; Bai, Y.; Qiao, F.; Wang, F.; Chen, Z. Spatial -temporal evolution and influencing factors of coordination degree between Urbanization and residents’ living quality in process of Urbanization. Resour. Dev. Mark. 2017, 33, 980–984. [Google Scholar]
- Fan, P.; Chen, J.; John, R. Urbanization and environmental change during the economic transition on the Mongolian Plateau: Hohhot and Ulaanbaatar. Environ. Res. 2016, 144, 96–112. [Google Scholar] [CrossRef]
- Park, H.; Fan, P.; John, R.; Chen, J. Urbanization on the Mongolian Plateau after economic reform: Changes and causes. Appl. Geogr. 2017, 86, 118–127. [Google Scholar] [CrossRef]
- Mayer, B. Climate migration and the politics of causal attribution: A case study in Mongolia. Migr. Dev. 2016, 5, 234–253. [Google Scholar] [CrossRef]
- Sigel, K.; Altantuul, K.; Basandorj, D. Household needs and demand for improved water supply and sanitation in peri-urban ger areas: The case of Darkhan, Mongolia. Environ. Earth Sci. 2012, 65, 1561–1566. [Google Scholar] [CrossRef]
- Amarsaikhan, D.; Chinbat, B.; Ganzorig, M.; Battsengel, V.; Bulgan, G.; Nergui, B.; Egshiglen, E.; Gantuya, R. Applications of remote sensing (RS) and geographical information system (GIS) for urban land use change study in Ulaanbaatar City, Mongolia. J. Geogr. Reg. Plan. 2011, 4, 471–481. [Google Scholar]
- Purevtseren, M.; Tsegmid, B.; Indra, M.; Sugar, M. The Fractal Geometry of Urban Land Use: The Case of Ulaanbaatar City, Mongolia. Land 2018, 7, 67. [Google Scholar] [CrossRef]
- Fan, P.; Qi, J.; Chen, X.; Messina, J.; Huang, H.; Li, X. Urban Expansion and Environment Change in Dry Land East Asia. In Dry land East Asia (DEA): Land Dynamics amid Social and Climate Change (Chapter 5); Chen, J., Wan, S., Henebry, G., Qi, J., Gutman, G., Kappas, M., Sun, G., Eds.; Higher Education Press: Beijing, China, 2013. [Google Scholar]
- Diener, A.C.; Hagen, J. City of felt and concrete: Negotiating cultural hybridity in Mongolia’s capital of Ulaanbaatar. Natl. Pap. 2013, 41, 622–650. [Google Scholar] [CrossRef]
- Li, Y.; Li, Y.; Zhou, Y.; Shi, Y.; Zhu, X. Investigation of a coupling model of coordination between urbanization and the environment. J. Environ. Manag. 2012, 98, 127–133. [Google Scholar] [CrossRef] [PubMed]
- Yu, W.; Zhang, P. Study on Coupling Coordination between Tourism Education and Tourism Industry around Provincial Units in China. J. Tour. Dev. 2016, 1, 69–74. [Google Scholar]
- Guo, F.; Li, C.; Chen, C.; Gan, J. Spatial-temporal coupling characteristics of population urbanization and land urbanization in northeast China. Econ. Geogr. 2015, 35, 49–56. [Google Scholar]
- Song, W.X.; Bai, C.Q.; Liao, W.Q.; Zhou, R. Coupling coordination between the level of economic development and the quality of residents’ life in the Yangtze river delta region. Resour. Environ. Yangtze Basin 2013, 22, 1382–1388. [Google Scholar]
- He, S.W.; Shao, X. Spatial Clustering and Coupling Coordination of Population-Land-Economic Urbanization in Beijing-Tianjin-Hebei Region. Econ. Geogr. 2018, 38, 95–102. [Google Scholar]
- Guo, S.H.; Wang, F.X.; Gao, M. Spatial-temporal coupled coordination between population urbanization and land urbanization in Shandong peninsula. Econ. Geogr. 2014, 34, 72–78. [Google Scholar]
- Bruun, O. Nomadic Herders and the Urban Attraction. In Mongols from Country to City: Floating Boundaries, Pastoralism and in City Life the Mongol Lands; Brunn, O., Narangoa, L., Eds.; NIAS: Copenhagen, Denmark, 2006; pp. 162–184. [Google Scholar]
- Sneath, D. The Rural and the Urban in Pastoral Mongolia. In Mongols From Country to City: Floating Boundaries, Pastoralism and in City Life the Mongol Lands; Brunn, O., Narangoa, L., Eds.; NIAS: Copenhagen, Denmark, 2006; pp. 140–161. [Google Scholar]
- NSOM, National Statistical Office of Mongolia. 2004 Statistical Yearbook of Mongolia. Available online: http://www.1212.mn/en/ (accessed on 10 May 2004).
- Wang, X.S. A new way to improve the formula of population urbanization. Econ. Geogr. 2001, 21, 315–318. [Google Scholar]
- Xu, X.; Zhou, Y.; Ning, Y. Urban Geography; Higher Education Press: Beijing, China, 1995. [Google Scholar]
- Jiang, A. Discuss on different measurement methods of urbanization level. J. Cent. Univ. Financ. Econ. 2002, 8, 76–80. [Google Scholar]
- Acemoglu, D.; Johnson, S.; Robinson, J.A. Reversal of fortune: Geography and institutions in the making of the modern world income distribution. Q. J. Econ. 2002, 117, 1231–1294. [Google Scholar] [CrossRef]
- UN-Habitat. The State of the World’s Cities Report 2001; Unied Nations Publications: New York, NY, USA, 2002; pp. 116–118. [Google Scholar]
- UN-Habitat. Urban Indicators Guideliners, United Nations Human Settlement Program; Unied Nations Publications: New York, NY, USA, 2004; pp. 8–9. [Google Scholar]
- Ma, S.; Xu, P.; Sun, Y. The study of the level of urbanization comprehensive evaluation method. J. Shenyang Jianzhu Univ. (Soc. Sci.) 2012, 14, 272–276. [Google Scholar]
- UN-Habitat. The Challenge of Slums—Global Report on Human Settlements 2003; Yu, J., Si, C., Cheng, H., Eds.; China Architecture & Building Press: Beijing, China, 2006. [Google Scholar]
- Huang, J. The Economy of Mongolia; China Economic Publishing House: Beijing, China, 2016. [Google Scholar]
- Ogburn, W.F. Social change in 1928. Am. J. Sociol. 1929, 34, 6–10. [Google Scholar]
- Pan, Z. The progress and trend of “quality of life” research. Zhejiang Soc. Sci. 1994, 6, 73–76. [Google Scholar]
- Kelly, J.R.; Steinkamp, M.W. Later-life satisfaction: Dose leisure contribute? Leis. Sci. 1987, 9, 189–199. [Google Scholar] [CrossRef]
- London, M.; Crandall, G.; Seals, W. The contribution of job and leisure satisfaction to quality of life. J. Appl. Psychol. 1977, 62, 328–334. [Google Scholar] [CrossRef]
- Berger-Schmitt, R. International Symposium “Methodological Problems of Construction Composite Indices”; Social Indicators Department, ZUMA: Mannheim, Germany, 10 October 2000. [Google Scholar]
- Berger-Schmitt, R.; Jankowitsch, B. Systems of social indicators and social reporting: The state of the art. In European Working Paper No. 1, Subproject “European System of Social Indicators”; Center for Survey Research and Methodology, Social Indicators Department: Mannheim, Germany, 1999. [Google Scholar]
- Davis, E.; Fine-Davis, M. Social Indicators of living conditions in Ireland with European comparisons. Soc. Indic. Res. 1991, 25, 103–365. [Google Scholar] [CrossRef]
- Schifini D’andrea, S. Italian Quality of Life. Soc. Indic. Res. 1998, 44, 5–39. [Google Scholar]
- UNDP. United Nations Development Programme 2016; Lowe-Martin Group: Ottawa, ON, Canada, 2016. [Google Scholar]
- Henderson, H.; Lickerman, J.; Flynn, P. Calvert-Henderson Quality of Life Indicators; Calvert Group, Ltd.: Rockville, MD, USA, 2000. [Google Scholar]
- Meng, X.; Jia, L. Train timetable stability evaluation based on analysis of interior and exterior factors information entropy. Appl. Math. Inf. Sci. 2014, 8, 1319–1325. [Google Scholar] [CrossRef]
- Du, Y.P.; Zhang, Y.; Zhao, X.G.; Wang, X.H. Risk Evaluation of Bogie System Based on Extension Theory and Entropy Weight Method. Comput. Intell. Neurosci. 2014, 2014, 19. [Google Scholar] [CrossRef] [PubMed]
- ADB, The Asian Development Bank. ADB Greenlights Mongolia’s Sustainable Urban Transport Program. Available online: https://www.adb.org/news/adb-greenlights-mongolias-sustainable-urban-transport-program (accessed on 19 September 2012).
- Liu, L.; Zhang, H. Spatial-temporal coupling relationship between urbanization efficiency and economic development level in Shandong Province. Econ. Geogr. 2015, 35, 75–82. [Google Scholar]
- Anselin. Spatial Econometrics: Methods and Models; Kluwer Academic Publishers: Dordrecht, The Netherlands, 1988. [Google Scholar]
- LeSage, J.P.; Pace, R.K. Introduction to Spatial Econometrics; CRC Press Taylor & Francis Group: Boca Raton, FL, USA, 2009. [Google Scholar]
- UN, United Nations. Methods for Projections of Urban and Rural Population; U.N. Department of International Economic and Social Affairs, Population Division: New York, NY, USA, 1974. [Google Scholar]
- Fan, B.N. The evaluation on quality of citizen’s living of China. J. Zhejiang Univ. Humanit. Soc. Sci. 2006, 36, 122–131. [Google Scholar]
- GASO, Govisümber Aimag Statistical Office. Govisümber Aimag Statistical Office Annual Report 2005. Available online: www.govisumber.nso.mn (accessed on 10 May 2007).
- DUASO, Darkhan-Uul Aimas Statistical Office. Darkhan-Uul Aimas Statistical Office Annual Report 2005. Available online: www.darkhan-uul.nso.mn (accessed on 12 May 2007).
- SODA, Statistics Office of Dornogovi Aimag. Dornogovi Aimag Statistical Office Annual Report 2005. Available online: www.dornogovi.nso.mn (accessed on 10 May 2007).
- SOCC, Statistical Office of the Capital City. 2004 Statistical Yearbook of Ulaanbaatar. Available online: www.ubstat.mn (accessed on 10 May 2004).
- Gao, S.L. Development of Railways in Mongolia. In Comprehensive Transportation; Institute of Comprehensive Transportation of National Development and Reform Commission: Beijing, China, 1996. [Google Scholar]
- ZASO, Zavkhan Aimag Statistic Office. Zavkhan Aimag Statistic Office 2005 Annual Report. Available online: www.zavkhan.nso.mn (accessed on 13 May 2008).
- UASO, Uvs Aimag Statistic Office. Uvs Aimag Statistic Office Annual Report 2005. Available online: www.uvs.nso.mn (accessed on 11 May 2008).
- GAASO, Govi-Altai Aimag Statistic Office. Govi-Altai Aimag Statistic Office Annual Report 2005. Available online: www.govi-altai.nso.mn (accessed on 11 May 2008).
- Fan, X.Y. Research on Logistics System Construction of Border Ports in Inner Mongolia to Mongolia. Master’s Dissertation, Inner Mongolia University of Finance and Economics, Huhhot, China, 2014. [Google Scholar]
- An, J.M. Study on the Interactive Relationship between Inbound and Outbound Tourism and Import and Export Trade between Inner Mongolia and Mongolia. Master’s Dissertation, Shaanxi Normal University, Xi’an, China, 2015. [Google Scholar]
- NSOM, National Statistical Office of Mongolia. Mongolian Statistical Yearbook—2013. Available online: http://www.1212.mn/en/ (accessed on 10 May 2017).
- NSOM, National Statistical Office of Mongolia. RMongolian Statistical Yearbook—2011. Available online: http://www.1212.mn/en/ (accessed on 21 August 2014).
- Liang, D.S. Situation review and development tendency outlook on world coal market in 2017. Coal Econ. Res. 2017, 38, 6–18. [Google Scholar]
- Belt, D. The Urban Clan of Genghis Khan: An Influx of Nomads has Turned Mongolian Capital Upside Down. Natl. Geogr. 2011, 220, 114–127. [Google Scholar]
- Tachiiri, K.; Shinoda, M.; Klinkenberg, B.; Morinaga, Y. Assessing Mongolian snow disaster risk using livestock and satellite data. J. Arid Environ. 2008, 72, 2251–2263. [Google Scholar] [CrossRef]
- Morris, L. Death and suffering in the land of Genghis Khan. Can. Med Assoc. J. CMAJ 2011, 183, E271. [Google Scholar] [CrossRef] [PubMed]
- Batchuluun, Y. Mongolian nomads: Effects of globalization and social change. In Everyday Knowledge, Education and Sustainable Futures, Part of the Education in the Asia-Pacific Region: Issues, Concerns and Prospects Book Series (EDAP); Springer: Singapore, 2016; Volume 30, pp. 89–105. [Google Scholar]
- NSOM, National Statistical Office of Mongolia. Annual Livestock Census Data 2010. Available online: http://www.1212.mn/tables.aspx?tbl_id=dt_nso_1001_021v1&bag_select_all=0&bagsingleselect=_0&type_of_livestock_select_all=0&type_of_livestocksingleselect=_01&yeary_select_all=0&yearysingleselect=_2010&viewtype=table (accessed on 17 January 2019).
- MacQueen, J.B. Some Methods for classification and Analysis of Multivariate Observations. In Proceedings of the 5th Berkeley Symposium on Mathematical Statistics and Probability, Berkeley, CA, USA, 21 June–8 July 1965; University of California Press: Berkeley, CA, USA, 1967. [Google Scholar]
- Zhang, W.J.; Gu, X.F.; Chen, L.F.; Yu, T.; Xu, H. An algorithm for initilizing of K-means Clustering based on mean-standard deviation. J. Remote Sens. 2006, 10, 715–721. [Google Scholar]
- Wang, F.; Gao, X.; Xu, Z. Identification and classification of urban commercial districts at block scale. Geogr. Res. 2015, 34, 1125–1134. [Google Scholar]
- ASOBU, Aimag Statistical Office of Bayan-Ulgii. Bayan-Ölgii Aimag Annual Statistical Report 2008. Available online: www.bayan-ulgii.nso.mn (accessed on 11 May 2010).
- DASO, Dornod Aimag Statistical Office. Dornod Aimag Statistic Office Annual Report 2007. Available online: www.dornod.nso.mn (accessed on 10 May 2010).
- NSOM, National Statistical Office of Mongolia. Annual Livestock Census Data 2007. Available online: http://www.1212.mn/tables.aspx?tbl_id=DT_NSO_1001_021V1&BAG_select_all=0&BAGSingleSelect=_0&TYPE_OF_LIVESTOCK_select_all=0&TYPE_OF_LIVESTOCKSingleSelect=_01&YearY_select_all=0&YearYSingleSelect=_2007&viewtype=table (accessed on 17 January 2019).
- Wu, Y.F.; Liu, Y.S.; Li, Y.R. Spatio-temporal coupling of demographic–landscape urbanization and its driving forces in China. J. Geogr. Sci. 2018, 28, 1–16. [Google Scholar]
- Department of Integrated Finance, Ministry of Construction. China’s Urban Construction Statistics Yearbook 2005; China Architecture & Building Press: Beijing, China, 2005.
- Elhorst, J.P. Matlab software for spatial panels. Int. Reg. Sci. Rev. 2012, 37, 389–405. [Google Scholar] [CrossRef]
- Elhorst, J.P. Spatial Panel data models. In Spatial Econometrics; Springer: Berlin/Heidelberg, Germany, 2013; pp. 37–93. [Google Scholar]
- Chen, Q. Advanced Econometrics and Stata Application; Higher Education Press: Beijing, China, 2014. [Google Scholar]
- Hayashi, F. Econometrics; Princeton University Press: Princeton, NJ, USA, 2000. [Google Scholar]
- Burridge, P. Testing for a common factor in a spatial autoregression model. Environ. Plan. A 1981, 13, 795–800. [Google Scholar] [CrossRef]
- Amarsaikhan, D.; Ganzorig, M.; Blotevogel, H.H.; Nergui, B.; Gantuya, R. Integrated method to extract information from high and very high resolution RS images for urban planning. J. Geogr. Reg. Plan. 2009, 2, 258–267. [Google Scholar]
- Bulganmurun, T. Assessment of Urban Air Pollution Abatement Policy Implementation VIS-Á-VIS the Role of Household Energy Use in Ger Areas of Mongolia. Master’s Dissertation, Delft University, Delft, The Netherlands, 2013. [Google Scholar]
- PGYP, The People’s Government of Yunnan Province. Arkhangai Province, Mongolia. Available online: http://www.yfao.gov.cn/yhcs1/201510/t20151013_334314.html (accessed on 13 October 2015).
- ZASO, Zavkhan Aimag Statistic Office. Zavkhan Aimag Statistic Office Annual Report 2011. Available online: www.zavkhan.nso.mn (accessed on 21 August 2014).
- TAO, Töv Aimag Office. Census 2008 Töv Aimag Official Report. Available online: www.tuv.nso.mn (accessed on 11 May 2011).
- SOCC, Statistical Office of the Capital City. 2016 Statistical Yearbook of Ulaanbaatar. Available online: www.ubstat.mn (accessed on 2 January 2018).
- Yi, L. Neoliberalism and the process of urbanization of the herdsmen in Mongolia: A survey of the “ger area” in Ulaanbaatar. Consensus 2015, 12, 48–49. [Google Scholar]
- Anudali. Economic and Trade Cooperation between China and Mongolia. Master’s Dissertation, Heilongjiang University, Harbin, China, 2013. [Google Scholar]
- Zuo, L.B. On Development Problems of Sino-Mongolian Border Trade. Master’s Dissertation, East China University of Science and Technology, Shanghai, China, 2013. [Google Scholar]
- ECCOEPPCM, Economic and Commercial Counsellor’s Office of the Embassy of the People’s Republic of China in Mongolia. Overall Situation of Mongolia’s National Economy in 2016. Available online: http://mn.mofcom.gov.cn/article/ztdy/201701/20170102507998.shtml (accessed on 25 January 2017).
- Badamdorj, C. Changes in the Internal Structure of Ulaanbaatar, Mongolia. Sci. Annu. Korea Mong. Econ. Assoc. 2004, 14, 1–15. [Google Scholar]
- Xu, M.R.; He, C.F.; Liu, X. Research on relationship between large enterprise growth and urban development. Urban Dev. Stud. 2018, 25, 88–96. [Google Scholar]
- Sternberg, T. Investigating the presumed causal links between drought and dzud in Mongolia. Nat. Hazards 2017, 2, 1–17. [Google Scholar] [CrossRef]
- Anderson, R.; Hooper, M.; Tuvshinbat, A. Towers on the steppe: Compact city plans and local perceptions of urban densification in Ulaanbaatar, Mongolia. J. Urban. Int. Res. Placemak. Urban Sustain. 2017, 10, 217–230. [Google Scholar] [CrossRef]
- Li, Y.B.; Zhu, D.J.; Wang, H.M. Choice of new public service-oriented development mode of urban historic districts: An empirical study of residents’ satisfaction in Shanghai city. City Plan. Rev. 2016, 40, 51–60. [Google Scholar]
- Christopher, Z.; Poduje, I.; Foutz, W.; Ben-Joseph, E.; Figueroa, O. Indicators for Sustainable Urban Development. In Part of the Alliance for Global Sustainability Book Series Science and Technology: Tools for Sustainable Development Book Series (AGSB, Volume 5); Springer: Dordrecht, The Netherlands, 2004; pp. 157–189. [Google Scholar]
- Bishop, J.A.; Martin, P.; Poon, L.; Johnson, M.A. Exploring Positive and Negative Affect as Key Indicators of Life Satisfaction among Centenarians: Does Cognitive Performance Matter? J. Aging Res. 2011, 2011, 953031. [Google Scholar] [CrossRef] [PubMed]
© 2019 by the authors. Licensee MDPI, Basel, Switzerland. This article is an open access article distributed under the terms and conditions of the Creative Commons Attribution (CC BY) license (http://creativecommons.org/licenses/by/4.0/).