Disaster Aid Targeting and Self-Reporting Bias: Natural Experimental Evidence from the Philippines

Abstract
1. Introduction
2. Data
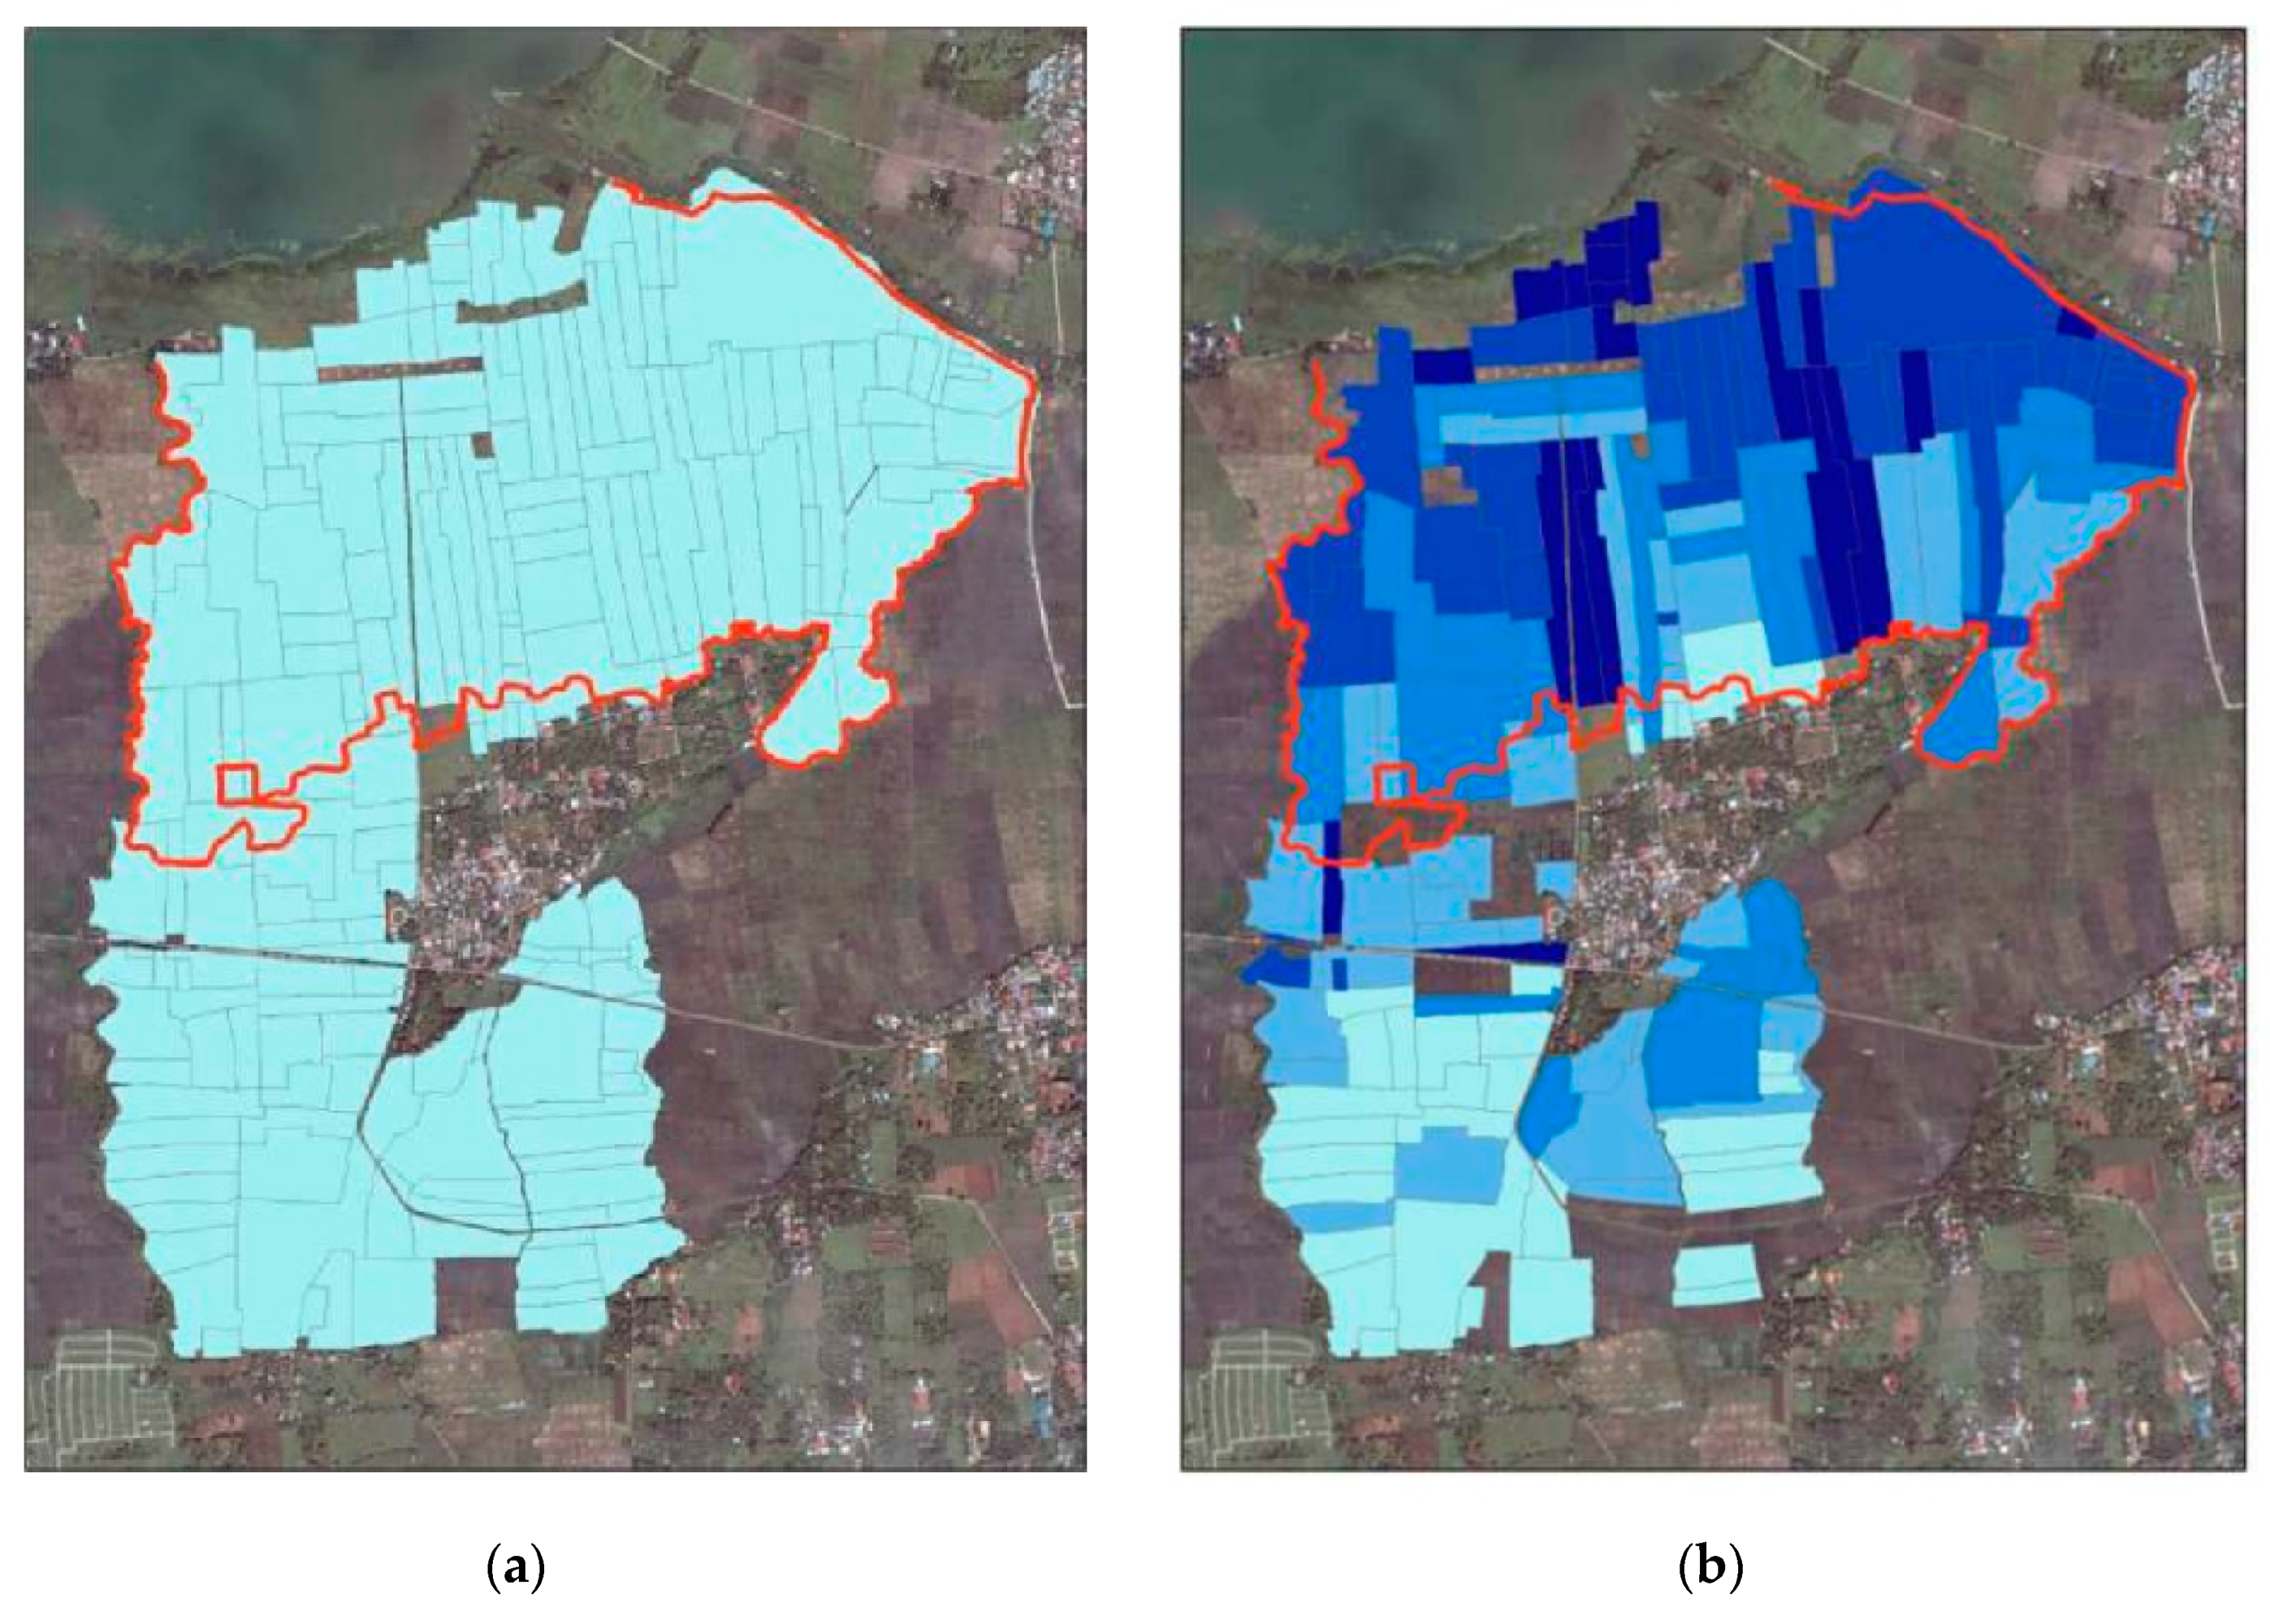
2.1. The 2012 Habagat Flooding
2.2. Study Site
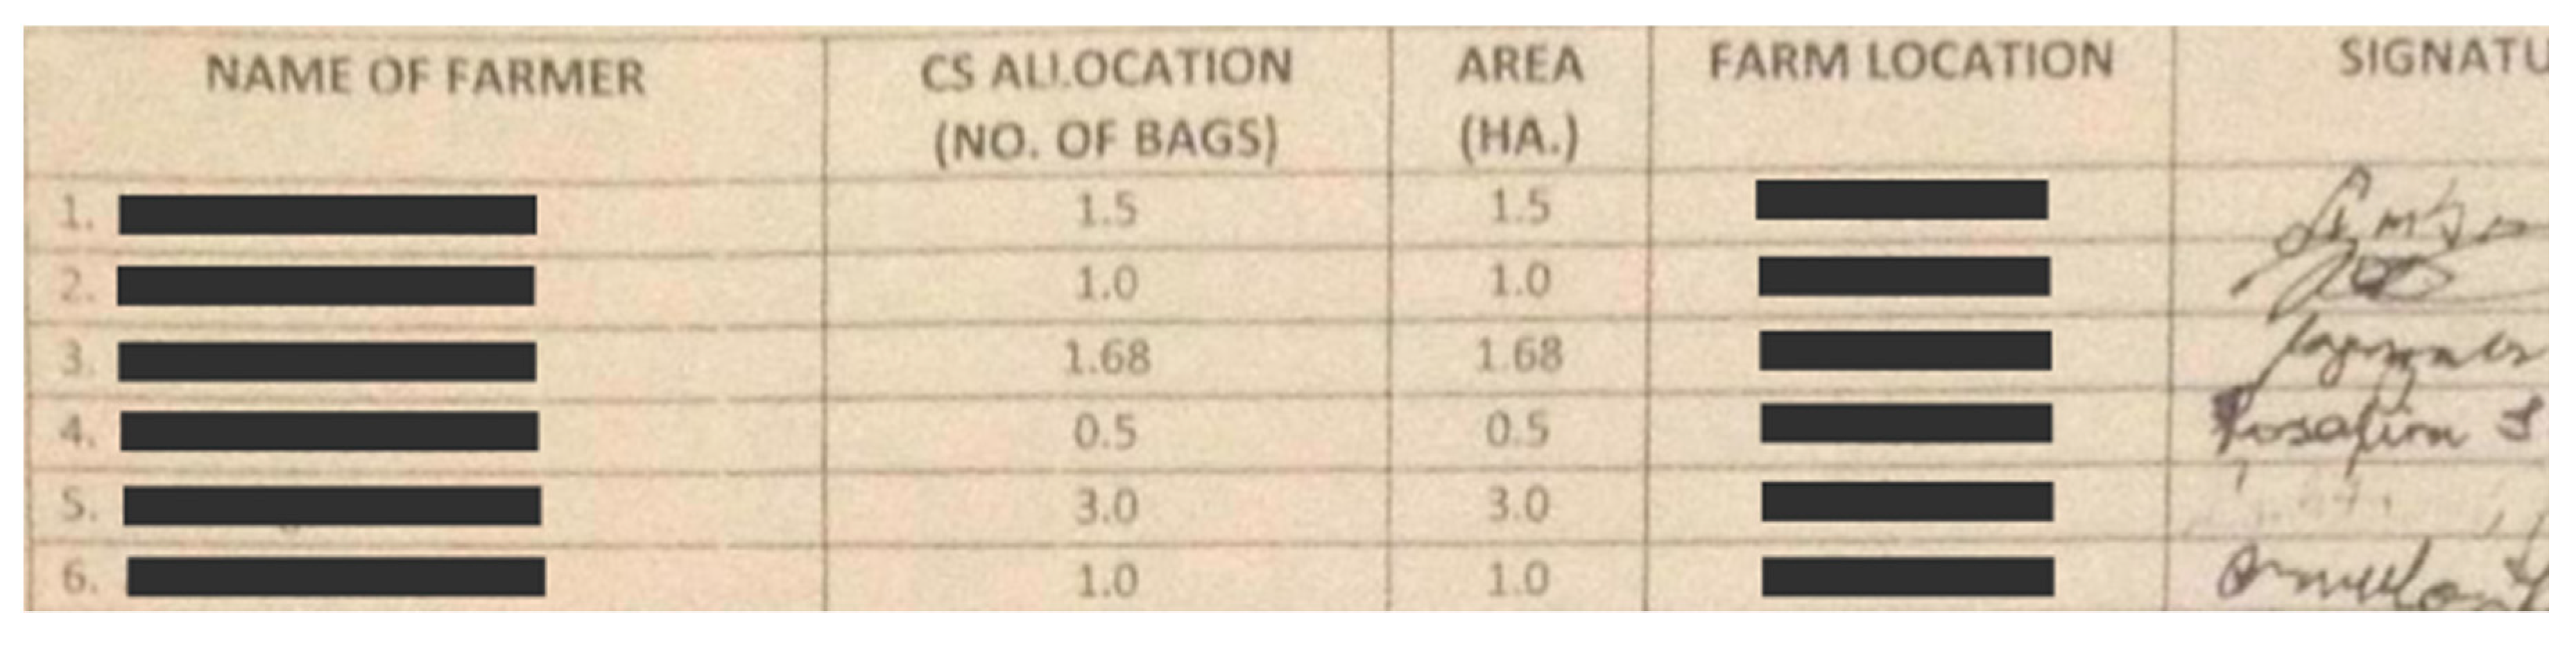
2.3. Data
3. Descriptive Analyses
3.1. Damage
3.2. Disaster Aid
3.3. Self-Reporting Bias
3.4. Accuracy of Targeting
4. Regression Analyses
4.1. Sample Farmer Characteristics and Exogeneity Test
4.2. Regression Results
5. Conclusions
Author Contributions
Funding
Acknowledgments
Conflicts of Interest
References
- CRED (Centre for Research on the Epidemiology of Disasters). Natural Disasters 2017; CRED: Brussels, Belgium, 2018; Available online: https://cred.be/sites/default/files/adsr_2017.pdf (accessed on 20 December 2018).
- Kahn, M.E. The death toll from natural disasters: The role of income, geography, and institutions. Rev. Econ. Stat. 2005, 87, 271–284. [Google Scholar] [CrossRef]
- Noy, I.; Yonson, R. Economic Vulnerability and Resilience to Natural hazards: A survey of concepts and measurements. Sustainability 2018, 10, 2850. [Google Scholar] [CrossRef]
- Aldrich, D.P.; Sawada, Y.; Oum, S. Resilience and Recovery in Asian Disasters; Springer: Tokyo, Japan, 2015. [Google Scholar]
- Morris, S.; Neidecker-Gonzales, O.; Carletto, C.; Munguia, M.; Wodon, Q. Hurricane Mitch and the livelihood of the rural poor in Honduras. World Dev. 2002, 30, 49–60. [Google Scholar] [CrossRef]
- Shoji, M. Religious fractionalisation and crimes in disaster-affected communities: Survey evidence from Bangladesh. J. Dev. Stud. 2018, 54, 1891–1911. [Google Scholar] [CrossRef]
- Strömberg, D. Natural disasters, economic development, and humanitarian aid. J. Econ. Perspect. 2007, 21, 199–222. [Google Scholar] [CrossRef]
- Abdulai, A.; Barrett, C.B.; Hoddinott, J. Does food aid really have disincentive effects? New evidence from sub-Saharan Africa. World Dev. 2005, 33, 1689–1704. [Google Scholar] [CrossRef]
- Galasso, E.; Ravallion, M. Decentralized targeting of an antipoverty program. J. Public Econ. 2005, 89, 705–727. [Google Scholar] [CrossRef]
- Jayne, T.S.; Strauss, J.; Yamano, T.; Molla, D. Targeting of food aid in rural Ethiopia: Chronic need or inertia? J. Dev. Econ. 2002, 68, 247–288. [Google Scholar] [CrossRef]
- Alatas, V.; Banerjee, A.; Hanna, R.; Olken, B.A.; Tobias, J. Targeting the poor: Evidence from a field experiment in Indonesia. Am. Econ. Rev. 2012, 102, 1206–1240. [Google Scholar] [CrossRef] [PubMed]
- Alderman, H. Do local officials know something we don’t? Decentralization of targeted transfers in Albania. J. Public Econ. 2002, 83, 375–404. [Google Scholar] [CrossRef]
- Bardhan, P.; Mookherjee, D. Pro-poor targeting and accountability of local governments in West Bengal. J. Dev. Econ. 2006, 79, 303–327. [Google Scholar] [CrossRef]
- Hanna, R.; Olken, B.A. Universal basic incomes versus targeted transfers: Anti-poverty programs in developing countries. J. Econ. Perspect. 2018, 32, 201–226. [Google Scholar] [CrossRef]
- Amin, S.; Goldstein, M. Data Against Natural Disasters: Establishing Effective Systems for Relief, Recovery, and Reconstruction; The World Bank: Washington, DC, USA, 2008. [Google Scholar]
- Morris, S.; Wodon, Q. The allocation of natural disaster relief funds: Hurricane Mitch in Honduras. World Dev. 2003, 31, 1279–1289. [Google Scholar] [CrossRef]
- Takasaki, Y. Targeting cyclone relief within the village: Kinship, sharing, and capture. Econ. Dev. Cult. Chang. 2011, 59, 387–416. [Google Scholar] [CrossRef]
- Bound, J.; Brown, C.; Mathiowetz, N. Measurement error in survey data. In Handbook of Econometrics; Heckman, J., Leamer, E., Eds.; Elsevier: Amsterdam, The Netherlands, 2001; Volume 5, pp. 3705–3843. [Google Scholar]
- Gibson, J.; Kim, B. Measurement error in recall surveys and the relationship between household size and food demand. Am. J. Agric. Econ. 2007, 89, 473–489. [Google Scholar] [CrossRef]
- Kennickell, A.; Starr-McCluer, M. Retrospective reporting of household wealth: Evidence from the 1983–1989 survey of consumer finances. J. Bus. Stat. Econ. Stat. 1997, 15, 452–463. [Google Scholar]
- Heltberg, R.; Oviedo, A.M.; Talukdar, F. What do household surveys really tell us about risk, shocks, and risk management in the developing world? J. Dev. Stud. 2015, 51, 209–225. [Google Scholar]
- Dell, M.; Jones, B.F.; Olken, B.A. What do we learn from the weather? The new climate-economy literature. J. Econ. Lit. 2014, 52, 740–798. [Google Scholar] [CrossRef]
- Sawada, Y.; Kuroishi, Y. How does a natural disaster affect people’s preference? The case of a large scale flood in the Philippines using the convex time budget experiments. In Disaster, Risks, Social Preferences, and Policy Effects: Field Experiments in Selected ASEAN and East Asian Countries; Sawada, Y., Oum, S., Eds.; Economic Research Institute for ASEAN and East Asia (ERIA): Jakarta, Indonesia, 2015. [Google Scholar]
- NDRRMC (National Disaster Risk Reduction and Management Council). Update: SitRep No. 20: Re Effects of South-west Monsoon Enhanced by Typhoon Haikui; NDRRMC: Manila, Philippines, 2012. Available online: http://ndrrmc.gov.ph/2-uncategorised/2051-effects-of-southwest-monsoon-enhanced-by-tropical-storm-haikui (accessed on 20 December 2018).
- Sawada, Y.; Higuchi, Y.; Kajisa, K.; Fuwa, N.; Marciano, E.B.; Estudillo, J.P. The East Laguna Village: Four decades of studies in a Filipino village. In PRIMCED Discussion Paper Series No. 18; Hitotsubashi University: Tokyo, Japan, 2012. [Google Scholar]
- Coady, D.; Grosh, M.; Hoddinott, J. Targeting of Transfers in Developing Countries: Review of Lessons and Experience; The World Bank: Washington, DC, USA, 2004. [Google Scholar]
- Muralidharan, K.; Niehaus, P.; Sukhtankar, S. Building state capacity: Evidence from biometric smartcards in India. Am. Econ. Rev. 2016, 106, 2895–2929. [Google Scholar] [CrossRef]


| (1) | (2) | |
|---|---|---|
| Mean | SD | |
| Damage (satellite image) | ||
| Paddy submerged (1 = yes) | 0.60 | |
| Damage (self-report) | ||
| Paddy submerged (1 = yes) | 0.76 | |
| Income declined (1 = yes) | 0.42 | |
| Loss in rice harvest (PHP) 1 | 112,816 | 170,396 |
| House submerged (1 = yes) | 0.02 | |
| Asset lost (1 = yes) | 0.02 | |
| Household member got sick/injured (1 = yes) | 0.01 | |
| Aid (administrative record) | ||
| Seed aid (1 = yes) | 0.57 | |
| Amount of seed aid (# of bags) 2 | 1.39 | 1.97 |
| Aid (self-report) | ||
| Seed aid (1 = yes) | 0.43 | |
| Fertilizer aid (1 = yes) | 0.05 | |
| Aid from local government (PHP) | 1012 | 2790 |
| Aid from local non-governmental organization (NGO) (PHP) | 8 | 91 |
| Aid from local church (PHP) | 1 | 14 |
| Aid from local politician (PHP) | 5 | 33 |
| Number of observations | 122 | |
| Paddy submerged (self-report) | |||
|---|---|---|---|
| Paddy submerged (satellite image) | Yes | No | Total |
| (1) Yes | 70 (96) | 3 (4) | 73 (100) |
| (2) No | 23 (47) | 26 (53) | 49 (100) |
| (3) Total | 93 (76) | 29 (24) | 122 (100) |
| (4) Correlation coefficient | 0.56 | ||
| (5) p-value for Pearson’s chi-squared test | 0.000 | ||
| (6) Number of observations | 122 | ||
| Seed aid (self-report) | |||
|---|---|---|---|
| Seed aid (administrative record) | Yes | No | Total |
| (1) Yes | 39 (57) | 30 (43) | 69 (100) |
| (2) No | 13 (25) | 40 (75) | 53 (100) |
| (3) Total | 52 (43) | 70 (57) | 122 (100) |
| (4) Correlation coefficient | 0.32 | ||
| (5) p-value for Pearson’s chi-squared test | 0.000 | ||
| (6) Number of observations | 122 | ||
| Paddy submerged (satellite image) | |||
|---|---|---|---|
| Seed aid (administrative record) | Yes | No | Total |
| (1) Yes | 55 (80) | 14 (20) | 69 (100) |
| (2) No | 18 (34) | 35 (66) | 53 (100) |
| (3) Total | 73 (60) | 49 (40) | 122 (100) |
| (4) Correlation coefficient | 0.46 | ||
| (5) p-value for Pearson’s chi-squared test | 0.000 | ||
| (6) Number of observations | 122 | ||
| Paddy submerged (self-report) | |||
|---|---|---|---|
| Seed aid (self-report) | Yes | No | Total |
| (1) Yes | 44 (85) | 8 (15) | 52 (100) |
| (2) No | 49 (70) | 21 (30) | 70 (100) |
| (3) Total | 93 (76) | 29 (24) | 122 (100) |
| (4) Correlation coefficient | 0.17 | ||
| (5) p-value for Pearson’s chi-squared test | 0.061 | ||
| (6) Number of observations | 122 | ||
| (1) | (2) | (3) | (4) | (5) | |
|---|---|---|---|---|---|
| Paddy submerged (satellite image) | Yes | No | Difference | ||
| Mean | SD | Mean | SD | P-value | |
| Gender (1 = male) | 0.89 | 0.36 | 0.88 | 0.33 | 0.84 |
| Age | 58.0 | 12.70 | 56.3 | 14.55 | 0.51 |
| Schooling years | 9.7 | 3.80 | 9.8 | 3.99 | 0.90 |
| # of children (under 15) in HH | 1.1 | 1.19 | 1.3 | 1.29 | 0.42 |
| # of adult (15 to 65) in HH | 2.7 | 1.65 | 3.2 | 1.63 | 0.15 |
| # of elderly (above 65) in HH | 0.4 | 0.75 | 0.5 | 0.71 | 0.70 |
| Per capita weekly consumption 1 | 1324 | 941.8 | 1161 | 849.0 | 0.34 |
| Migrant household (1 = yes) | 0.27 | 0.45 | 0.16 | 0.37 | 0.16 |
| Land size (Ha) | 3.3 | 4.56 | 2.3 | 3.56 | 0.22 |
| Number of observations | 73 | 49 | 122 | ||
| (1) | (2) | (3) | (4) | |
|---|---|---|---|---|
| Seed Aid (administrative record) (1 = yes) | Seed Aid (self-report) (1 = yes) | |||
| Paddy submerged (satellite image) | 0.47 *** | 0.45 *** | ||
| (1 = yes) | (5.66) | (5.25) | ||
| Paddy submerged (self-report) | 0.20 ** | 0.19 * | ||
| (1 = yes) | (2.00) | (1.88) | ||
| Gender | 0.020 | −0.19 | ||
| (1 = male) | (0.17) | (−1.37) | ||
| Age | 0.0020 | 0.0022 | ||
| (0.46) | (0.47) | |||
| Schooling years | −0.026 ** | −0.0050 | ||
| (−2.24) | (-0.40) | |||
| # of children (under 15) in HH | −0.0031 | −0.030 | ||
| (−0.10) | (−0.80) | |||
| # of adult (15 to 65) in HH | 0.012 | −0.026 | ||
| (0.42) | (−0.78) | |||
| # of elderly (above 65) in HH | −0.050 | −0.17 * | ||
| (−0.52) | (−1.83) | |||
| Per capita weekly consumption | 0.091 * | −0.0026 | ||
| (/1000) | (1.73) | (−0.06) | ||
| Migrant household | −0.10 | −0.20 * | ||
| (1 = yes) | (−0.99) | (−1.92) | ||
| Land size (Ha) | 0.027 * | −0.00091 | ||
| (1.96) | (−0.07) | |||
| R squared | 0.214 | 0.304 | 0.029 | 0.121 |
| Adjusted R squared | 0.207 | 0.238 | 0.021 | 0.037 |
| p-value for H0: the coefficient of damage is equal to one | 0.00 | 0.00 | 0.00 | 0.00 |
| Number of observations | 122 | 116 | 122 | 116 |
| (1) | (2) | (3) | (4) | |
|---|---|---|---|---|
| Seed Aid (administrative record) (1 = yes) | Seed Aid (self-report) (1 = yes) | |||
| Paddy submerged (satellite image) | 0.47 *** | 0.49 *** | ||
| (1 = yes) | (5.02) | (4.87) | ||
| Paddy submerged (self-report) | 0.20 * | 0.20 * | ||
| (1 = yes) | (1.87) | (1.79) | ||
| Gender | 0.021 | −0.20 | ||
| (1 = male) | (0.14) | (−1.41) | ||
| Age | 0.0024 | 0.0021 | ||
| (0.44) | (0.42) | |||
| Schooling years | −0.034 ** | −0.057 | ||
| (−2.21) | (−0.42) | |||
| # of children (under 15) in HH | −0.0064 | −0.035 | ||
| (−0.16) | (−0.87) | |||
| # of adult (15 to 65) in HH | 0.023 | −0.031 | ||
| (0.62) | (−0.86) | |||
| # of elderly (above 65) in HH | −0.054 | −0.19 * | ||
| (−0.46) | (−1.85) | |||
| Per capita weekly consumption | 0.13 * | −0.042 | ||
| (/1000) | (1.87) | (−0.08) | ||
| Migrant household | −0.12 | −0.21 * | ||
| (1 = yes) | (−0.98) | (−1.91) | ||
| Land size (Ha) | 0.037 * | −0.0027 | ||
| (1.66) | (−0.17) | |||
| Pseudo R-squared | 0.161 | 0.249 | 0.022 | 0.095 |
| Number of observations | 122 | 116 | 122 | 116 |
© 2019 by the authors. Licensee MDPI, Basel, Switzerland. This article is an open access article distributed under the terms and conditions of the Creative Commons Attribution (CC BY) license (http://creativecommons.org/licenses/by/4.0/).
Share and Cite
Higuchi, Y.; Fuwa, N.; Kajisa, K.; Sato, T.; Sawada, Y. Disaster Aid Targeting and Self-Reporting Bias: Natural Experimental Evidence from the Philippines. Sustainability 2019, 11, 771. https://doi.org/10.3390/su11030771
Higuchi Y, Fuwa N, Kajisa K, Sato T, Sawada Y. Disaster Aid Targeting and Self-Reporting Bias: Natural Experimental Evidence from the Philippines. Sustainability. 2019; 11(3):771. https://doi.org/10.3390/su11030771
Chicago/Turabian StyleHiguchi, Yuki, Nobuhiko Fuwa, Kei Kajisa, Takahiro Sato, and Yasuyuki Sawada. 2019. "Disaster Aid Targeting and Self-Reporting Bias: Natural Experimental Evidence from the Philippines" Sustainability 11, no. 3: 771. https://doi.org/10.3390/su11030771
APA StyleHiguchi, Y., Fuwa, N., Kajisa, K., Sato, T., & Sawada, Y. (2019). Disaster Aid Targeting and Self-Reporting Bias: Natural Experimental Evidence from the Philippines. Sustainability, 11(3), 771. https://doi.org/10.3390/su11030771