Simulation of Drainage Capacity in a Coastal Nuclear Power Plant under Extreme Rainfall and Tropical Storm


Abstract
1. Introduction
2. Mathematical Model
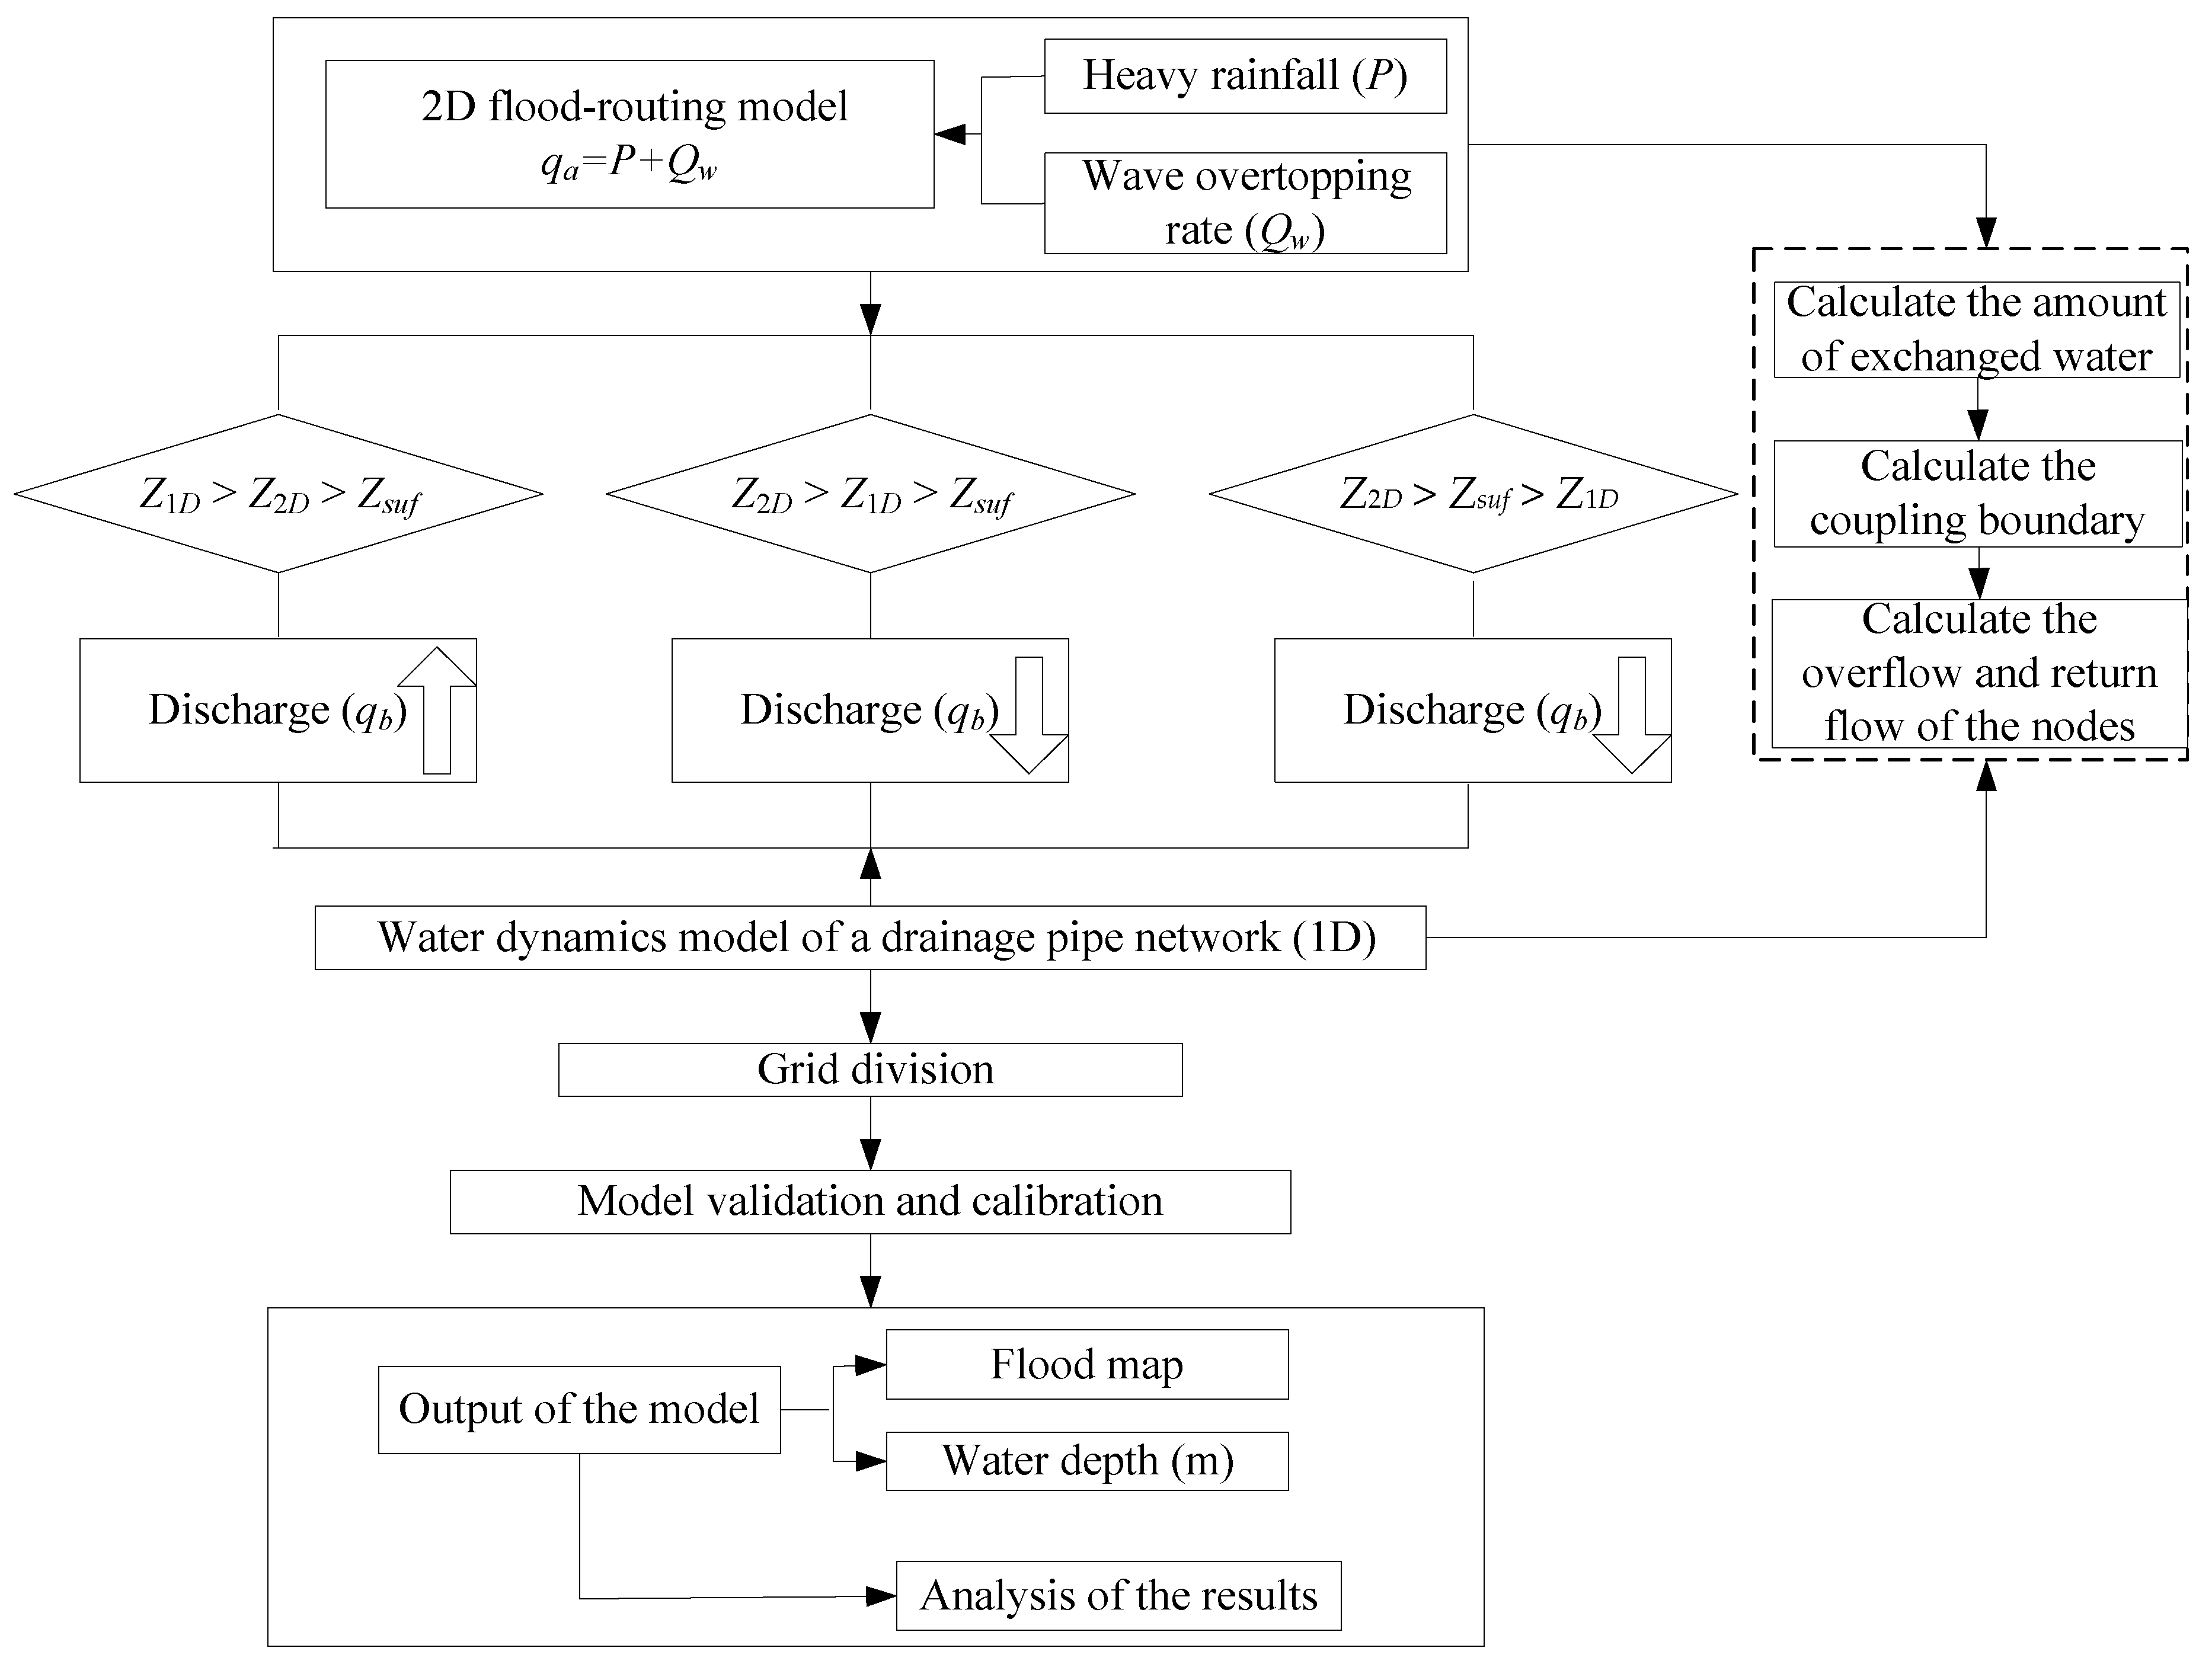
2.1. The 2D Flood-Routing Model
2.2. The Water Dynamics Model of a Drainage Pipe Network
2.3. Wave Overtopping Model
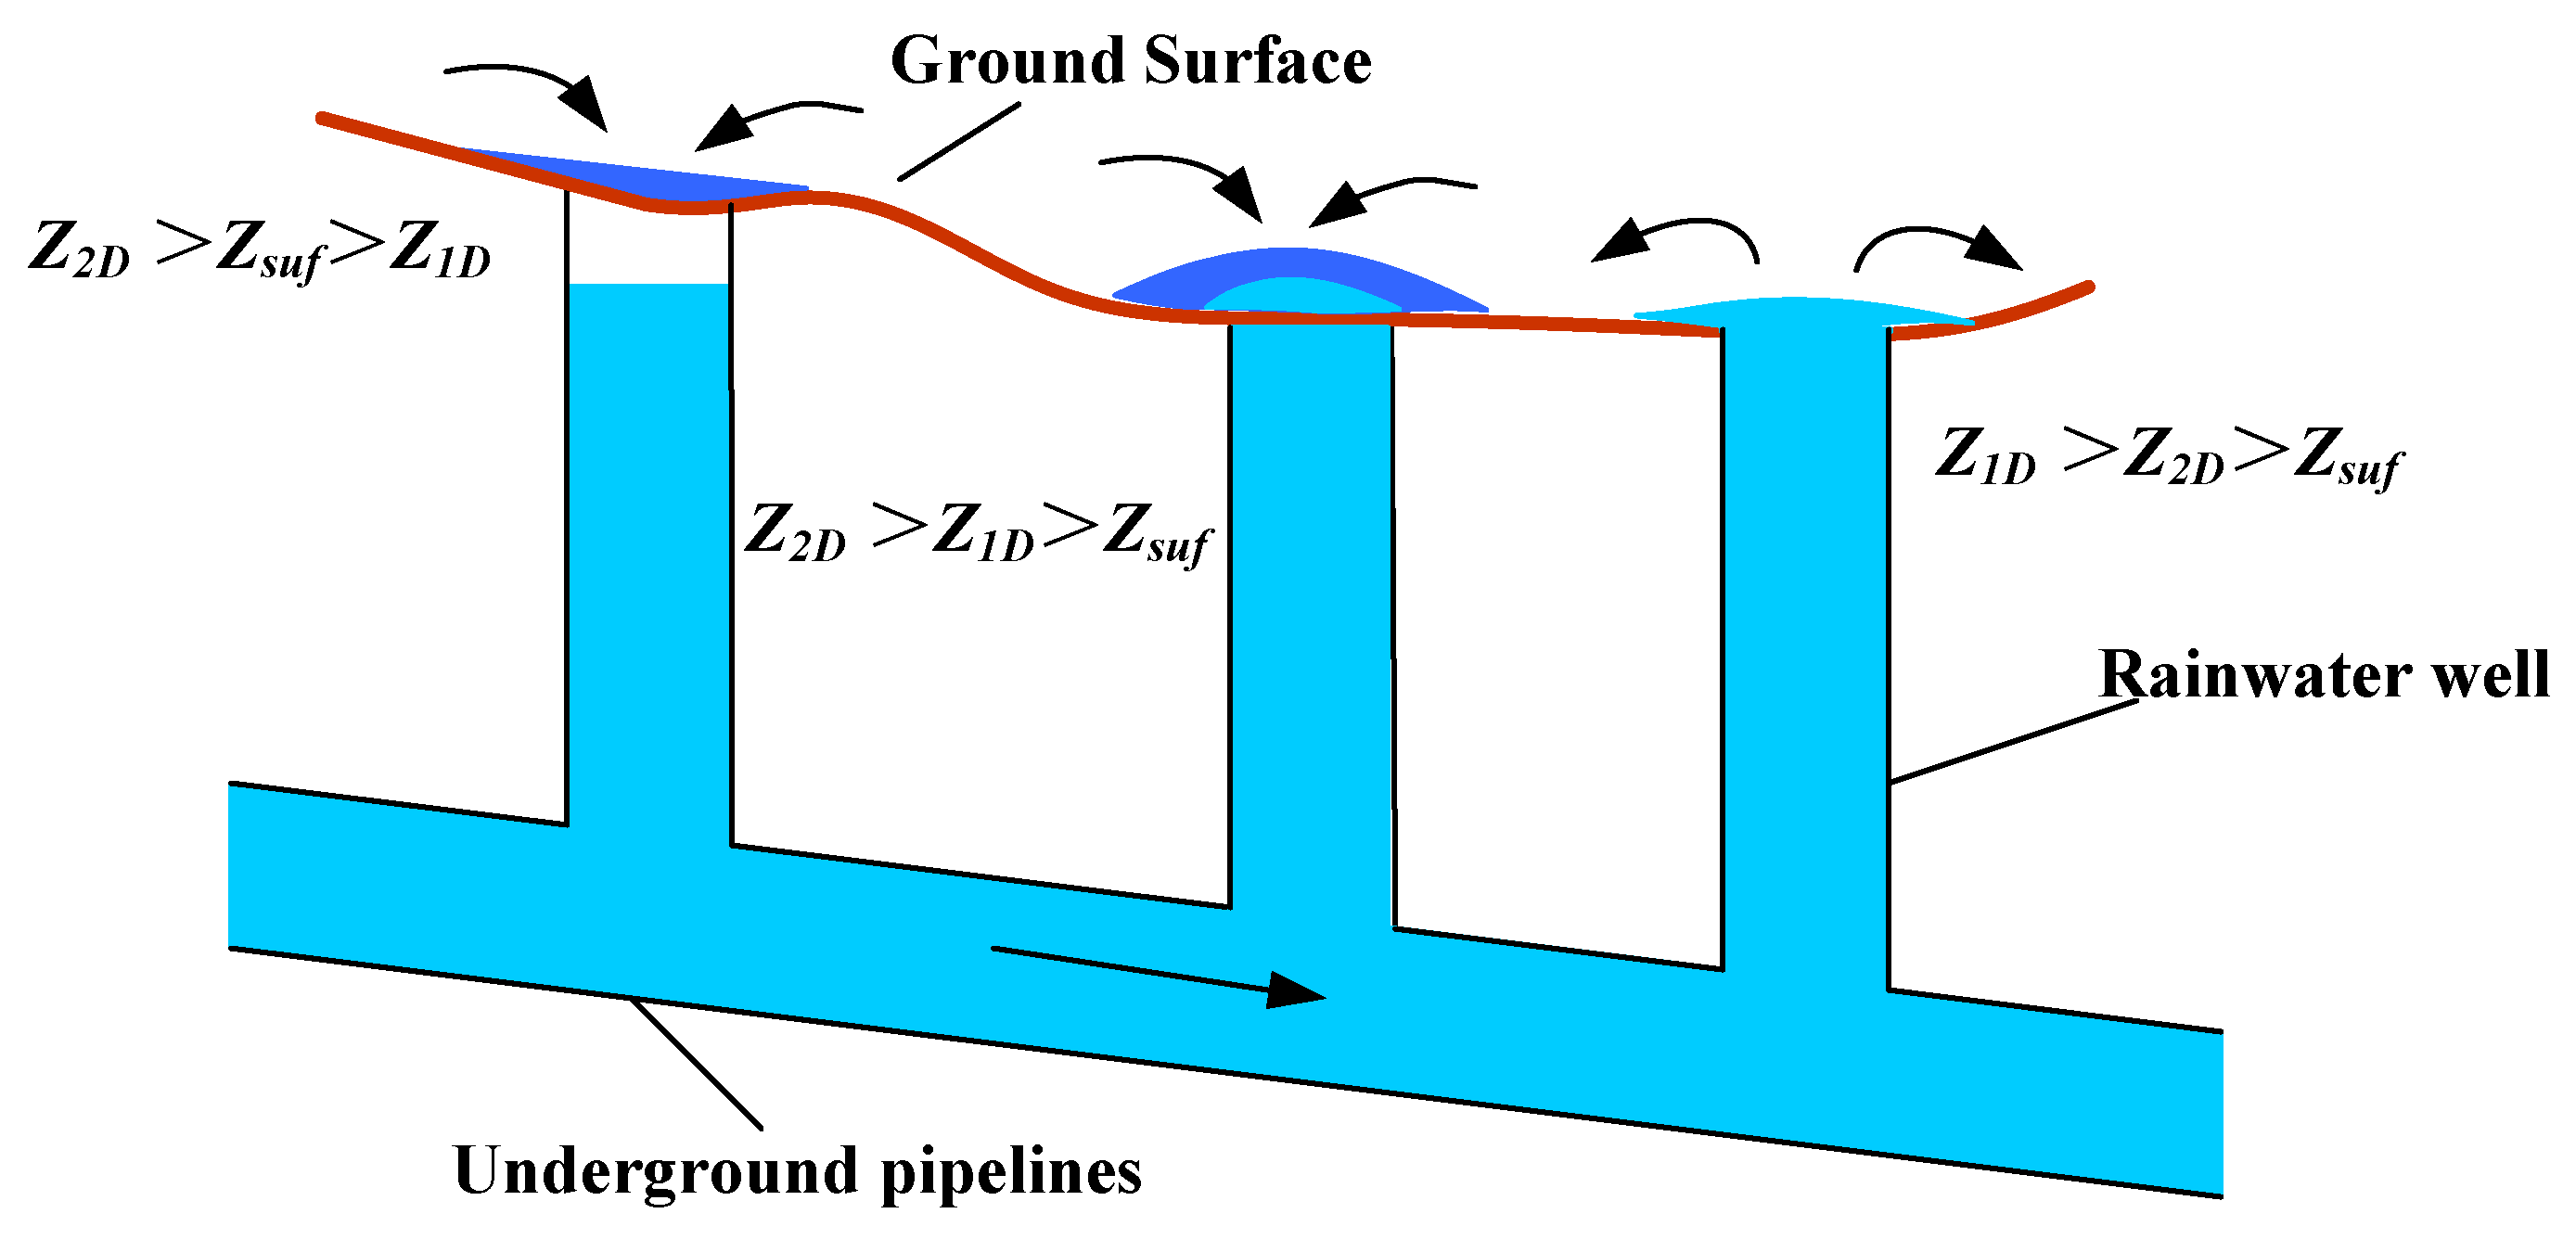
2.4. Coupling Calculation of Surface Runoff and Drainage Pipe Network Flow
3. Model Application
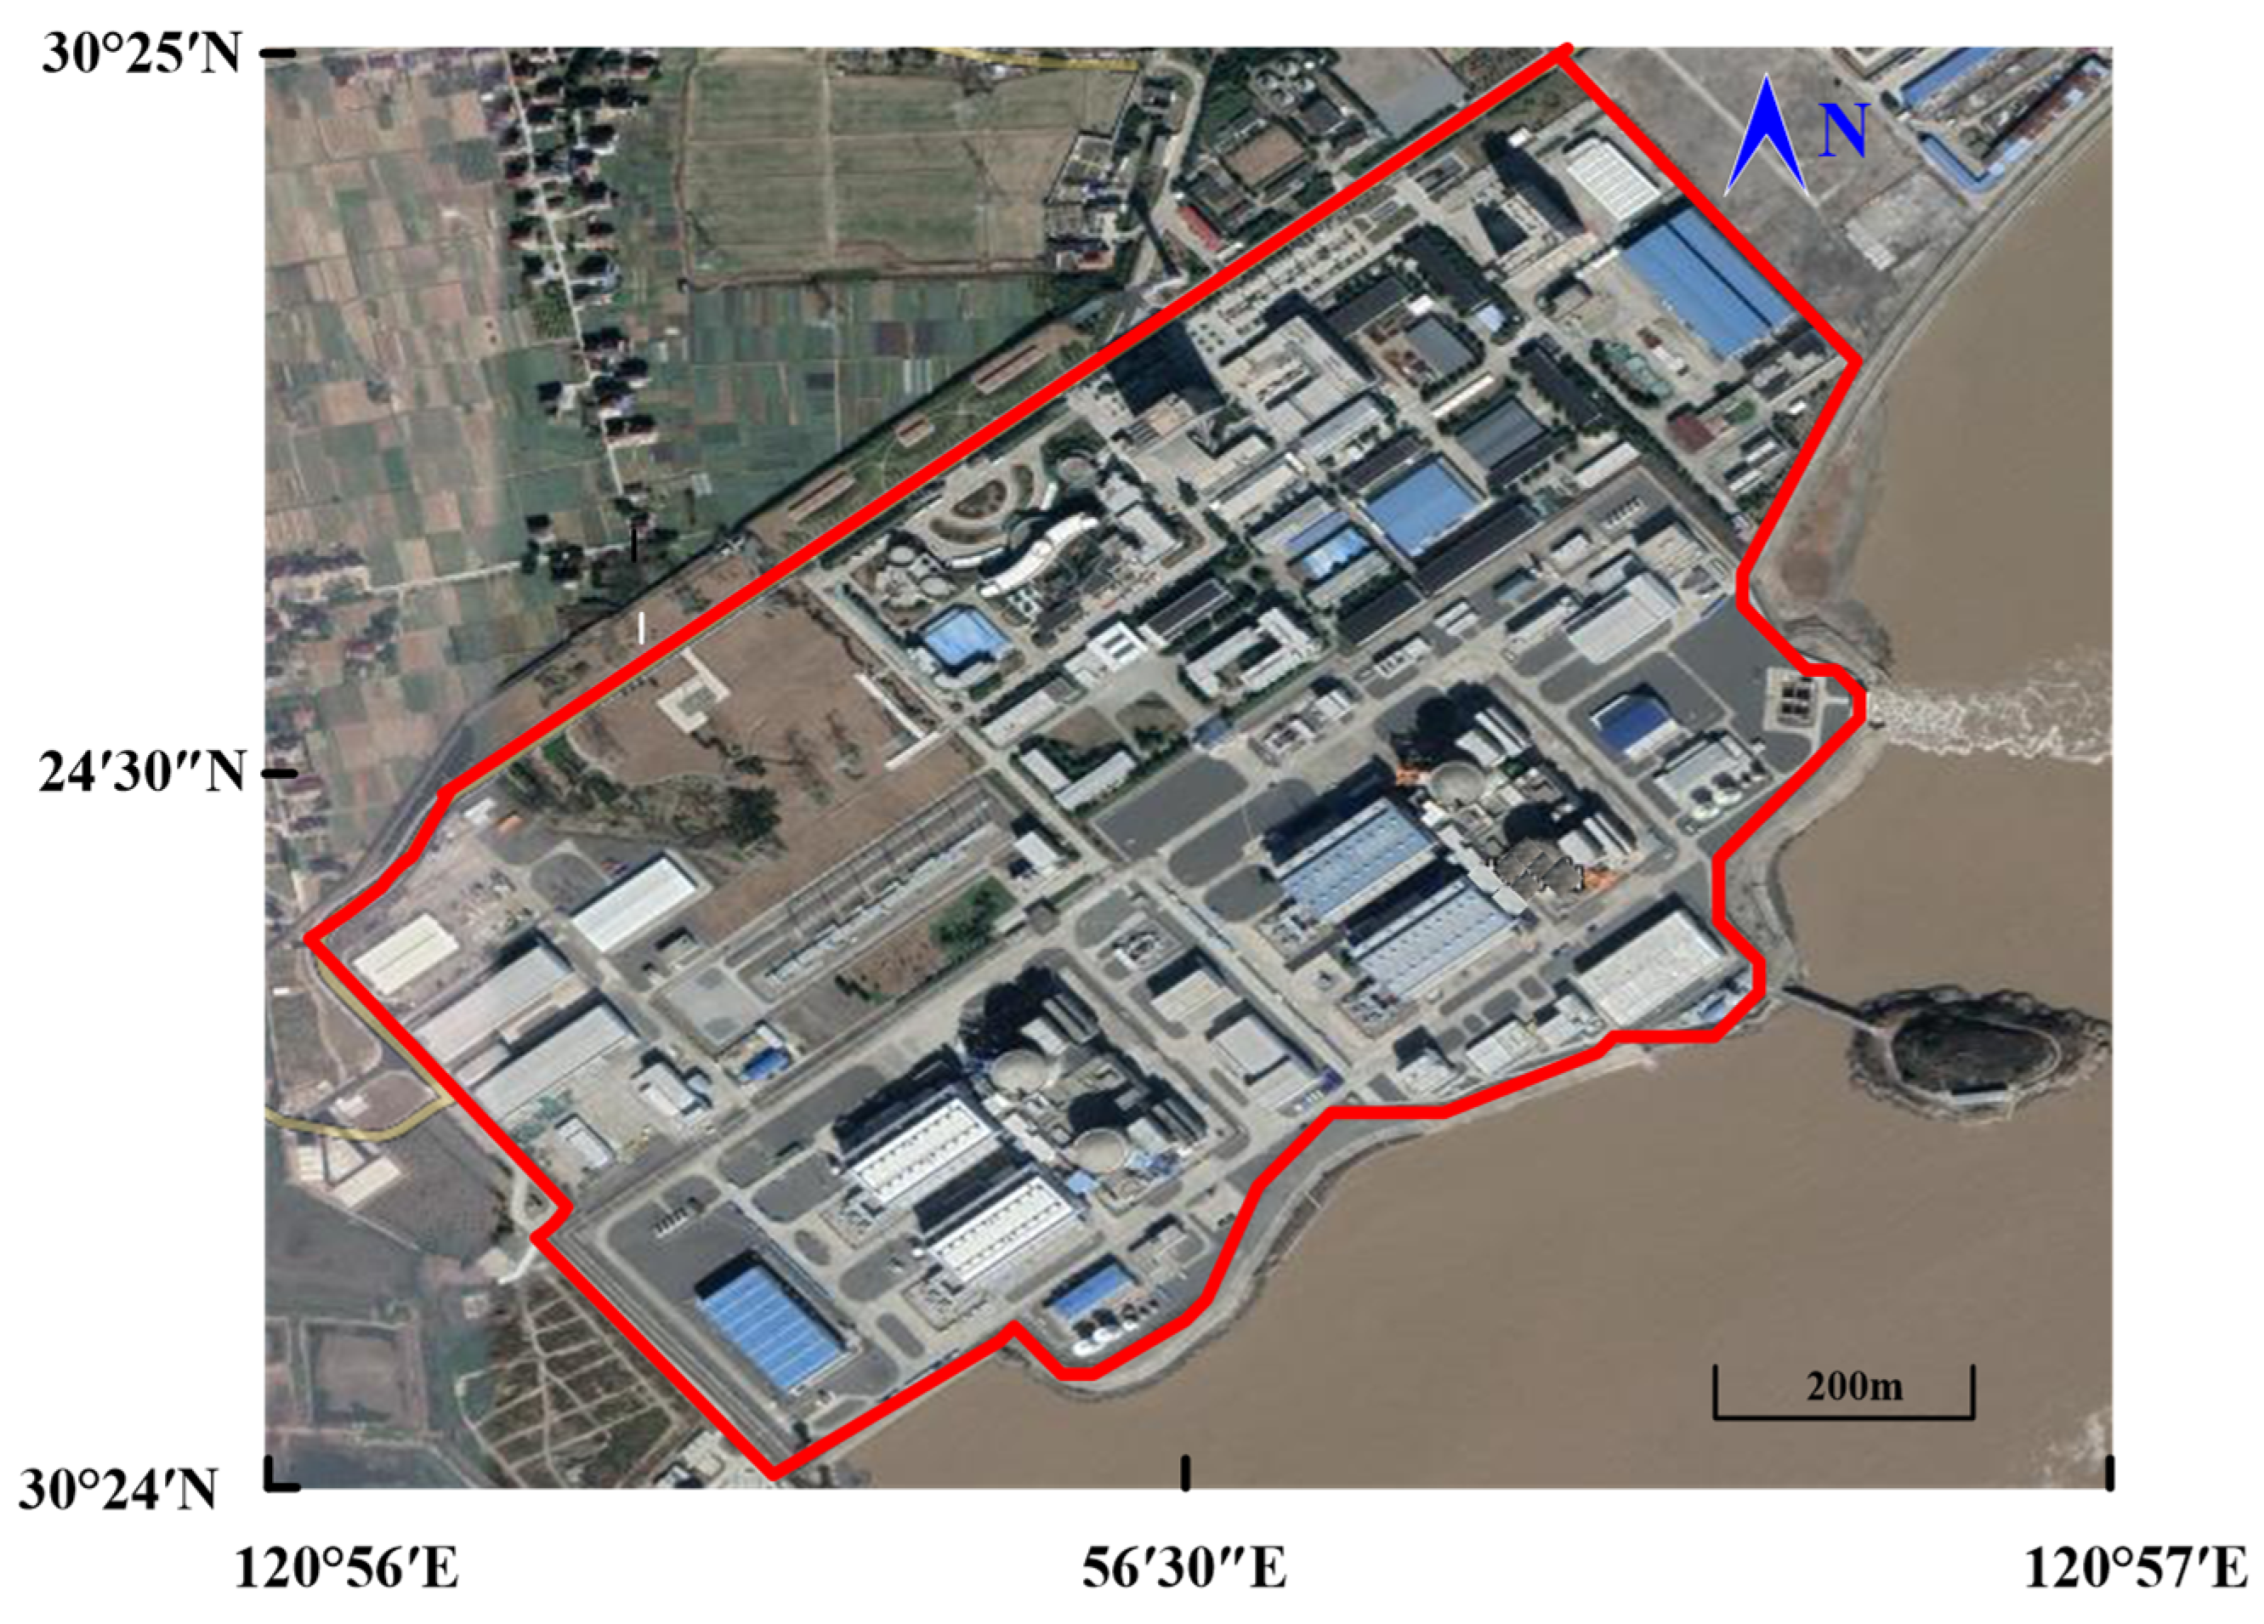
3.1. Description of Case Study Area
3.2. Calculation Area and Grid Division
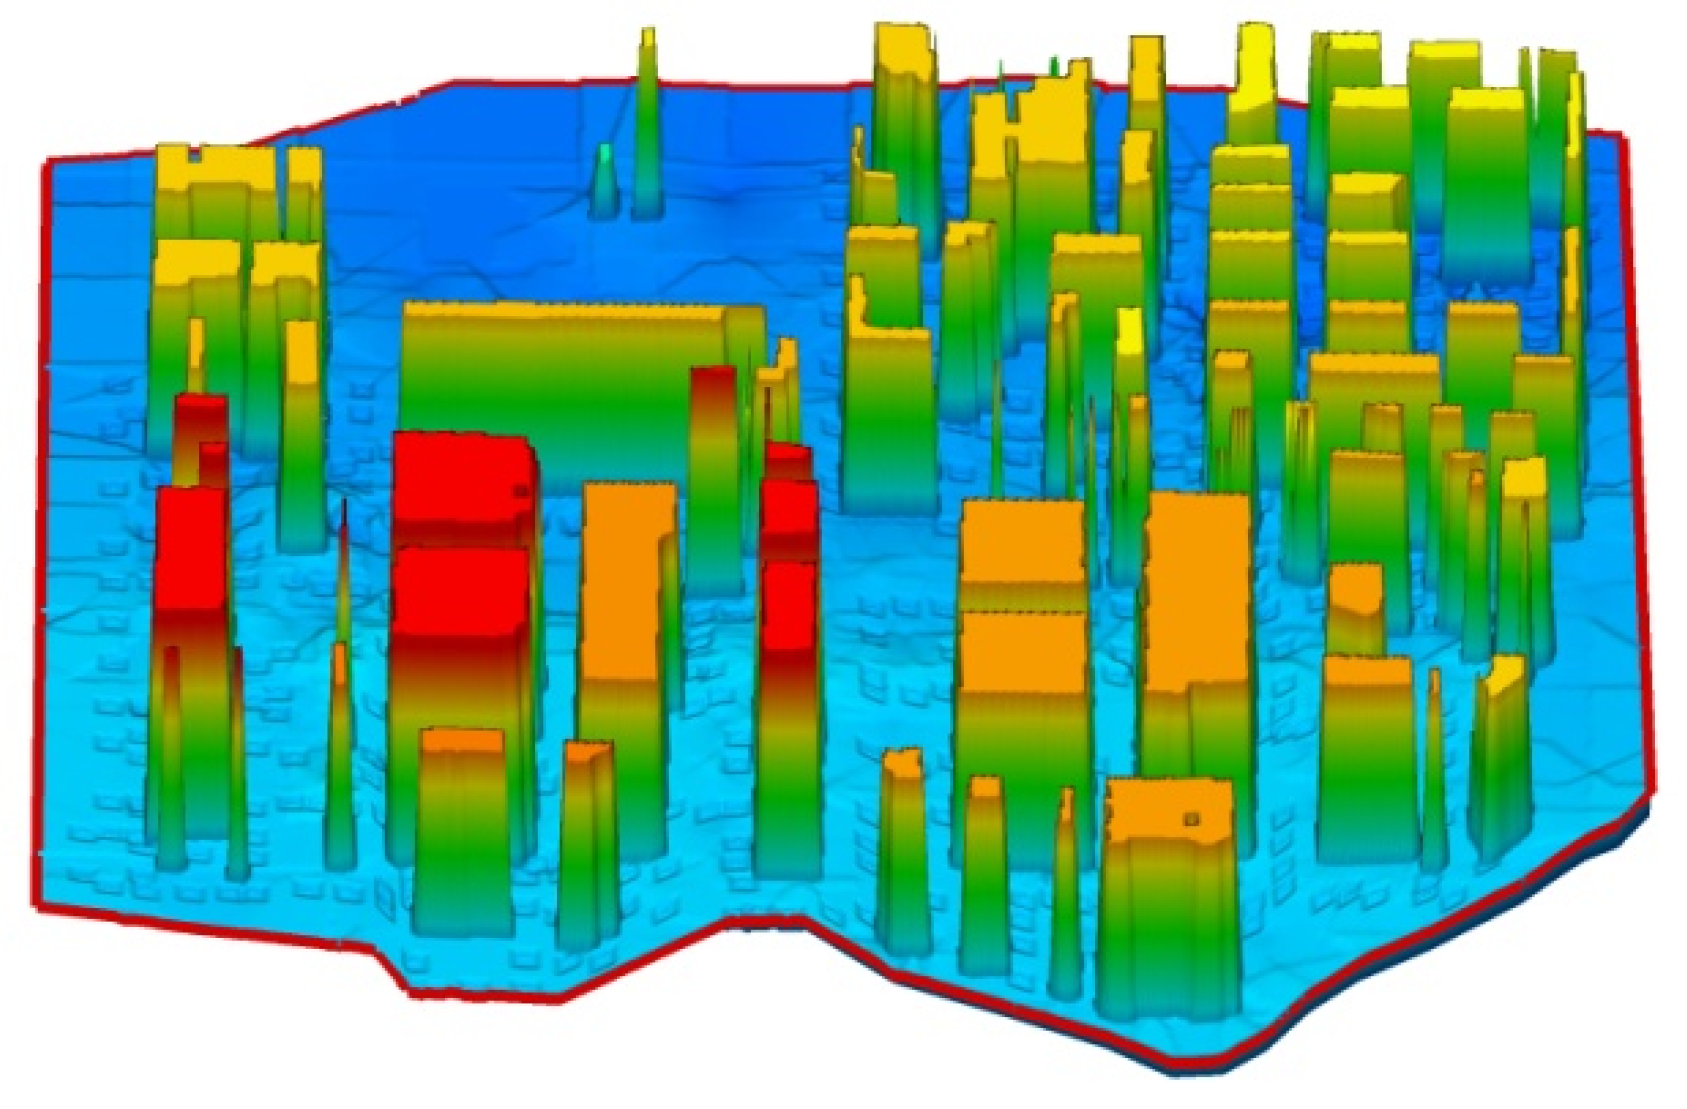
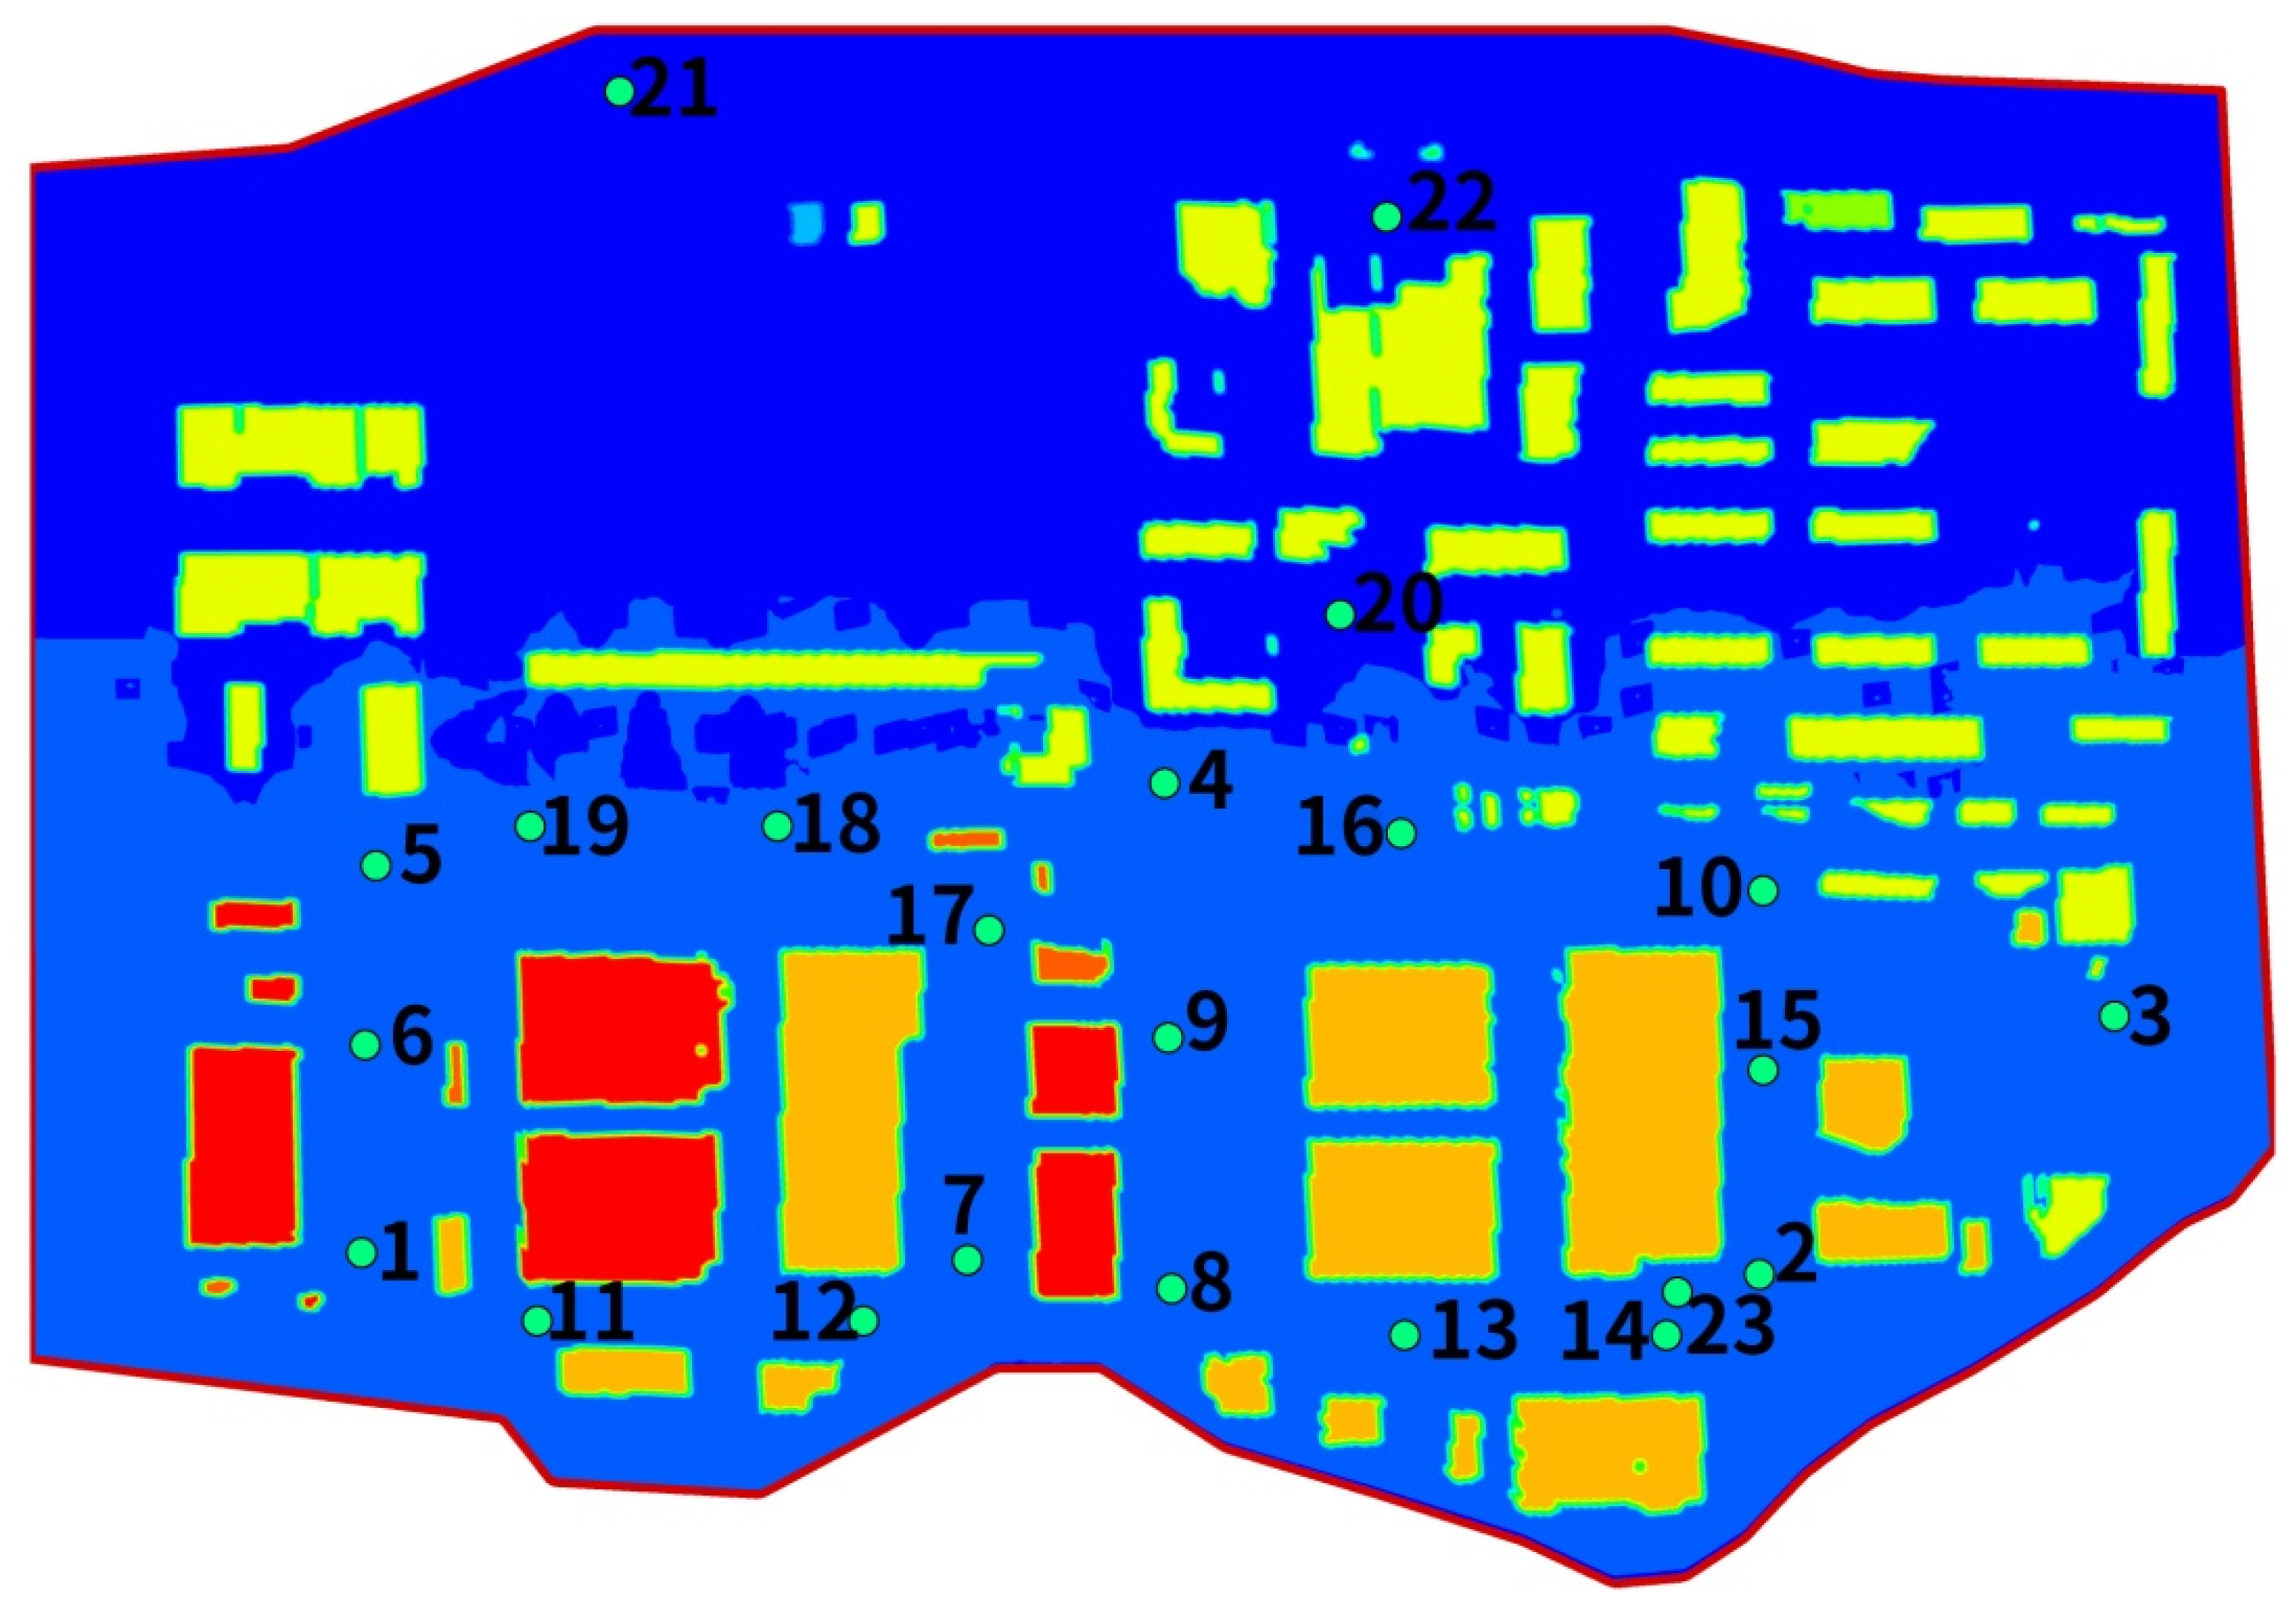
3.2.1. Generalized Building
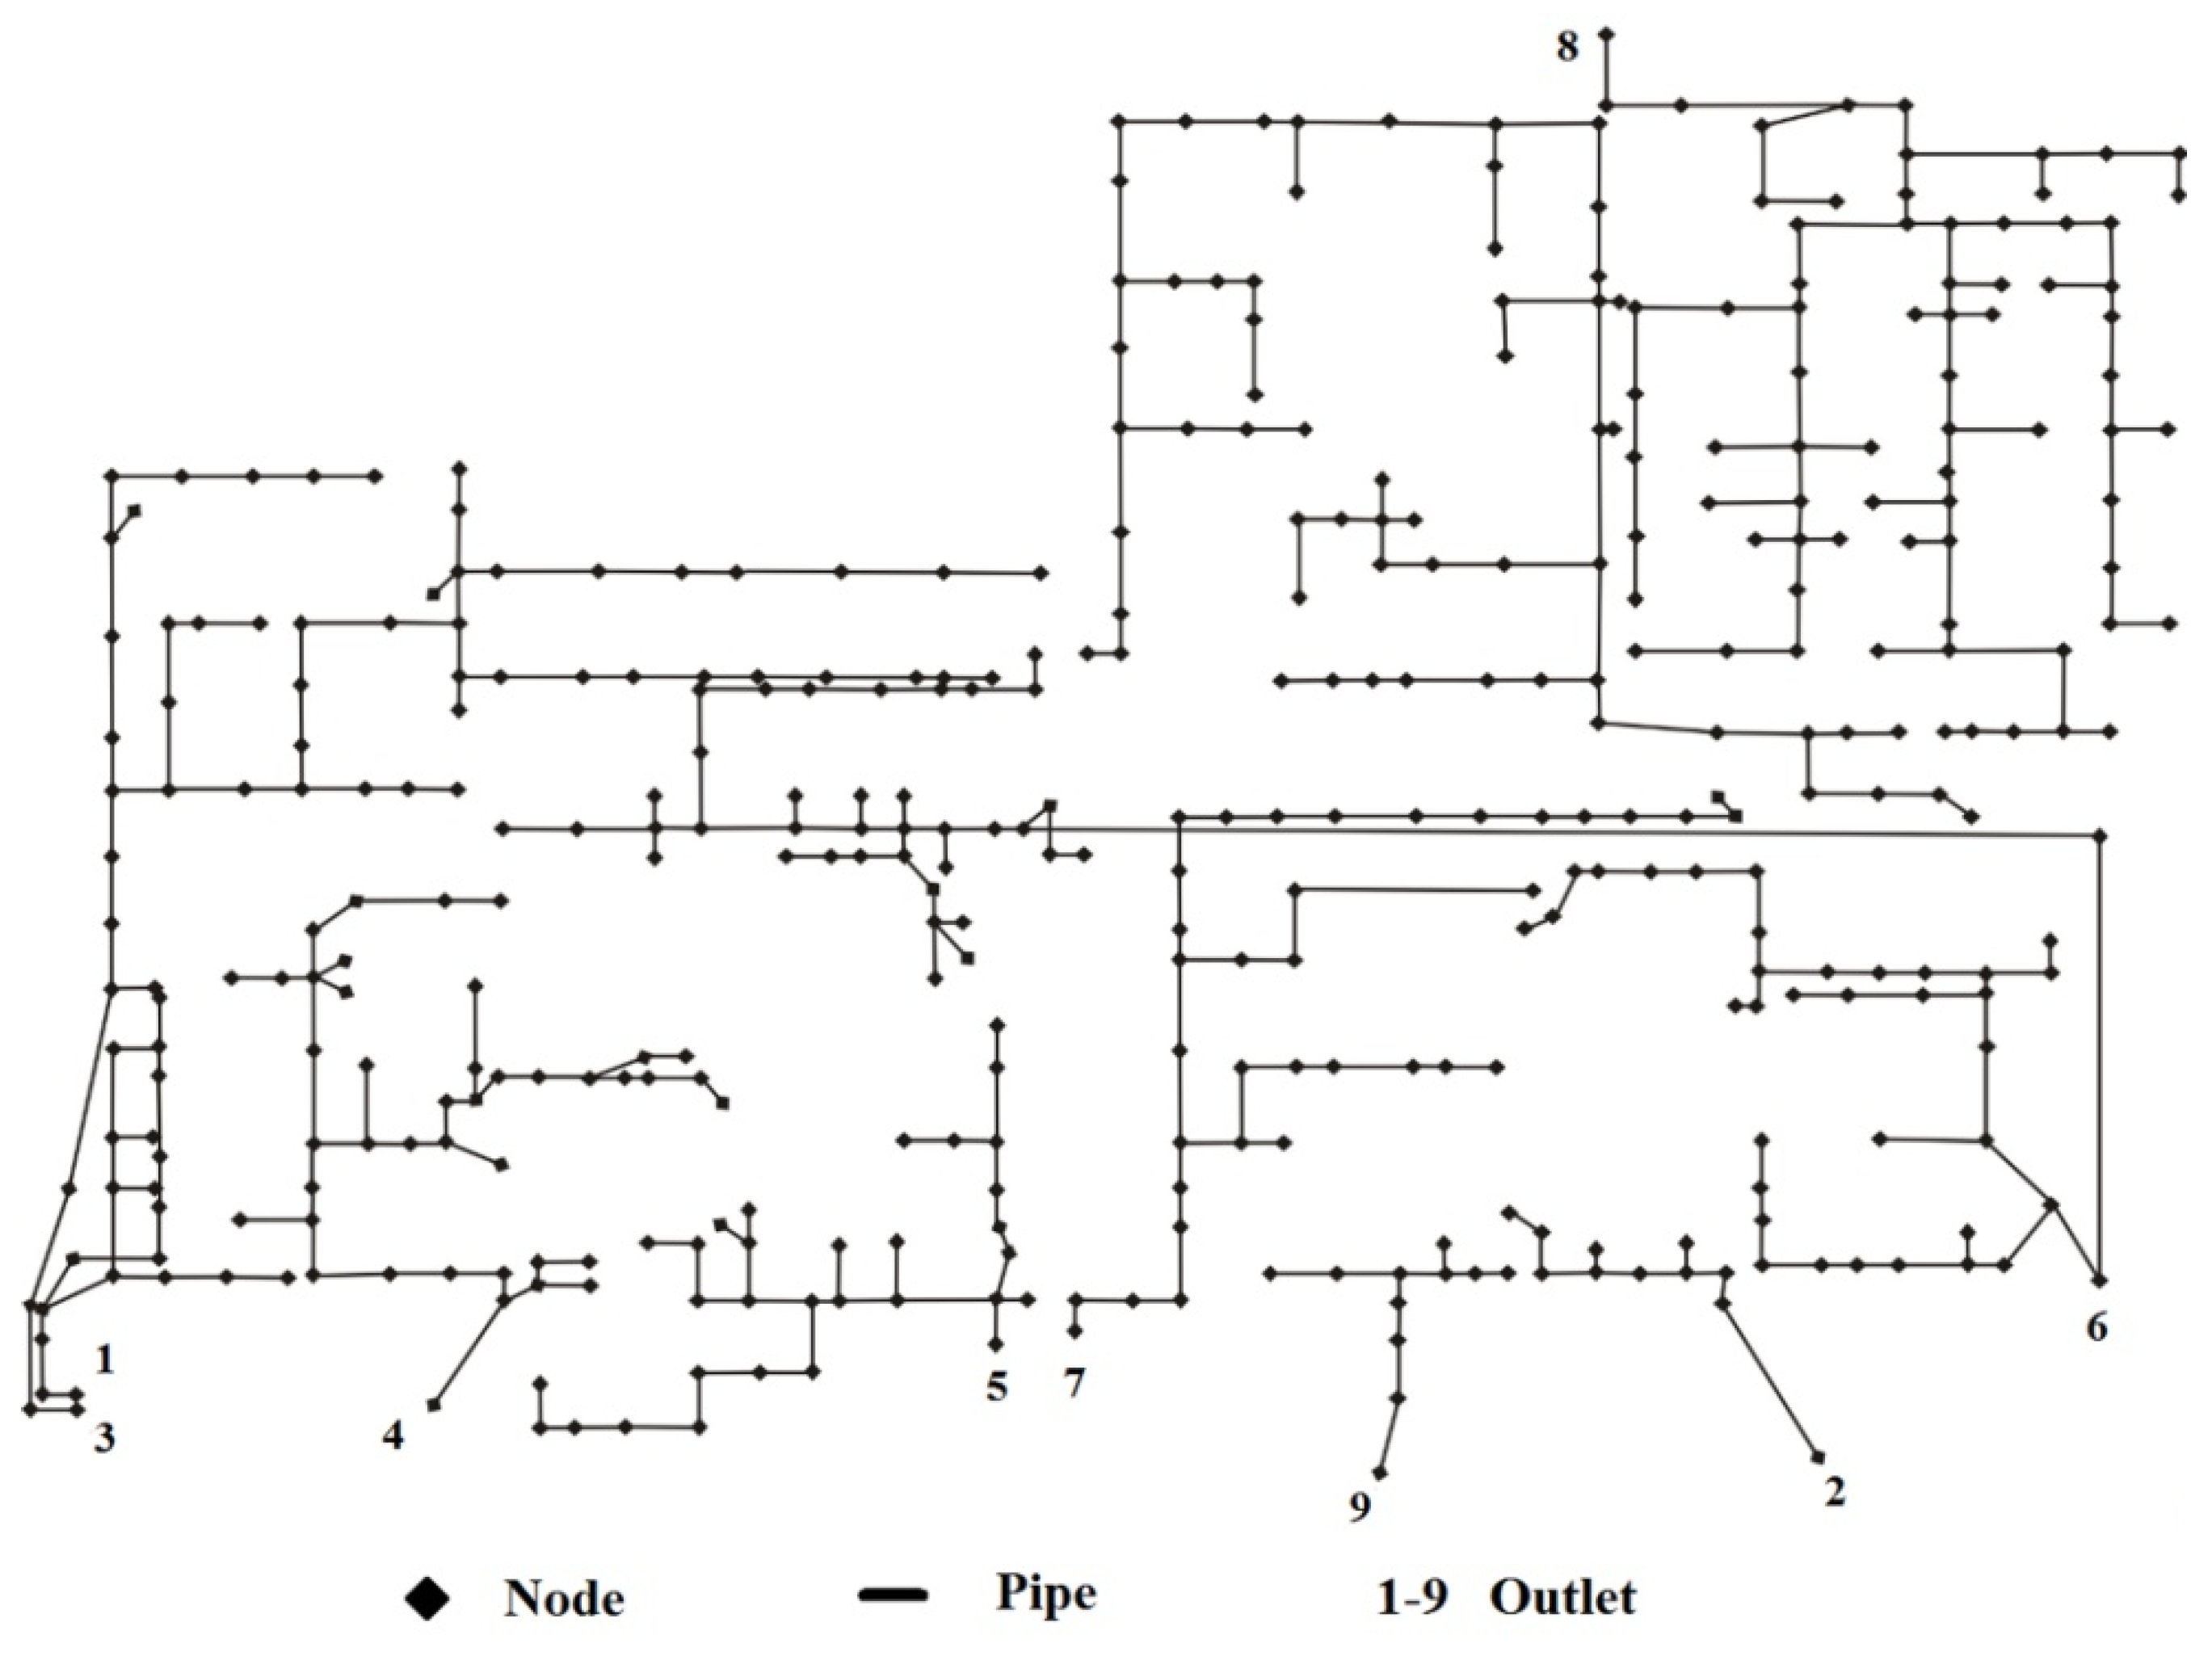
3.2.2. Generalized Drainage Pipe Network
3.2.3. Grid Generation
3.2.4. Wet and Dry Grid Treatment
3.3. Model Input Parameters
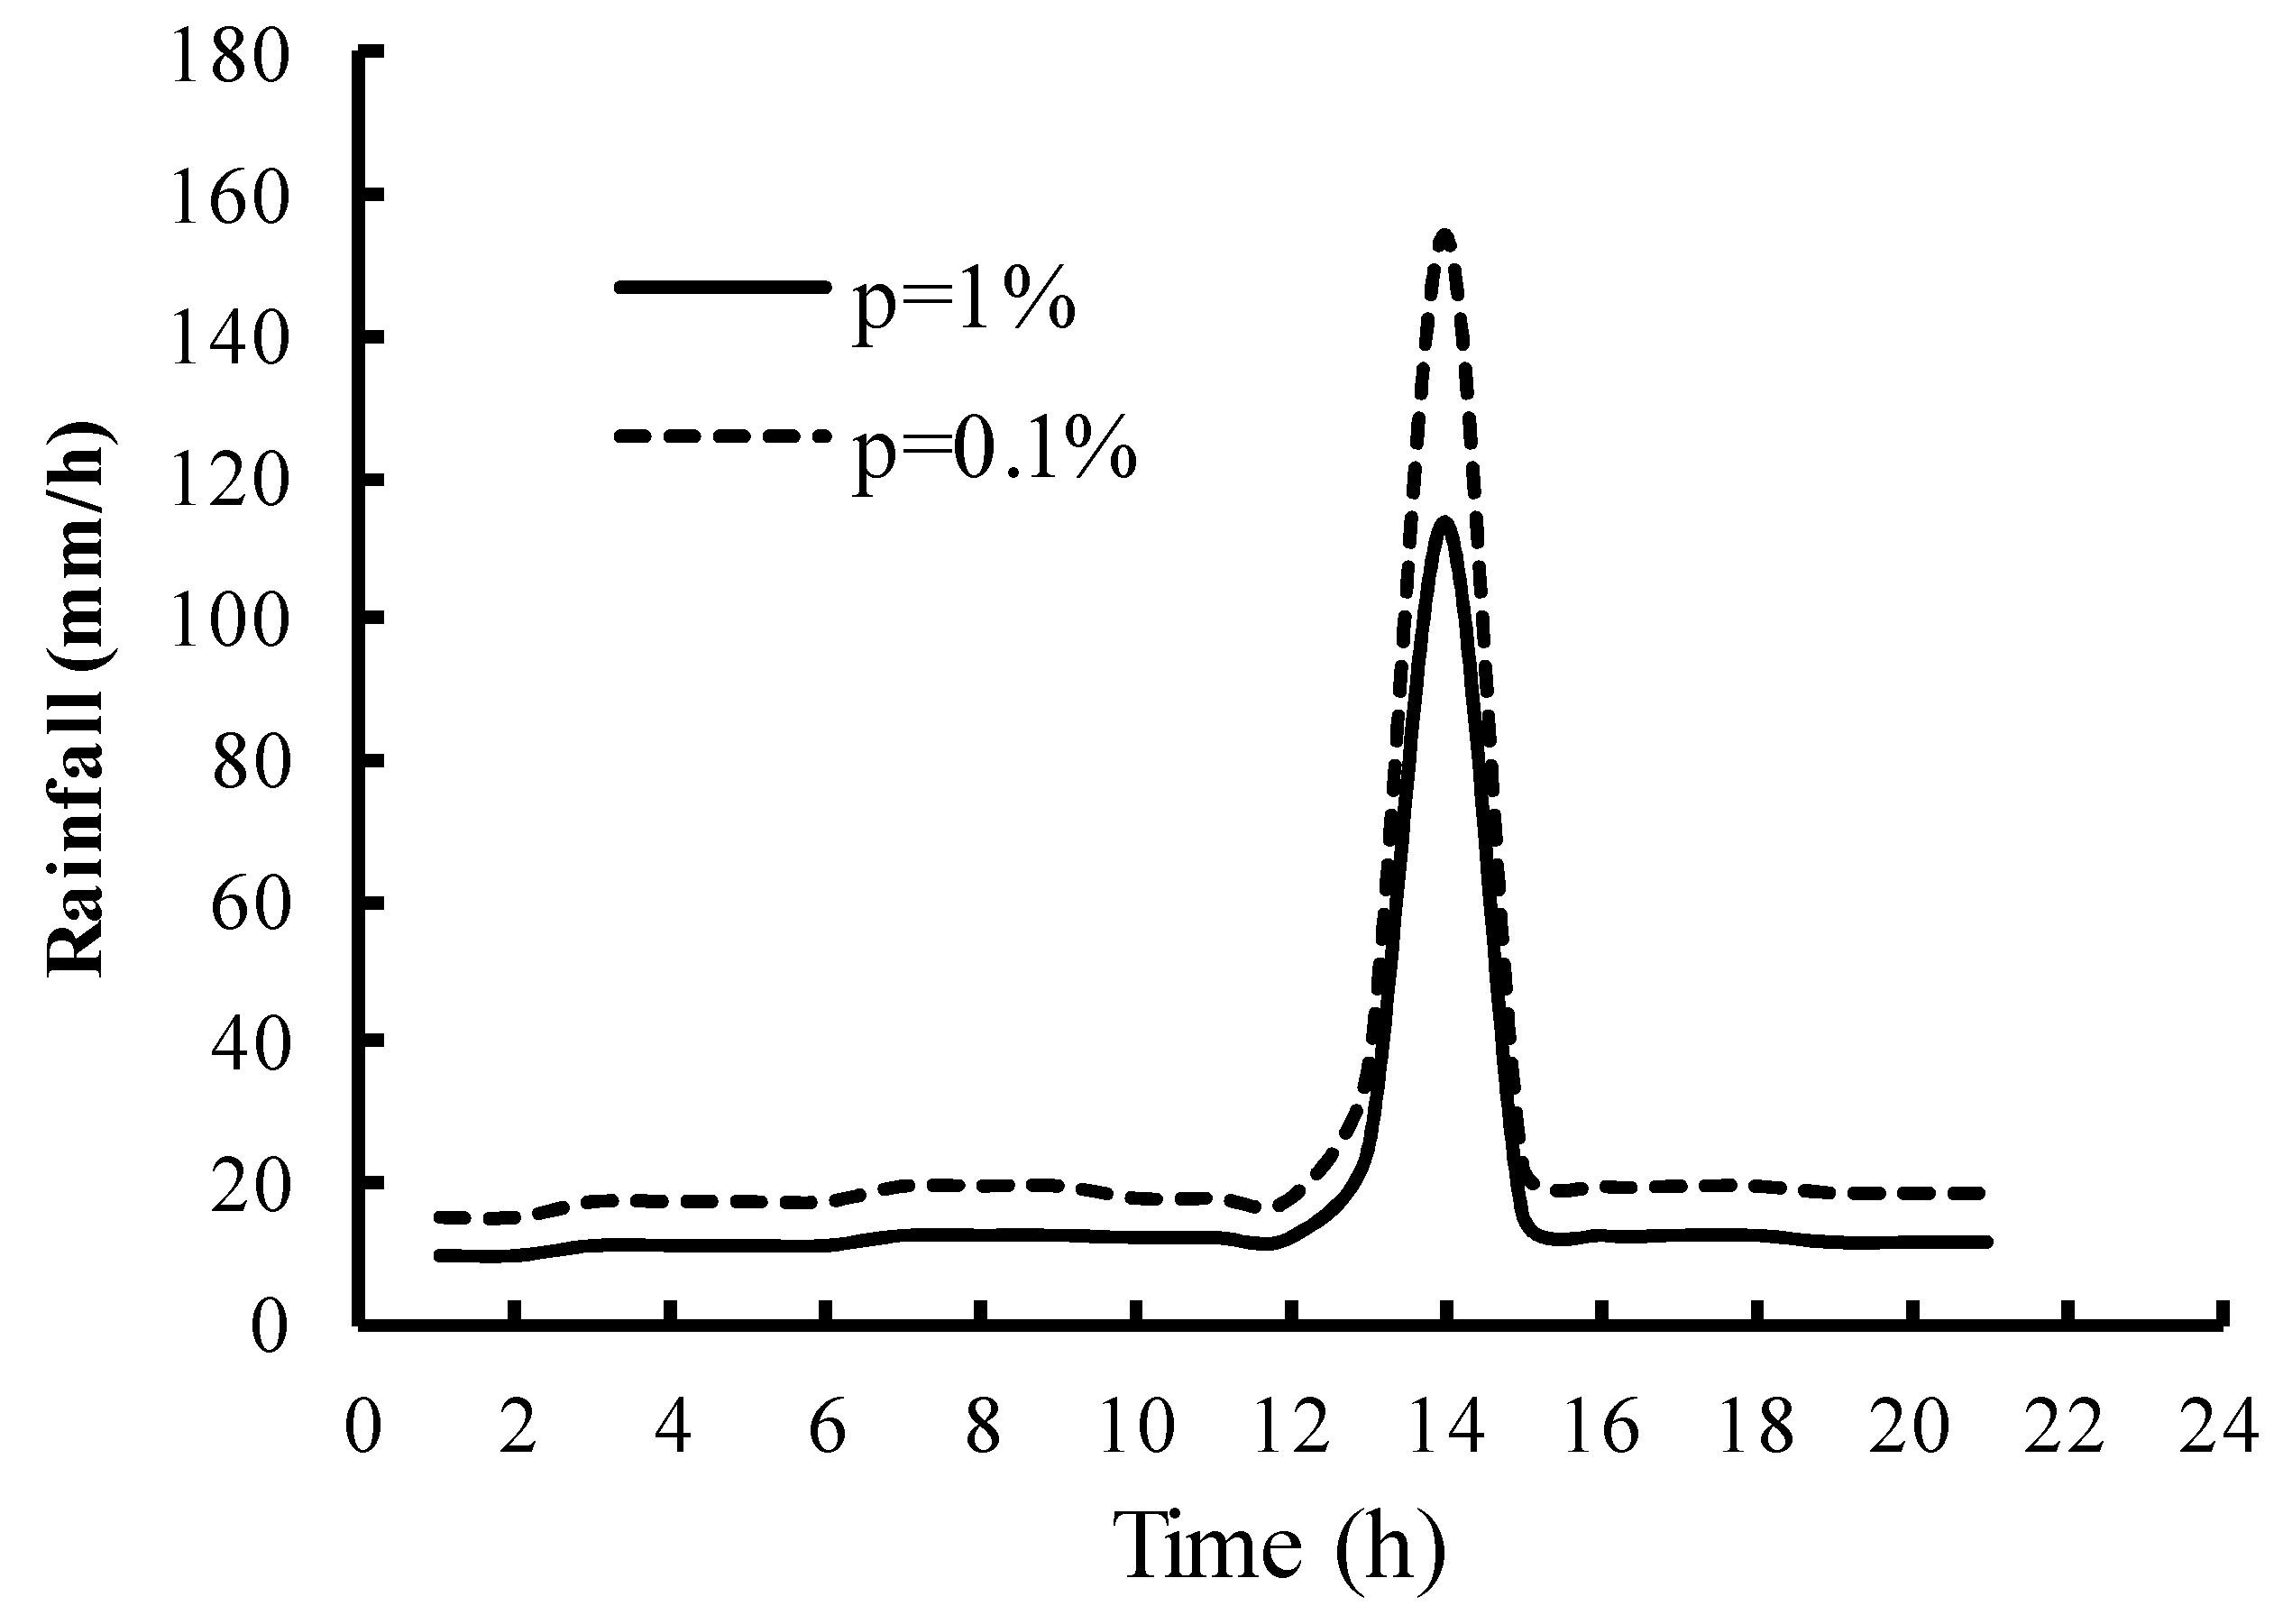
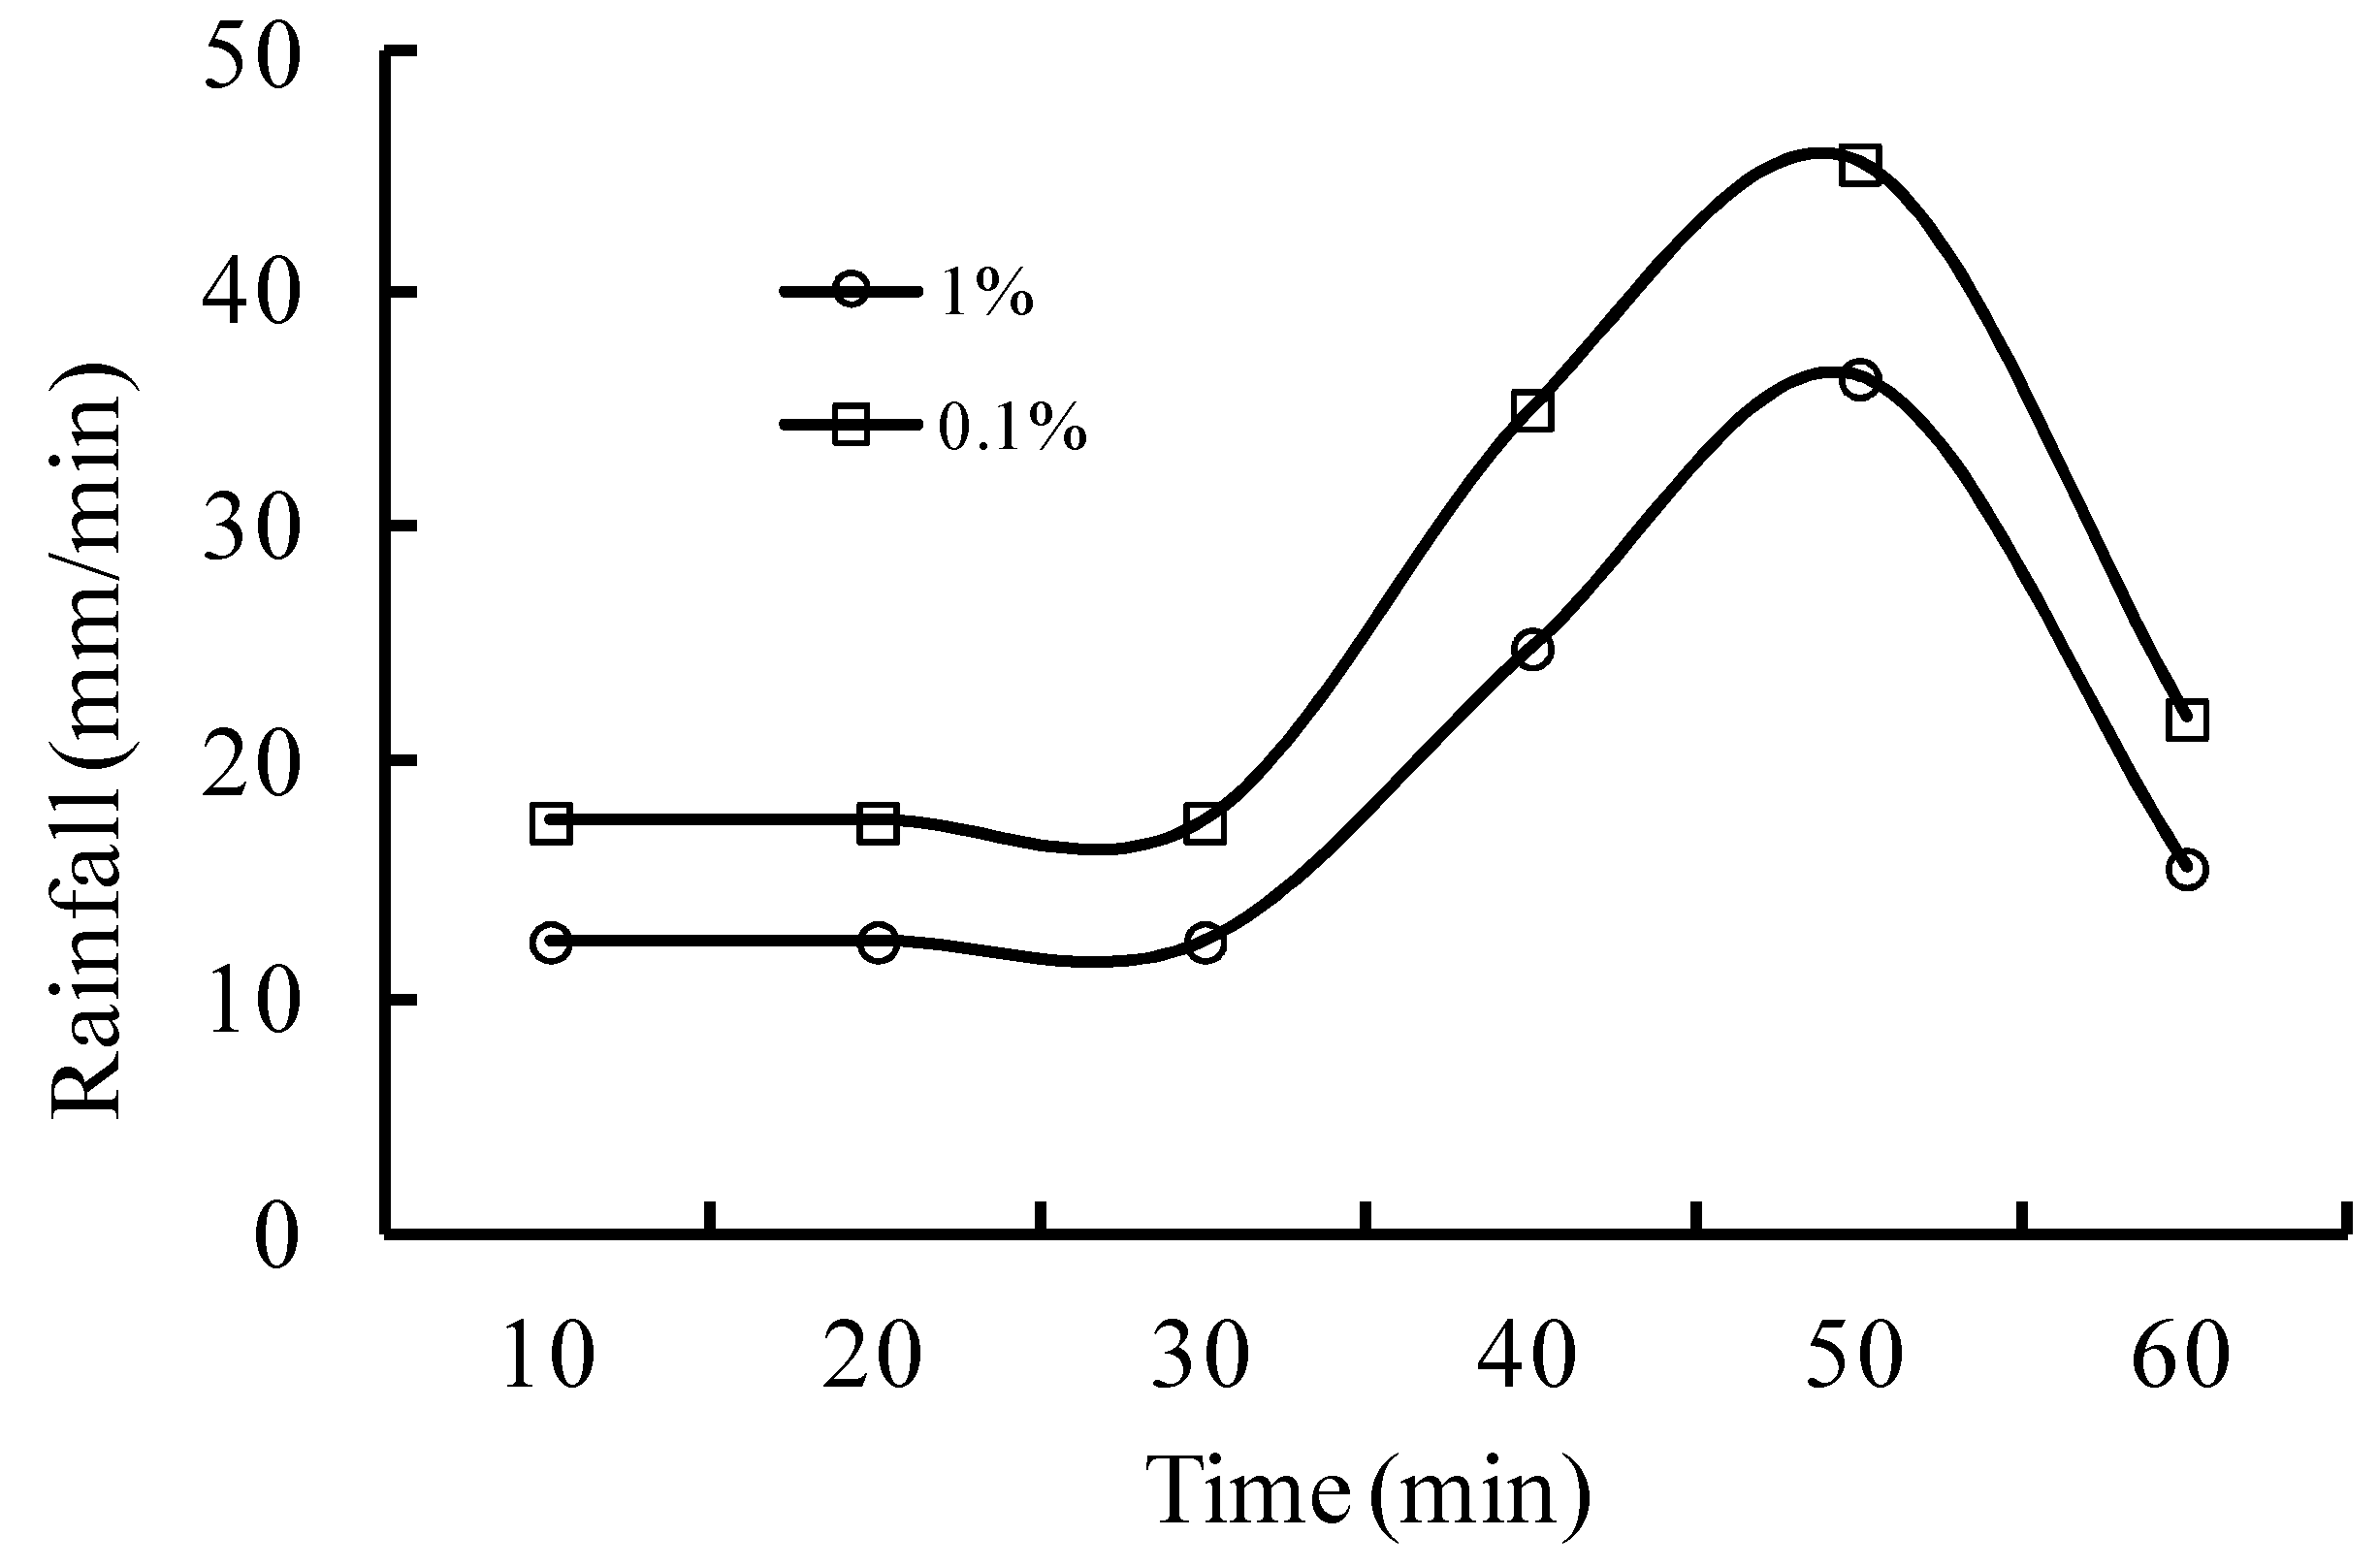
3.3.1. Rainfall and Wave Overtopping Data
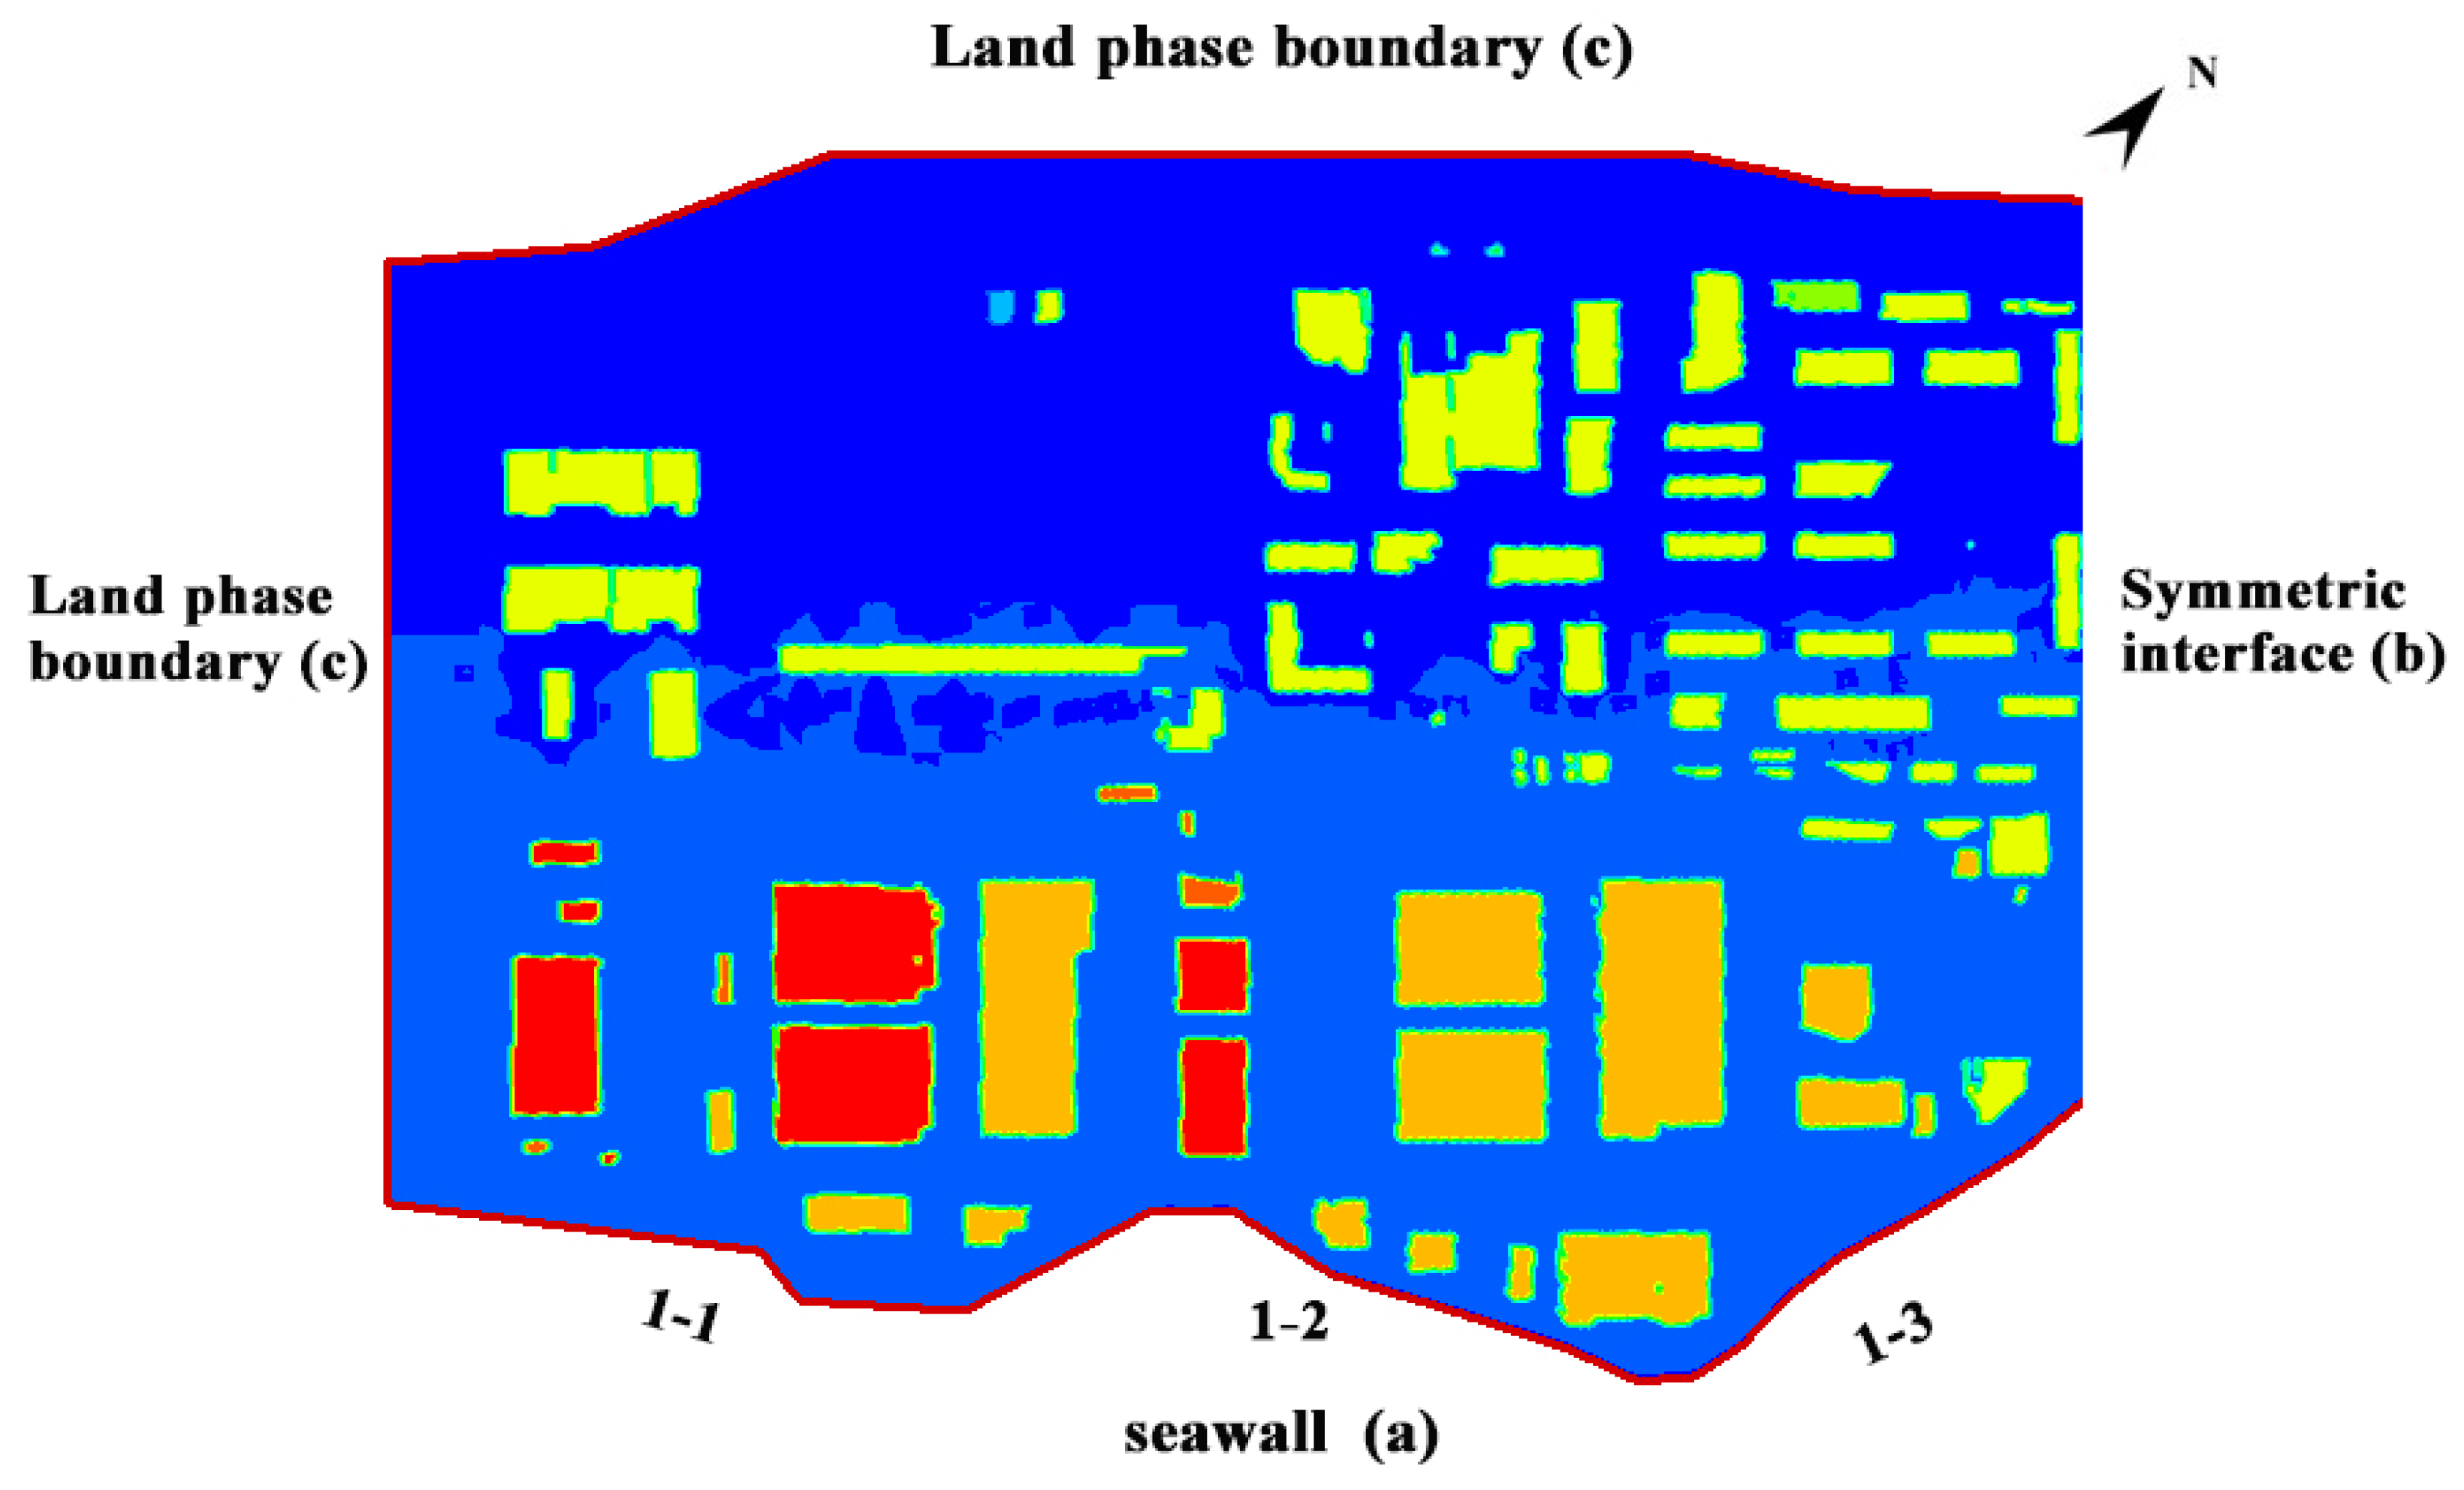
3.3.2. Initial and Boundary Conditions
- (1)
- The surface boundary was divided into three parts: (a) the seawall boundary, (b) the symmetric interface of the plant, and (c) the land-phase boundary.
- (a)
- Seawall boundary: The seawall boundary refers to the inlet boundary given the wave overtopping rate.
- (b)
- Symmetric interface of the plant: The northeastern area of the nuclear power plant is relatively low, and the top of the breakwater embankment is higher than the elevation of the plant. Thus, the overtopping waves are large at this position, and the backwater affects the nuclear power plant. Another plant was constructed northeast of the nuclear power plant. Therefore, the northeastern boundary was considered the symmetric interface in the calculation. However, regardless of the backwater effect in the northeastern area, the normal velocity is zero for the nuclear power plant site at the interface.
- (c)
- Land-phase boundary: The land-phase boundary refers to the outlet border after considering the land elevation outside the boundary. This boundary is considerably lower than the elevation inside the plant. The water depth at point hi in the area, and the bottom level zi of the boundary, was calculated using the floodplain or weir flow formula [36]:
- (2)
- The pipeline boundary considers whether or not the pipe outlet is submerged. The flow or water level of the pipeline boundary is determined by the formulas for free and submerged discharge.
3.3.3. Pipeline Computational Conditions
3.4. Numerical Discretization and Solution
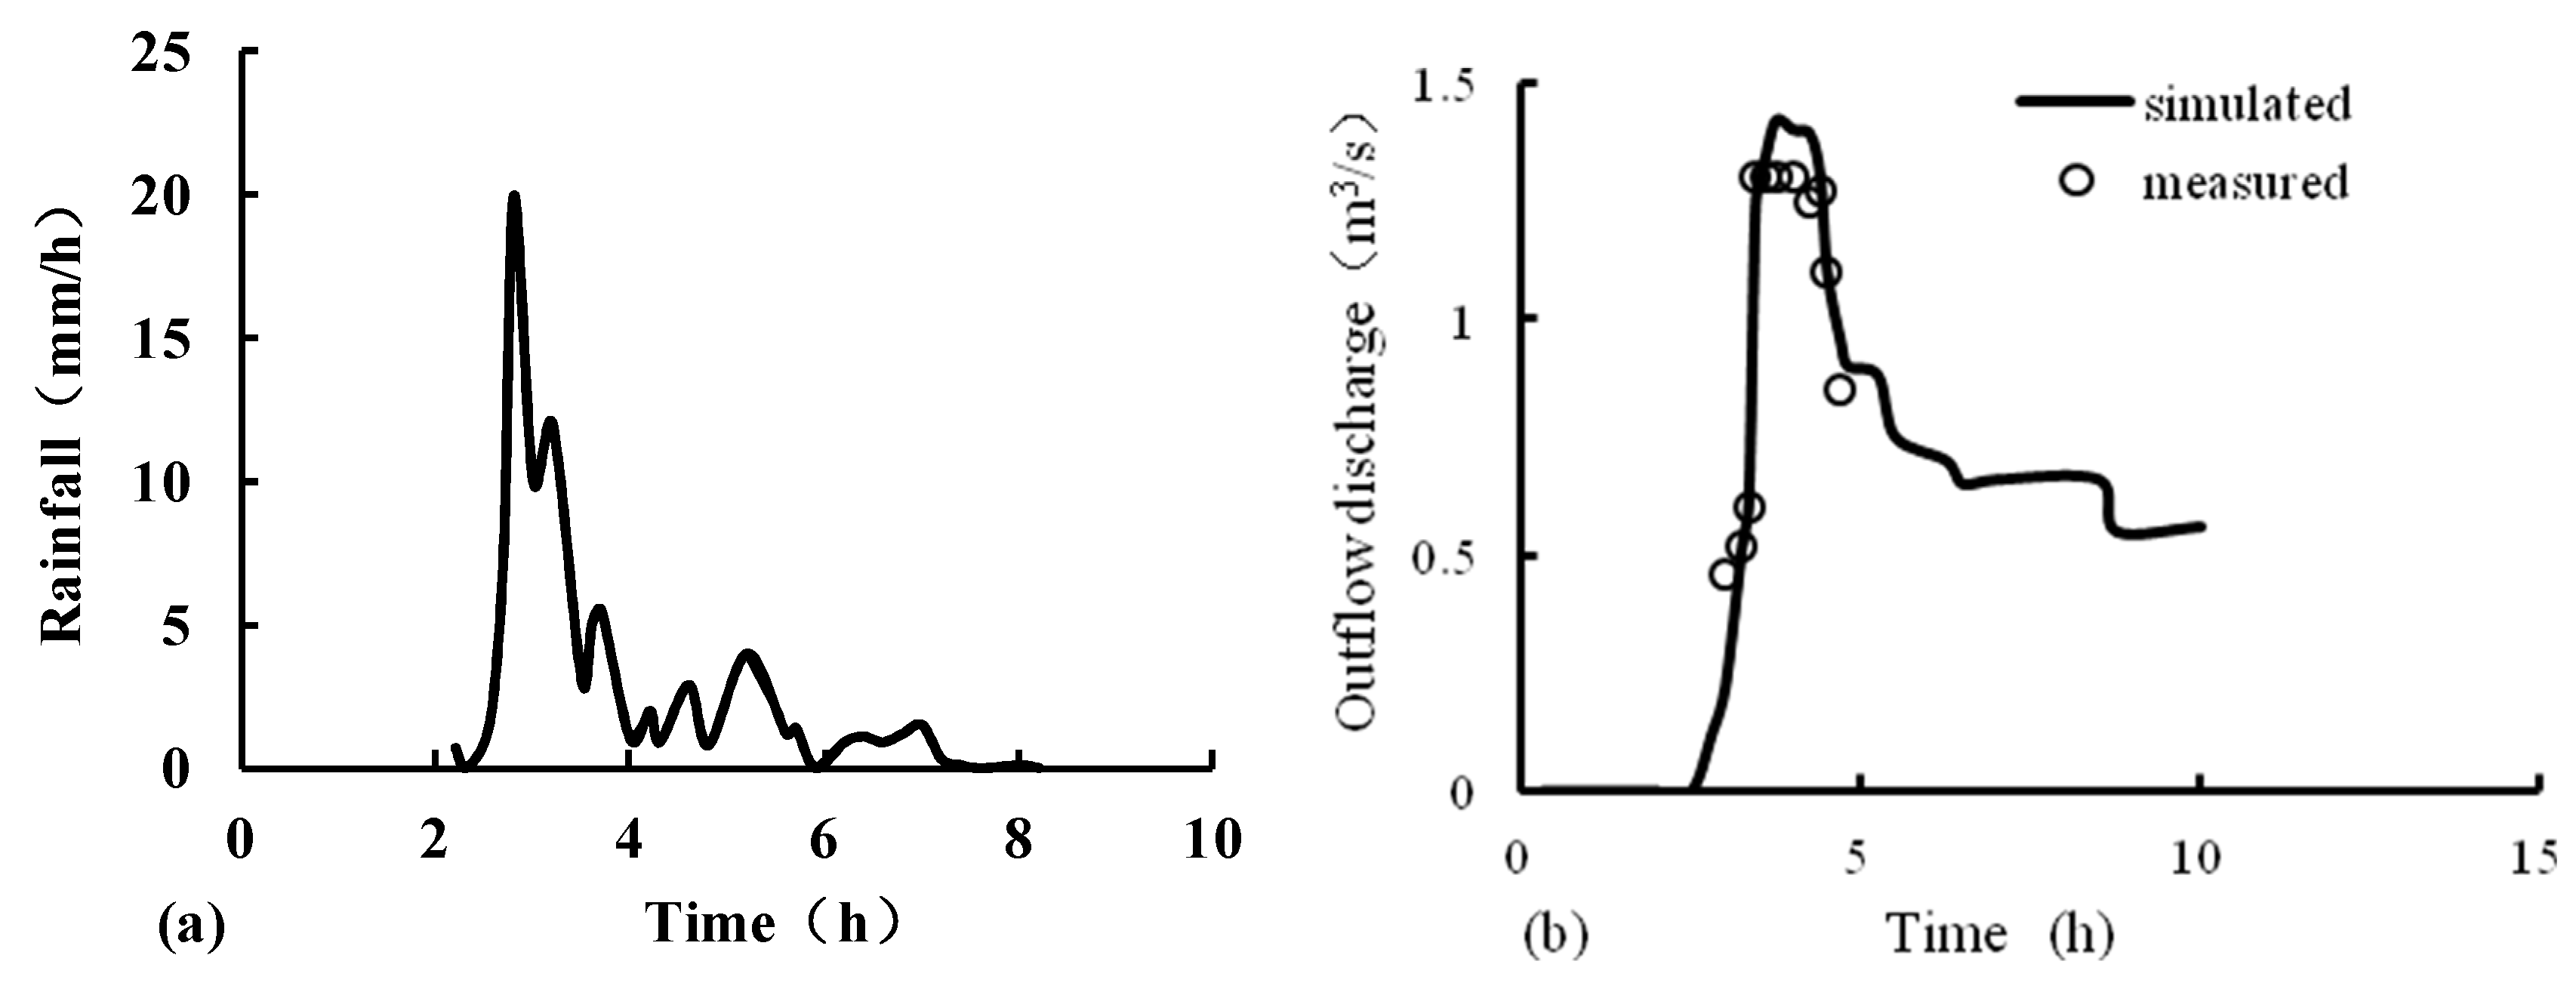
3.5. Model Validation and Calibration
4. Results and Discussion
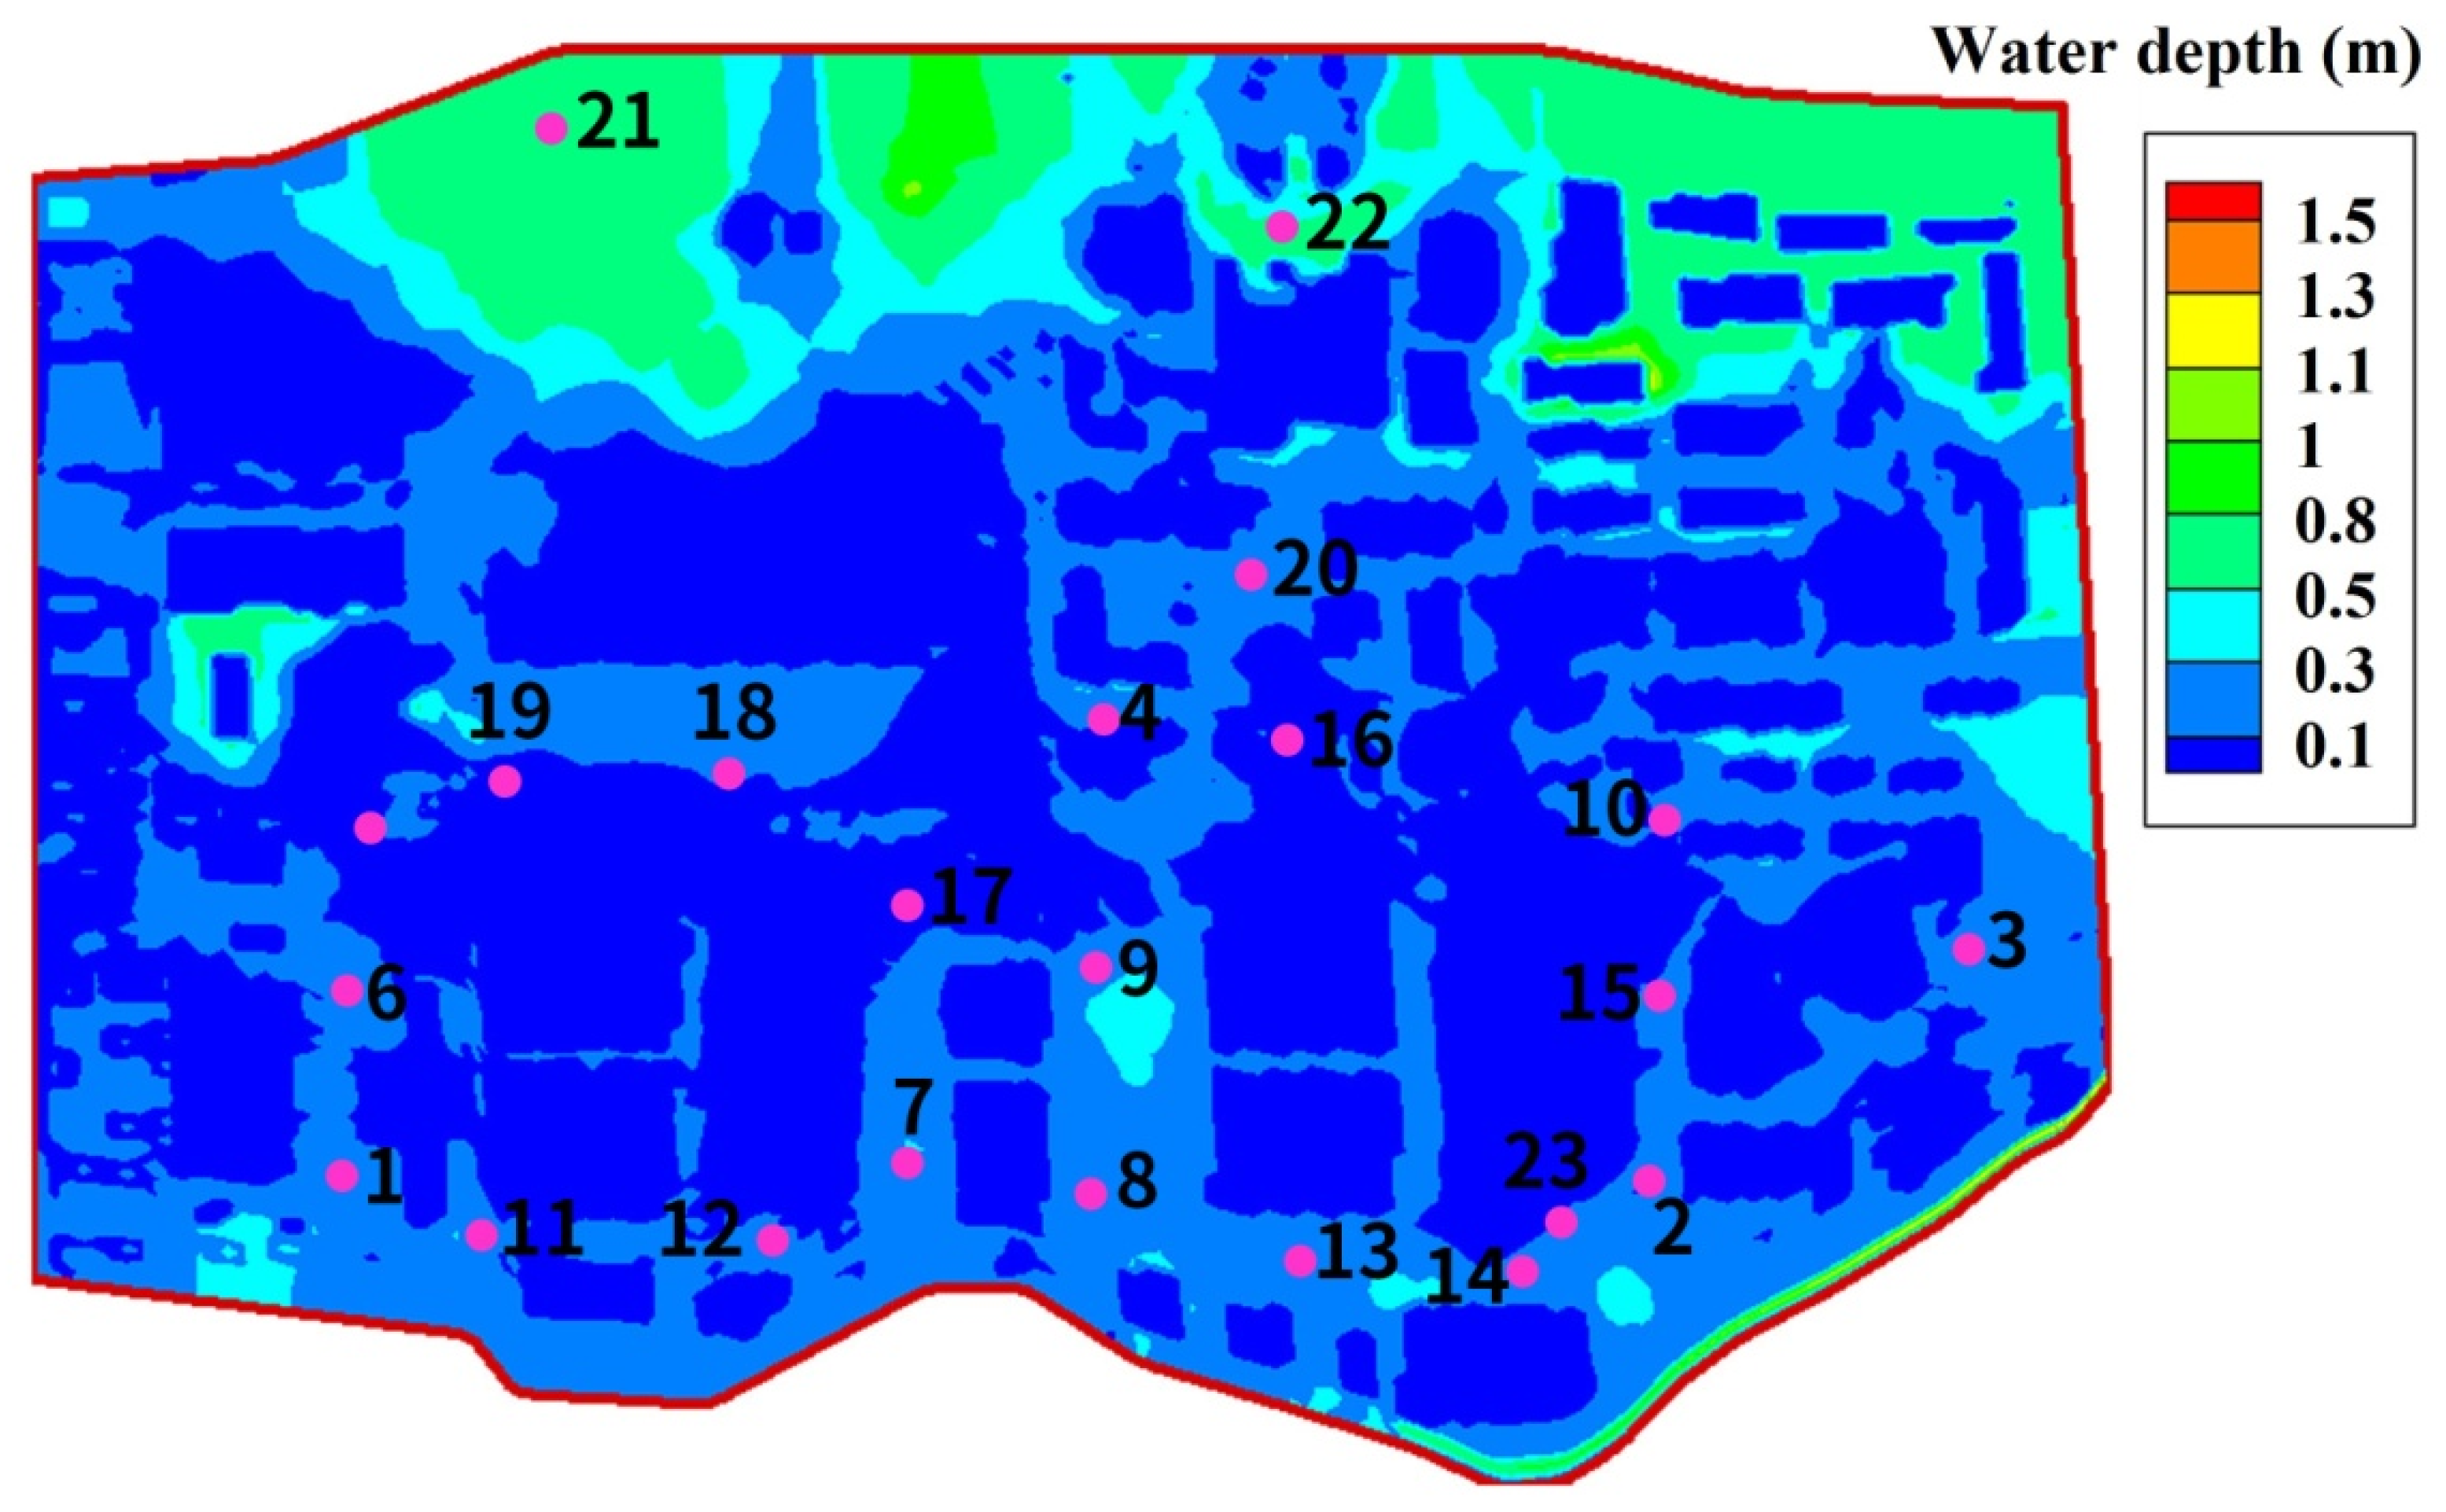
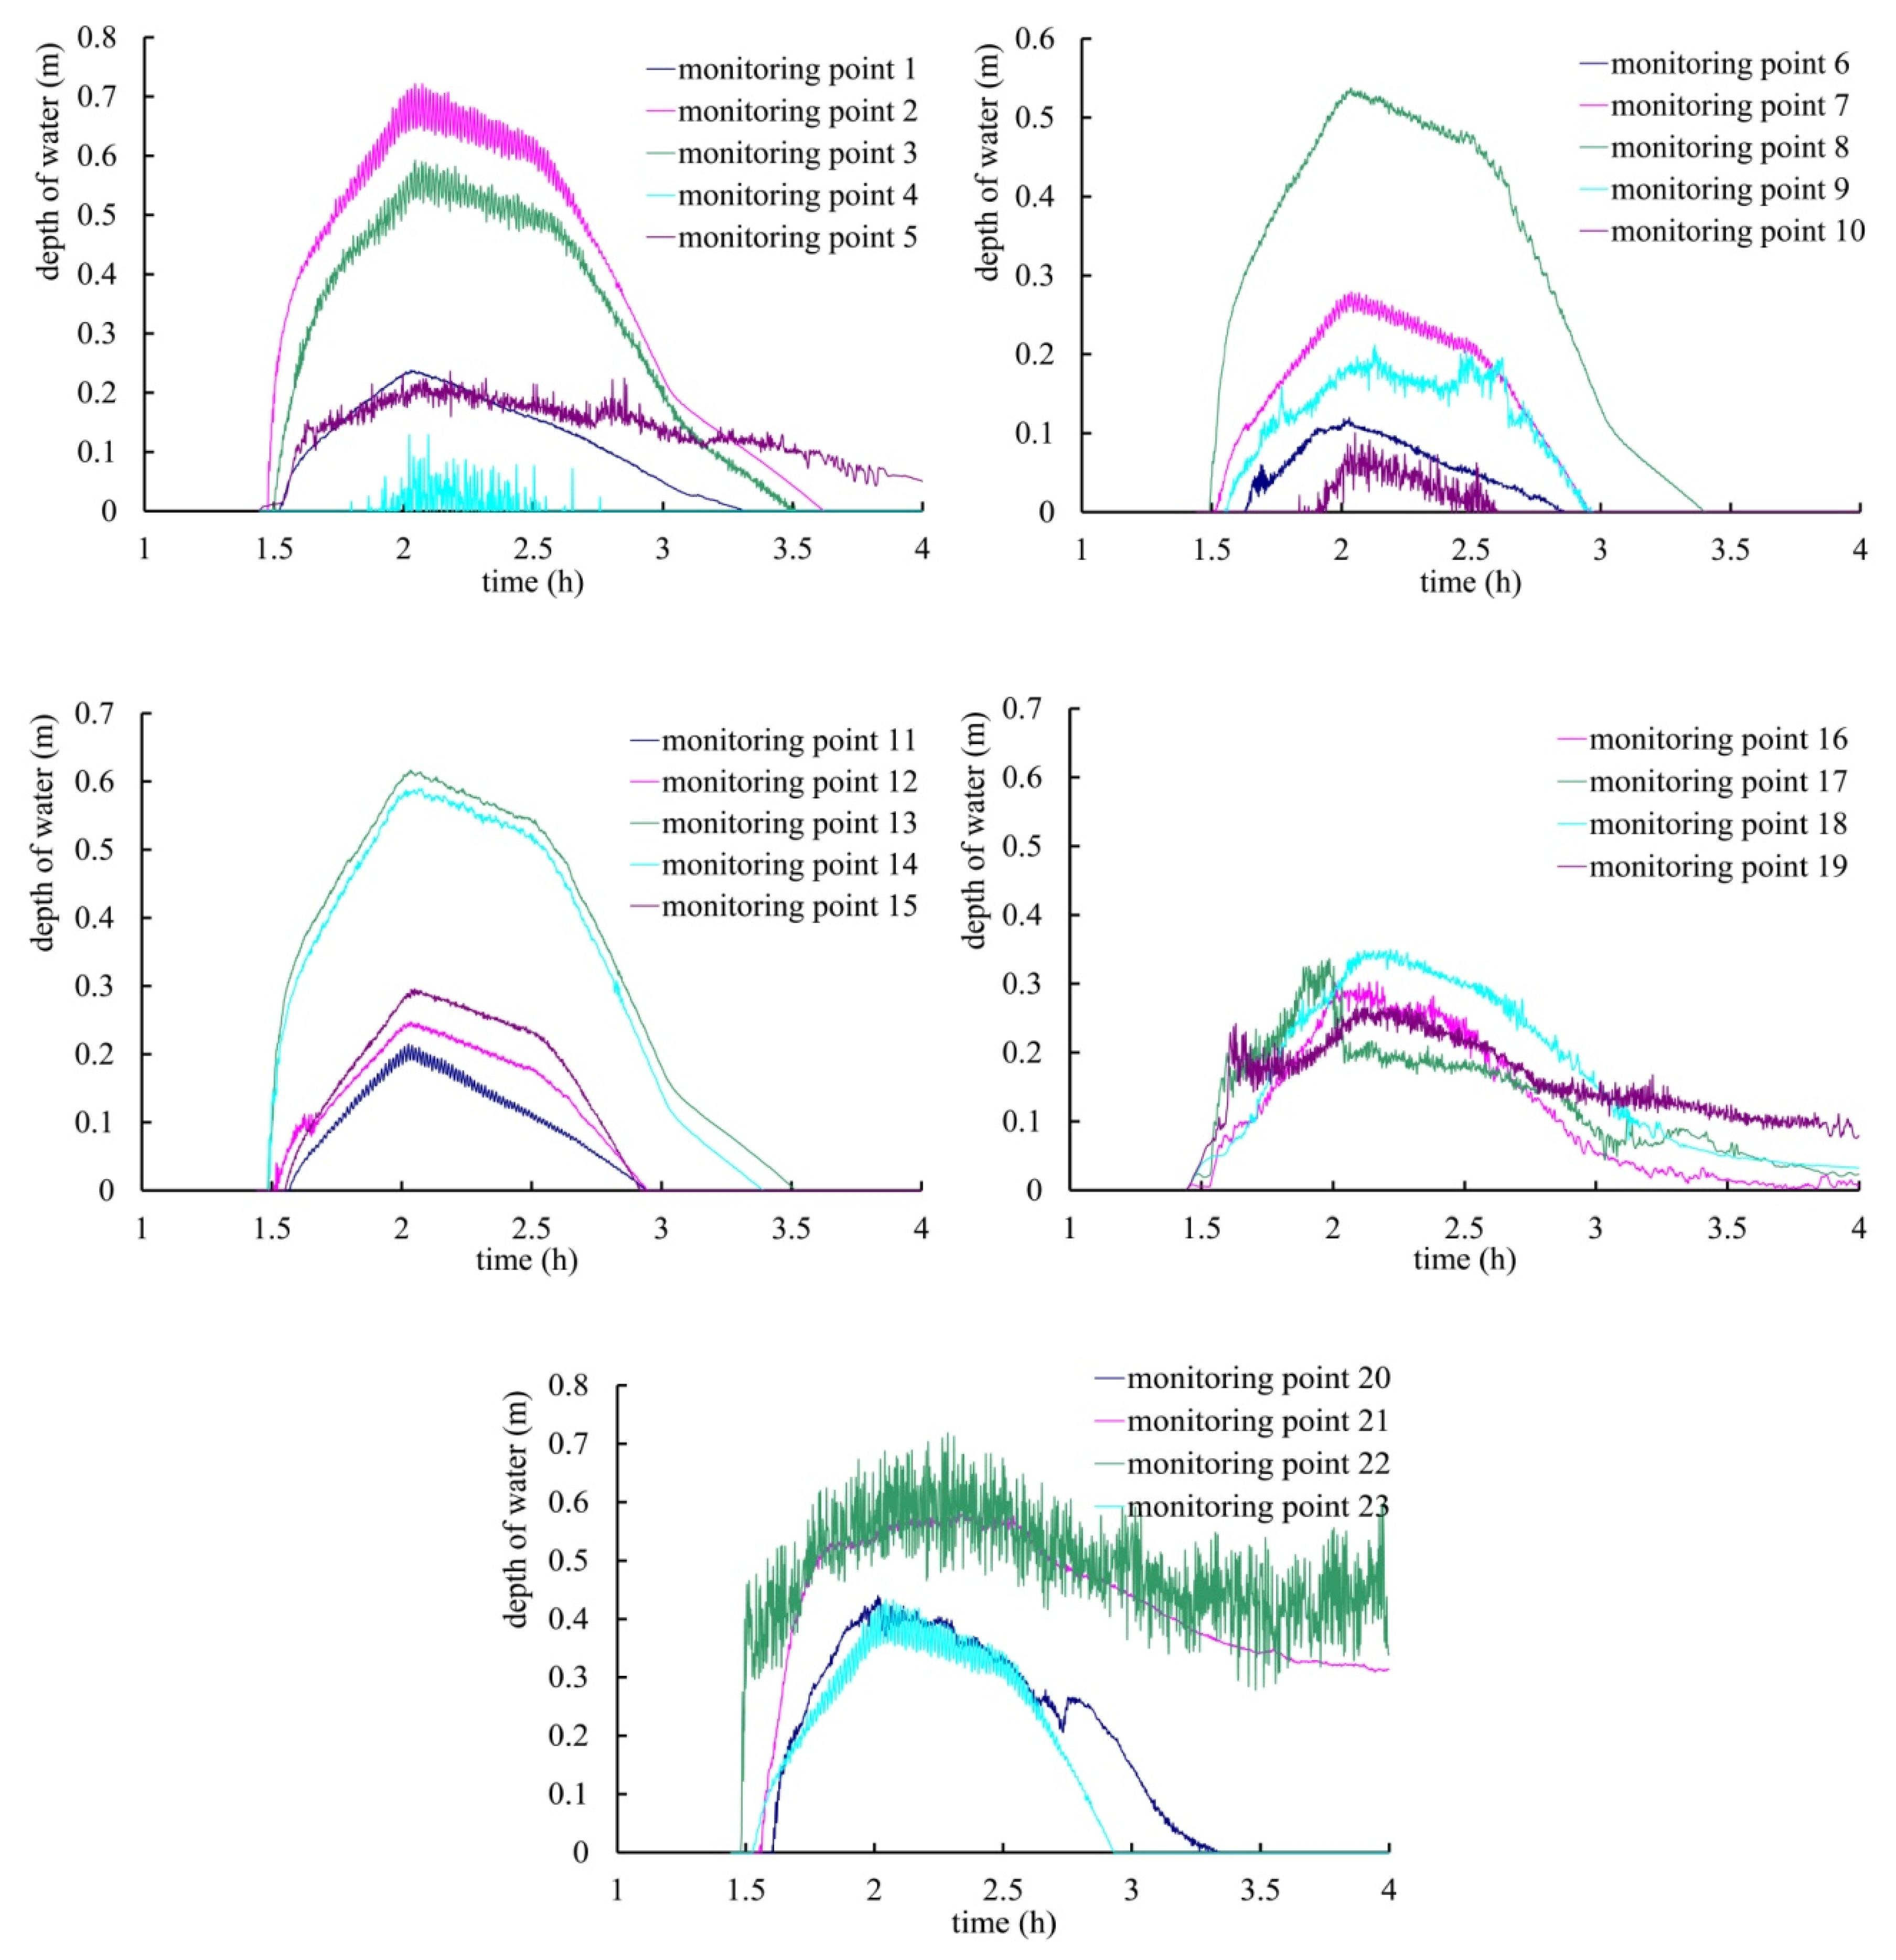
4.1. Temporal Distribution of Water Depth at the Nuclear Power Plant
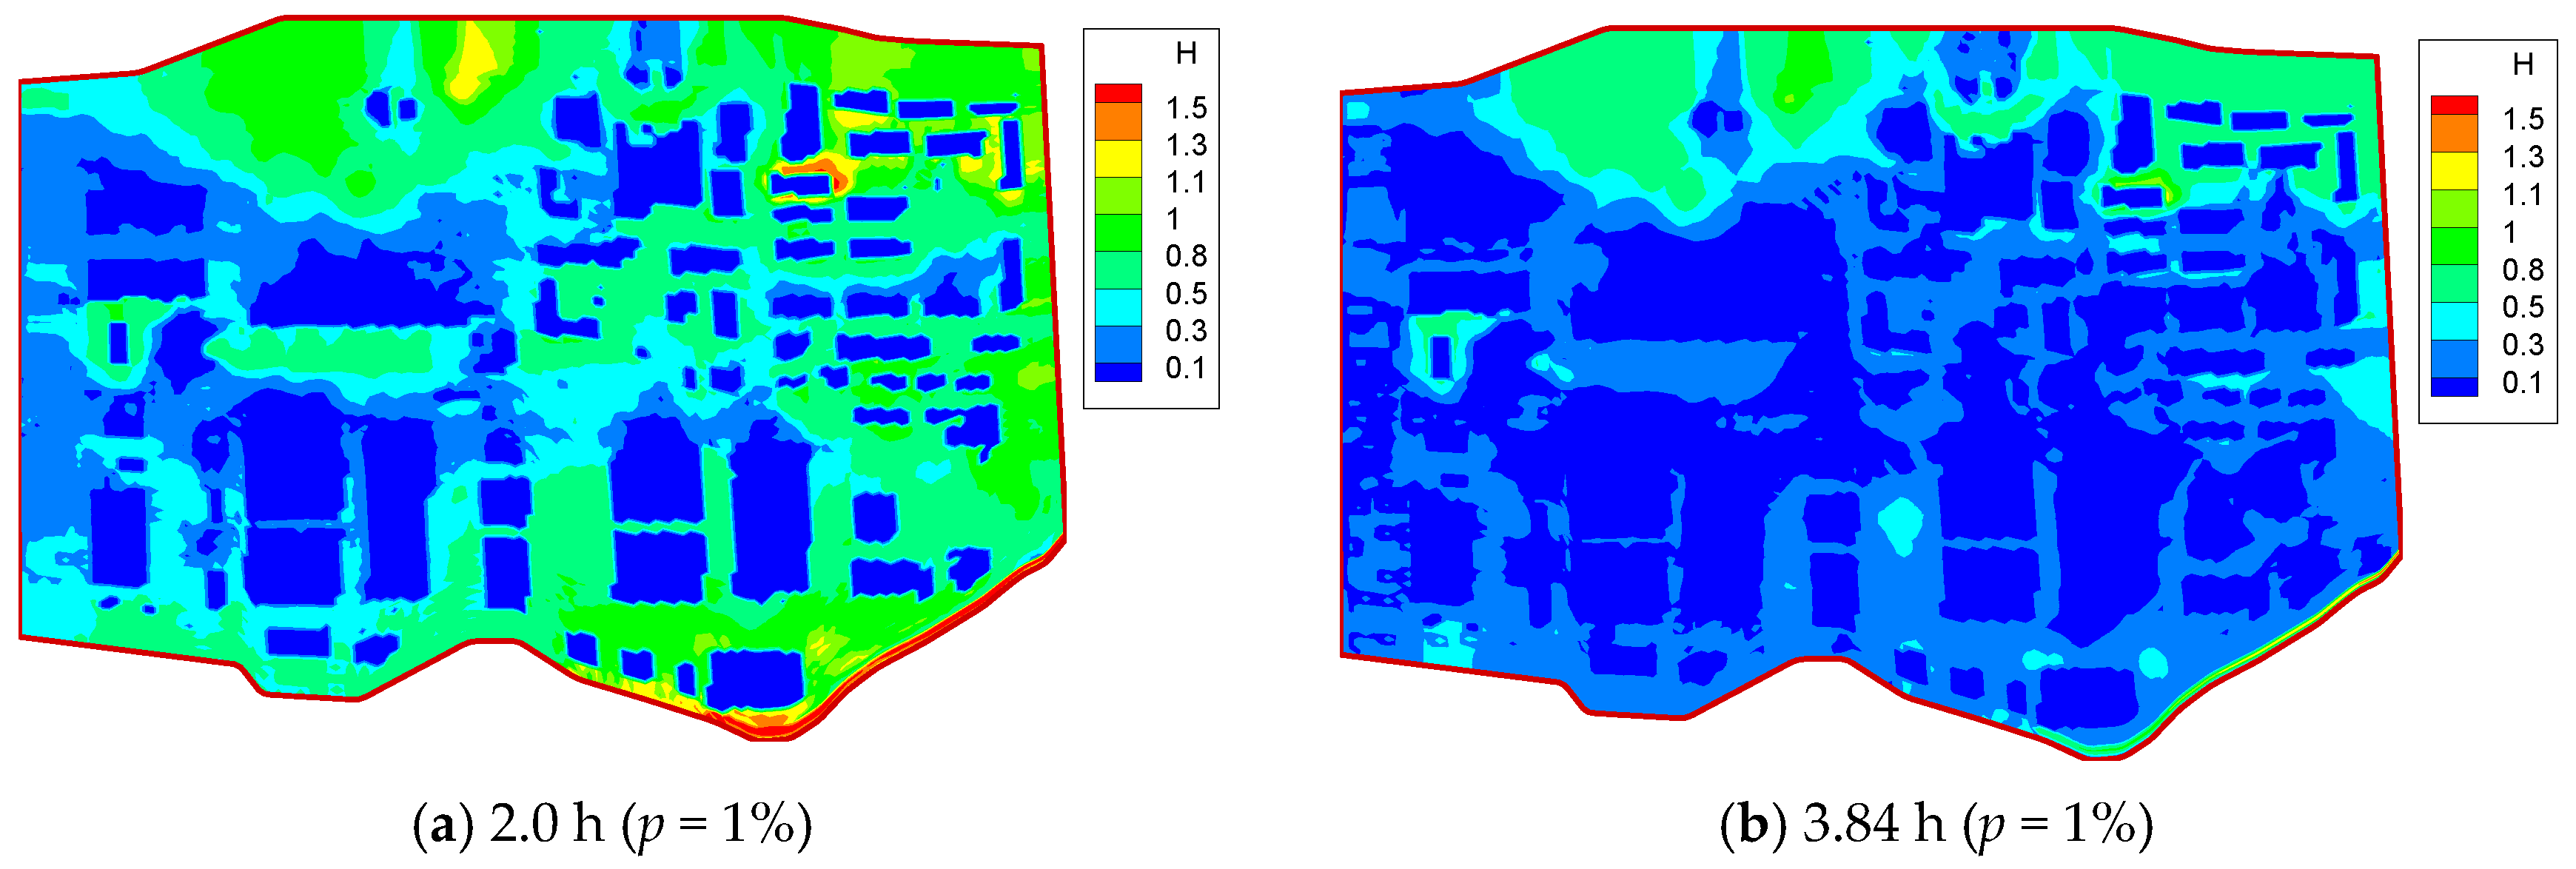
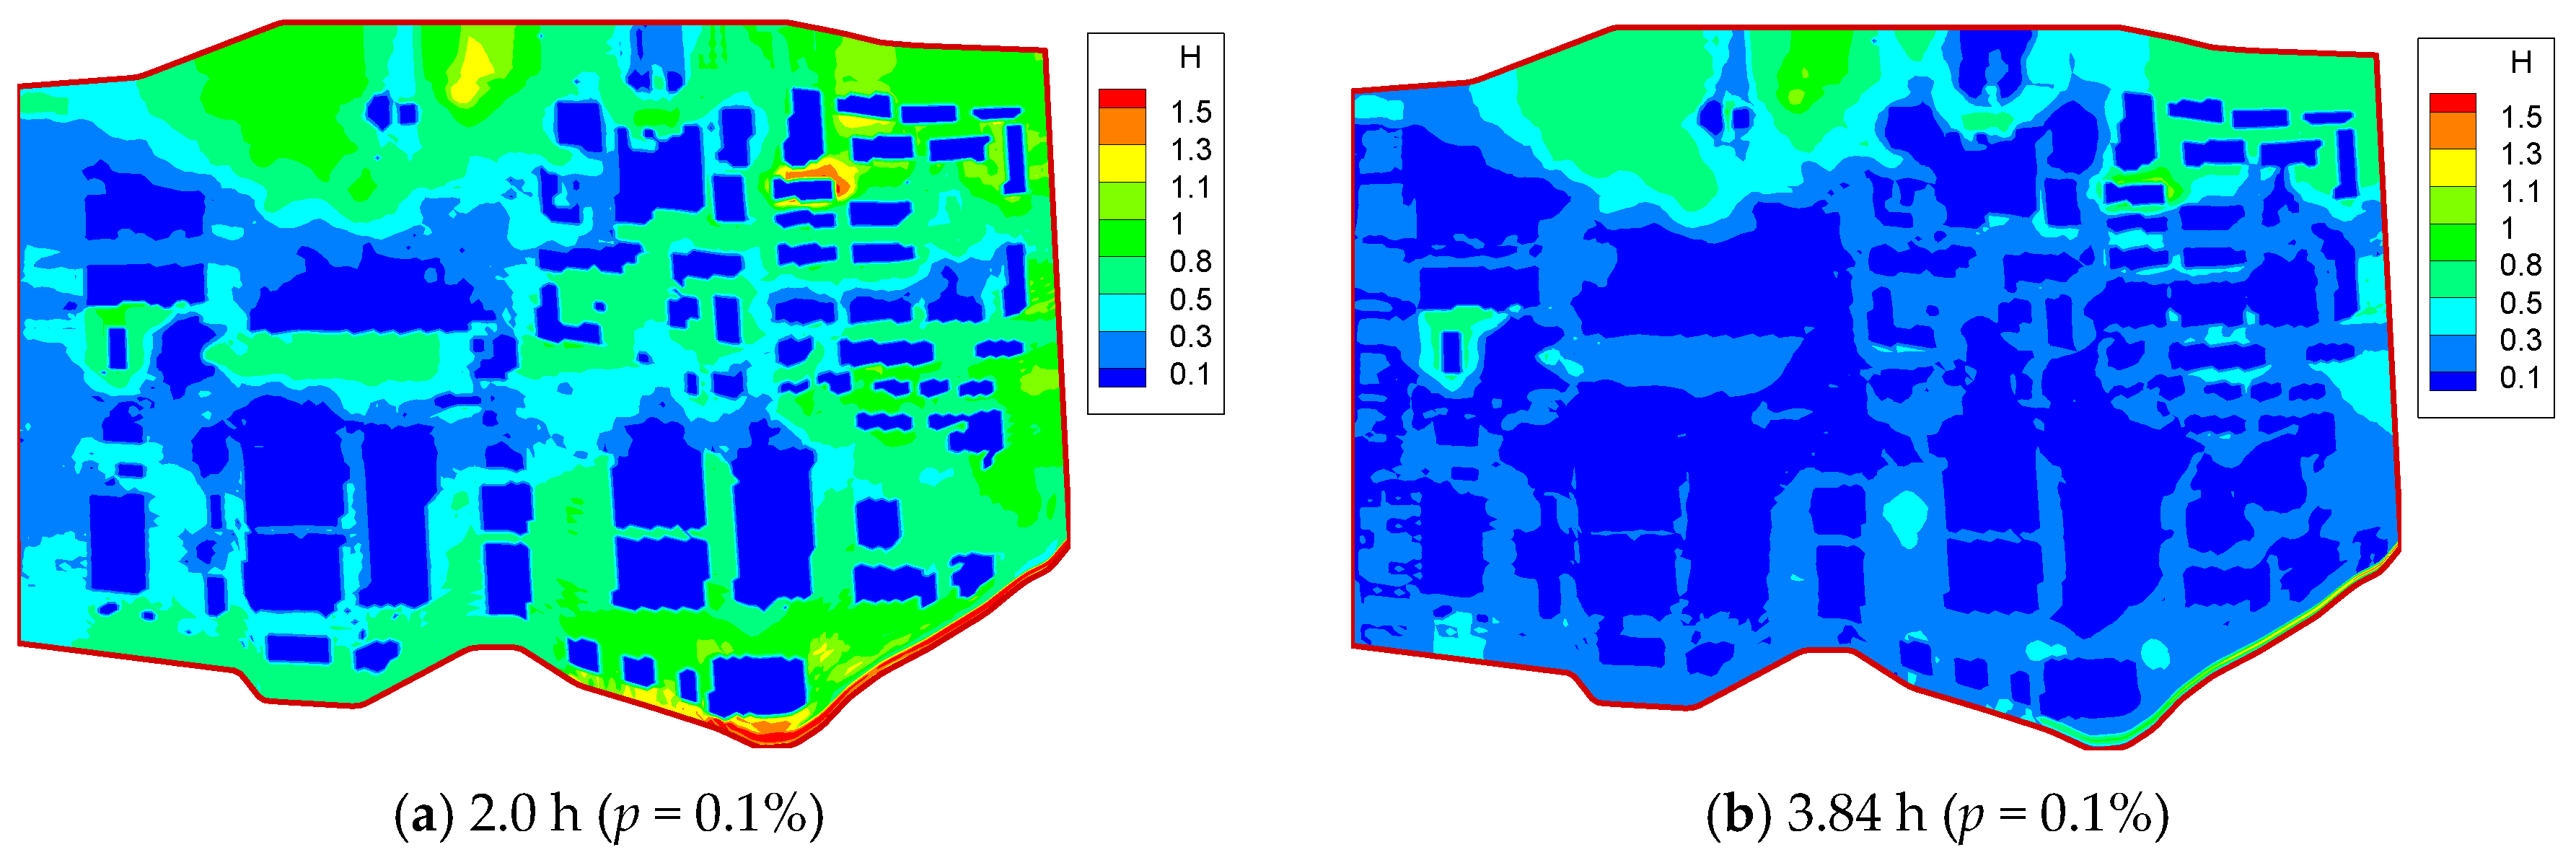
4.2. Spatial Distribution of Flooding Water at the Nuclear Power Plant
5. Conclusions
Author Contributions
Funding
Conflicts of Interest
References
- Tondel, M.; Granath, G.; Wålinder, R. 137 Cs activity in Sweden after the Chernobyl Nuclear Power Plant accident in relation to quaternary geology and land use. Appl. Geochem. 2017, 87, 38–43. [Google Scholar] [CrossRef]
- Fernández, D.S.; Lutz, M.A. Urban flood hazard zoning in Tucumán Province, Argentina, using GIS and multicriteria decision analysis. Eng. Geol. 2010, 111, 90–98. [Google Scholar] [CrossRef]
- Dewals, B.J.; Archambeau, P.; Duy, B.K.; Erpicum, S.; Pirotton, M. Semi-explicit modelling of watersheds with urban drainage systems. Eng. Appl. Comput. Fluid Mech. 2012, 6, 46–57. [Google Scholar] [CrossRef]
- Shibahara, S. The 2011 Tohoku Earthquake and Devastating Tsunami. Tohoku J. Exp. Med. 2011, 223, 305–307. [Google Scholar] [CrossRef] [PubMed]
- Hsu, M.H.; Chen, S.H.; Chang, T.J. Inundation simulation for urban drainage basin with storm sewer system. J. Hydrol. 2000, 234, 21–37. [Google Scholar] [CrossRef]
- Kopytko, N.; Perkins, J. Climate change, nuclear power, and the adaptation mitigation dilemma. Energy Policy 2011, 39, 318–333. [Google Scholar] [CrossRef]
- Dolif, G.; Engelbrecht, A.; Jatobá, A. Resilience and brittleness in the ALERTA RIO system: A field study about the decision-making of forecasters. Nat. Hazards 2013, 65, 1831–1847. [Google Scholar] [CrossRef]
- Rossman, L.A. Storm Water Management Model User’s Manual Version 5.0; National Management Research Laboratory Office of Research and Development U.S. Environmental Protection Agency Cincinnati: Cincinnati, OH, USA, 2004.
- Schmitt, T.G.; Thomas, M.; Ettrich, N. Analysis and modeling of flooding in urban drainage systems. J. Hydrol. 2004, 299, 300–311. [Google Scholar] [CrossRef]
- Fang, X.; Su, D.H. An integrated one-dimensional and two-dimensional urban stormwater flood simulation model. J. Am. Water Resour. Assoc. 2006, 42, 713–724. [Google Scholar] [CrossRef]
- Liu, X.Z.; Kang, S.Z.; Liu, D.L. A SCS model based on geography information and its application on rainfall runoff of typical small watershed on loess plateau. J. Hydrol. Eng. 2005, 24, 57–61. (In Chinese) [Google Scholar]
- Bruen, M.; Yang, J.Q. Combined hydraulic and black-box models for flood forecasting in urban drainage systems. J. Hydrol. Eng. 2006, 11, 589–596. [Google Scholar] [CrossRef]
- Tran, D.H.; Ng, A.W.M.; Perera, B.J.C. Neural networks deterioration models for serviceability condition of buried stormwater pipes. Eng. Appl. Artif. Intell. 2007, 20, 1144–1151. [Google Scholar] [CrossRef]
- Lin, B.L.; Wicks, J.M.; Falconer, R.A.; Adams, K. Integrating 1D and 2D hydrodynamic models for flood simulation. Water Manag. 2006, 159, 19–25. [Google Scholar] [CrossRef]
- Adeogun, A.G.; Pathirana, A.; Daramola, M.O. 1D-2D hydrodynamic model coupling for inundation analysis of sewer overflow. J. Eng. Appl. Sci. 2012, 7, 356–362. [Google Scholar] [CrossRef]
- Son, A.L.; Kim, B.; Han, K.Y. A simple and robust method for simultaneous consideration of overland and underground space in urban flood modeling. Water 2016, 8, 494. [Google Scholar] [CrossRef]
- Xie, J.; Wu, C.; Li, H.; Chen, G. Study on storm-water management of grassed swales and permeable pavement based on SWMM. Water 2017, 9, 840. [Google Scholar] [CrossRef]
- Yazdi, J. Water quality monitoring network design for urban drainage systems, an entropy method. Urban Water J. 2018, 15, 1–7. [Google Scholar] [CrossRef]
- Karim, M.F.; Tingsanchali, T. A coupled numerical model for simulation of wave breaking and hydraulic performances of a composite seawall. Ocean Eng. 2006, 33, 773–787. [Google Scholar] [CrossRef]
- Ebersole, B.A.; Westerink, J.J.; Bunya, S. Development of storm surge which led to flooding in St. Bernard Polder during Hurricane Katrina. Ocean Eng. 2010, 37, 91–103. [Google Scholar] [CrossRef]
- Hubbard, M.E.; Dodd, N. A 2D numerical model of wave run-up and overtopping. Coast. Eng. 2002, 47, 1–26. [Google Scholar] [CrossRef]
- Losada, I.J.; Lara, J.L.; Guanche, R. Numerical analysis of wave overtopping of rubble mound breakwaters. Coast. Eng. 2008, 55, 47–62. [Google Scholar] [CrossRef]
- Chen, X.; Ji, P.; Wu, Y.; Zhao, Y.; Zeng, L. Coupling simulation of overland flooding and underground network drainage in a coastal nuclear power plant. Nucl. Eng. Des. 2017, 325, 129–134. [Google Scholar] [CrossRef]
- Ren, X.; Yu, D.; Ruan, Y.; Yu, G. Modeling of municipal drainage and urban channel flooding in coastal city in the south of china. J. Risk Anal. Crisis Response 2015, 5, 74–86. [Google Scholar] [CrossRef]
- Hsu, T.W.; Shih, D.S.; Li, C.Y. A Study on Coastal Flooding and Risk Assessment under Climate Change in the Mid-Western Coast of Taiwan. Water 2017, 9, 390. [Google Scholar] [CrossRef]
- Lopes, C.L.; Dias, J.M. Assessment of flood hazard during extreme sea levels in a tidally dominated lagoon. Nat. Hazards 2015, 77, 1345–1364. [Google Scholar] [CrossRef]
- Karim, M.F.; Mimura, N. Impacts of climate change and sea-level rise on cyclonic storm surge floods in Bangladesh. Glob. Environ. Chang. 2008, 18, 490–500. [Google Scholar] [CrossRef]
- Zhang, W.S.; Zhao, Y.X.; Xu, Y.H. 2-D numerical simulation of radionuclide transport in the lower Yangtze River. J. Hydrodyn. 2012, 24, 702–710. [Google Scholar] [CrossRef]
- Ou, S.H.; Liau, J.M.; Hsu, T.W.; Tzang, S.Y. Simulating typhoon waves by swan wave model in coastal waters of Taiwan. Ocean Eng. 2002, 29, 947–971. [Google Scholar] [CrossRef]
- Akpınar, A.; Vledder, G.P.V.; Kömürcü, M.İ.; Özger, M. Evaluation of the numerical wave model (swan) for wave simulation in the black sea. Cont. Shelf Res. 2012, 50–51, 80–99. [Google Scholar] [CrossRef]
- Abott, M.B.; Madsen, P.A.; Sorensen, O.R. Scientific Documentation of Mike21 BW—Boussinesq Wave Module; MIKE by DHI: Hørsholm, Denmark, 2001. [Google Scholar]
- Panigrahi, J.K.; Padhy, C.P.; Murty, A.S.N. Inner harbour wave agitation using boussinesq wave model. Int. J. Nav. Archit. Ocean Eng. 2015, 7, 70–86. [Google Scholar] [CrossRef]
- Nasello, C.; Tucciarelli, T. Dual multilevel urban drainage model. J. Hydraul. Eng. 2005, 131, 748–754. [Google Scholar] [CrossRef]
- Reeve, D.E.; Soliman, A.; Lin, P.Z. Numerical study of combined overflow and wave overtopping over a smooth impermeable seawall. Coast. Eng. 2008, 55, 155–166. [Google Scholar] [CrossRef]
- Miao, Q.; Jiang, W.; Zhang, C.L. Common calculation methods of wave run-up and overtopping. Guangdong Water Resour. Hydropower 2008, 8, 11–13. (In Chinese) [Google Scholar]
- Vandenbroeck, J.M.; Keller, J.B. Weir flows. J. Fluid Mech. 1987, 176, 283–293. [Google Scholar] [CrossRef]
- Liu, S.H.; Luo, Q.S.; Mei, J.Y. Simulation of sediment-laden flow by depth-averaged model based on unstructured collocated grid. J. Hydrodyn. 2007, 19, 525–532. [Google Scholar] [CrossRef]
- Du, Y.; Pan, S.; Chen, Y. Modelling the effect of wave overtopping on nearshore hydrodynamics and morphodynamics around shore-parallel breakwaters. Coast. Eng. 2010, 57, 812–826. [Google Scholar] [CrossRef]


| Rainfall Duration (h) | 0.5 | 1 | 2 | 3 | 4 | 5 | 6 | 7 | 8 | 9 | 10 | 11 | 12 |
| HPMP,AR (mm) | 185 | 261 | 364 | 446 | 514 | 574 | 628 | 661 | 691 | 720 | 746 | 769 | 790 |
| Rainfall duration (h) | 13 | 14 | 15 | 16 | 17 | 18 | 19 | 20 | 21 | 22 | 23 | 24 | |
| HPMP,AR (mm) | 810 | 830 | 850 | 870 | 890 | 908 | 926 | 943 | 959 | 974 | 987 | 1000 |
| Time (h) | Tidal Level (m) | Seawall Section 1-1 | Seawall Section 1-2 | Seawall Section 1-3 | |||
|---|---|---|---|---|---|---|---|
| HS (m) | Qw (m3/m/s) | HS (m) | Qw (m3/m/s) | HS (m) | Qw (m3/m/s) | ||
| 0:00 | 6.04 | 1.49 | 0 | 1.03 | 0 | 2.12 | 0 |
| 1:00 | 8.99 | 2.75 | 0.005 | 2.02 | 0.001 | 3.45 | 0.05 |
| 1:30 | 9.76 | 3.60 | 0.10 | 2.79 | 0.06 | 4.21 | 0.23 |
| 2:00 | 10.01 | 4.34 | 0.25 | 3.58 | 0.19 | 4.90 | 0.44 |
| 2:30 | 9.54 | 4.47 | 0.16 | 3.86 | 0.11 | 4.97 | 0.38 |
| 3:00 | 8.46 | 4.42 | 0.09 | 3.99 | 0.06 | 4.62 | 0.14 |
| 4:00 | 5.69 | 3.78 | 0.001 | 3.56 | 0.002 | 3.86 | 0.001 |
| Time (h) | Measured Value (m/s) | Calculated Value (m/s) | Relative Error |
|---|---|---|---|
| 2:50 | 0.5 | 0.53 | 6% |
| 3:45 | 1.25 | 1.19 | −4.80% |
| 4:50 | 1.22 | 1.24 | 1.60% |
| 5:10 | 0.8 | 0.92 | 15% |
| 7:20 | 1.24 | 1.4 | 13% |
© 2019 by the authors. Licensee MDPI, Basel, Switzerland. This article is an open access article distributed under the terms and conditions of the Creative Commons Attribution (CC BY) license (http://creativecommons.org/licenses/by/4.0/).
Share and Cite
Wang, S.; Zhang, W.; Chen, F. Simulation of Drainage Capacity in a Coastal Nuclear Power Plant under Extreme Rainfall and Tropical Storm. Sustainability 2019, 11, 642. https://doi.org/10.3390/su11030642
Wang S, Zhang W, Chen F. Simulation of Drainage Capacity in a Coastal Nuclear Power Plant under Extreme Rainfall and Tropical Storm. Sustainability. 2019; 11(3):642. https://doi.org/10.3390/su11030642
Chicago/Turabian StyleWang, Shuangling, Wanshun Zhang, and Fajin Chen. 2019. "Simulation of Drainage Capacity in a Coastal Nuclear Power Plant under Extreme Rainfall and Tropical Storm" Sustainability 11, no. 3: 642. https://doi.org/10.3390/su11030642
APA StyleWang, S., Zhang, W., & Chen, F. (2019). Simulation of Drainage Capacity in a Coastal Nuclear Power Plant under Extreme Rainfall and Tropical Storm. Sustainability, 11(3), 642. https://doi.org/10.3390/su11030642