National Green GDP Assessment and Prediction for China Based on a CA-Markov Land Use Simulation Model


 ,
, 
Abstract
1. Introduction
2. Study Area and Data Sources
2.1. Study Area
2.2. Data Sources
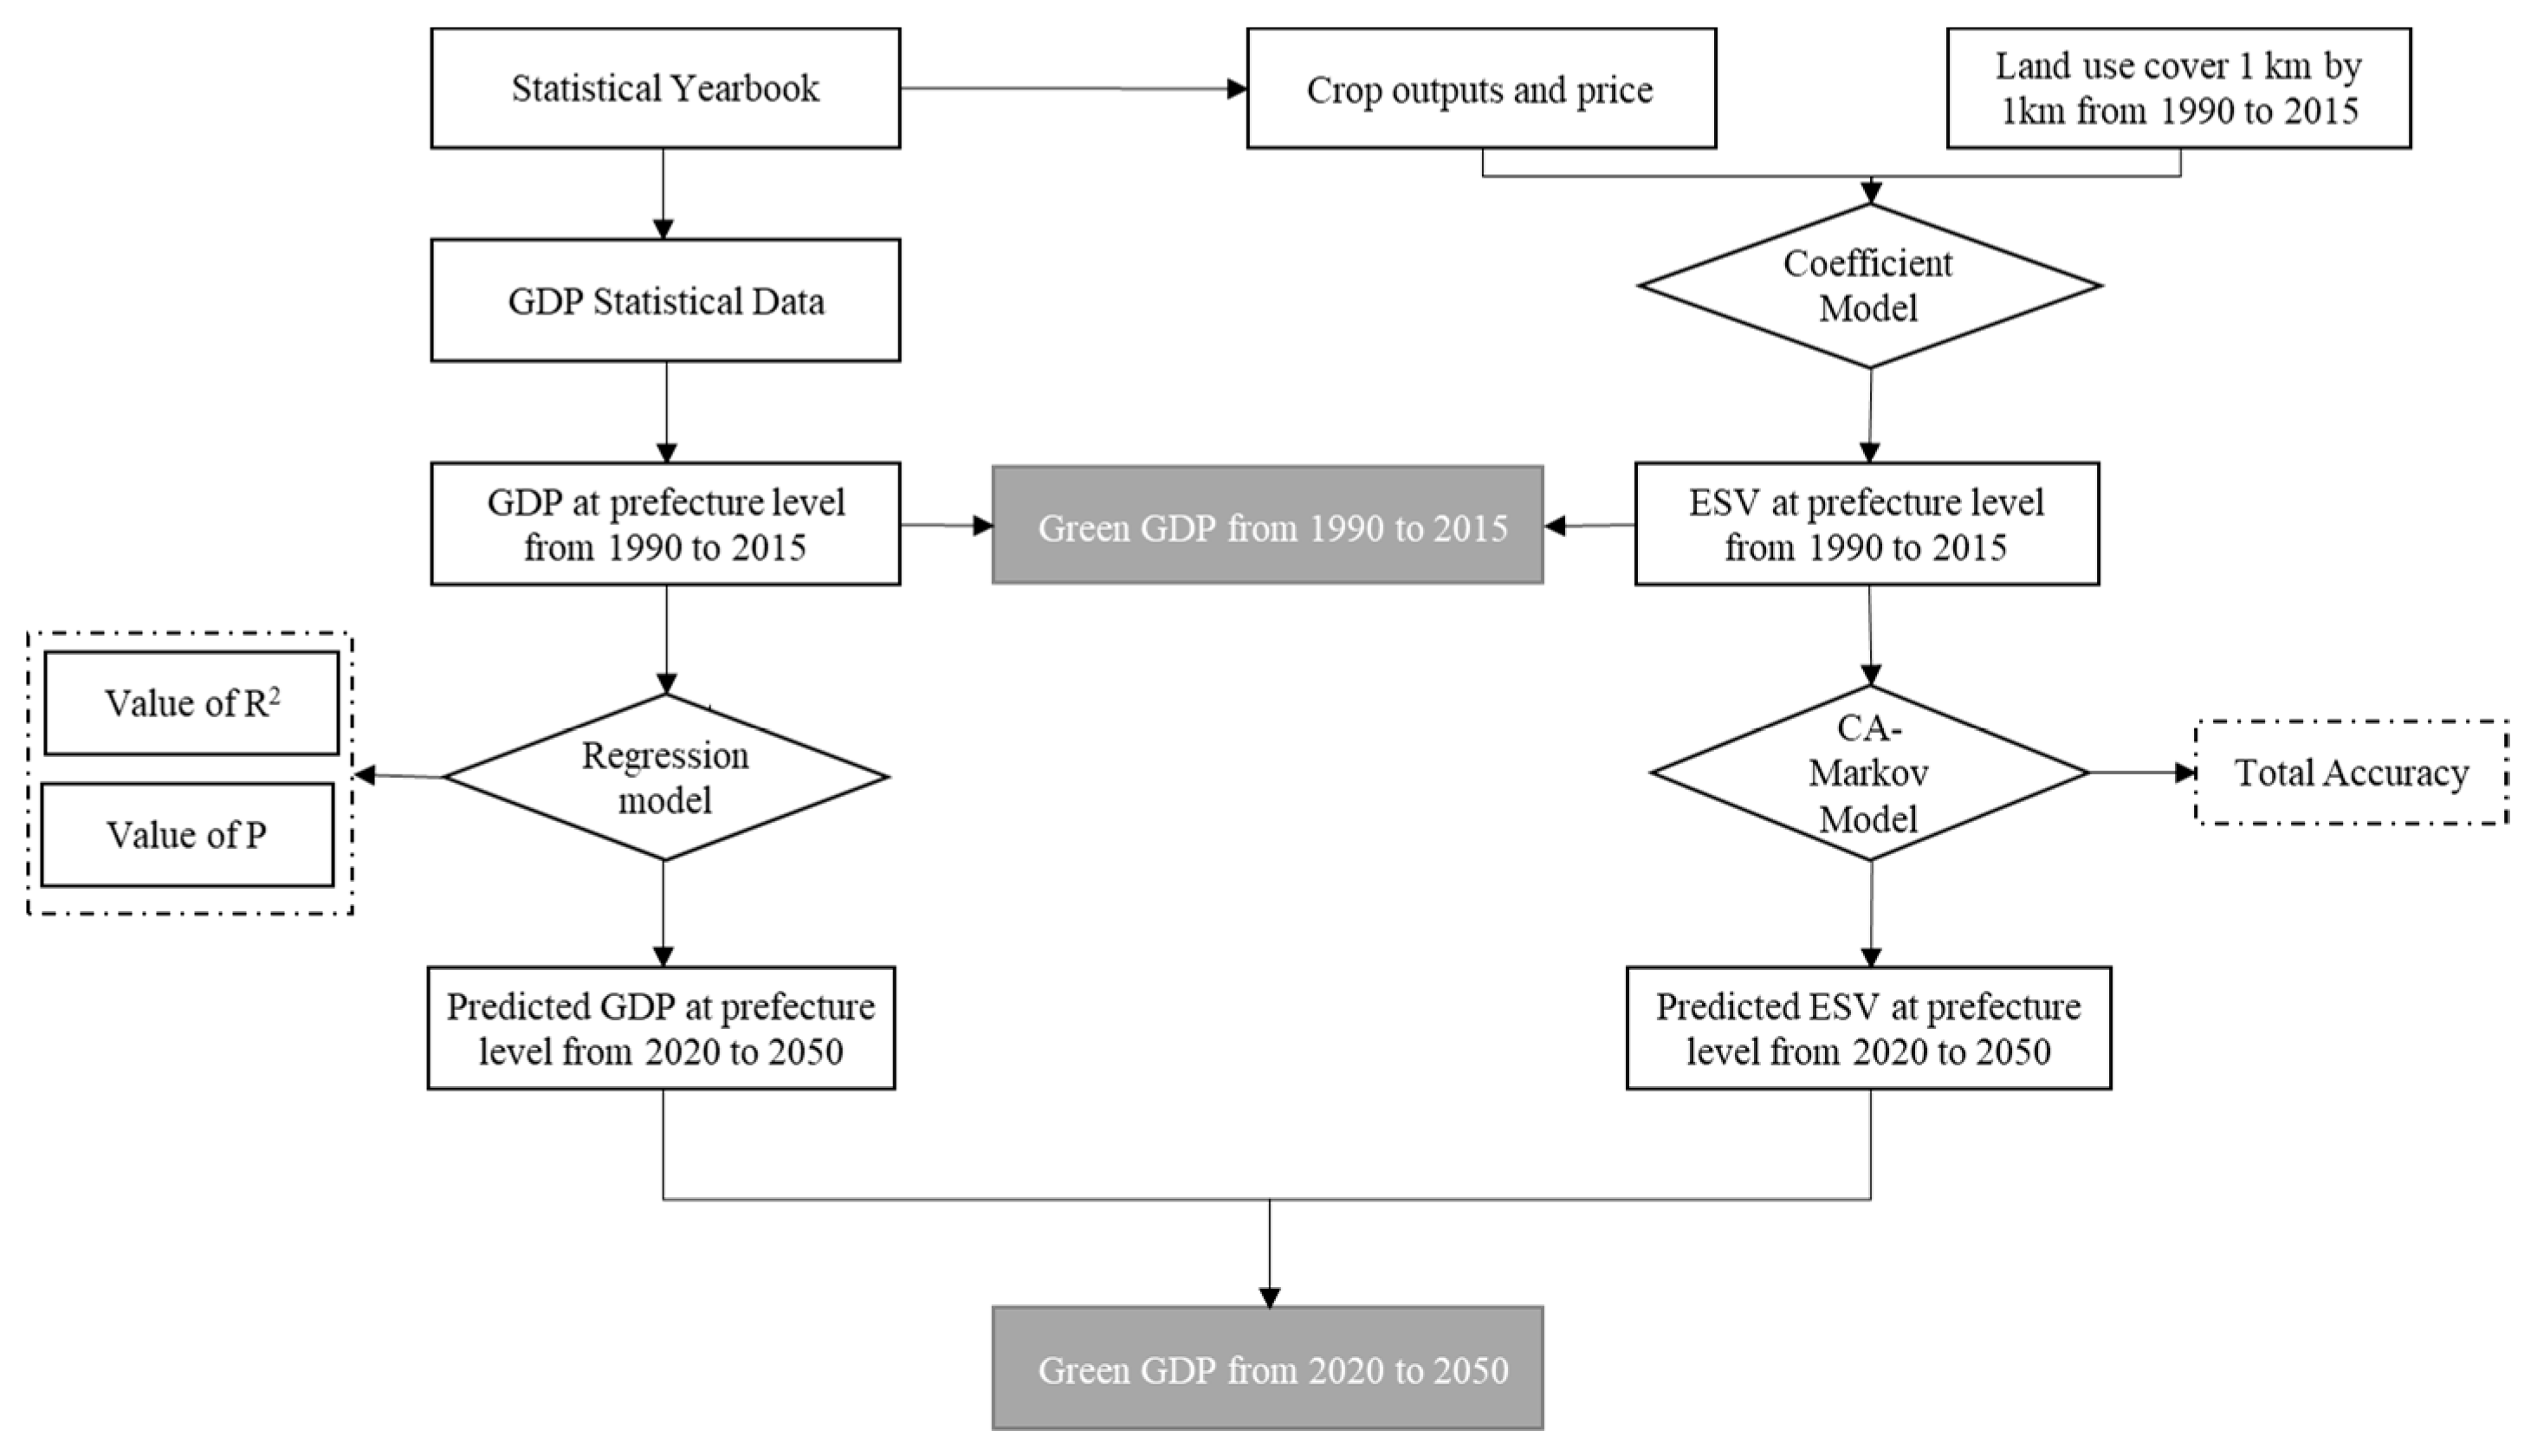
3. Methods
3.1. Estimation of the Ecosystem Service Value
3.2. Estimation of Green GDP
3.3. ESV Forecasting Based on the CA-Markov Model
3.4. Gross Domestic Product Forecasting Based on the Regress Model
4. Results
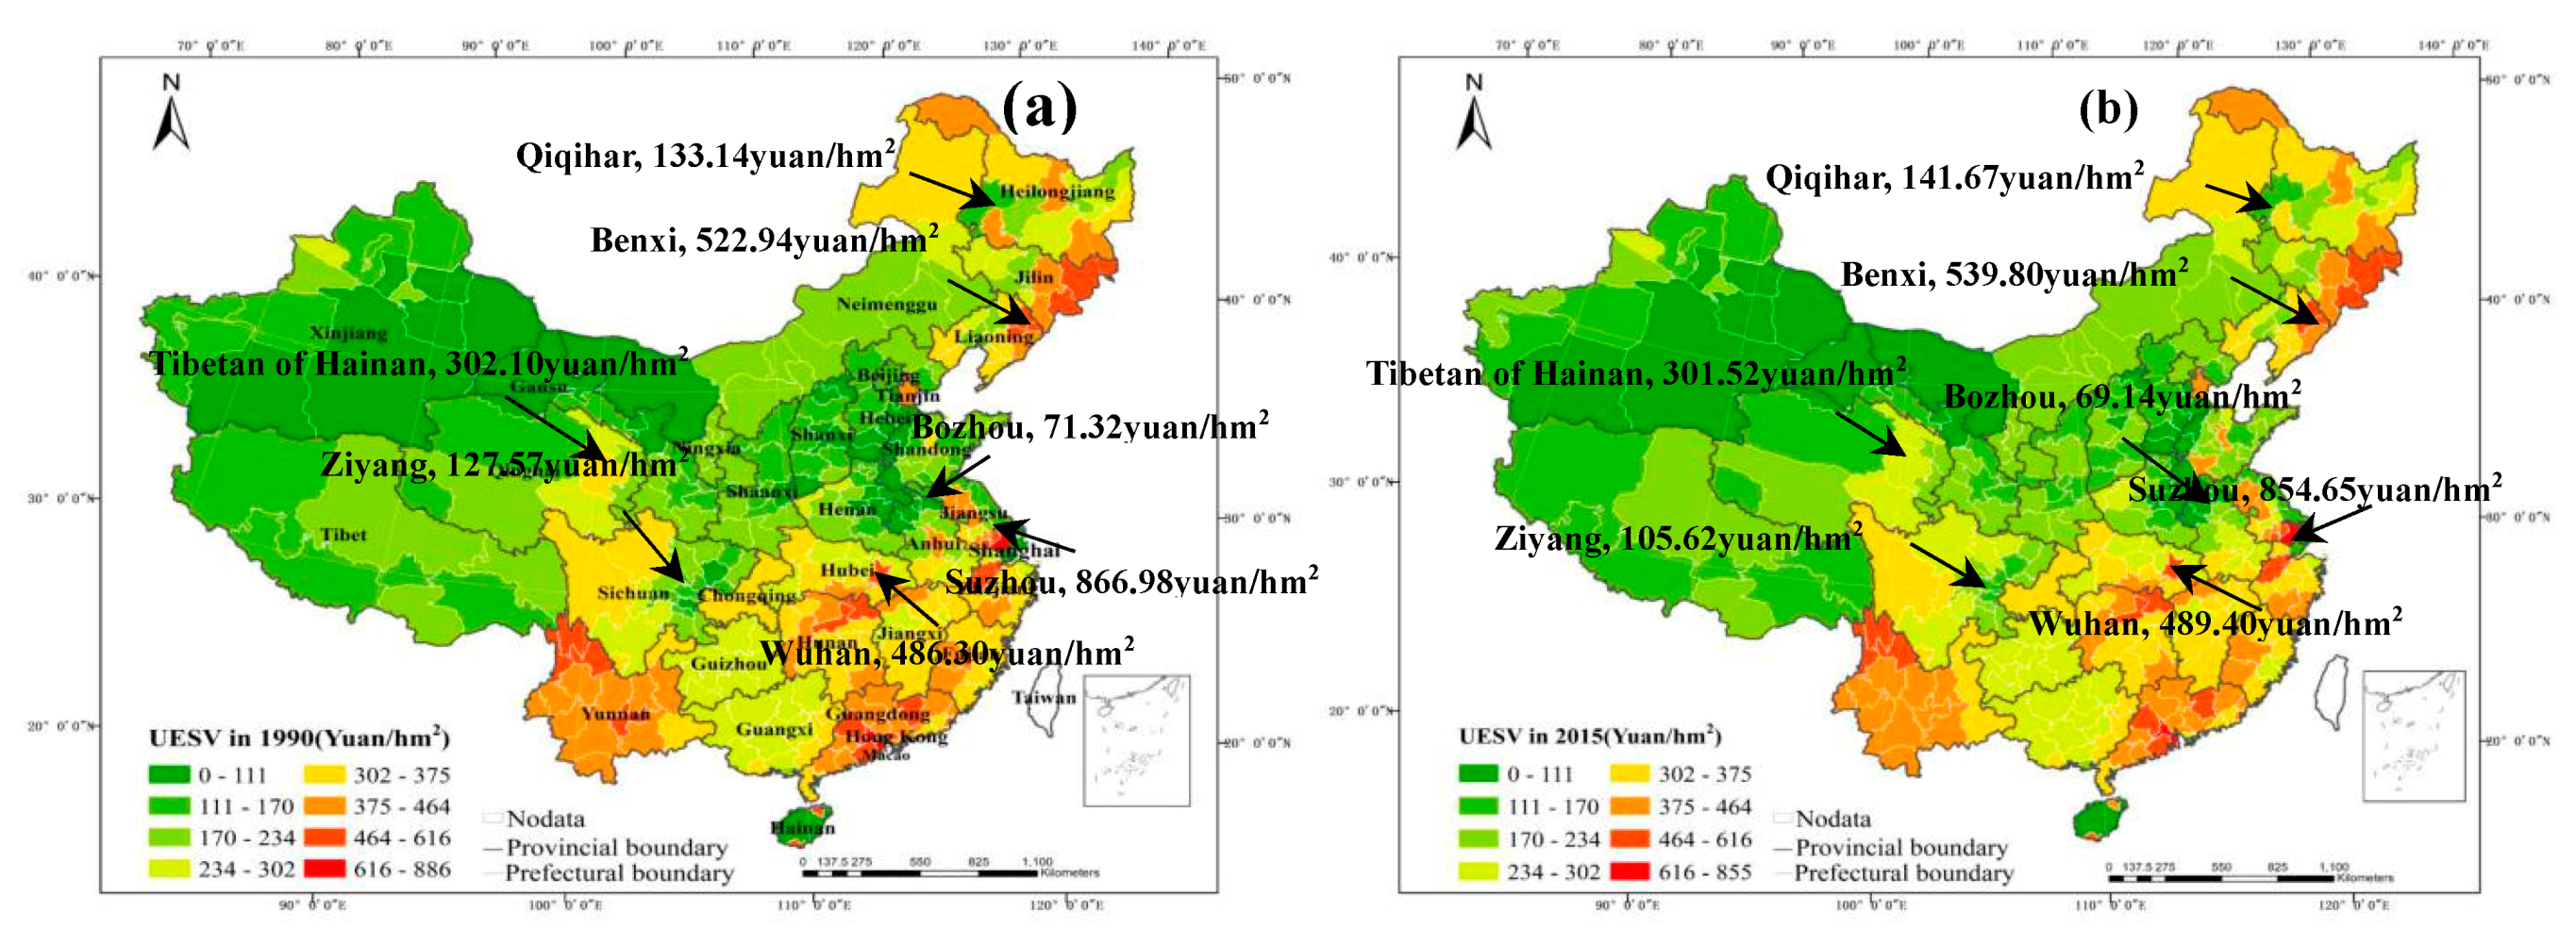
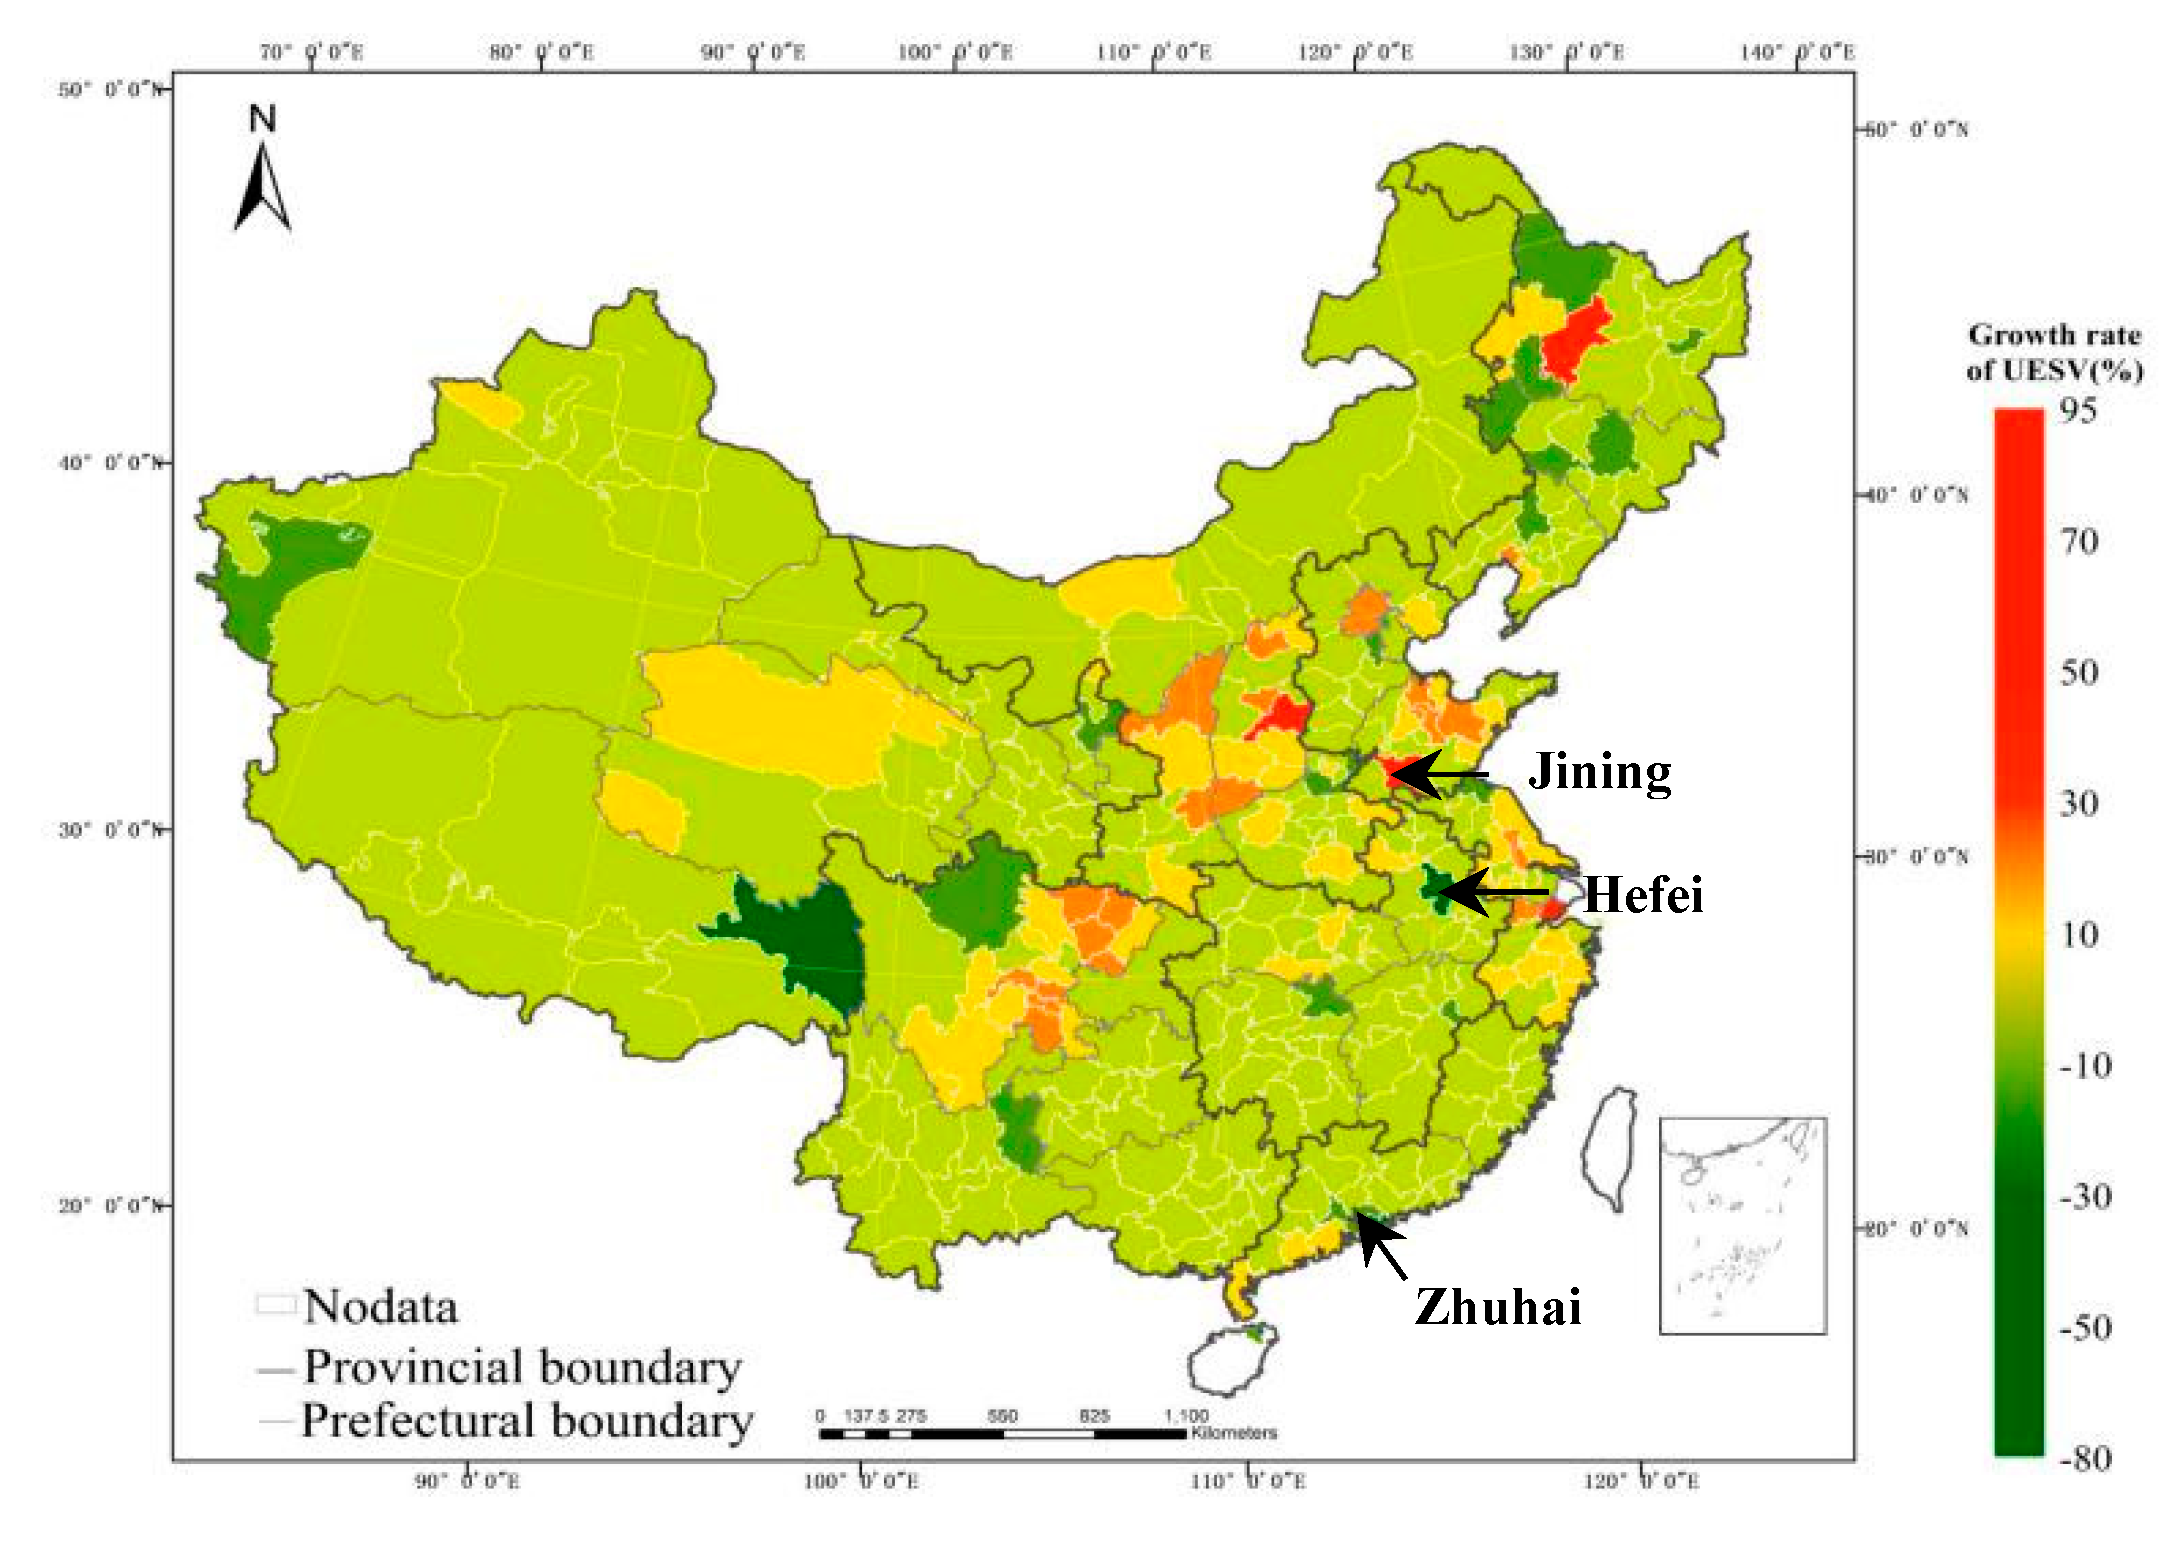
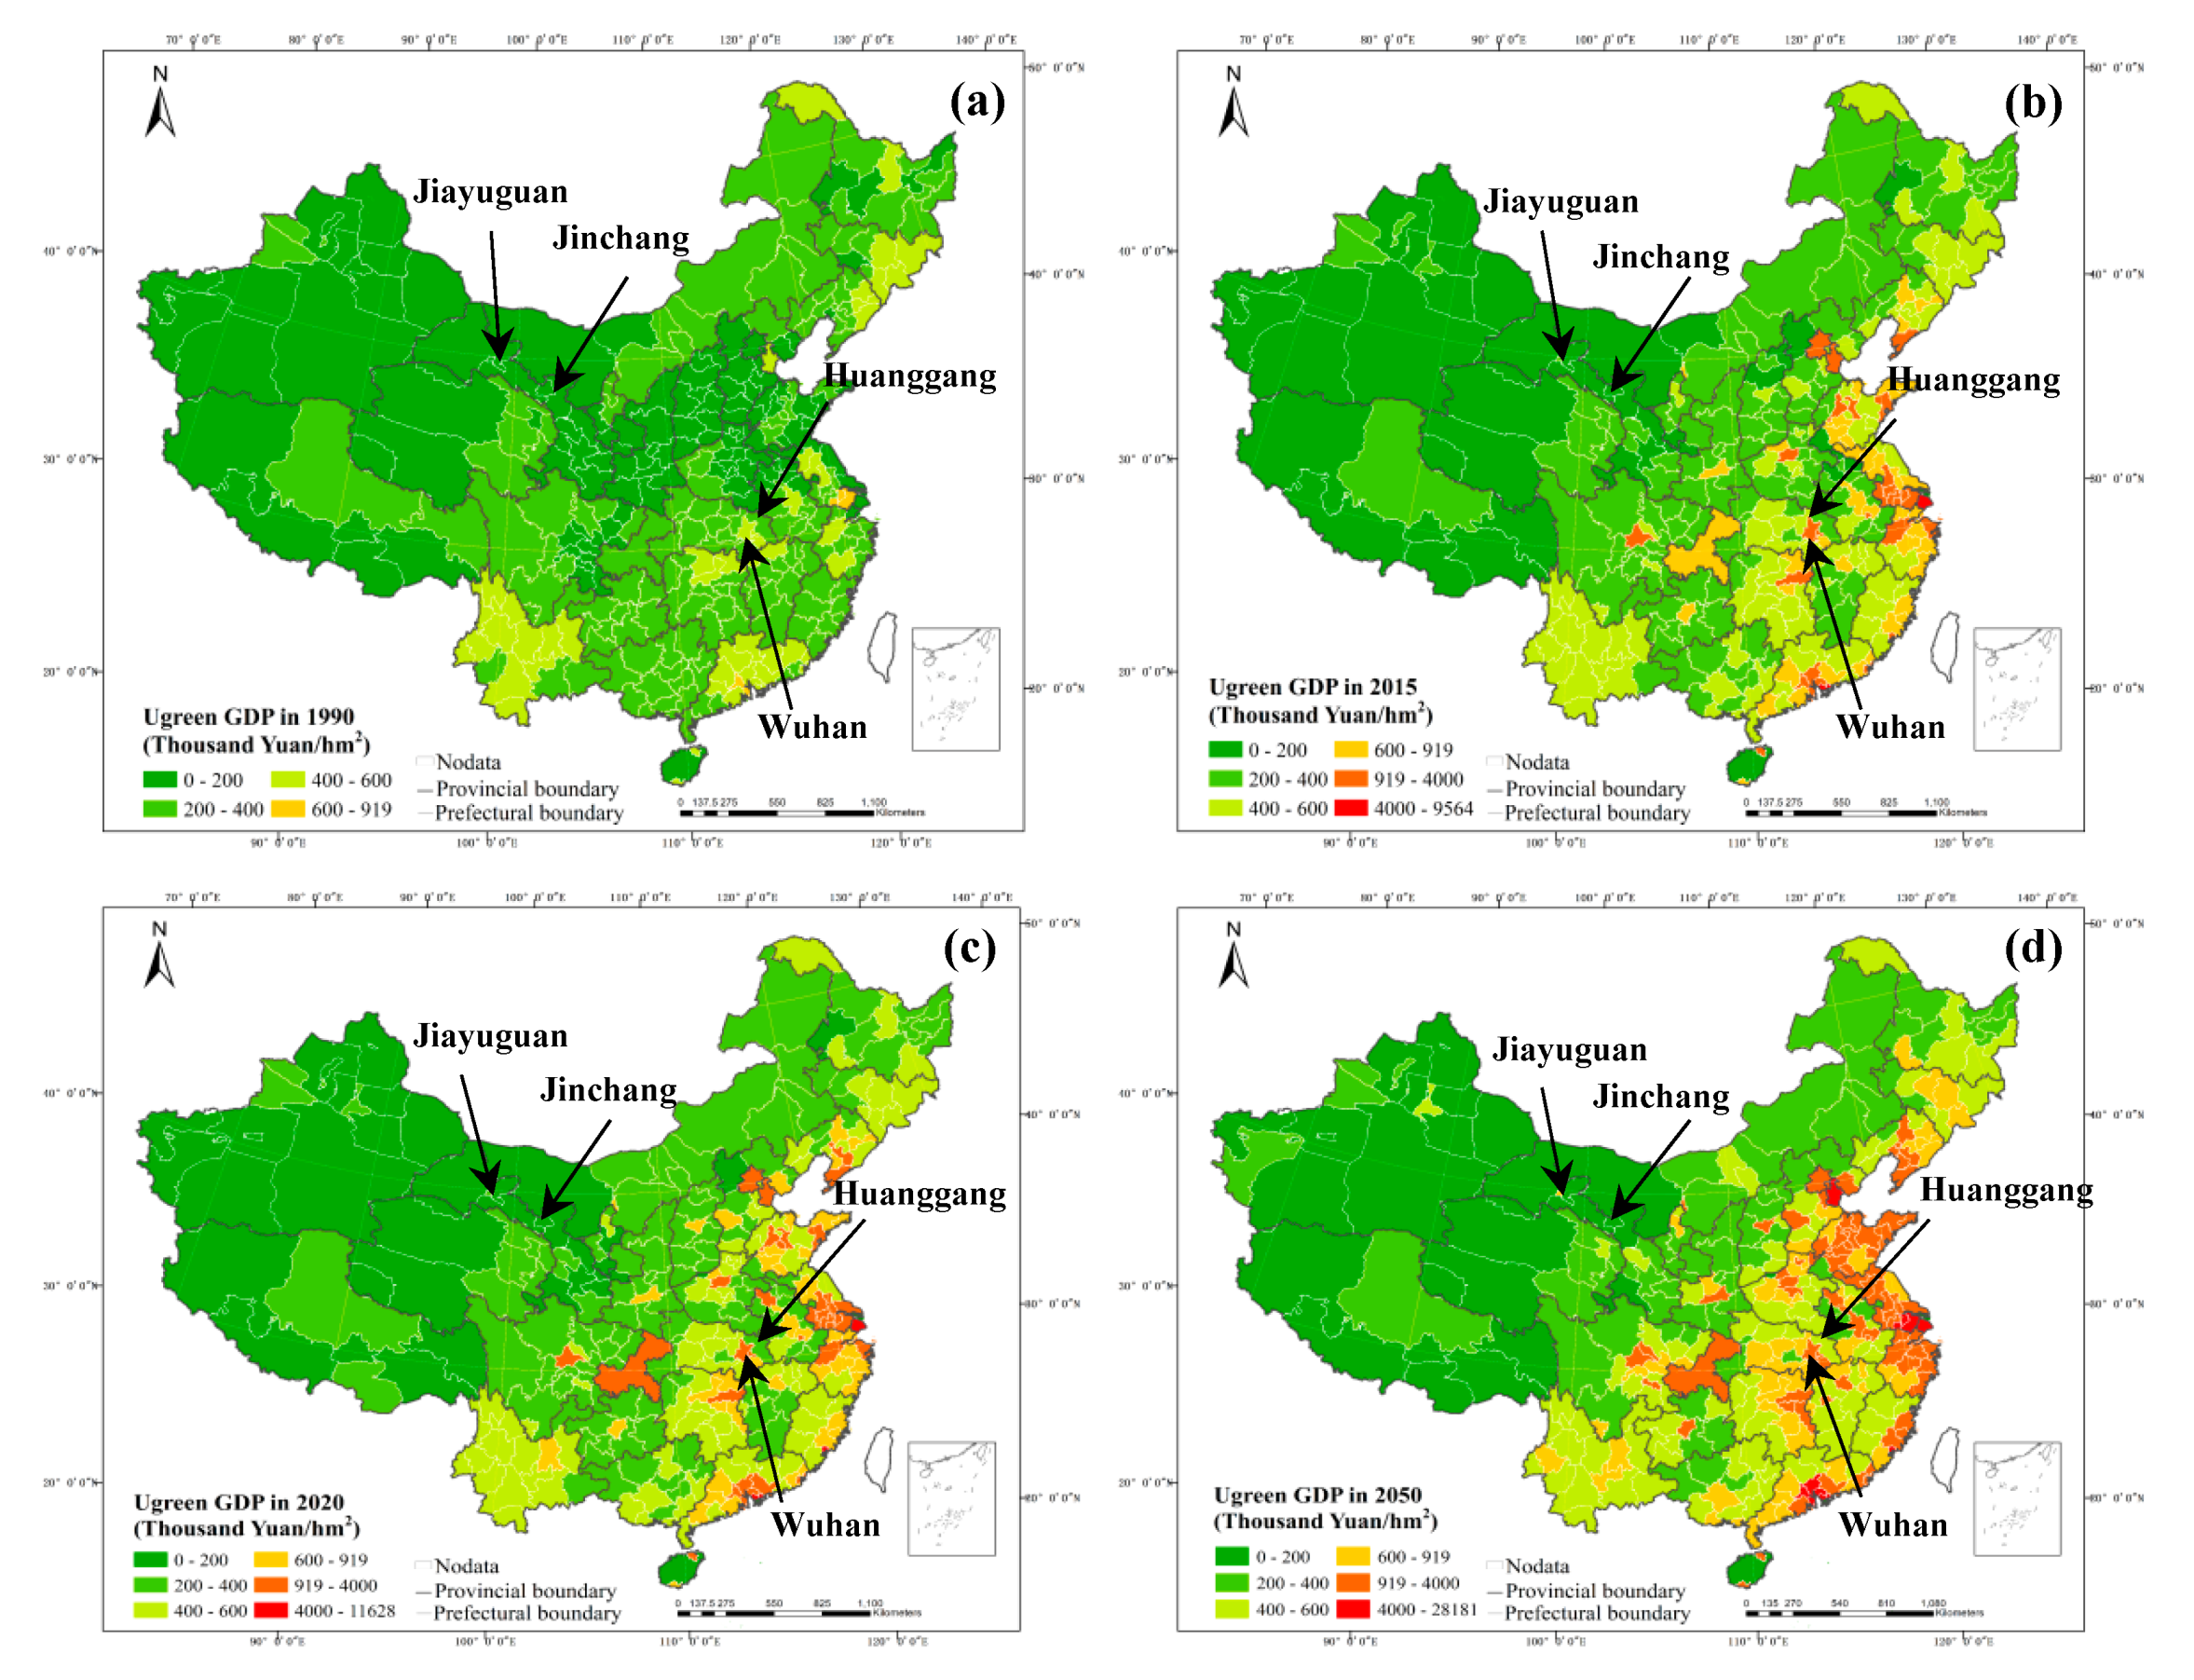
4.1. Temporal and Spatial Variations of ESV from 1990 to 2015
4.2. ESV Forecasting Based on Future Land Use Change
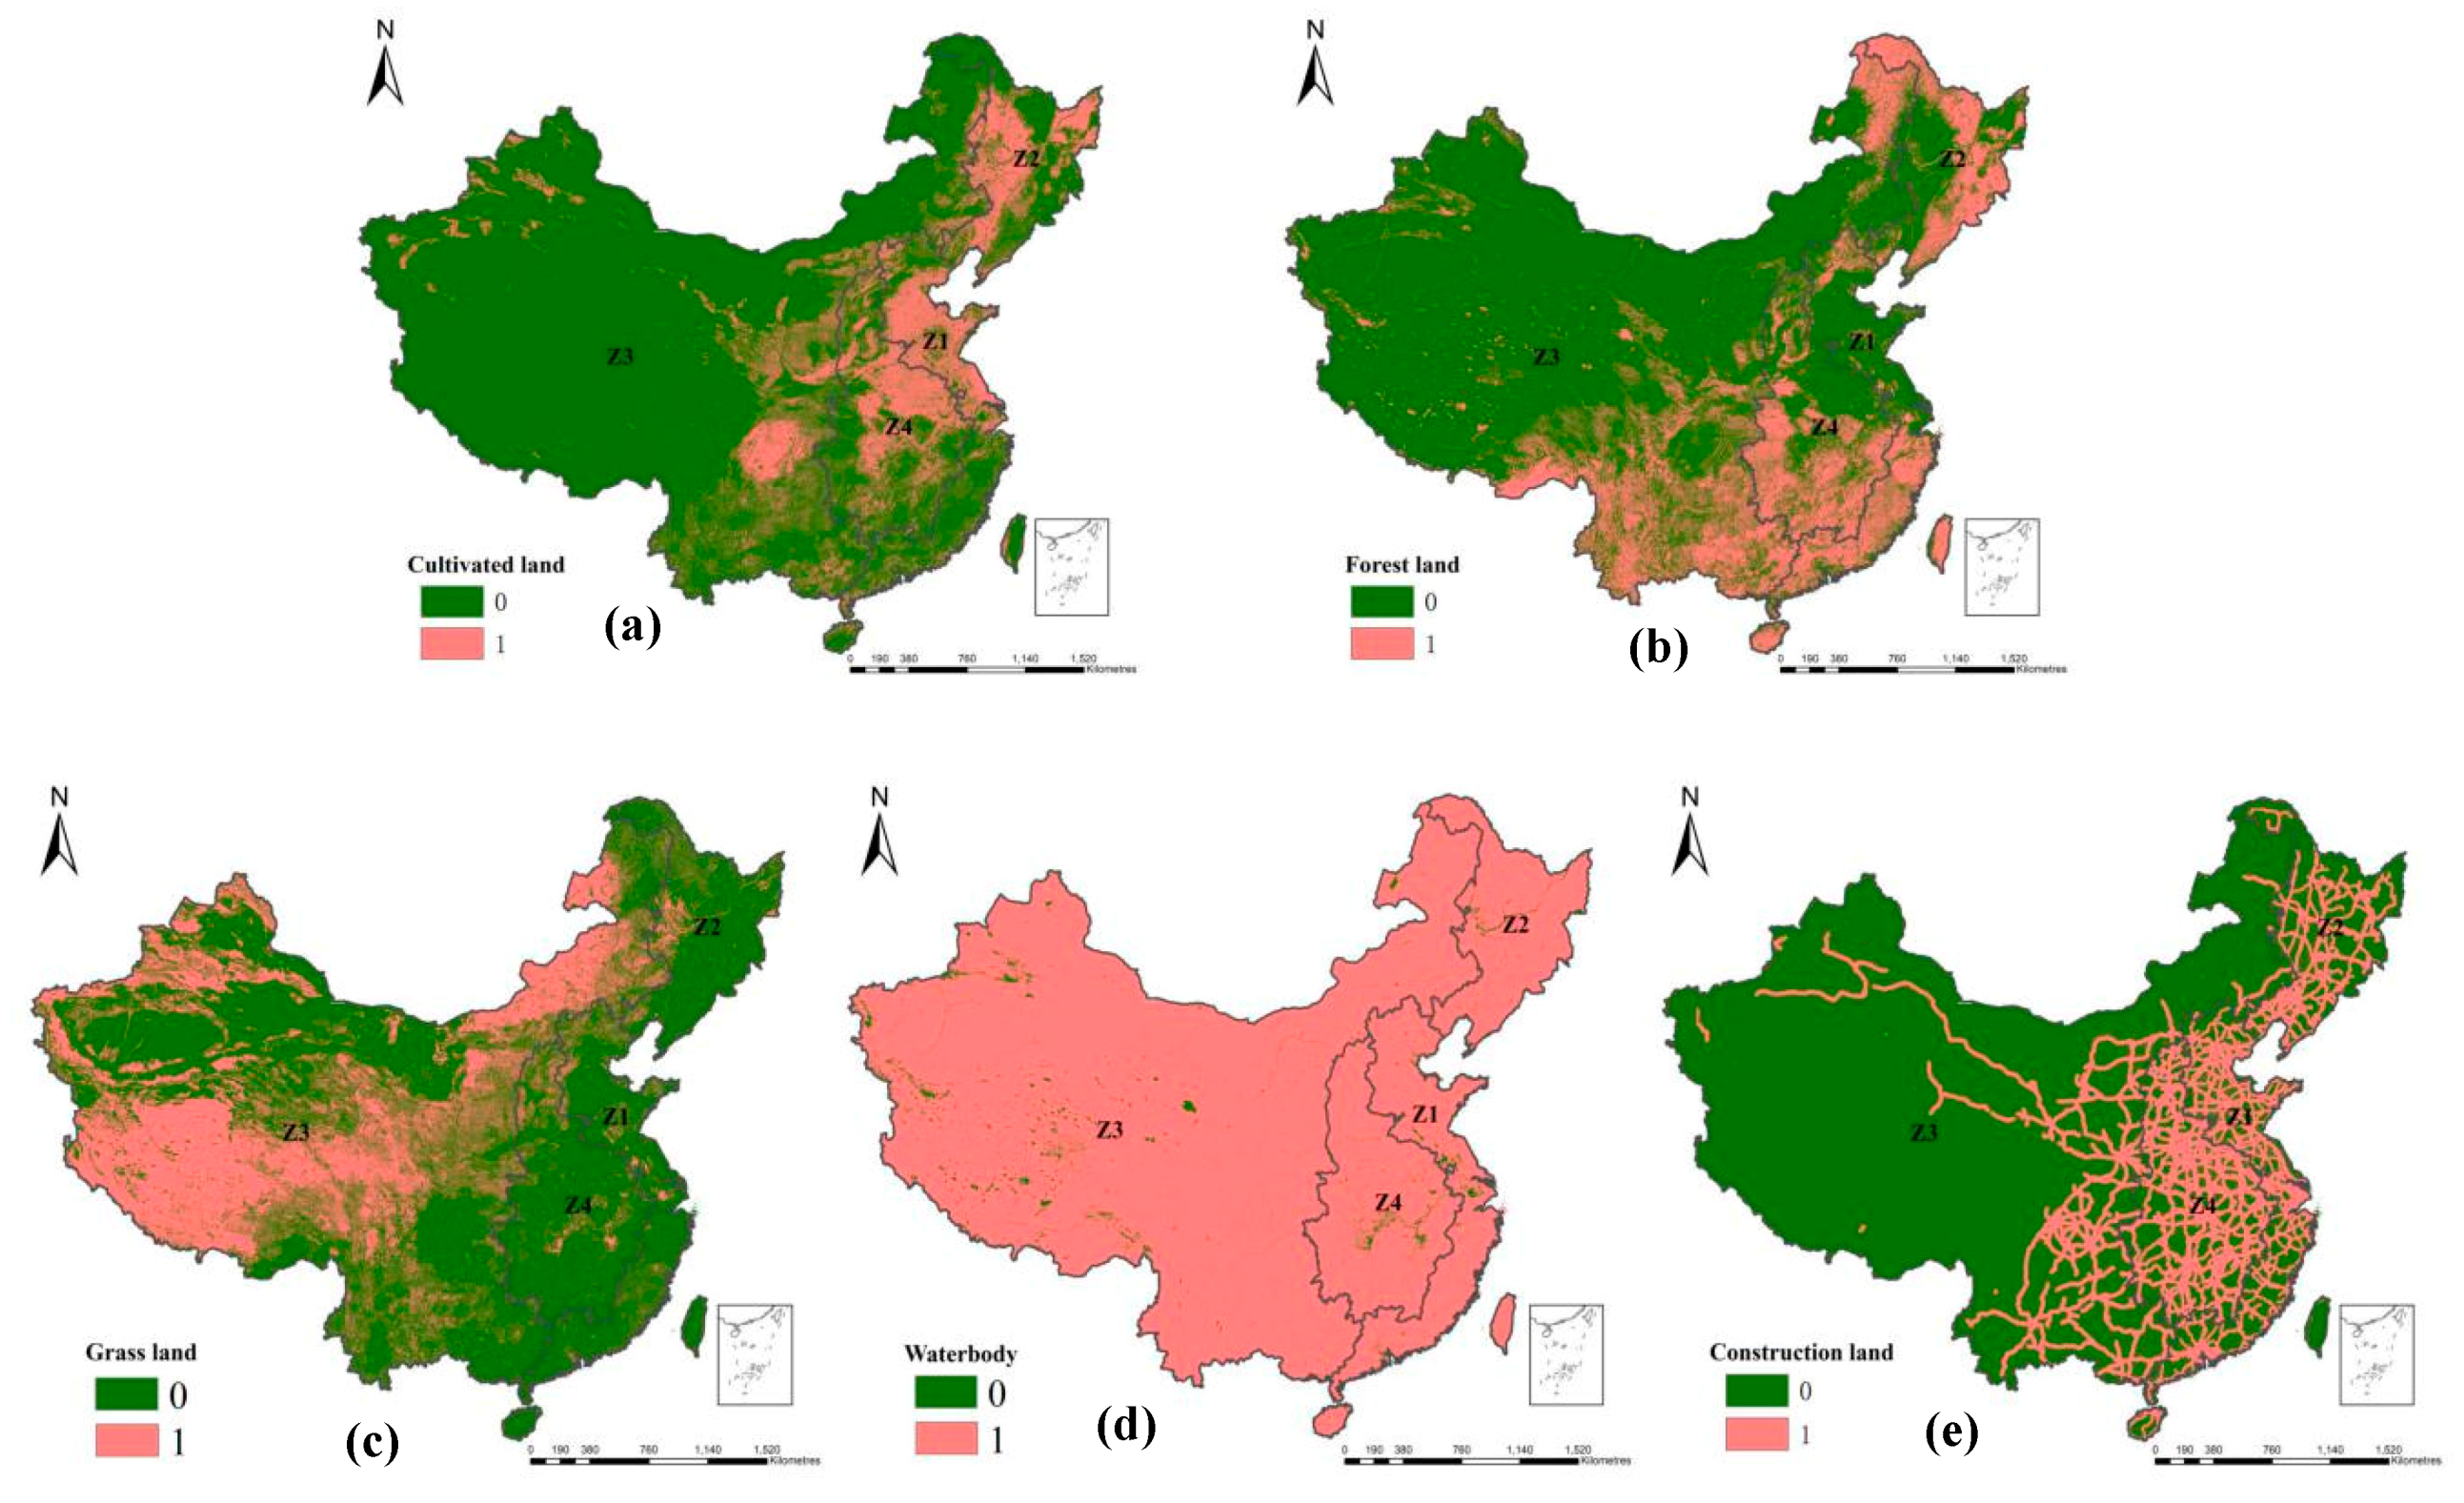
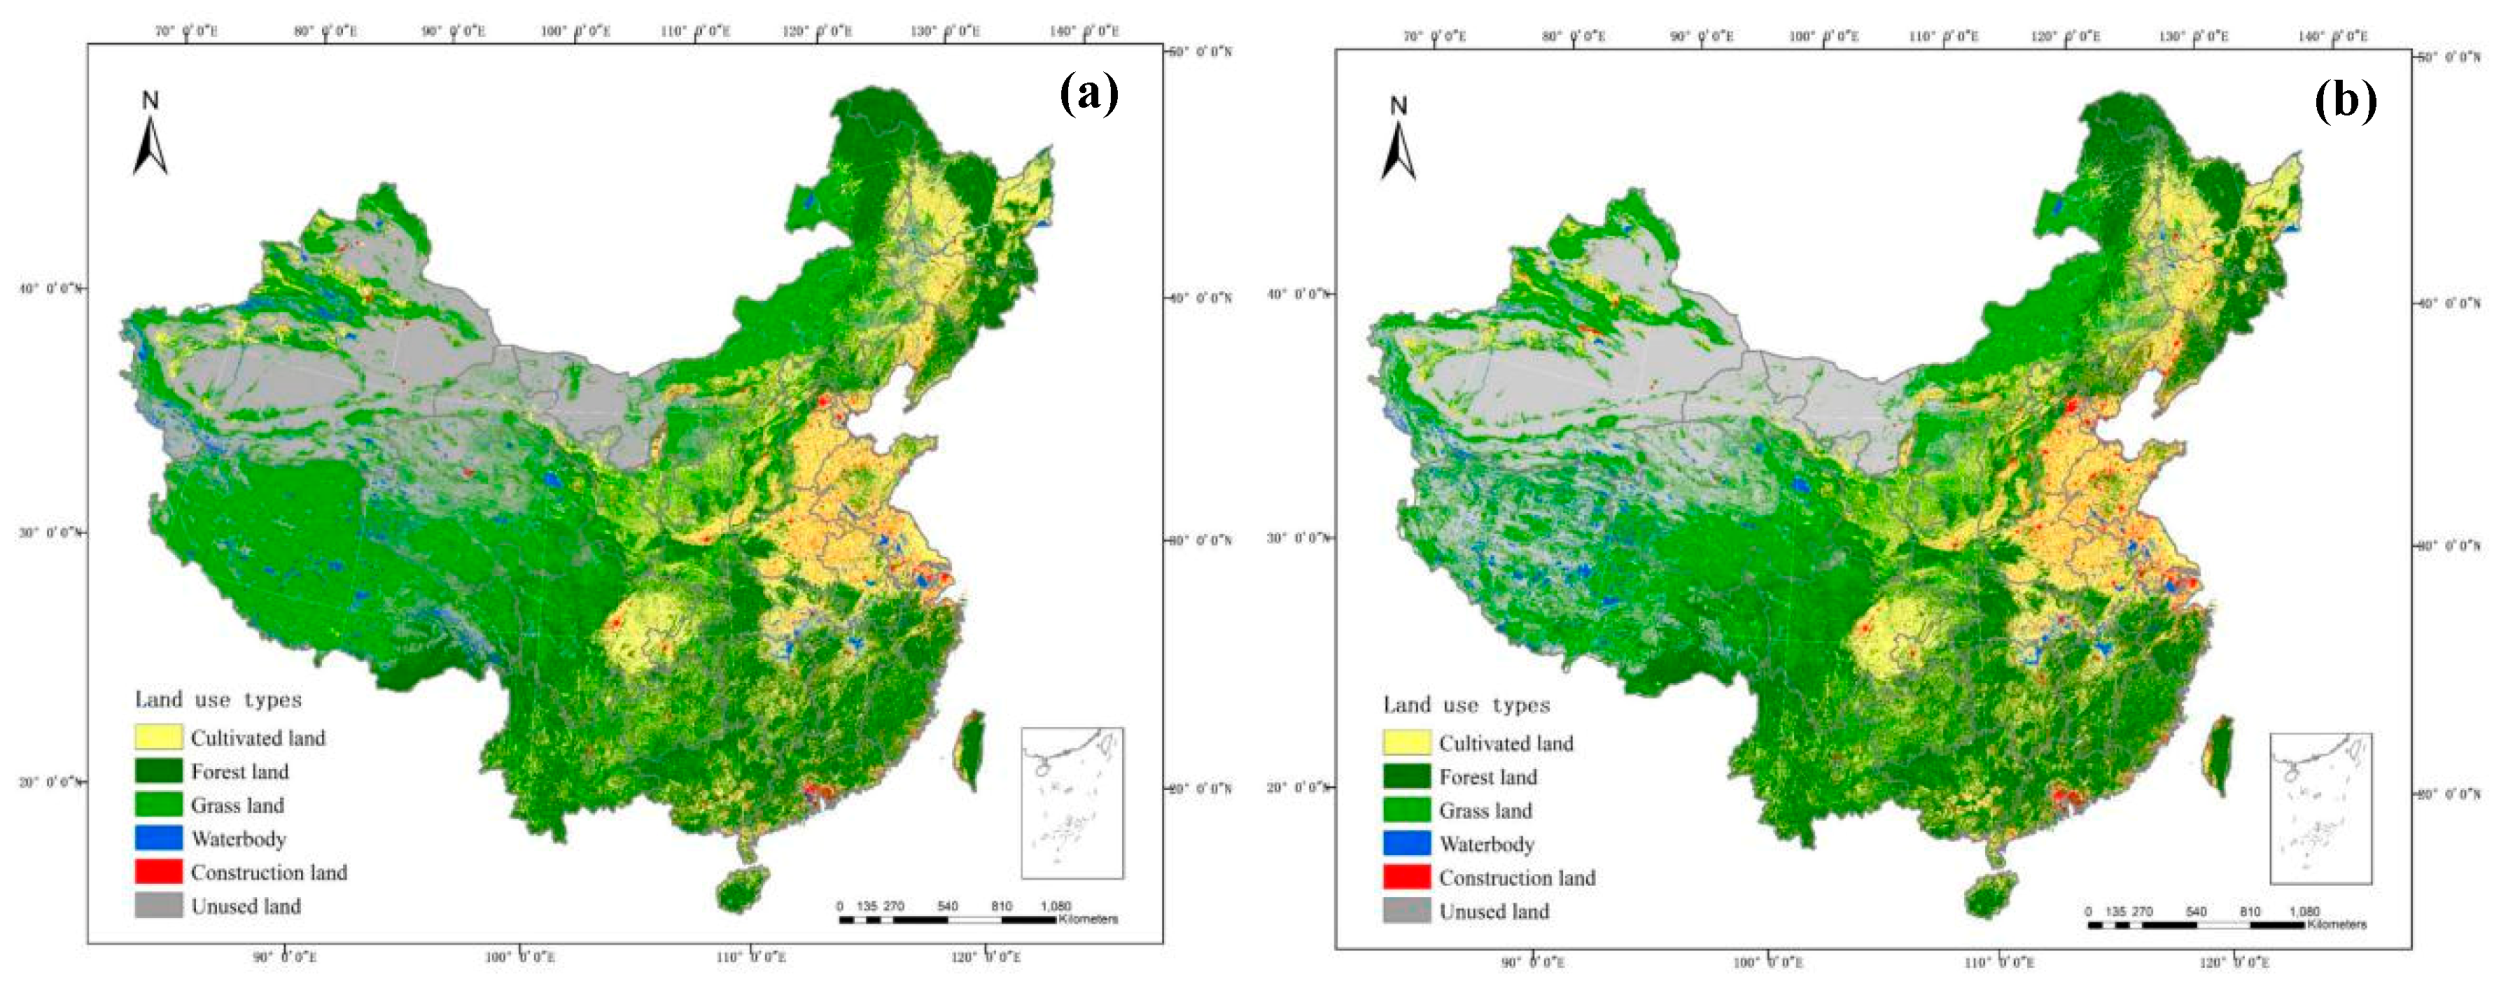
4.2.1. Future Land Use Simulation
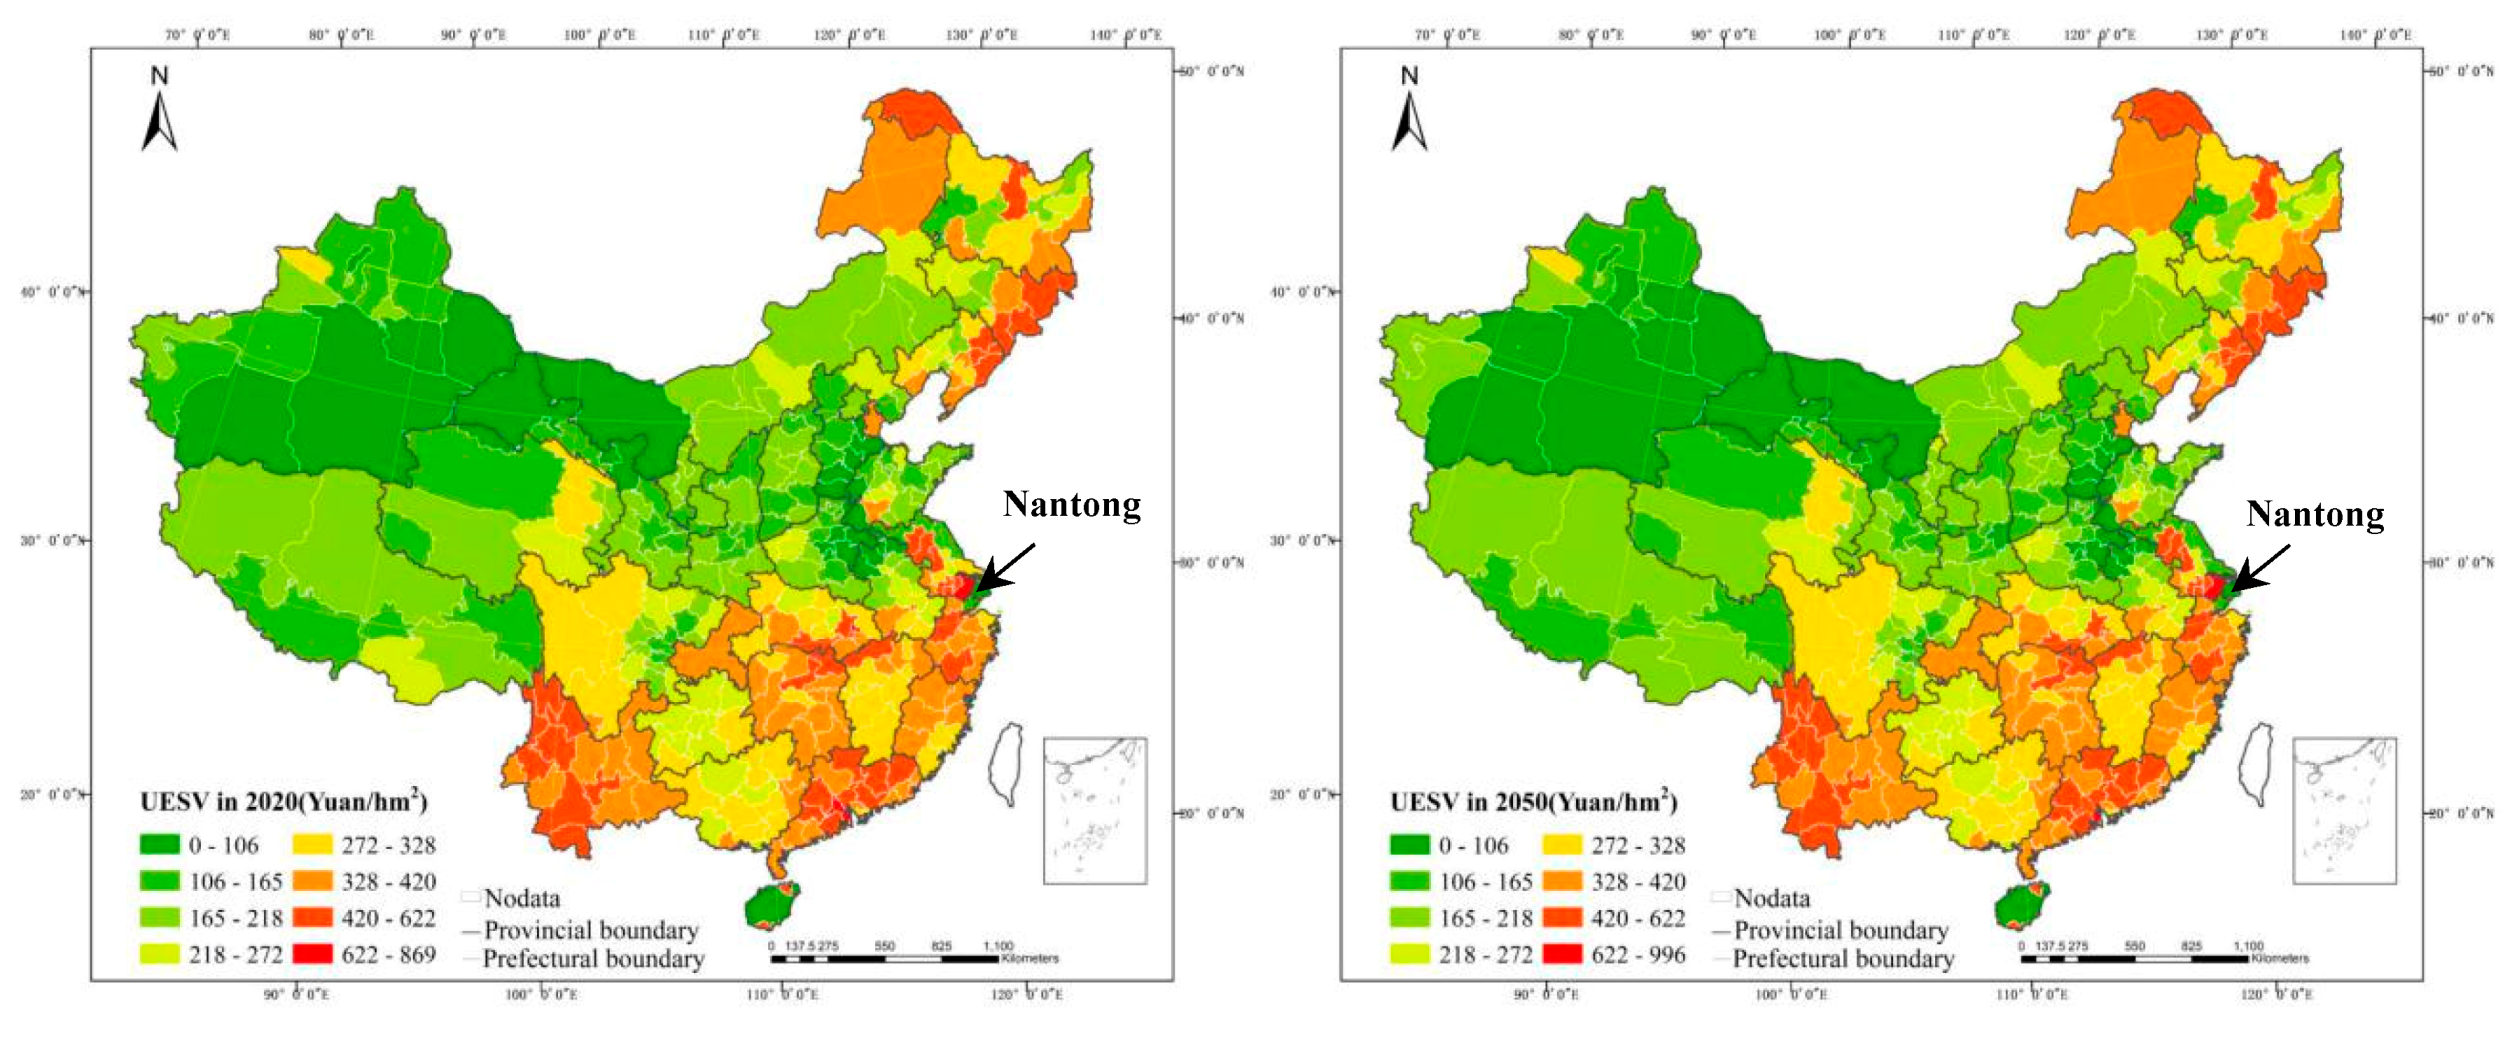
4.2.2. Forecasted ESV from 2020 to 2050
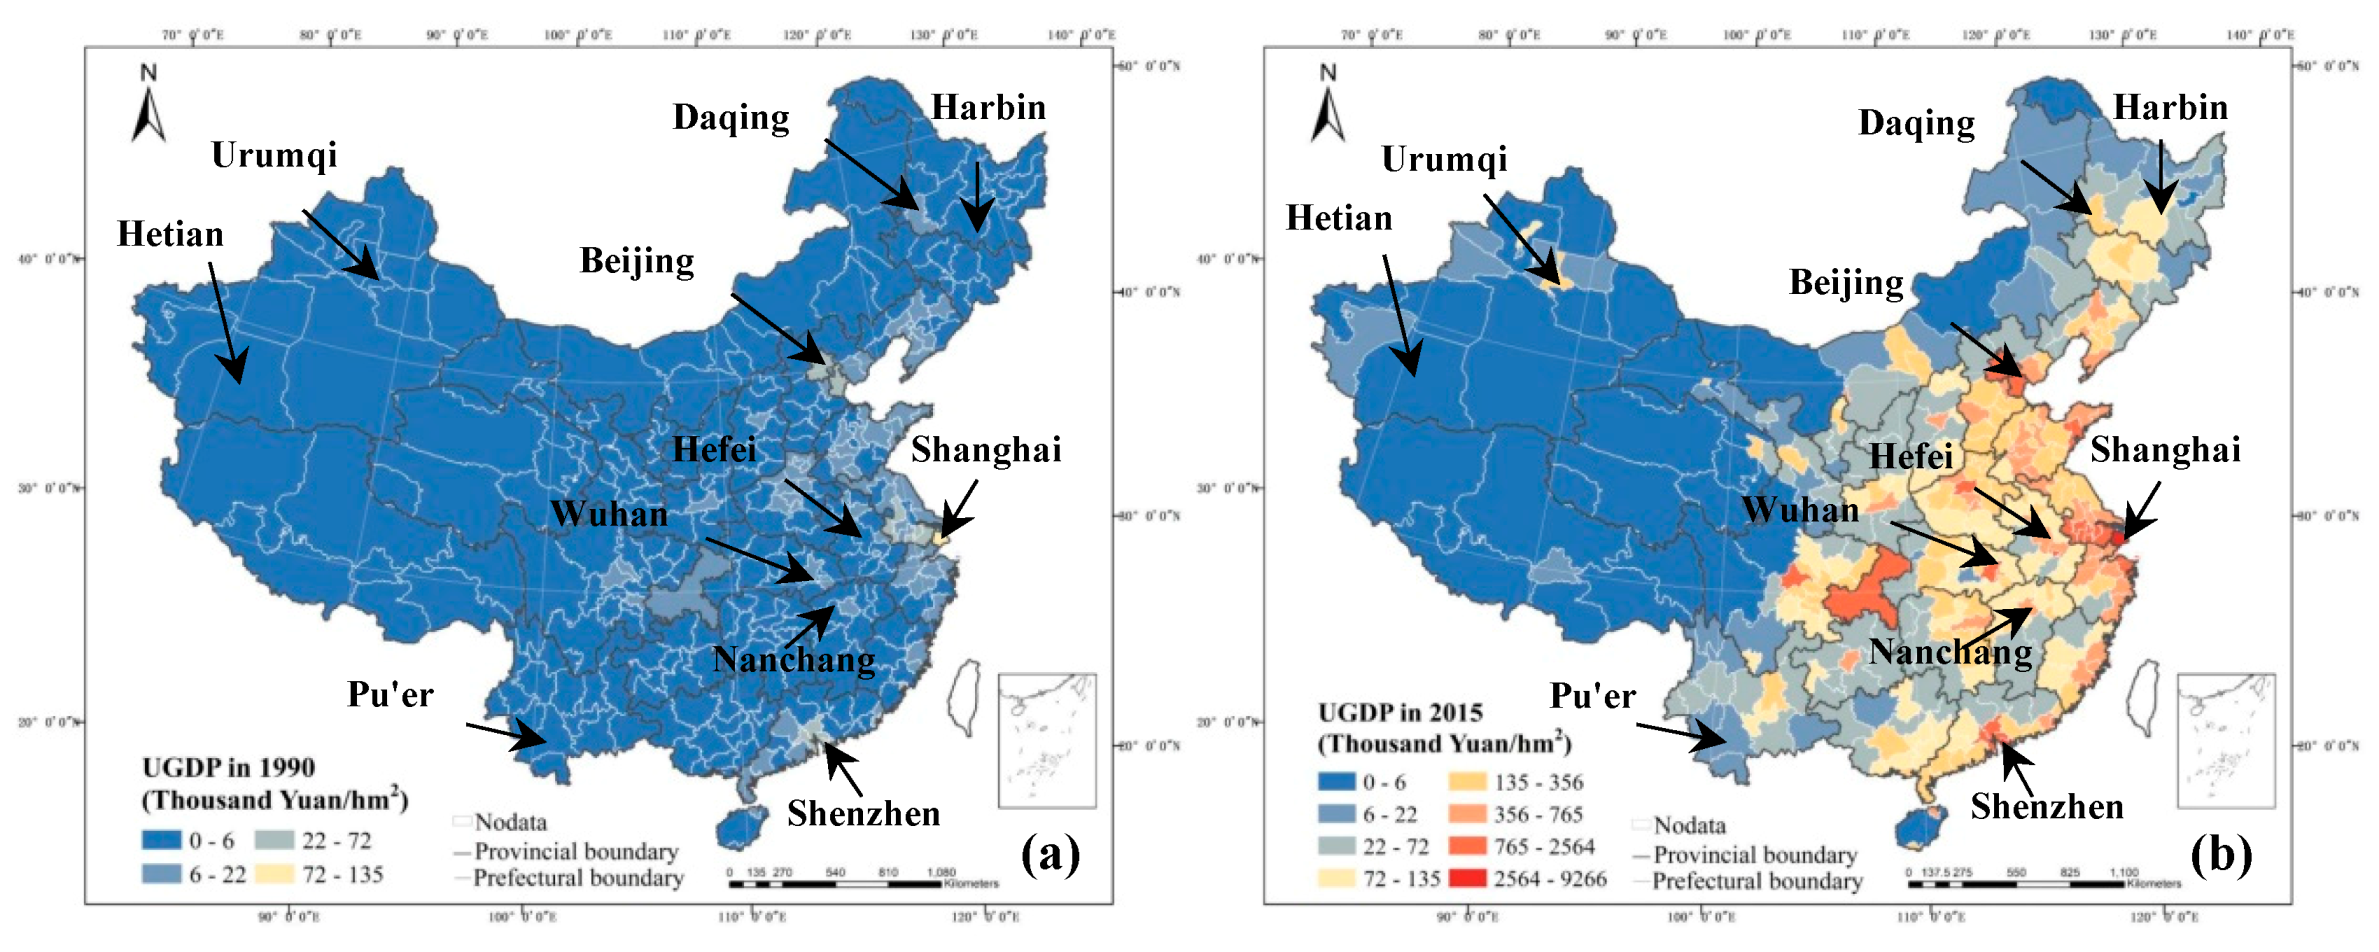
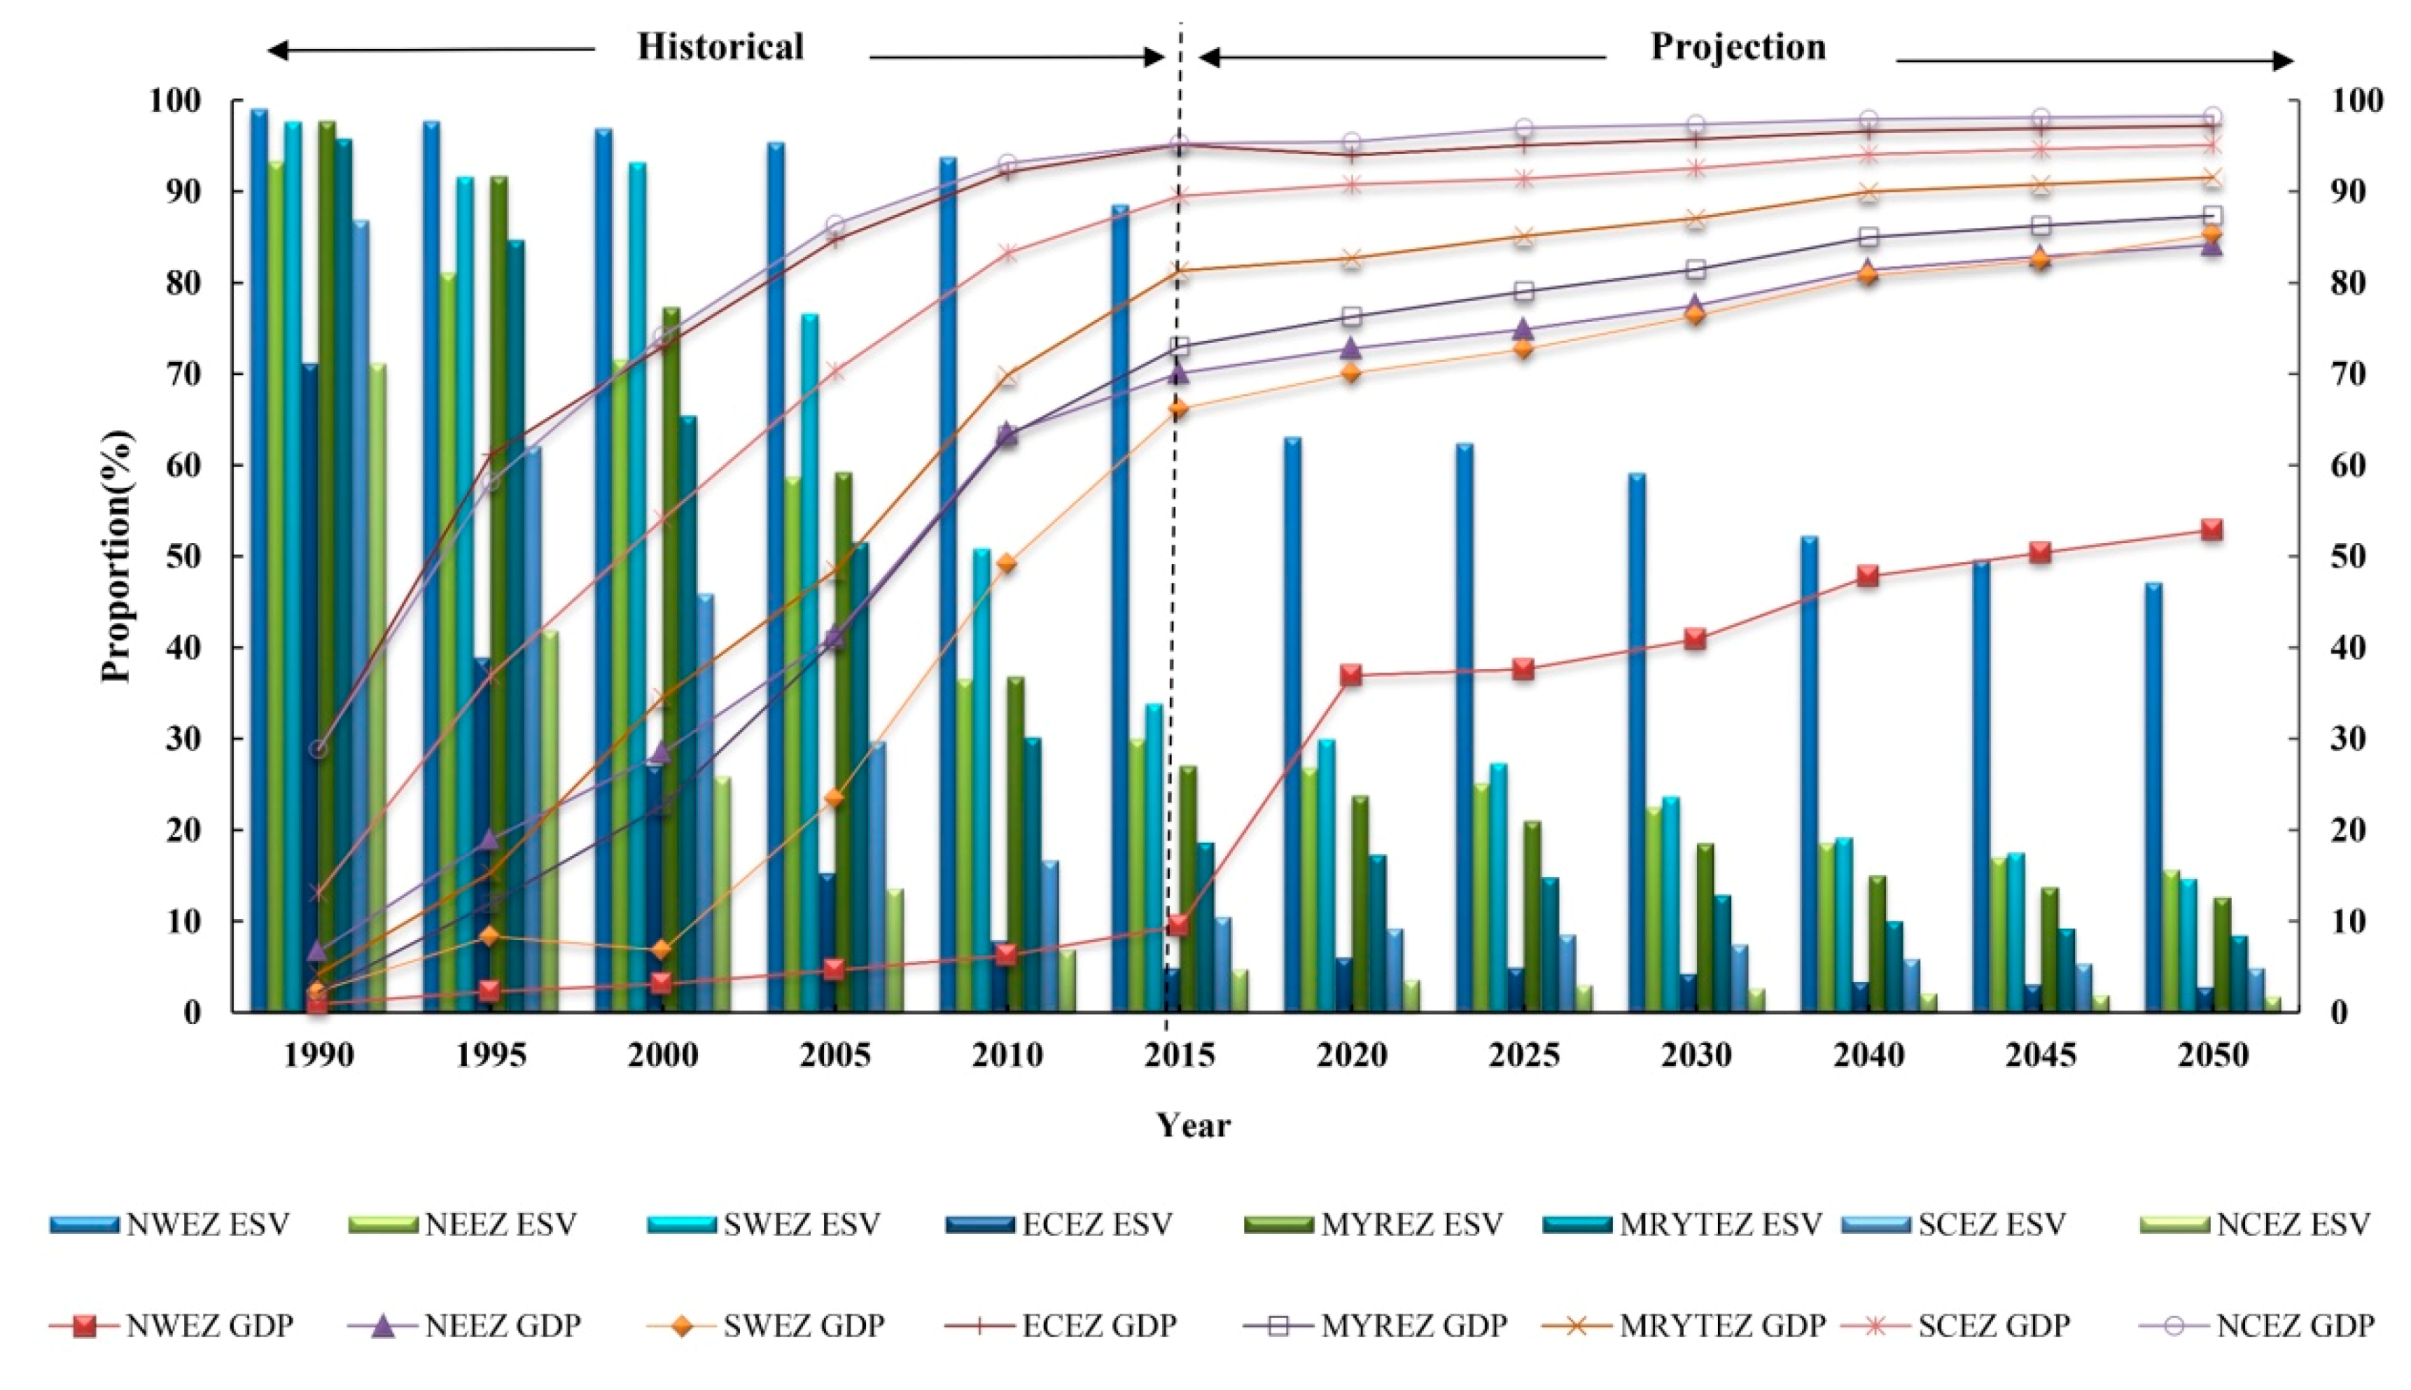
4.3. Temporal and Spatial Variations of GDP from 1990 to 2015
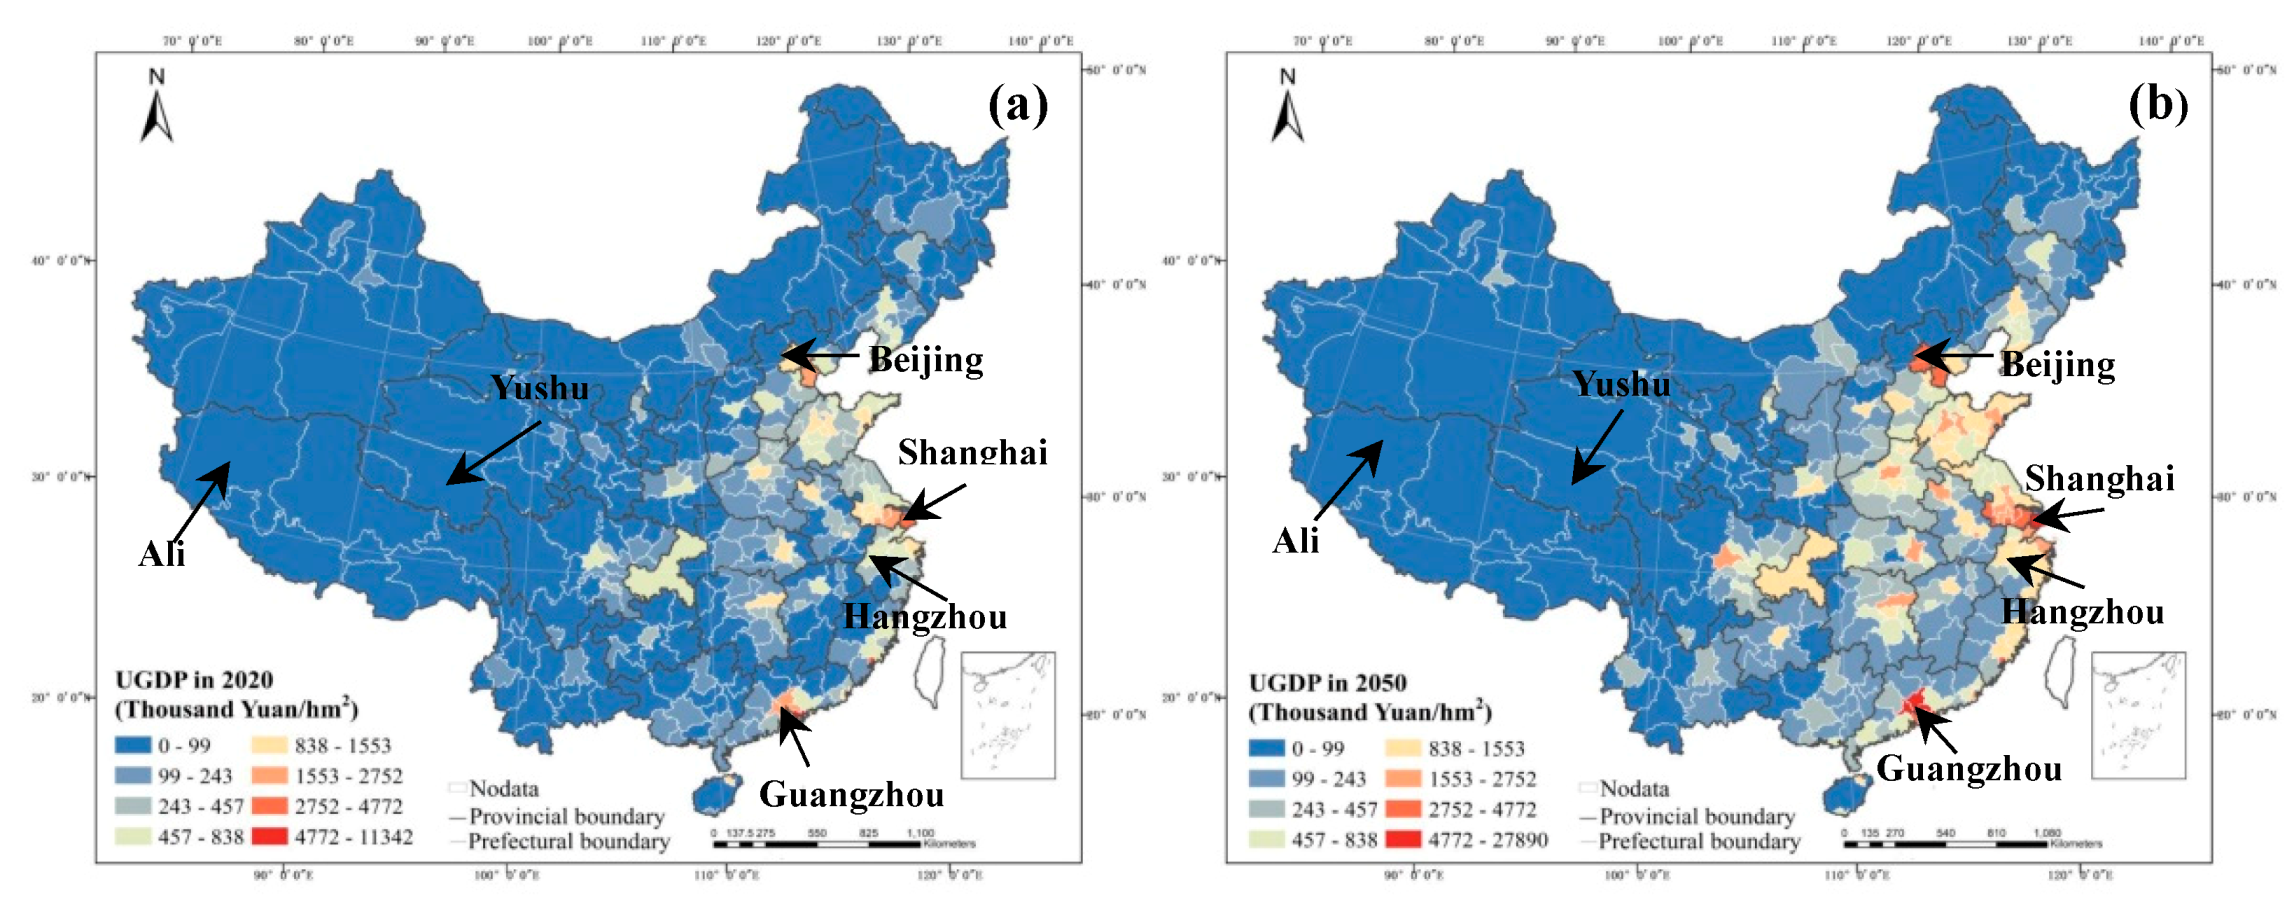
4.4. GDP Forecasting from 2020 to 2050
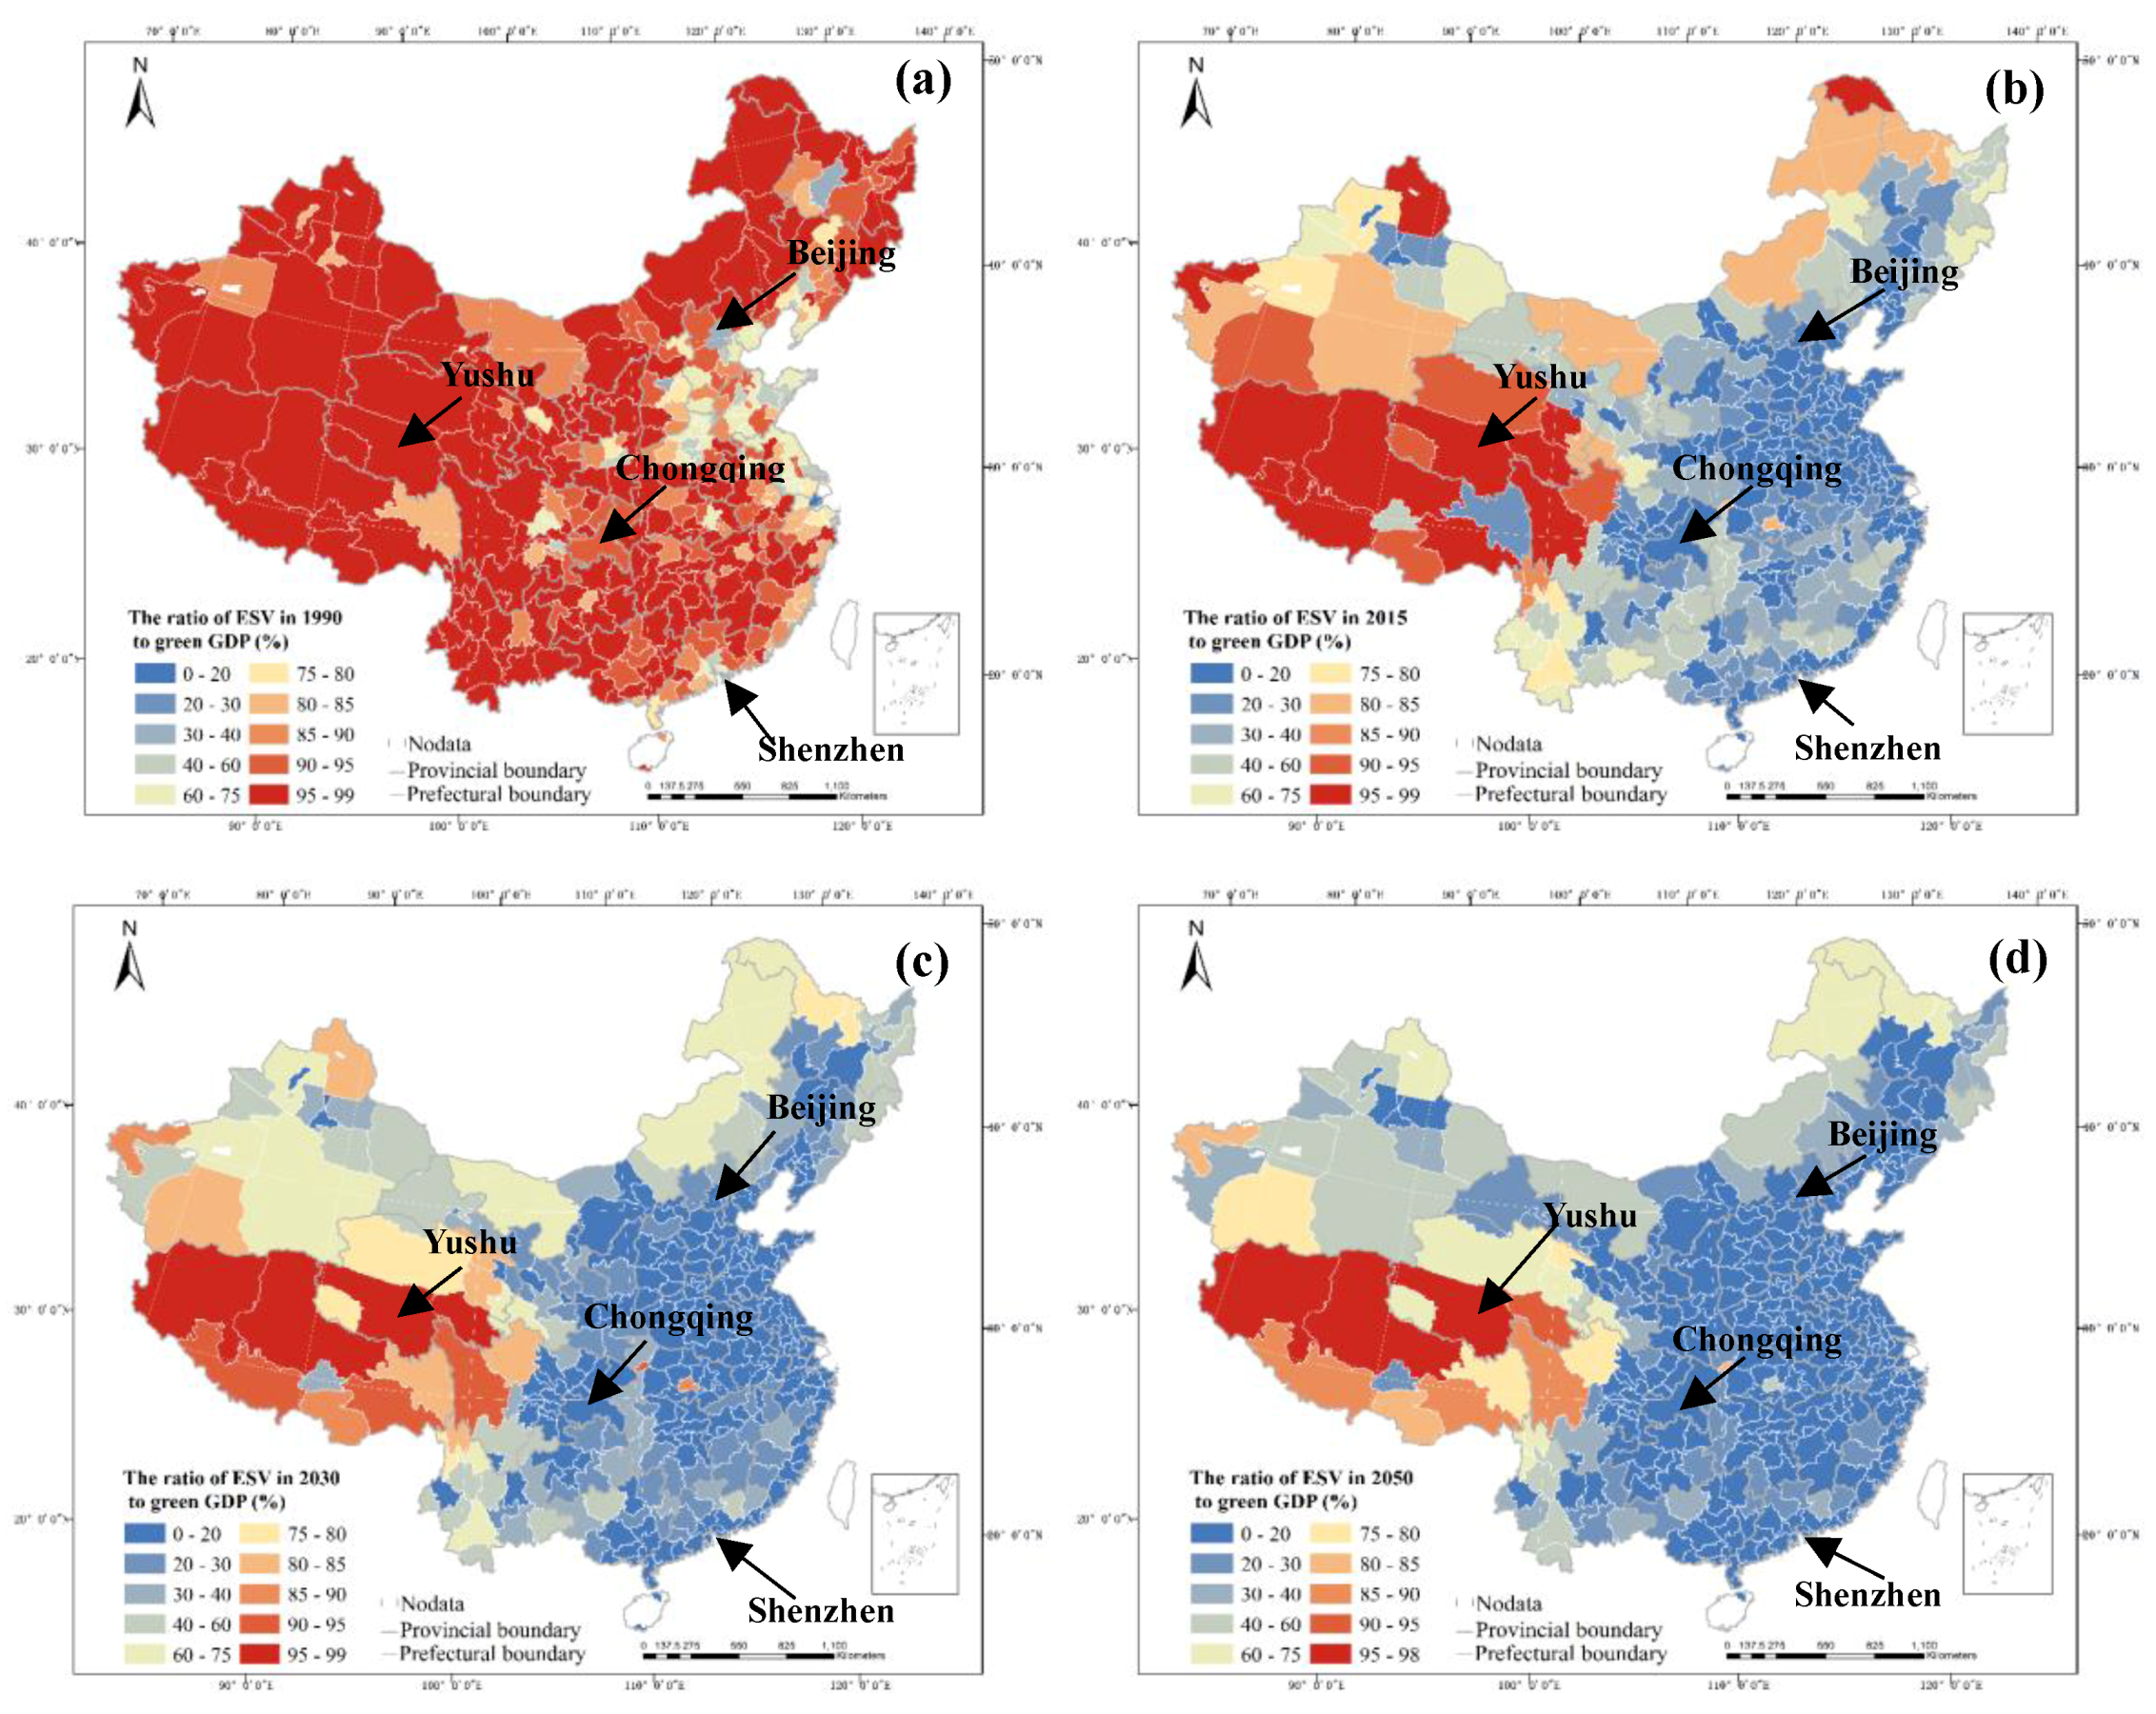
4.5. Temporal and Spatial Variations of Green GDP from 1990 to 2050
5. Conclusions and Discussion
Author Contributions
Funding
Acknowledgments
Conflicts of Interest
References
- National Bureau of Statistics of China. China Statistical Yearbook; China Statistics Press: Beijing, China, 2016.
- Sun, W.; Miao, Z.; Sun, W.; School, B. Change in the value of ecosystem services of Beijing-Tianjin-Hebei area and its relationship with economic growth. Ecol. Econ. 2015, 31, 59–62. [Google Scholar]
- United Nations, E.C. International Monetary Fund, Organisation for Economic Cooperation and Development; World Bank, System of National Accounts: New York, NY, USA, 1993. [Google Scholar]
- Bartelmus, P. SEEA-2003: Accounting for sustainable development? Ecol. Econ. 2007, 61, 613–616. [Google Scholar] [CrossRef]
- Sutton, P.C.; Costanza, R. Global estimates of market and non-market values derived from nighttime satellite imagery, land cover, and ecosystem service valuation. Ecol. Econ. 2002, 41, 509–527. [Google Scholar] [CrossRef]
- Kunanuntakij, K.; Varabuntoonvit, V.; Vorayos, N.; Panjapornpon, C.; Mungcharoen, T. Thailand green gdp assessment based on environmentally extended input-output model. J. Clean. Prod. 2017, 167, 970–977. [Google Scholar] [CrossRef]
- Lin, W.B.; Yang, J.; Chen, B. Temporal and spatial analysis of integrated energy and environment efficiency in China based on a Green GDP index. Energies 2011, 4, 1376–1390. [Google Scholar] [CrossRef]
- Talberth, J.; Bohara, A.K. Economic openness and green gdp. Ecol. Econ. 2006, 58, 743–758. [Google Scholar] [CrossRef]
- Li, V.; Lang, G. China’s “Green GDP” Experiment and the Struggle for Ecological Modernisation. J. Contemp. Asia. 2010, 40, 44–62. [Google Scholar] [CrossRef]
- Li, G.; Fang, C. Global mapping and estimation of ecosystem services values and gross domestic product: A spatially explicit integration of national ‘green GDP’ accounting. Ecol. Indic. 2014, 46, 293–314. [Google Scholar] [CrossRef]
- Yang, C.; Poon, J.P.H. Regional Analysis of China’s Green GDP. Eur. Geogr. Econ. 2009, 50, 54–563. [Google Scholar] [CrossRef]
- Xu, L.; Bing, Y.; Yue, W. A method of green GDP accounting based on eco-service and a case study of Wuyishan, China. Procedia Environ. Sci. 2010, 2, 1865–1872. [Google Scholar] [CrossRef]
- Li, T.; Ding, Y. Spatial disparity dynamics of ecosystem service values and GDP in Shaanxi Province, China in the last 30 years. PLoS ONE 2017, 12, e0174562. [Google Scholar] [CrossRef] [PubMed]
- Hou, Q.; Zhou, Q. Spatio-temporal relationships between urban growth and economic development: A case study of the Pearl River Delta of China. Asian Geogr. 2012, 29, 57–69. [Google Scholar] [CrossRef]
- Arowolo, A.O.; Deng, X.; Olatunji, O.A.; Obayelu, A.E. Assessing changes in the value of ecosystem services in response to land-use/land-cover dynamics in nigeria. Sci. Total Environ. 2018, 636, 597–609. [Google Scholar] [CrossRef] [PubMed]
- Xu, D.; Ding, X. Assessing the impact of desertification dynamics on regional ecosystem service value in north china from 1981 to 2010. Ecosyst. Serv. 2018, 30, 172–180. [Google Scholar] [CrossRef]
- Anderson, S.J.; Ankor, B.L.; Sutton, P.C. Ecosystem service valuations of south africa using a variety of land cover data sources and resolutions. Ecosyst. Serv. 2017, 27, 173–178. [Google Scholar] [CrossRef]
- Yang, X.; Zheng, X.Q.; Chen, R. A land use change model: Integrating landscape pattern indexes and markov-ca. Ecological Model. 2014, 283, 1–7. [Google Scholar] [CrossRef]
- Halmy, M.W.A.W. Land use/land cover change detection and prediction in the north-western coastal desert of egypt using markov-ca. Appl. Geogr. 2015, 63, 101–112. [Google Scholar] [CrossRef]
- Qing-Sheng, Y.; Xia, L. Integration of multi-agent systems with cellular automata for simulating urban land expansion. Sci. Geogr. Sin. 2017, 27, 542–548. [Google Scholar]
- Kamusoko, C.; Aniya, M.; Adi, B.; Manjoro, M. Rural sustainability under threat in zimbabwe—Simulation of future land use/cover changes in the bindura district based on the markov-cellular automata model. Appl. Geogr. 2009, 29, 435–447. [Google Scholar] [CrossRef]
- Burstedde, C.; Klauck, K.; Schadschneider, A.; Zittartz, J. Simulation of pedestrian dynamics using a two-dimensional cellular automaton. Phys. A Stat. Mech. Appl. 2001, 295, 507–525. [Google Scholar] [CrossRef]
- Kirchner, A.; Schadschneider, A. Simulation of evacuation processes using a bionics-inspired cellular automaton model for pedestrian dynamics. Phys. A Stat. Mech. Appl. 2002, 312, 260–276. [Google Scholar] [CrossRef]
- Barlovic, R.; Santen, L.; Schadschneider, A.; Schreckenberg, M. Metastable states incellular automata for traffic flow. Eur. Phy. J. B. 1998, 5, 793–800. [Google Scholar] [CrossRef]
- Karafyllidis, I.; Thanailakis, A. A model for predicting forest fire spreading using cellular automata. Ecol. Model. 1997, 99, 87–97. [Google Scholar] [CrossRef]
- Tobler, W.R. Cellular geography. In Philosophy in Geography; Gale, S., Olssen, G., Eds.; D. Reidel Publishing Co.: Dortrecht, Holland, 1979; pp. 379–386. [Google Scholar]
- Clarke, K.C.; Gaydos, L.J. Loose-coupling a cellular automaton model and gis: Long-term urban growth prediction for san francisco and washington/baltimore. Int. J. Geogr. Inf. Syst. 1998, 12, 16. [Google Scholar] [CrossRef] [PubMed]
- Li, X.; Yeh, A. Neural-network-based cellular automata for simulating multiple land use changes using gis. Int. J. Geogr. Inf. Syst. 2002, 16, 323–343. [Google Scholar] [CrossRef]
- Etemadi, H.; Smoak, J.M.; Karami, J. Land use change assessment in coastal mangrove forests of iran utilizing satellite imagery and ca–markov algorithms to monitor and predict future change. Environ. Earth Sci. 2018, 77, 208. [Google Scholar] [CrossRef]
- Shafizadeh Moghadam, H.; Helbich, M. Spatiotemporal urbanization processes in the megacity of mumbai, india: A markov chains-cellular automata urban growth model. App. Geogr. 2013, 40, 140–149. [Google Scholar] [CrossRef]
- Xuan, F.H. The coupling development between tourism economy and ecological environment in harbin city. Adv. Mater. Res. 2013, 4, 726–731. [Google Scholar] [CrossRef]
- Department of Rural Surveys, National Bureau of Statistics. China Yearbook of Agricultural Price Survey; China Statistics Press: Beijing, China, 2016.
- Costanza, R.; d’Arge, R.; Groot, R.d.; Farberk, S.; Grasso, M.; Hannon, B.; Limburg, K.; Naeem, S.; Neill, R.V.O.; Paruelo, J.; et al. The value of the world’s ecosystem services and natural capital. Nature 1997, 387, 253–260. [Google Scholar] [CrossRef]
- Xie, G.D.; Zhang, C.X.; Zhang, C.S.; Xiao, Y.; Lu, C.X. The value of ecosystem services in China. Resour. Sci. 2015, 37, 1740–1746. [Google Scholar]
- Hou, X.Y.; Chang, B.; Yu, X.F. Land use change in Hexi corridor based on CA-Markov methods. Trans. Chin. Soc. Agric. Eng. 2004, 20, 286–291. [Google Scholar]
- Sang, L.; Zhang, C.; Yang, J.; Zhu, D.; Yun, W. Simulation of land use spatial pattern of towns and villages based on ca-markov model. Math. Comput. Model. 2011, 54, 938–943. [Google Scholar] [CrossRef]
- Liu, X.P.; Li, X.; Yeh, G.O.; He, J.Q.; Tao, J. Discovery of transition rules for geographical cellular automata by using ant colony optimization. Sci. China 2007, 50, 1578–1588. [Google Scholar] [CrossRef]
- Wang, S.Q.; Zheng, X.Q.; Zang, X.B. Accuracy assessments of land use change simulation based on markov-cellular automata model. Procedia Environ. Sci. 2012, 13, 1238–1245. [Google Scholar] [CrossRef]
- Martinez, I. Rapd-typing of central and eastern north atlantic and western north pacific minke whales, balaenoptera acutorostrata. ICES J. Mar. Sci. 1999, 56, 640–651. [Google Scholar] [CrossRef]
- Kim, J.; Son, S.K.; Son, J.W.; Kim, K.H.; Shim, W.J.; Kim, C.H.; Lee, K.Y. Venting sites along the fonualei and Northeast Lau spreading centers and evidence of hydrothermal activity at an off-axis caldera in the Northeastern Lau Basin. Geochem. J. 2009, 43, 1–13. [Google Scholar] [CrossRef]
- Liu, J.Y.; Ning, J.; Wen, H.; Xu, X.L.; Zhang, S.Y.; Chang, Z.; Li, R.D.; Wu, S.X.; Hu, Y.F.; Du, G.M.; et al. Spatio-temporal patterns and characteristics of land-use change in china during 2010–2015. Acta Geogr. Sin. 2018, 73, 789–802. [Google Scholar]
- Xu, L.Z.; Fang, C.; Feng, C.; Chen, W.; Hua, Y.U.; Huang, X.H.; Zeng, Y.F.; Li, X.; Hong, S.B.; Zhong, X.F. Spatial and temporal variation of near-ground CO concentration in the Eight Economic Regions in China in May and July, 2013. Acta Sci. Circumst. 2014, 34, 1934–1941. [Google Scholar]
- Changchun, F.; Zanrong, Z.; Nana, C. The economic disparities and their spatio-temporal evolution in china since 2000. Geogr. Res. 2015, 34, 234–246. [Google Scholar]
- Zhao, J.F.; Yan, X.D.; Jia, G.S. Simulation of carbon stocks of forest ecosystems in northeast china from 1981 to 2002. Chin. J. Appl. Ecol. 2009, 20, 241–249. [Google Scholar]
- Gichuki, F.N. Makueni district profile: Soil management and conservation, 1989–1998. Drylands Res. Work. Pap. Drylands Res. 2000, 37, 1243–1257. [Google Scholar]
- Landis, J.R.; Koch, G.G. The measurement of observer agreement for categorical data. Biometrics 1977, 33, 159–174. [Google Scholar] [CrossRef] [PubMed]
- Muhammad, R. Detection of land use/land cover changes and urban sprawl in al-khobar, saudi arabia: An analysis of multi-temporal remote sensing data. ISPRS Int. J. Geo-Inf. 2016, 5, 15. [Google Scholar]


| Data | Time | Scale/Form/Resolution | Source |
|---|---|---|---|
| Land use | From 1990 to 2015 | National, 1 km resolution | Institute of Geographic Sciences and Natural Resources Research Chinese Academy of Sciences (http://www.resdc.cn/) |
| GDP | From 1990 to 2015 | National, spreadsheet | National, provincial and prefectural Statistical Yearbook |
| Outputs of major crops | 2015 | National, spreadsheet | National Statistical Yearbook |
| Crops purchase price | 2015 | National, spreadsheet | National Statistical Yearbook |
| Administrative Boundaries | 2007 | National, vector shapefile | Institute of Geographic Sciences and Natural Resources Research Chinese Academy of Sciences (http://www.resdc.cn/) |
| Land Use Types | |
|---|---|
| Cultivated land | 16,538.88 × 108 |
| Forest land | 108,095.26 × 108 |
| Grass land | 86,873.69 × 108 |
| Waterbody | 54,264.14 × 108 |
| Unused land | 7357.97 × 108 |
| Region Index | Name | Zone | Abbreviation |
|---|---|---|---|
| Z1 | Eastern China | Beijing, Tianjin, Hebei, Shandong, Jiangsu, Shanghai, Zhejiang, Fujian, Guangdong, Hainan, Taiwan, Macao and Hong Kong | EC |
| Z2 | Northeast China | Heilongjiang, Jilin and Liaoning | NEC |
| Z3 | Western China | Inner Mongolia, Ningxia, Shaanxi, Chongqing, Guizhou, Guangxi, Yunnan, Sichuan, Gansu, Qinghai, Xinjiang and Tibet | WC |
| Z4 | Central China | Shanxi, Henan, Anhui, Hubei, Hunan and Jiangxi | CC |
| Region Index | Name | Zone | Abbreviation |
|---|---|---|---|
| A | Northeast Economic Zone | Liaoning, Jilin, Heilongjiang | NEEZ |
| B | Northwest Economic Zone | Gansu, Qinghai, Ningxia, Tibet and Xinjiang | NWEZ |
| C | Middle Reaches of the Yellow River Economic Zone | Shaanxi, Shanxi, Henan and Inner Mongolia | MYREZ |
| D | Northern Coastal Economic Zone | Beijing, Tianjin, Hebei and Shandong | NCEZ |
| E | Eastern Coastal Economic Zone | Shanghai, Jiangsu and Zhejiang | ECEZ |
| F | Middle Yangtze River Economic Zone | Hubei, Hunan, Jiangxi and Anhui | MYTREZ |
| G | Southwest Economic Zone | Yunnan, Guizhou, Sichuan, Chongqing and Guangxi | SWEZ |
| H | Southern Coastal Economic Zone | Fujian, Guangdong and Hainan | SCEZ |
| The Maximum Value of UESV | The City with the Maximum Value of UESV | The Minimum Value of UESV | The City with the Minimum Value of UESV | The UESV Value | |
|---|---|---|---|---|---|
| NEEZ | 539.80 | Benxi | 141.67 | Qiqihar | 325.14 |
| NWEZ | 301.52 | Tibetan Autonomous Prefecture of Hainan | 44.92 | Jiuquan | 140.13 |
| MYREZ | 347.42 | Hulun Buir | 51.85 | Alxa League | 195.25 |
| NCEZ | 429.70 | Tianjin | 65.46 | Langfang | 179.57 |
| ECEZ | 854.65 | Suzhou | 137.95 | Yancheng | 354.41 |
| MYTREZ | 609.69 | Ezhou | 69.14 | Bozhou | 323.10 |
| SWEZ | 506.71 | Nujiang Lisu Nationality Autonomous | 105.62 | Ziyang | 320.29 |
| SCEZ | 831.49 | Foshan | 246.22 | Xiamen | 420.35 |
| Land Use Type | 2010 | ||||||
|---|---|---|---|---|---|---|---|
| Cultivated Land | Forest Land | Grass Land | Waterbody | Construction Land | Unused Land | ||
| 2005 | Cultivated land | 0.9939 | 0.001 | 0.0007 | 0.0006 | 0.004 | 0.0001 |
| Forest land | 0.0007 | 0.9983 | 0.0006 | 0.0012 | 0.0005 | 0.0001 | |
| Grass land | 0.0023 | 0.0007 | 0.9942 | 0.0015 | 0.0002 | 0.0008 | |
| Waterbody | 0.0015 | 0.0002 | 0.0014 | 0.9946 | 0.0016 | 0.0017 | |
| Construction land | 0.0006 | 0.0004 | 0.0034 | 0.0009 | 0.9942 | 0.0003 | |
| Unused land | 0.0012 | 0 | 0.001 | 0.0013 | 0.0002 | 0.9976 | |
| Forecast Data from 2020 to 2050 | ||||||||||
|---|---|---|---|---|---|---|---|---|---|---|
| Year | 1990 | 2015 | 2020 | 2025 | 2030 | 2035 | 2040 | 2045 | 2050 | Growth Rate (%) |
| Cultivated land | 177.18 | 178.6 | 181.25 | 178.43 | 175.35 | 172.29 | 169.4 | 165.65 | 161.75 | −8.71 |
| Forest land | 225.5 | 224.02 | 228.99 | 230.7 | 232.04 | 237.24 | 240.44 | 244.58 | 252.1 | 11.80 |
| Grass land | 300.19 | 295.4 | 264.93 | 268.33 | 267.27 | 258.39 | 262.57 | 276.81 | 291.28 | −2.97 |
| Waterbody | 27.05 | 28.01 | 26.9 | 27.41 | 27.74 | 27.17 | 27.08 | 26.98 | 28.13 | 3.99 |
| Construction land | 15.86 | 22.19 | 25.01 | 25.46 | 26.54 | 27.46 | 28.63 | 29.93 | 31.17 | 96.53 |
| Unused land | 200.89 | 198.45 | 219.59 | 216.34 | 217.73 | 224.12 | 218.55 | 202.72 | 182.24 | −9.28 |
| Cultivated Land | Forest Land | Grass Land | Waterbody | Construction Land | Unused Land | |
|---|---|---|---|---|---|---|
| Z1 | −6.52 | 2.81 | −3.02 | 0.01 | 6.75 | −0.03 |
| Z2 | 0.18 | 2.36 | −2.82 | −0.15 | 3.28 | −2.85 |
| Z3 | −15.42 | 26.61 | −12.50 | 1.07 | 15.48 | −15.24 |
| Z4 | −11.78 | 7.80 | −3.66 | −0.06 | 9.31 | −1.61 |
| Economic Zone | 2020 | 2025 | 2030 | 2035 | 2040 | 2045 | 2050 | Growth Rate (%) |
|---|---|---|---|---|---|---|---|---|
| NEEZ | 319.80 | 324.64 | 324.26 | 320.70 | 324.79 | 322.71 | 320.63 | 0.259 |
| NWEZ | 144.48 | 144.04 | 147.06 | 144.06 | 144.06 | 144.59 | 144.09 | −0.270 |
| MYREZ | 196.89 | 197.31 | 197.32 | 209.28 | 197.32 | 197.37 | 197.26 | 0.188 |
| NCEZ | 173.76 | 170.63 | 171.78 | 170.42 | 170.59 | 170.19 | 170.34 | −1.967 |
| ECEZ | 367.40 | 361.78 | 361.90 | 361.97 | 362.23 | 362.06 | 361.85 | −1.511 |
| MYTREZ | 324.57 | 325.18 | 325.19 | 325.14 | 317.93 | 323.50 | 325.05 | 0.148 |
| SWEZ | 324.31 | 333.80 | 324.39 | 321.37 | 324.37 | 324.28 | 290.16 | −10.530 |
| SCEZ | 421.33 | 421.41 | 421.59 | 411.44 | 421.46 | 421.53 | 421.35 | 0.004 |
| 1990 | 2050 | |||||||||
|---|---|---|---|---|---|---|---|---|---|---|
| ESV | Proportion of ESV in Green GDP | GDP | Proportion of GDP in Green GDP | Value of Green GDP | ESV | Proportion of ESV in Green GDP | GDP | Proportion of GDP in Green GDP | Green GDP | |
| NEEZ | 2547.46 | 93.29 | 183.10 | 6.71 | 2730.56 | 2489.93 | 15.66 | 13,414.89 | 84.34 | 15,904.82 |
| NWEZ | 3580.29 | 99.06 | 33.99 | 0.94 | 3614.28 | 5747.21 | 47.10 | 6456.22 | 52.90 | 12,203.43 |
| MYREZ | 3184.91 | 97.72 | 74.33 | 2.28 | 3259.24 | 3268.02 | 12.66 | 22,540.06 | 87.34 | 25,808.08 |
| NCEZ | 599.23 | 71.15 | 242.93 | 28.85 | 842.16 | 620.36 | 1.73 | 35,244.08 | 98.27 | 35,864.44 |
| ECEZ | 698.20 | 71.13 | 283.33 | 28.87 | 981.53 | 733.46 | 2.80 | 25,457.61 | 97.20 | 26,191.07 |
| MYTREZ | 2264.68 | 95.78 | 99.89 | 4.22 | 2364.57 | 2270.84 | 8.46 | 24,566.68 | 91.54 | 26,837.52 |
| SWEZ | 4298.28 | 97.66 | 103.05 | 2.34 | 4401.33 | 3920.97 | 14.71 | 22,726.93 | 85.29 | 26,647.87 |
| SCEZ | 1242.60 | 86.88 | 187.67 | 13.12 | 1430.27 | 1250.80 | 4.90 | 24,270.26 | 95.10 | 25,521.06 |
| Sum | 18,415.65 | − | 1208.29 | − | 19,623.94 | 20,301.59 | − | 174,676.73 | − | 194,978.29 |
© 2019 by the authors. Licensee MDPI, Basel, Switzerland. This article is an open access article distributed under the terms and conditions of the Creative Commons Attribution (CC BY) license (http://creativecommons.org/licenses/by/4.0/).
Share and Cite
Yu, Y.; Yu, M.; Lin, L.; Chen, J.; Li, D.; Zhang, W.; Cao, K. National Green GDP Assessment and Prediction for China Based on a CA-Markov Land Use Simulation Model. Sustainability 2019, 11, 576. https://doi.org/10.3390/su11030576
Yu Y, Yu M, Lin L, Chen J, Li D, Zhang W, Cao K. National Green GDP Assessment and Prediction for China Based on a CA-Markov Land Use Simulation Model. Sustainability. 2019; 11(3):576. https://doi.org/10.3390/su11030576
Chicago/Turabian StyleYu, Yuhan, Mengmeng Yu, Lu Lin, Jiaxin Chen, Dongjie Li, Wenting Zhang, and Kai Cao. 2019. "National Green GDP Assessment and Prediction for China Based on a CA-Markov Land Use Simulation Model" Sustainability 11, no. 3: 576. https://doi.org/10.3390/su11030576
APA StyleYu, Y., Yu, M., Lin, L., Chen, J., Li, D., Zhang, W., & Cao, K. (2019). National Green GDP Assessment and Prediction for China Based on a CA-Markov Land Use Simulation Model. Sustainability, 11(3), 576. https://doi.org/10.3390/su11030576