Article

Environmental Impact of the High Concentrator Photovoltaic Thermal 2000x System

by
Emmanuel Shittu
,
Maria Kolokotroni
* and
Valentina Stojceska
Mechanical and Aerospace Engineering Department, Brunel University London, Kingston Lane, Uxbridge UB8 3PH, UK
*
Author to whom correspondence should be addressed.
Sustainability 2019, 11(24), 7213; https://doi.org/10.3390/su11247213
Submission received: 28 October 2019 / Revised: 10 December 2019 / Accepted: 12 December 2019 / Published: 16 December 2019
(This article belongs to the Special Issue Solar Systems and Sustainability)

Abstract

:
High Concentrator Photovoltaic Thermal (HCPV/T) systems produce both electrical and thermal energy and they are efficient in areas with high Direct Normal Irradiance (DNI). This paper estimates the lifecycle environmental impact of the HCPV/T 2000x system for both electrical and thermal functionalities. Process-based attributional method following the guidelines and framework of ISO 14044/40 was used to conduct the Life Cycle Assessment (LCA). The midpoint and endpoint impact categories were studied. It was found that the main hotspots are the production of the thermal energy system contributing with 50% and 55%, respectively, followed by the production of the tracking system with 29% and 32% and the operation and maintenance with 13% and 7%. The main contributor to the lifecycle environmental impact category indicators was found to be the raw materials acquisition/production and manufacturing of the thermal energy and tracking systems. The results indicate that the lifecycle environmental impact of the HCPV/T 2000x system is lower compared to fuel-based Combined Heat and Power (CHP) and non-Renewable Energy Sources (non-RES) systems.

Graphical Abstract

1. Introduction

One of the main global challenges is the extensive consumption of generated energy from non-Renewable Energy Sources (non-RES) that are considered as main contributors to the harmful environmental impact. As a result, a number of novel alternative energy technologies based on Renewable Energy Sources (RES) that could operate in a more sustainable way are being continuously researched. Solar RES that uses Photovoltaic (PV) cell is one of the RES that is receiving the most attention for further development. One of the most promising methods to further enhance the efficiency of the PV cell is to use optical concentrator (reflective and/or refractive optical device) in order to concentrate incoming solar radiation onto a small area PV cell. The most common concentrator solar energy technologies include Low and High Concentrator Photovoltaic (LCPV and HCPV), Low and High Concentrator Photovoltaic Thermal (LCPV/T and HCPV/T) and Concentrator Solar Power (CSP). LCPV and HCPV are typically characterized with a concentration ratio of less than 100 and 300–1000, respectively. LCPV uses crystalline silicon PV cells to convert Direct Normal Irradiance (DNI) (and a small fraction of diffuse horizontal irradiance) into electrical energy at high efficiency, while HCPV uses Multi-Junction Solar Cell (MJSC) to convert only DNI into electrical energy at higher efficiency than LCPV [1]. LCPV/T and HCPV/T integrates solar thermal technology with LCPV and HCPV respectively, to produce electrical and thermal energy. In a typical solar thermal technology, the heat exchanger, heat sink, Heat Transfer Fluid (HTF) and thermal storage work together to simultaneously cool the PV cells and extract thermal energy [2,3,4]. Additional advantages of LCPV, LCPV/T, HCPV and HCPV/T systems include low Energy Payback Time (EPBT), land use reduction, and the potential increase in power density. CSP converts DNI into electrical and thermal energy by using concentrators and conventional power block such as steam turbines, gas turbines and Stirling engines [5].
Concentrator solar energy technologies could be directly applied to the buildings or utility-scale and potentially contribute to the global electricity requirements with 7 and 25% by 2030 and 2050, respectively [6,7,8]. However, the application of those technologies could be limited in the regions of high DNI such as MENA (Middle East and North Africa), Mediterranean and the Sun Belt (vast areas of the United States and New Mexico) [6]. In terms of environmental impact, those technologies demonstrated much lower Global Warming Potential (GWP) in comparison to the fossil fuels sources [8,9]. Life Cycle Assessment (LCA) as a useful tool for assessing environmental impact has been applied on the LCPV, LCPV/T, HCPV, HCPV/T and CSP [8,9,10,11,12]. It was found that the use of HCPV/T system for domestic application replacing the traditional systems like electric national grid, boiler and electric heat pump, could reduce annual carbon dioxide (CO2) by 3376 kg [10], while LCPV in building application by 93–101 g /kWh with 2.4 years EPBT and less than 142 g/kWh with 0.7 years EPBT [11,12]. The low values of EPBT are mainly as a result of reduced primary energy demand required for production of the HCPV/T and LCPV systems and their increased efficiency during energy production [10,13,14]. The GWP for HCPV was reported to vary between 16 and 45 g CO2-eq/kWh [8,9,15]. The lifecycle CO2 emission of a parabolic trough and CSP power plant was estimated to be 26 g CO2-eq/kWh [16], and 36.3 g CO2-eq/kWh [17], respectively. All those studies carried out an environmental assessment of the electrical functionality of the systems using few environmental impact indicators but did not consider thermal energy extraction, which is an important factor for improving energy and exergy efficiencies of the solar systems [18]. This paper addresses this gap by carrying out an LCA of the HCPV/T 2000x system for both electrical and thermal function for the full range of environmental indicators.
HCPV/T has been used in a number of studies for electricity and thermal generation and it was found that the overall efficiency of the HCPV/T system can be improved to exceed 70% as a result of the increased both electrical and thermal efficiency by 48 and 26%, respectively [19]. The work by Shittu et al. [4], showed that the electrical efficiency of an operational HCPV/T system can reach 30%. However, its environmental impact of the electrical and thermal functionalities has not been conducted. Therefore, the main objectives of this study were to use LCA to estimate lifecycle environmental impacts of the HCPV/T 2000x system for the defined electrical and thermal energy functionalities and compare the new findings with the RES and non-RES electrical and/or thermal energy generation systems as reported in the literature.

2. LCA Case Study in Palermo, Sicily

2.1. Description of Climatic Conditions

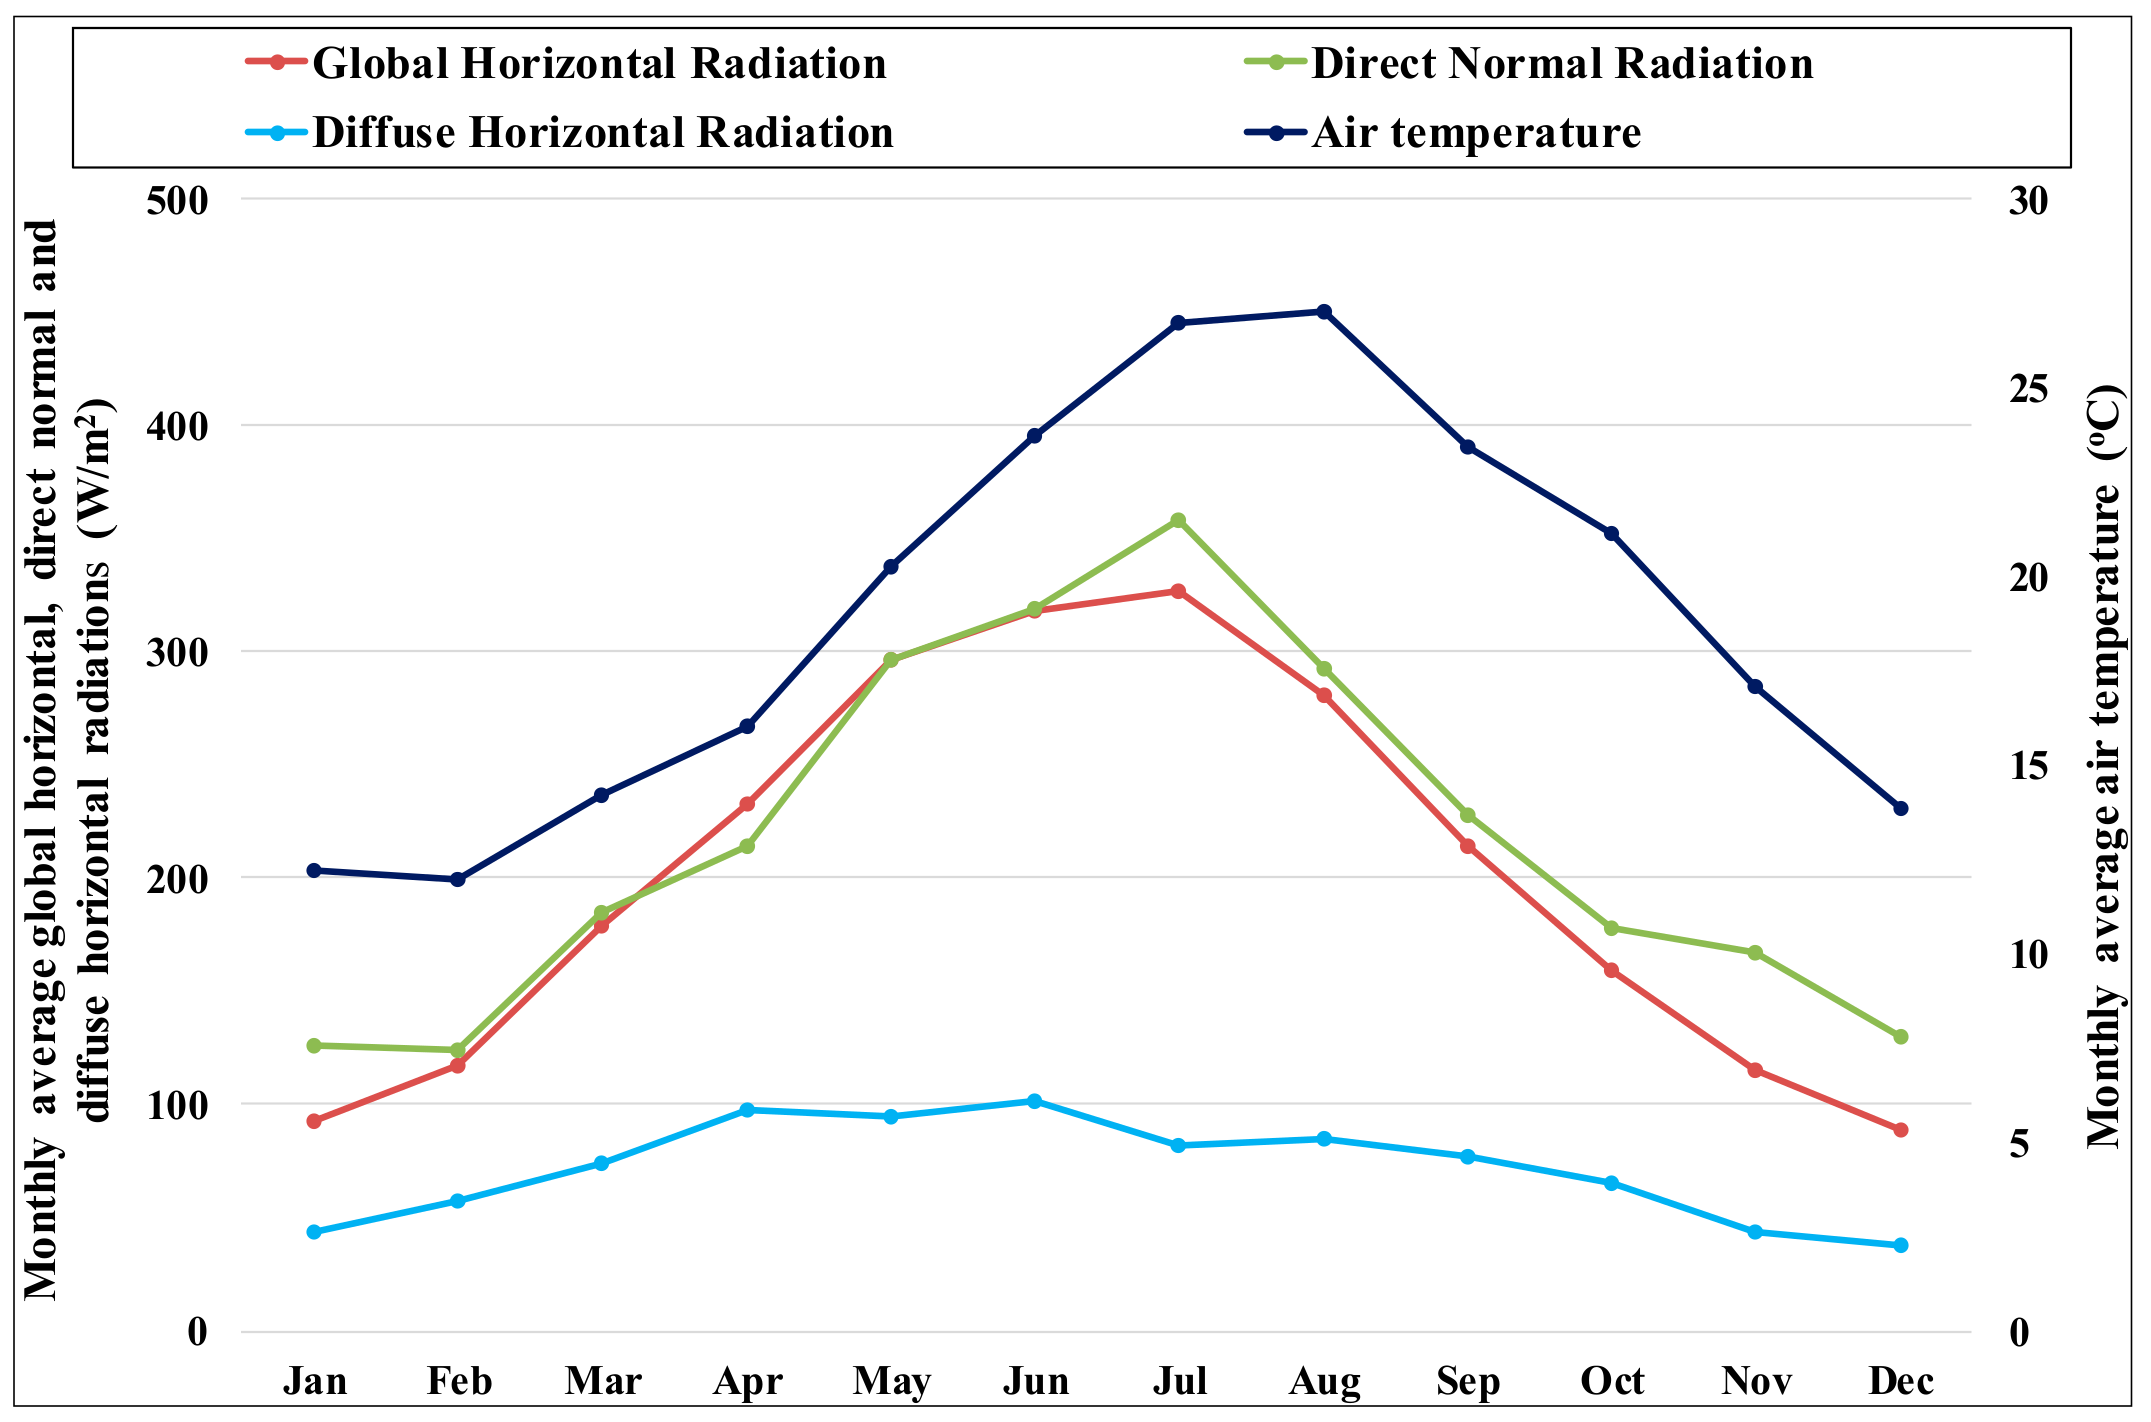
The HCPV/T 2000x systems are applicable in the regions with high DNI. Palermo is the capital of Sicily, an island in the Mediterranean Sea, located in the Southern part of Italy. The average annual DNI and ambient temperature of Palermo (coordinates 38°1′ N 13°4′ E) are 218 W/m2 and 19 °C, respectively [20]. The monthly distribution of the radiation and ambient air temperature are shown in Figure 1 for a typical weather year. In Italy, the typical annual household consumption of electricity in 2016 was~2000 kWh/household/year [21], while the typical annual household hot water demand was~2000 kWh/household/year [22].

2.2. Description of HCPV/T 2000x System

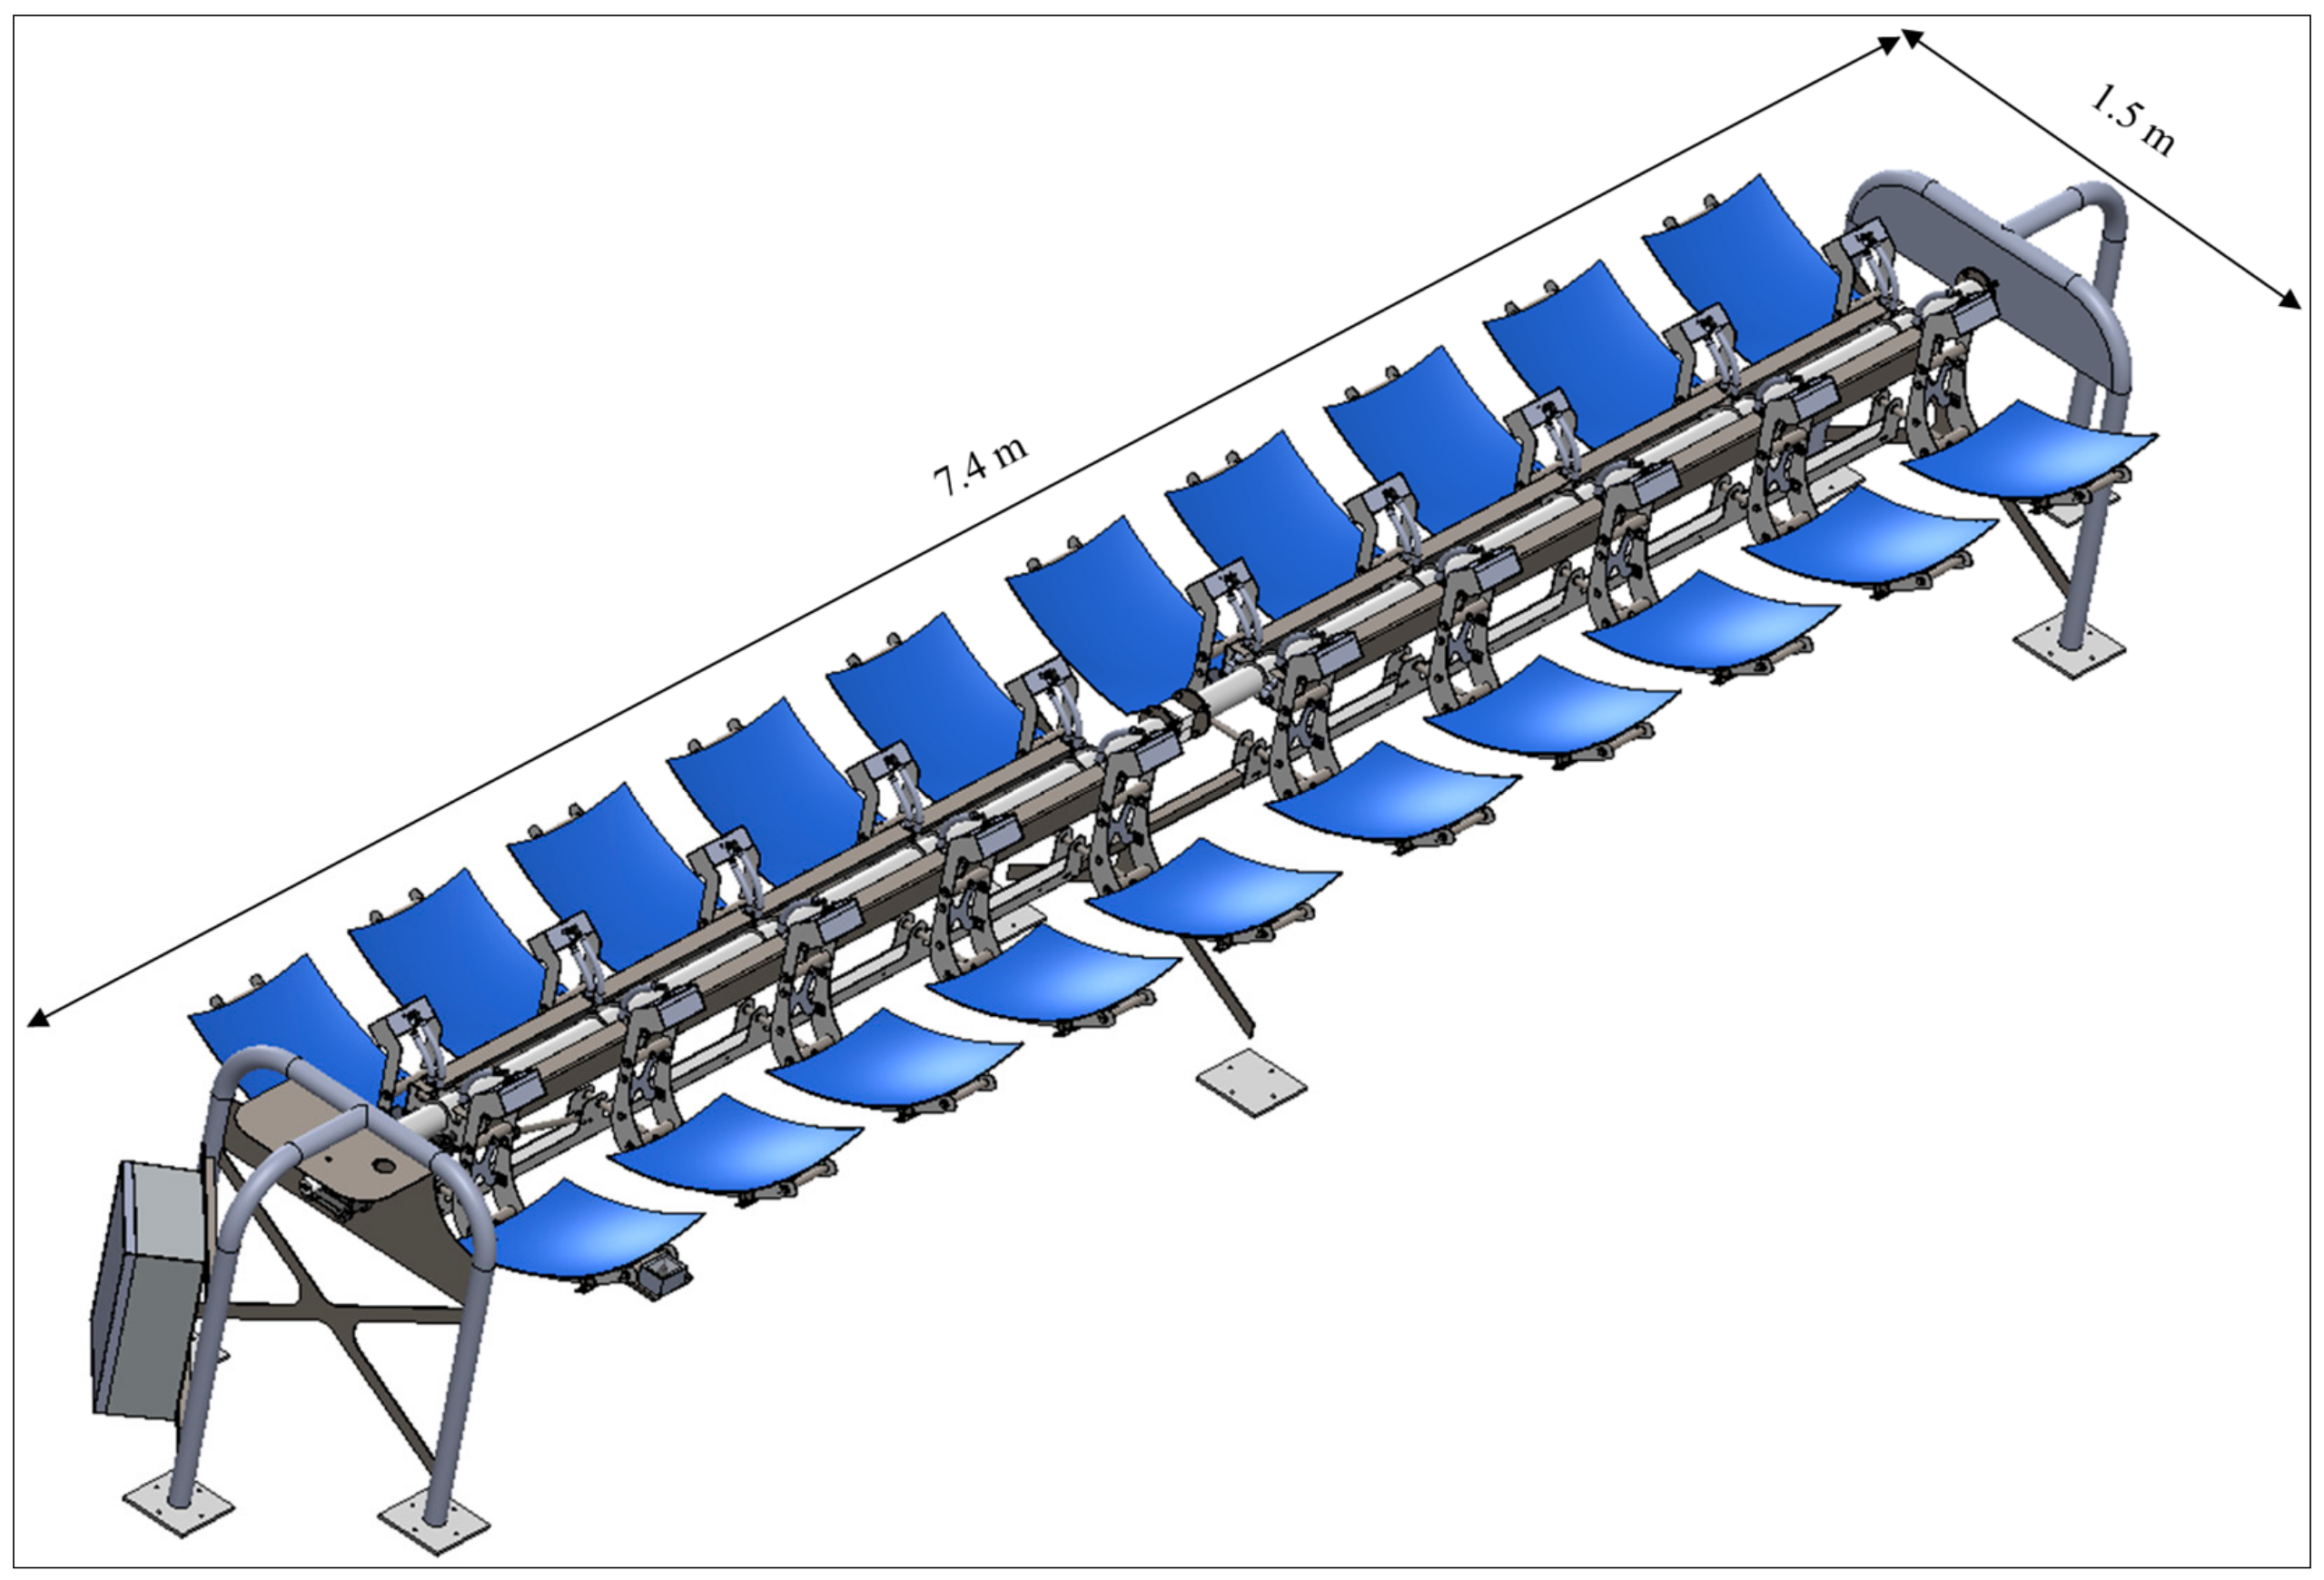
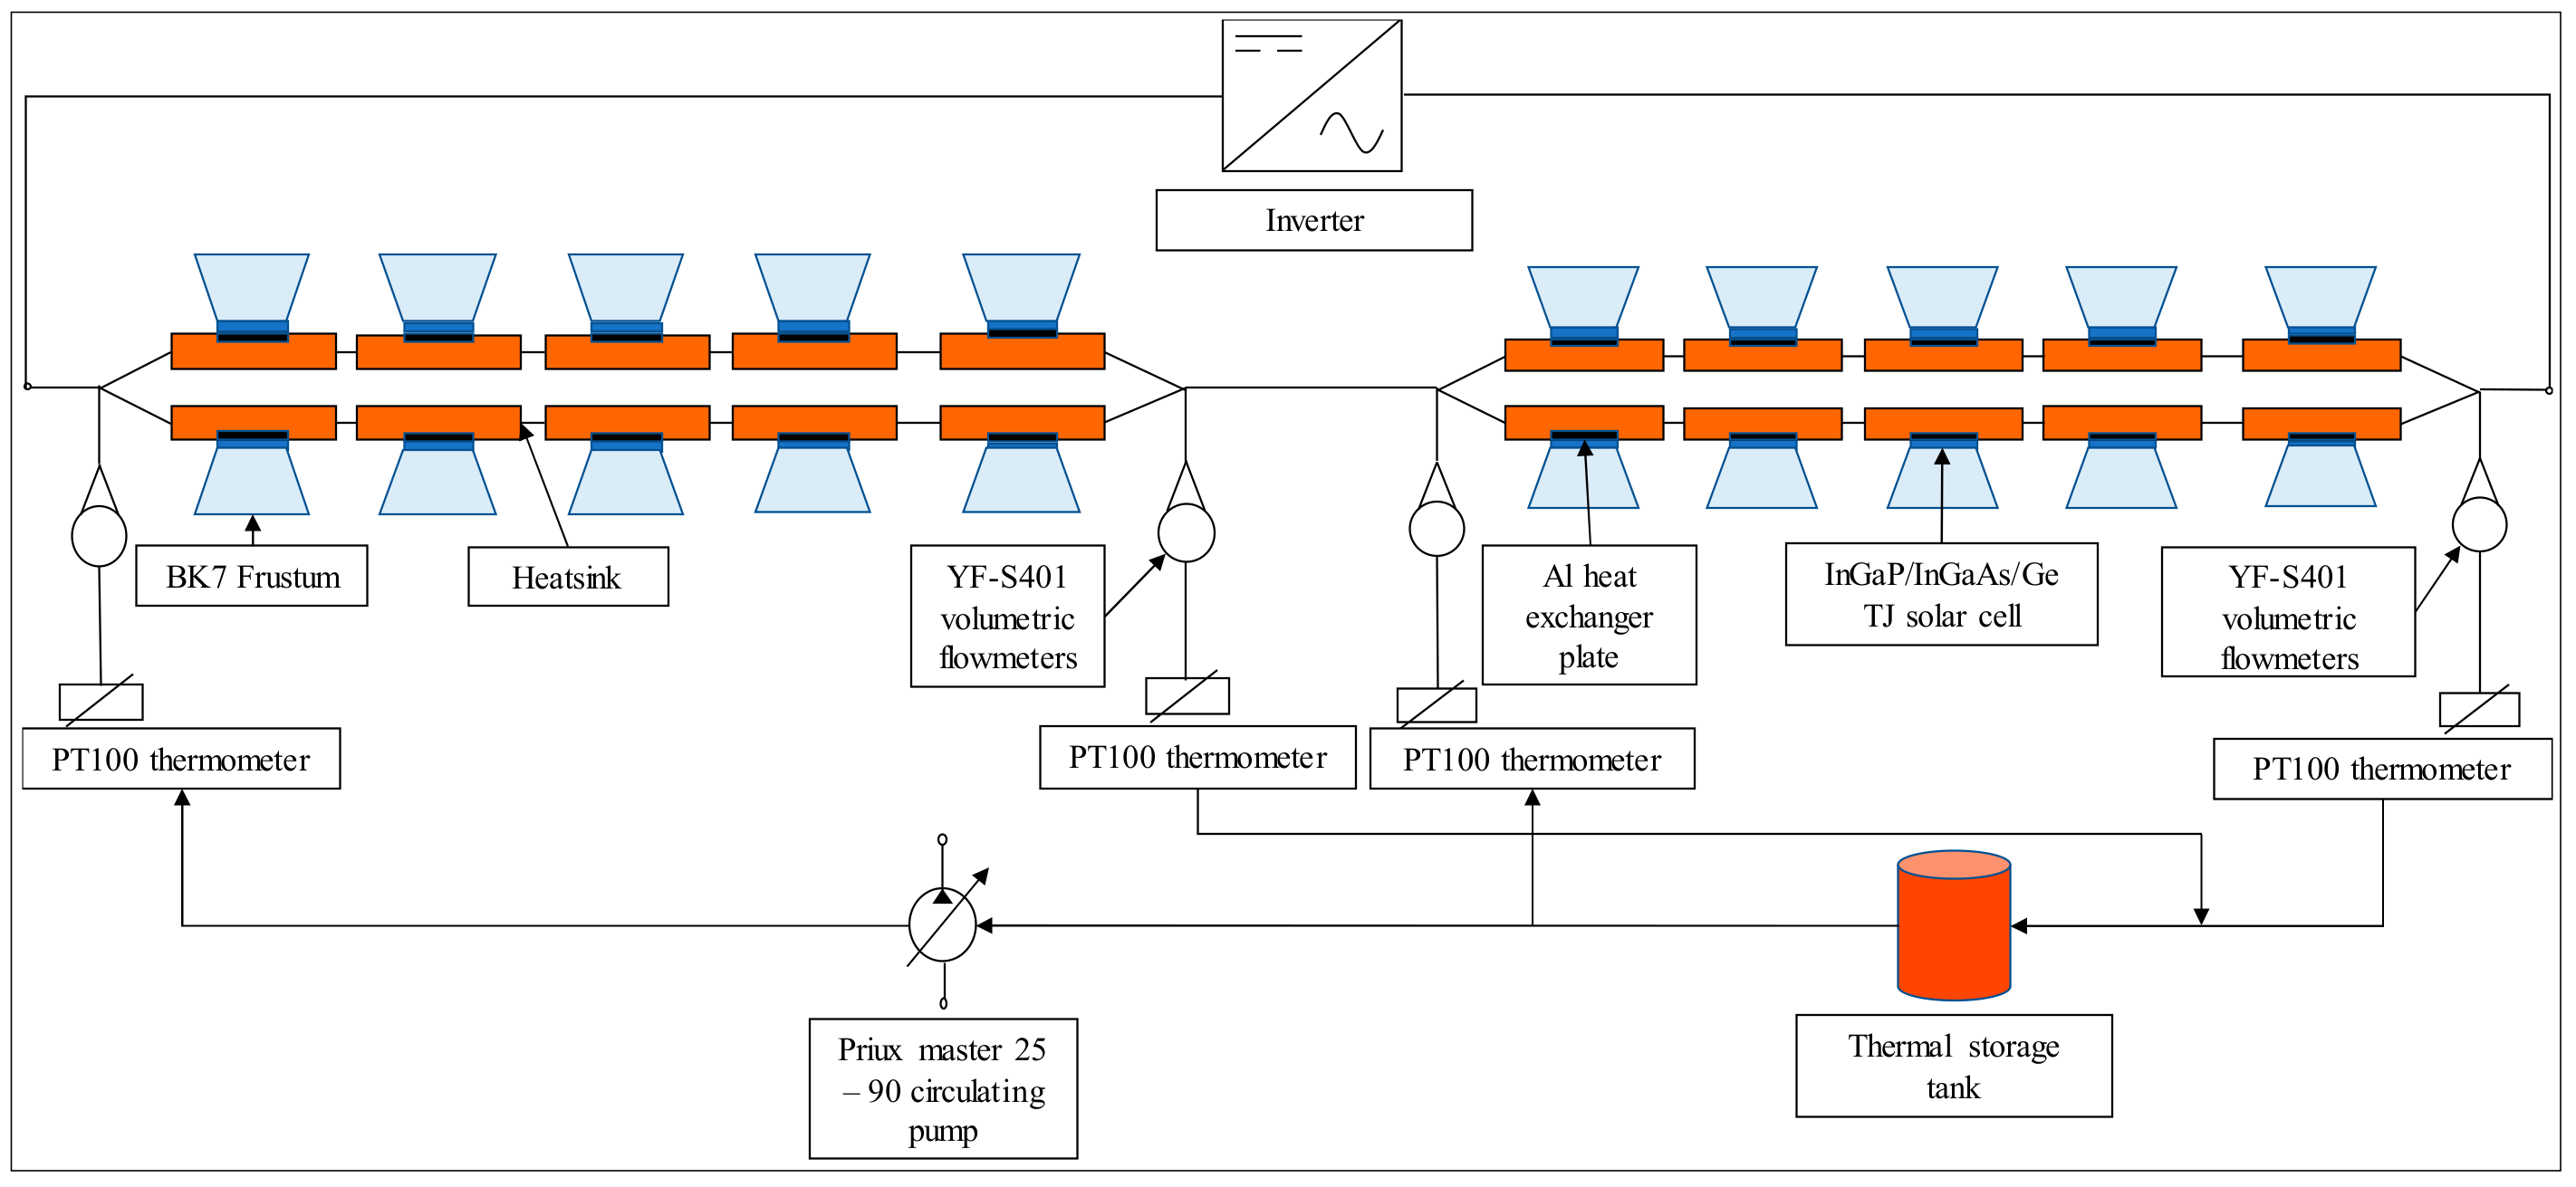
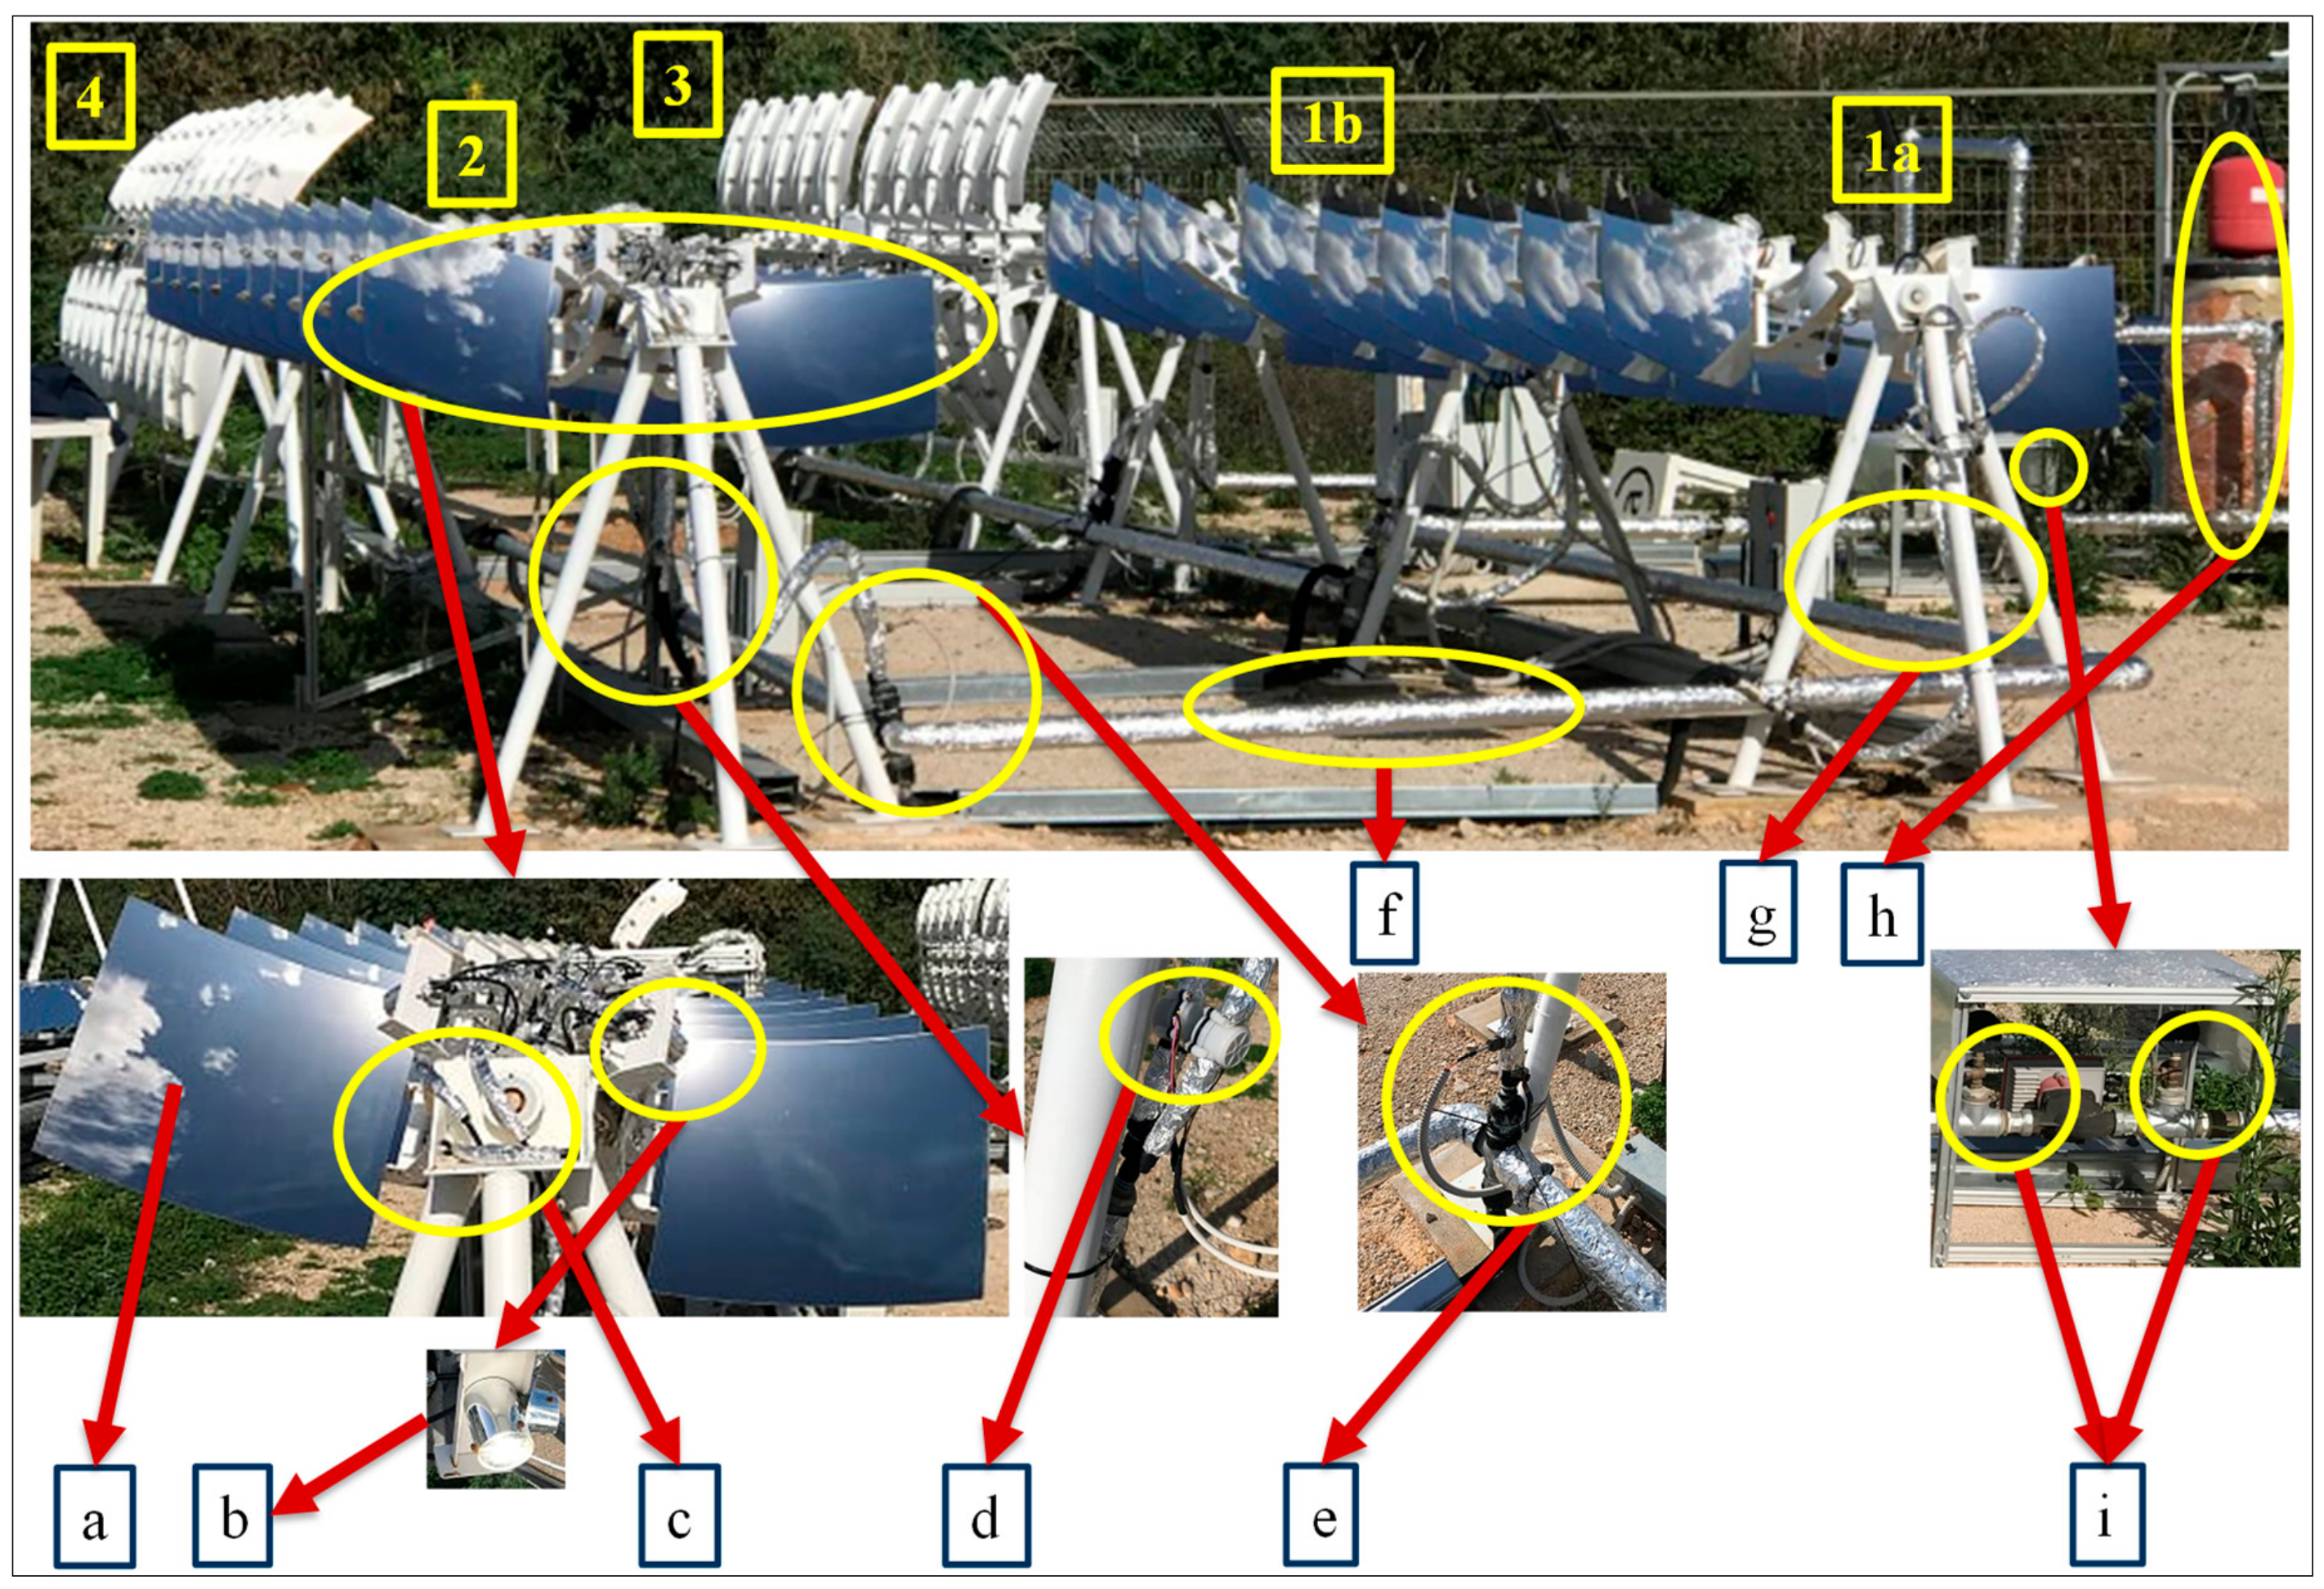
The HCPV/T 2000x system comprises of three integrated subsystems, two for production of electrical and thermal energy and the third is the tracking system. Table 1 presents the components of each system. The case-study HCPV/T 2000x system is presented in Figure 2 and Figure 3 while Figure 4 presents a diagram of the electrical and thermal systems. Figure 2 shows the experimental system which comprises of four modules (1–4). Each module is divided into two semi-modules and the electrical energy system (Figure 4) comprises of a parallel electric circuit arrangement of two semi-modules (North-side and South-side, denoted [1a] and [1b] respectively in Figure 2). Each semi-module consists of 10 Indium-Gallium-Phosphide/Indium-Gallium-Arsenide/Germanium (InGaP/InGaAs/Ge) solar cells arranged in series. The electric circuit is connected to a 1 kW smart grid inverter characterized with Maximum Power Point Tracking (MPPT) to continuously generate maximum possible power. The thermal energy system consists of 20 active heat sink and a reverse return system uses flowing demineralized water to produce thermal energy. Each active heat sink contains an Aluminium (Al) heat exchanger plate which is responsible for the heat transfer from the hot InGaP/InGaAs/Ge solar cells to the flowing demineralized water. The active heat sink designed with one inlet pipe and one outlet pipe was assembled in an adjacent position to the InGaP/InGaAs/Ge solar cell. The reverse return system is a type of closed-loop system used in a piping system with multiple inlet and outlet branches in order to maintain a constant flow rate and constant temperature change of the flowing water between the inlet and outlet of each branch [23]. As a result, the same magnitude of heat is extracted from each active heat sink that constitutes part of the thermal energy system. The active heat sink and reverse return system was adopted as an active cooling system needed to maintain the designed flowrate at 1 liter per minute, that is required to operate the InGaP/InGaAs/Ge solar cell at the designed operating temperature of 20 °C to 90 °C (maximum 110 °C) while simultaneously extracting heat that is required for thermal energy production. The tracking system, which is made from hardware and software systems is a 2-axis tracker and is responsible for achieving the solar CR of 2000x. The hardware tracking system is aligned with the North-South (N-S) configuration in order to accurately track the sun via simultaneous rotational motion of the N-S longitudinal axle and East-West (E-W) transverse axle of the HCPV/T 2000x system, enabled by the coaxial rotational and linear motor respectively, and each connected to a magnetic encoder position sensor. The accurate tracking of the sun requires the software tracking system. The software uses the Solar Position Algorithm (SPA) of National Renewable Energy Laboratory (NREL). The tracking accuracy for a visible sunny or clear day is increased with the installed Complementary Metal Oxide Semiconductor (CMOS) webcam which is part of the tracking system.
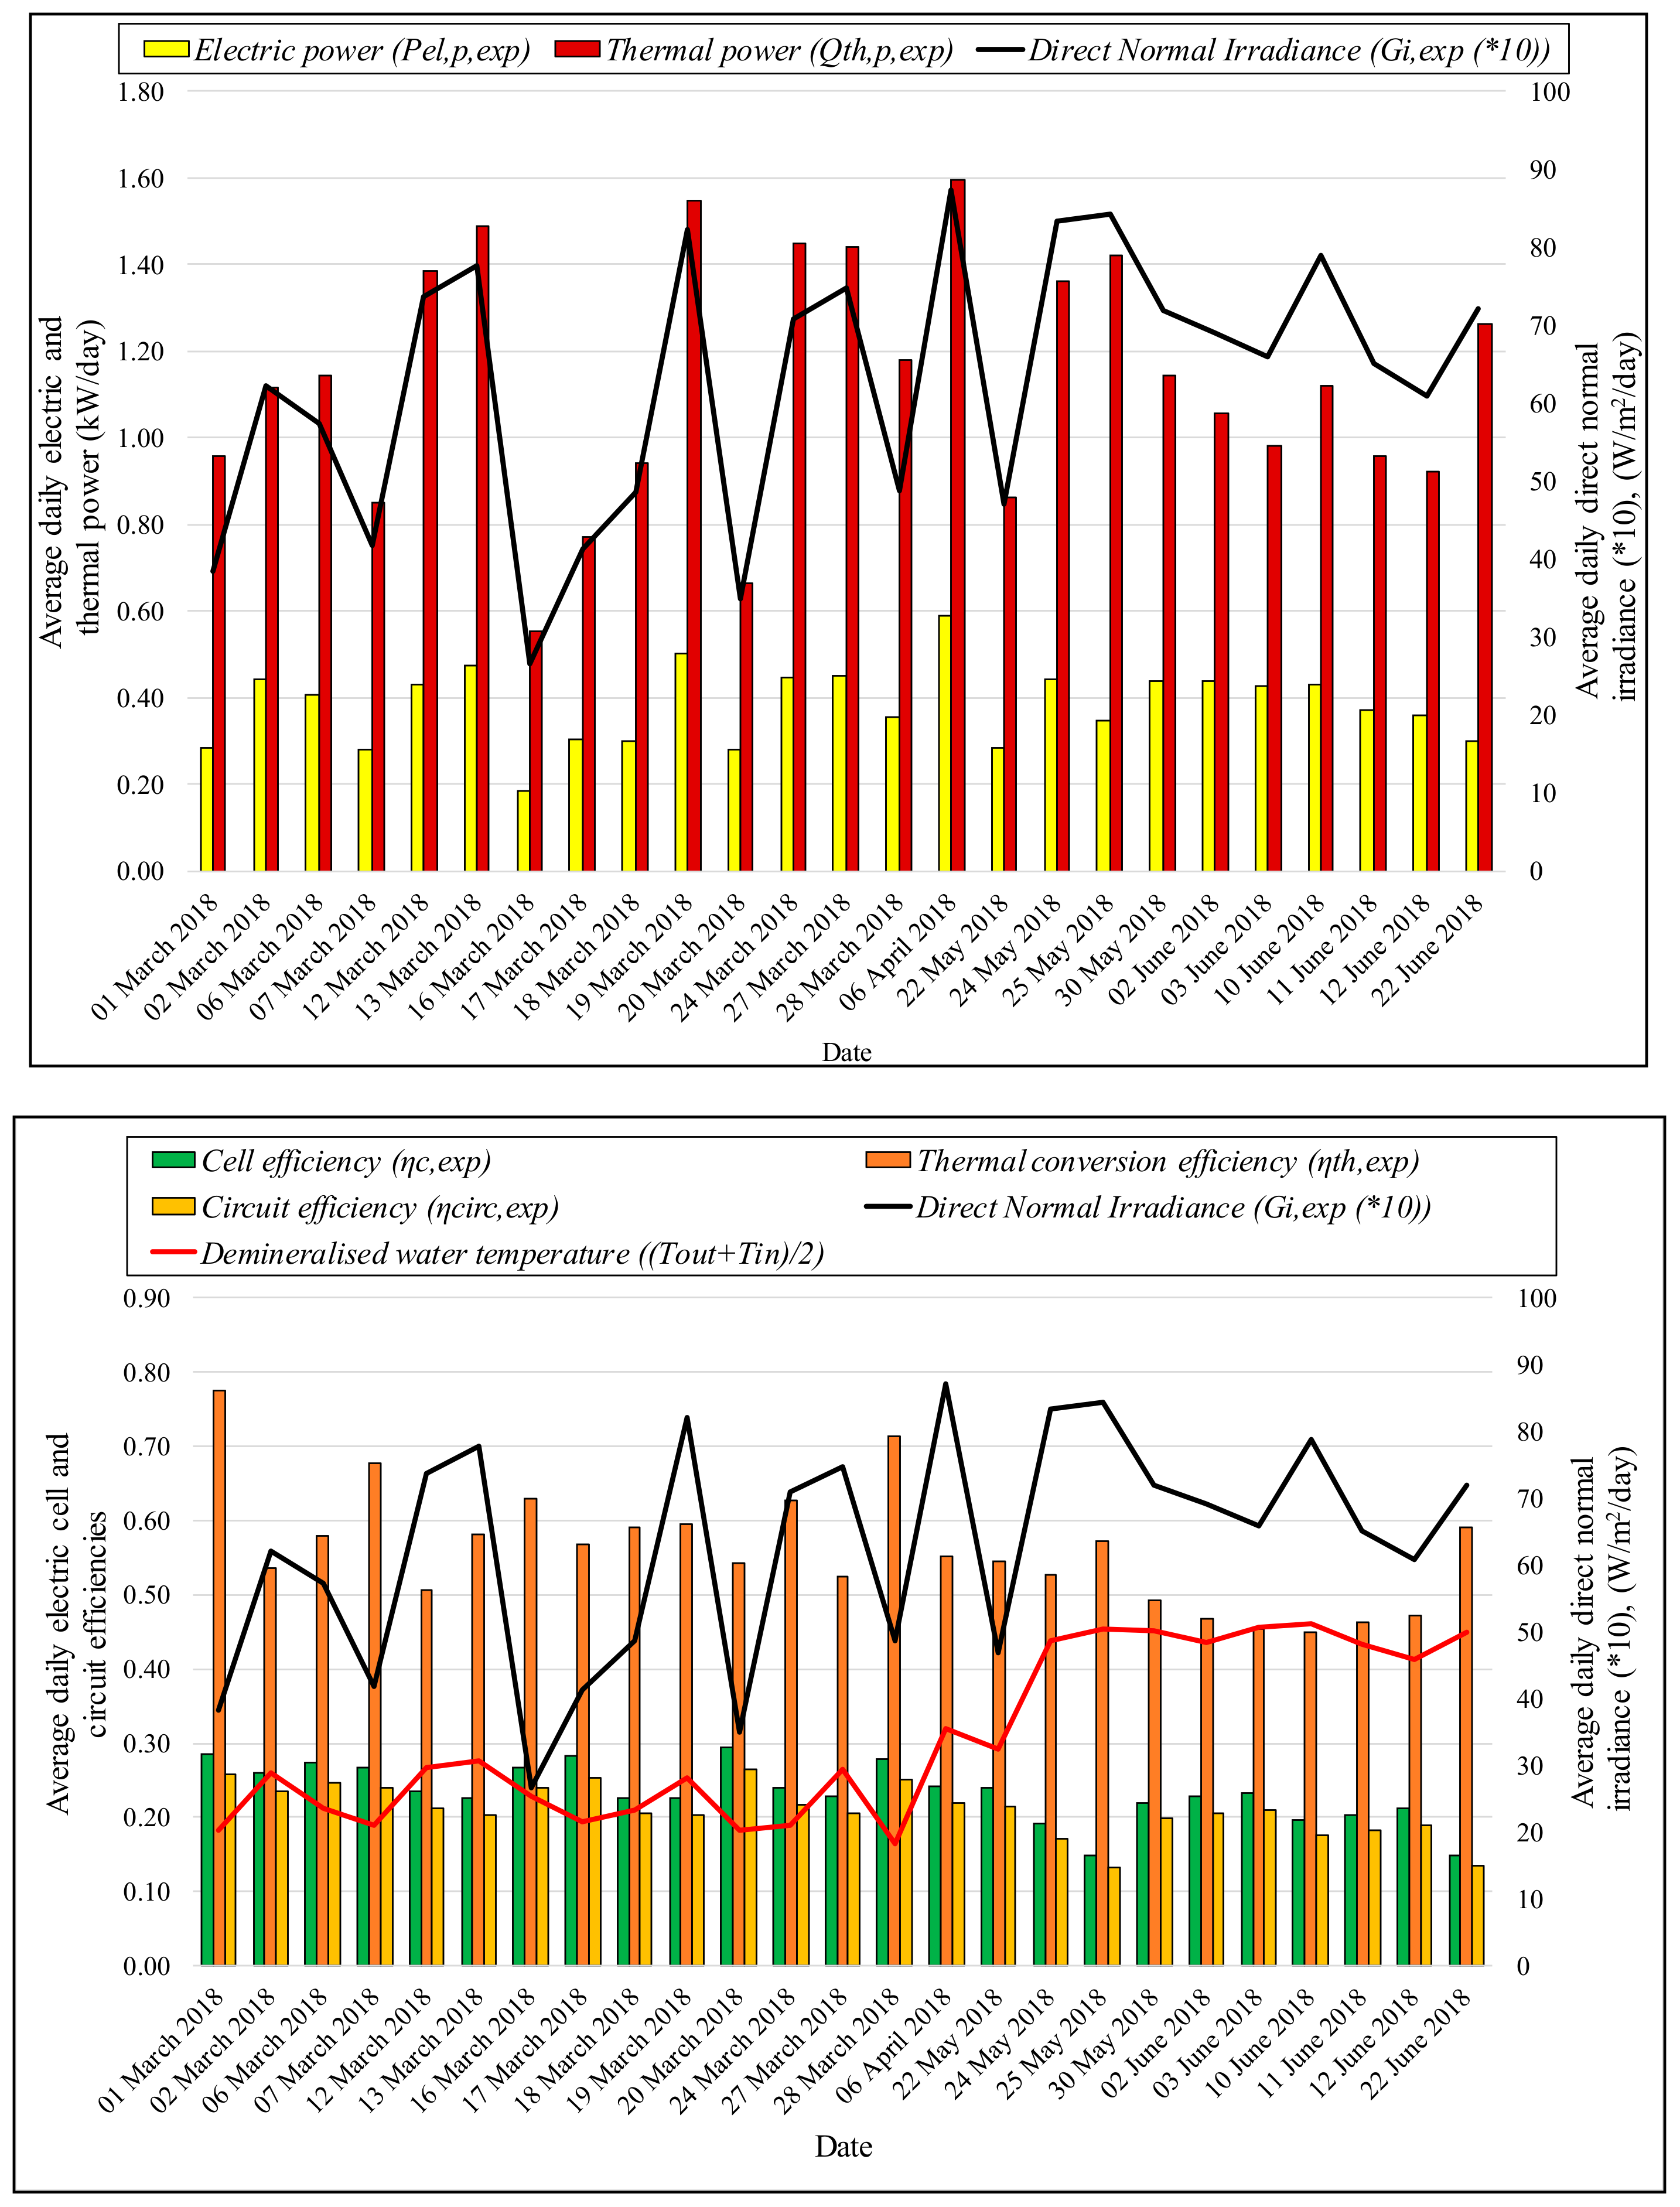
The experimental HCPV/T 2000x system has a maximum capacity of 1 kW electric power and 2 kW thermal power. Monitored data were available from the system and an analysis was carried out for four months (March-June 2018). Data include current, voltage, temperature, volumetric flow rate, and DNI recorded on average six times per minute; these were used to calculate the electric and thermal power/energy as well as the cell efficiency. Figure 5 presents data for 25 days; these are 16 days (1 March 2018 to 22 May 2018) when the circulating active cooling demineralized water was not bypassed from the 0.2 m3 demineralized water storage tank, and 9 days (23 May 2018 to 25 June 2018) for when it was bypassed. These days include 5 to 10 h of electrical and thermal production between 6 am to 3 pm. Figure 5 (upper) shows that the average daily electric and thermal power follow the pattern of the average daily DNI, as this is the main parameter affecting them. Also Figure 5 shows that the average daily experimental electric InGaP/InGaAs/Ge TJ solar cell efficiency does not follow the pattern of DNI because it is influenced by several additional factors namely InGaP/InGaAs/Ge TJ solar cell temperature and demineralized water temperature. The increase in DNI values increases the demineralized water temperature (hence the cell temperature), leading to a reduction in electric cell efficiency; lower efficiency is achieved when water temperature rises to approximately 53 °C from the optimum water temperature of approximately 30 °C.
Based on the experimental results, the annual electrical and thermal energy production potential was calculated for the 11 m2 to be 1584 kWh/year and 4290 kWh/year, respectively. The average and maximum experimental daily efficiency of the InGaP/InGaAs/Ge solar cell was calculated to be 25% and 30% respectively [4]. The average and maximum experimental daily thermal conversion efficiency of the thermal energy system is 56% and 78% respectively (Figure 5). The thermal efficiency was calculated according to thermal conversion efficiency proposed in [24,25], which is a product of the combined optical device efficiency, 1 minus the cell efficiency, and the ratio of experimental thermal power over the incident radiation power (based on onsite measured DNI) on the reflective mirror. Therefore, the total average daily efficiency to ~80%.
These results indicate that the system studied can provide almost 80% of electricity for a typical house as well as 100% of hot water with further ~2000 kWh/household/year available for space heat and/or other heating requirements depending on thermal energy storage availability between the seasons.

3. LCA Methods and Materials

The LCA study of the HCPV/T 2000x system was conducted using process-based attributional LCA following the guidelines and framework of ISO 14044/40, which included: goal and scope definition, inventory, impact assessment and results interpretation for “compilation and evaluation of the inputs, outputs and the impact category indicators of a product system throughout its life cycle” [26,27,28]. It was assessed using SimaPro v8.2.3.0 software (PRé Sustainability, The Netherlands) with incorporated ReCiPe 2016 environmental impact assessment method, which is the successor of Eco-indicator 99 and CML-IA methods. It integrates the midpoint impact category of Eco-indicator 99 and endpoint impact category of CML-IA in order to make result interpretation (relevant to human health, the ecosystem and resources) easier [28]. The method converts lifecycle inventory emitted substances to 18 midpoint indicators (midpoint impact category) and 3 endpoint indicators (endpoint impact category), by adopting the hierarchist midpoint and endpoint characterization factors at a global scale [29,30,31,32]. The ReCiPe 18 midpoint impact category indicators are presented in nomenclature while the 3 endpoint indicators are:
  • Human Health Potential—HHP (DALY/kWh)
  • Ecosystem Potential—EP (species.yr/kWh)
  • Resources Potential—RP (€/kWh)

3.1. Goal and Scope

The goals of this study were to:
  • estimate the lifecycle environmental impacts of electrical and thermal energy generation from HCPV/T 2000x system;
  • critically evaluate the magnitude and significance of the lifecycle environmental impacts of electrical and thermal energy generation from HCPV/T 2000x system.
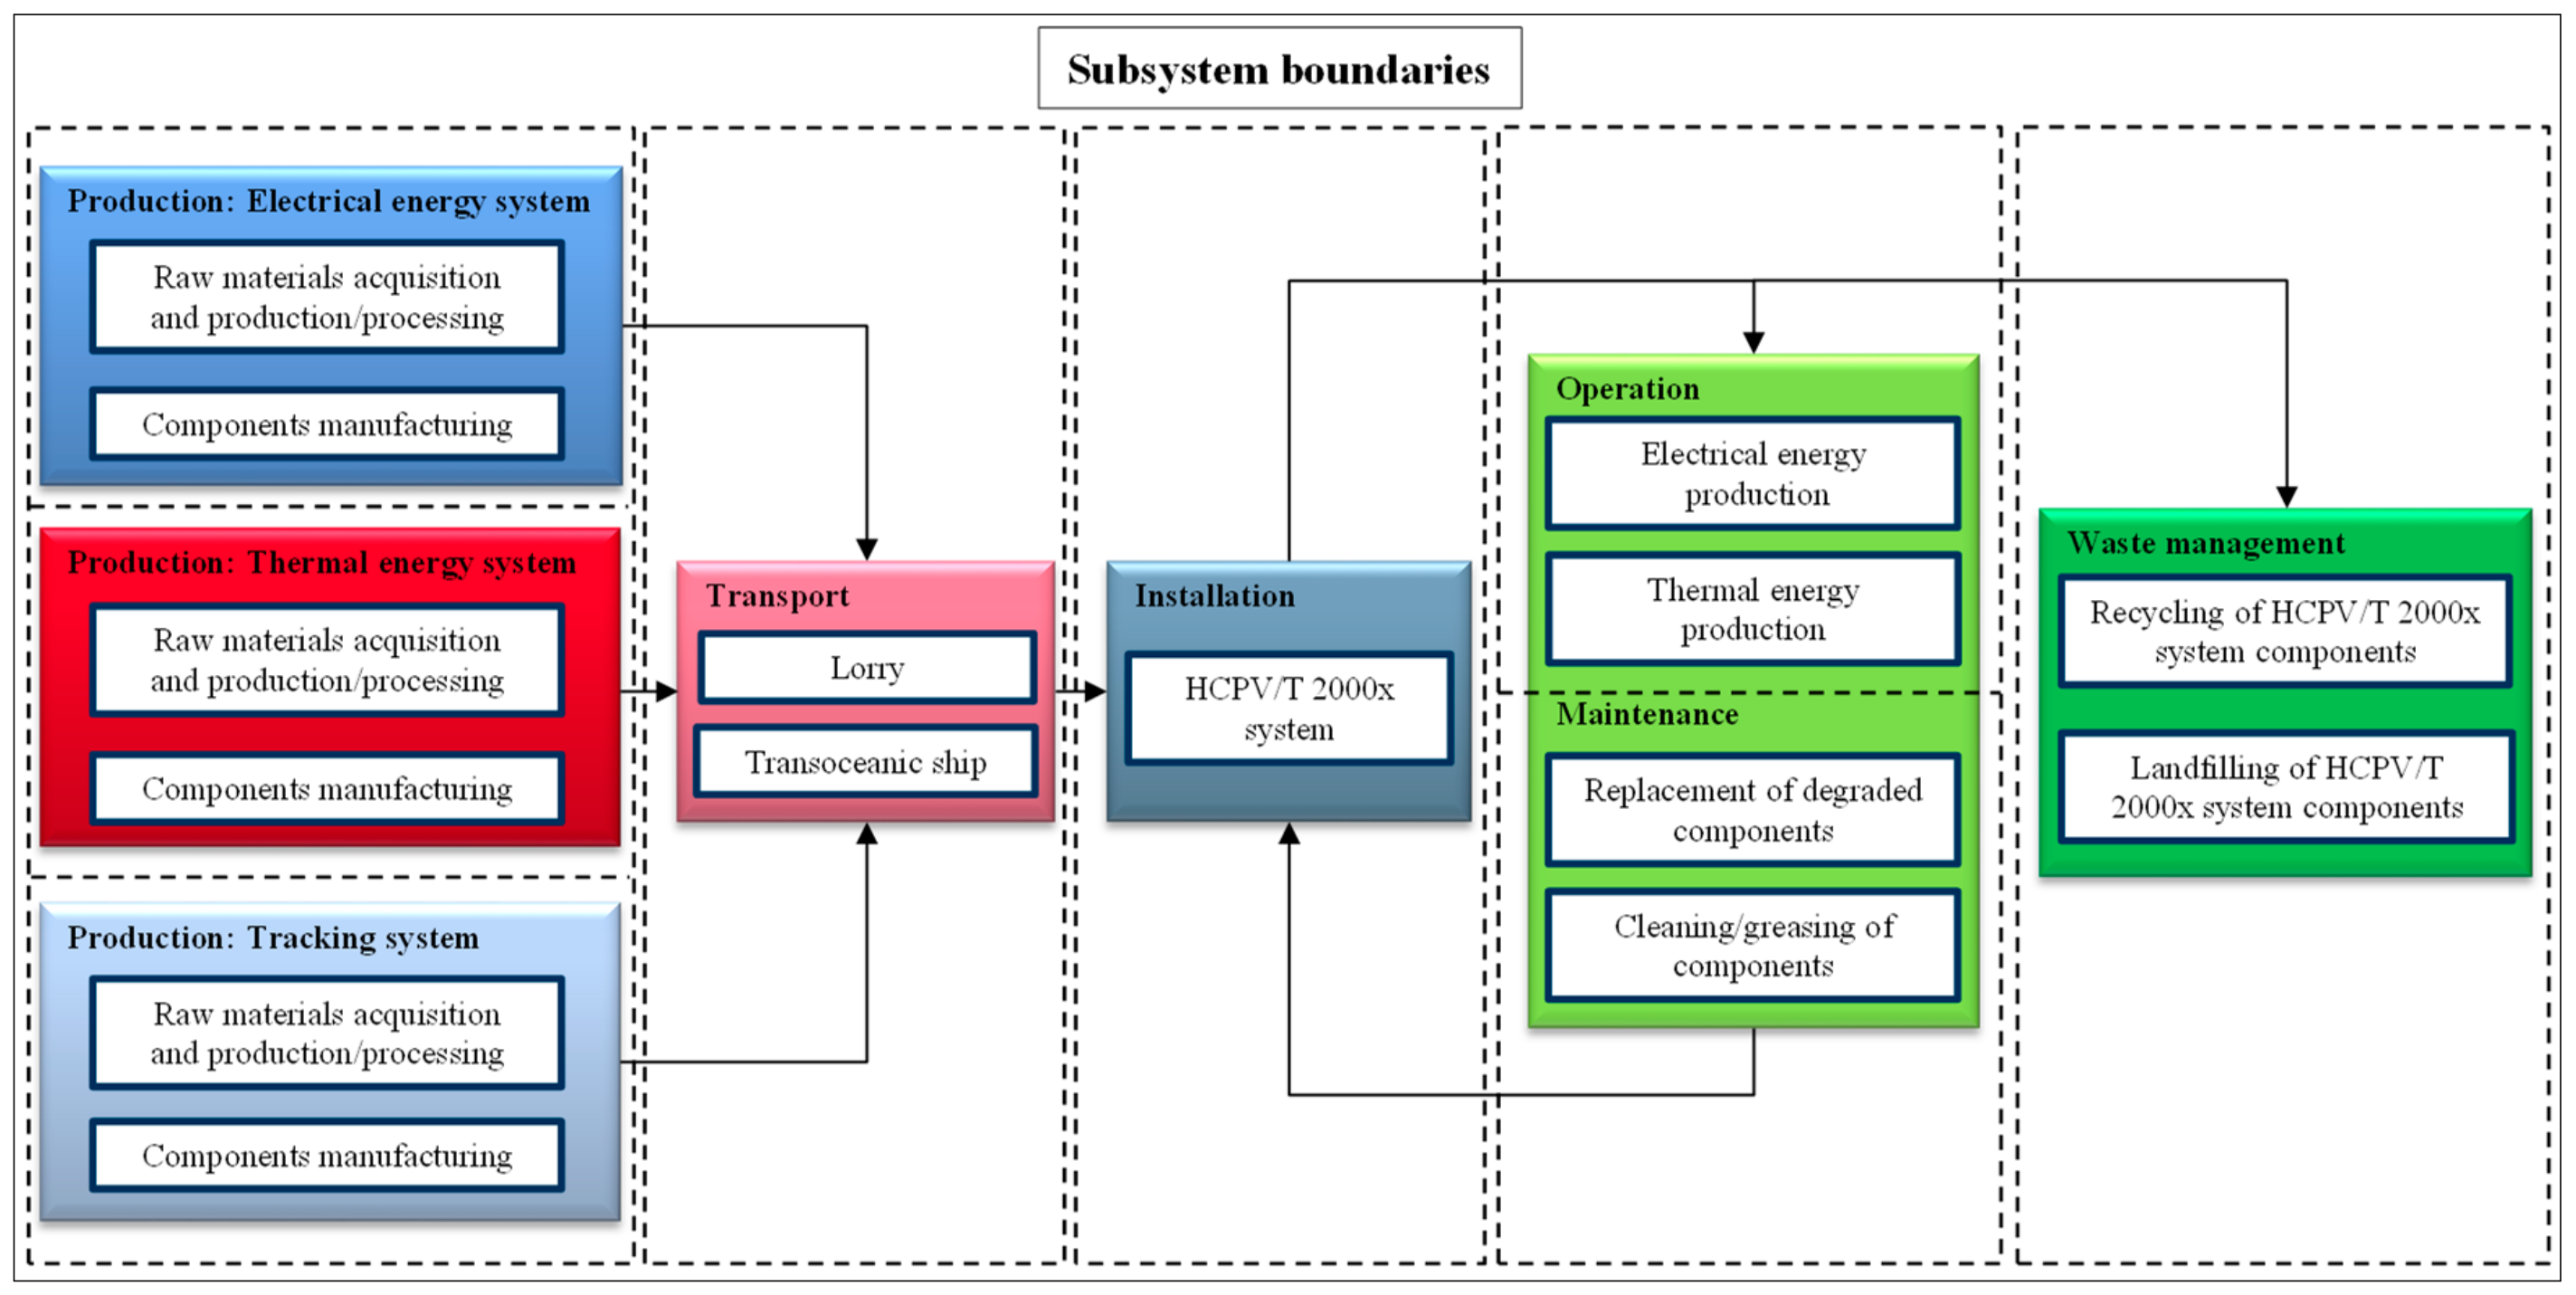
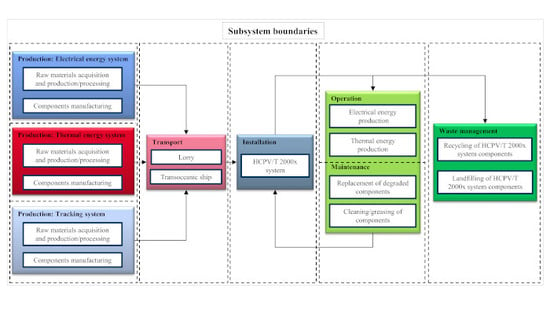
The scope of the study is from cradle to grave, within the LCA system boundary (Figure 6) that envelopes raw materials acquisition and production, component manufacturing, transportation components to installation site, installation of HCPV/T 2000x system, operation and maintenance over service life, and end of life waste management (recycling and landfilling).

3.2. Functional Unit

The functional units (units of analysis) for this study are:
  • 1 kWh of electrical energy generated for a service life of 25 years;
  • 1 kWh of thermal energy generated for a service life of 25 years.
The unit of measurements (kWh) for the defined functional units is in accordance with the European Commission (EC) [33].
The estimated lifecycle environmental impacts were allocated based on the energy production of the 11 m2 HCPV/T 2000x system with the electrical energy production potential of 1584 kWh/year (39,600 kWh for the service life of 25 years) and thermal energy production potential of 4290 kWh/year (107,250 kWh for the service life of 25 years). Consequently, the energy-based fraction of the lifecycle environmental impacts attributed to electrical and thermal energy are 0.37 and 0.63, respectively.

3.3. System Boundary Description and Inventory

The assumptions, compilation and analysis of Life Cycle Inventory (LCI) data (Table 1) used for this study are based on the system boundary (Figure 6) for the HCPV/T 2000x system. LCI data collection for the HCPV/T 2000x system was classified, as follows:
  • The Foreground data—describe the HCPV/T 2000x system that were sourced directly from the company who designed and built the system (Table 1);
  • The Background generic data—describe the materials, energy, transport and waste management related to the HCPV/T 2000x system. Those data were sourced from Ecoinvent via the SimaPro v8.2.3.0 software used in assessing the LCA of the HCPV/T 2000x system [32,34].
The HCPV/T 2000x system boundary consists of five subsystems: production and installation, operation and maintenance, and waste management (Figure 6). The production and installation subsystem involves raw materials acquisition and production, components manufacturing, components transportation to the installation site and assembly/installation of the HCPV/T 2000x system. The operation and maintenance subsystem involves the generation of electrical and thermal energy, replacement of degraded HCPV/T 2000x system component, cleaning and greasing. Finally, the waste management subsystem involves recycling and landfilling according to the waste management policy and regulation of the case study location. Specific information on the five systems and sources of data are given below.
Production: Electrical energy system: The electrical energy system comprises of InGaP/InGaAs/Ge solar cells, 1 kW variable load inverter, Lithium (Li) ion battery and electric wire connections. Although a Li ion battery is not installed as part of the HCPV/T/2000x system at the case study location, it was assumed that it is part of the HCPV/T/2000x system. The background LCI data of InGaP/InGaAs/Ge solar cell were sourced from commercially available company/literature data, and adapted Silicon (Si) wafer and Czochralski processes from Ecoinvent; these processes were adapted by substituting element/process data related Si with In, Ga, P, As and Ge [32,34].
Production: Thermal energy system: The thermal energy system comprises of active heat sinks and a reverse return system.
Production: Tracking system: The tracking system comprises of structural support, axle, CMOS webcam, electronic and software connection, reflective mirrors, optical receiver, rotational and linear motor.
Transport: The transportation phase of the LCA assesses the transportation impact during the supply of system components to the case-study location site. The transportation impact during raw materials acquisition and component production is not included in the phase, instead it is embedded in the environmental impact at the raw materials acquisition and component production. The transportation modes and distances are summarized in Table 2. It was assumed that all the system components (except the InGaP/InGaAs/Ge solar cell) were manufactured and supplied from the industrial area of Italy (the north). The InGaP/InGaAs/Ge solar cells were manufactured and supplied from Taiwan to Palermo, Sicily, Italy. It was assumed that the InGaP/InGaAs/Ge solar cells were transported by road from the manufacturer to the port of Kaohsiung, Taiwan then by sea to the port of Palermo, Italy. It was also assumed that the components from the north of Italy were transported by road to the port of Genova then by sea to the port of Palermo.
Installation: The installation phase of the LCA assesses the potential land use and electricity consumption of installing 11 m2 HCPV/T 2000x system.
Operation and maintenance: The current challenge facing the deployment of the CPV and CPV/T (or HCPV/T) systems is the lack of procedures and regulatory standards for the development and maintenance gates of the system product lifecycle. Currently, the only available information are the findings published by [35] based on theoretical aspects of the different elements to identify the critical components of the CPV system. The elaboration of those findings, which are related to the identified critical components based on the CPV system operation and maintenance data were collected from 2009 to 2016 [36]. The identified critical components accounting for 85% of the operational and maintenance incidences are tracker, control software and electrical connections, of which the tracker accounts for more than 50% of the operational and maintenance incidence [35]. The findings published by [36] shows a significant reduction in operational and maintenance incidences from 2009 to 2016, which resulted with increasing the reliability and availability of the system to 99.5%. Therefore, it was assumed that the HCPV/T 2000x systems reliability and maintenance is 99.5% and that the required operation and maintenance were based on replacement of degraded components and yearly maintenance of structural components (Table 3). A state-of-the-art Li-ion battery available in MWh(s) nominal capacity was adopted as part of the HCPV/T 2000x system. Li-ion batteries have a long lifetime depending on their management and depth of discharge. They are recommended for home systems with PV electricity generation in hot climates [37]; although costs are still high their environmental impact is lower than acid-lead batteries [38]. We propose a Lithium Ferro Phosphate battery with claimed discharge cycles of 10,000 at 80% depth of discharge [39] complemented by a management system to minimize cycles and depth of discharge. Therefore, the battery will not be replaced during the HCPV/T 2000x system service life of 25 years.
Waste management: This case study assumes that after 25 years of service, the HCPV/T 2000x system components, which include the components replaced during maintenance and their different material types/parts (Table 4) will be recycled and landfilled (Figure 6). Italy as a member of the European Union (EU) is obliged to follow the EU’s waste policy and legislation set up by the EC [41].

4. Results and Discussion

4.1. Midpoint and Endpoint Environmental Impact Category Indicators and Identification of Hotspots

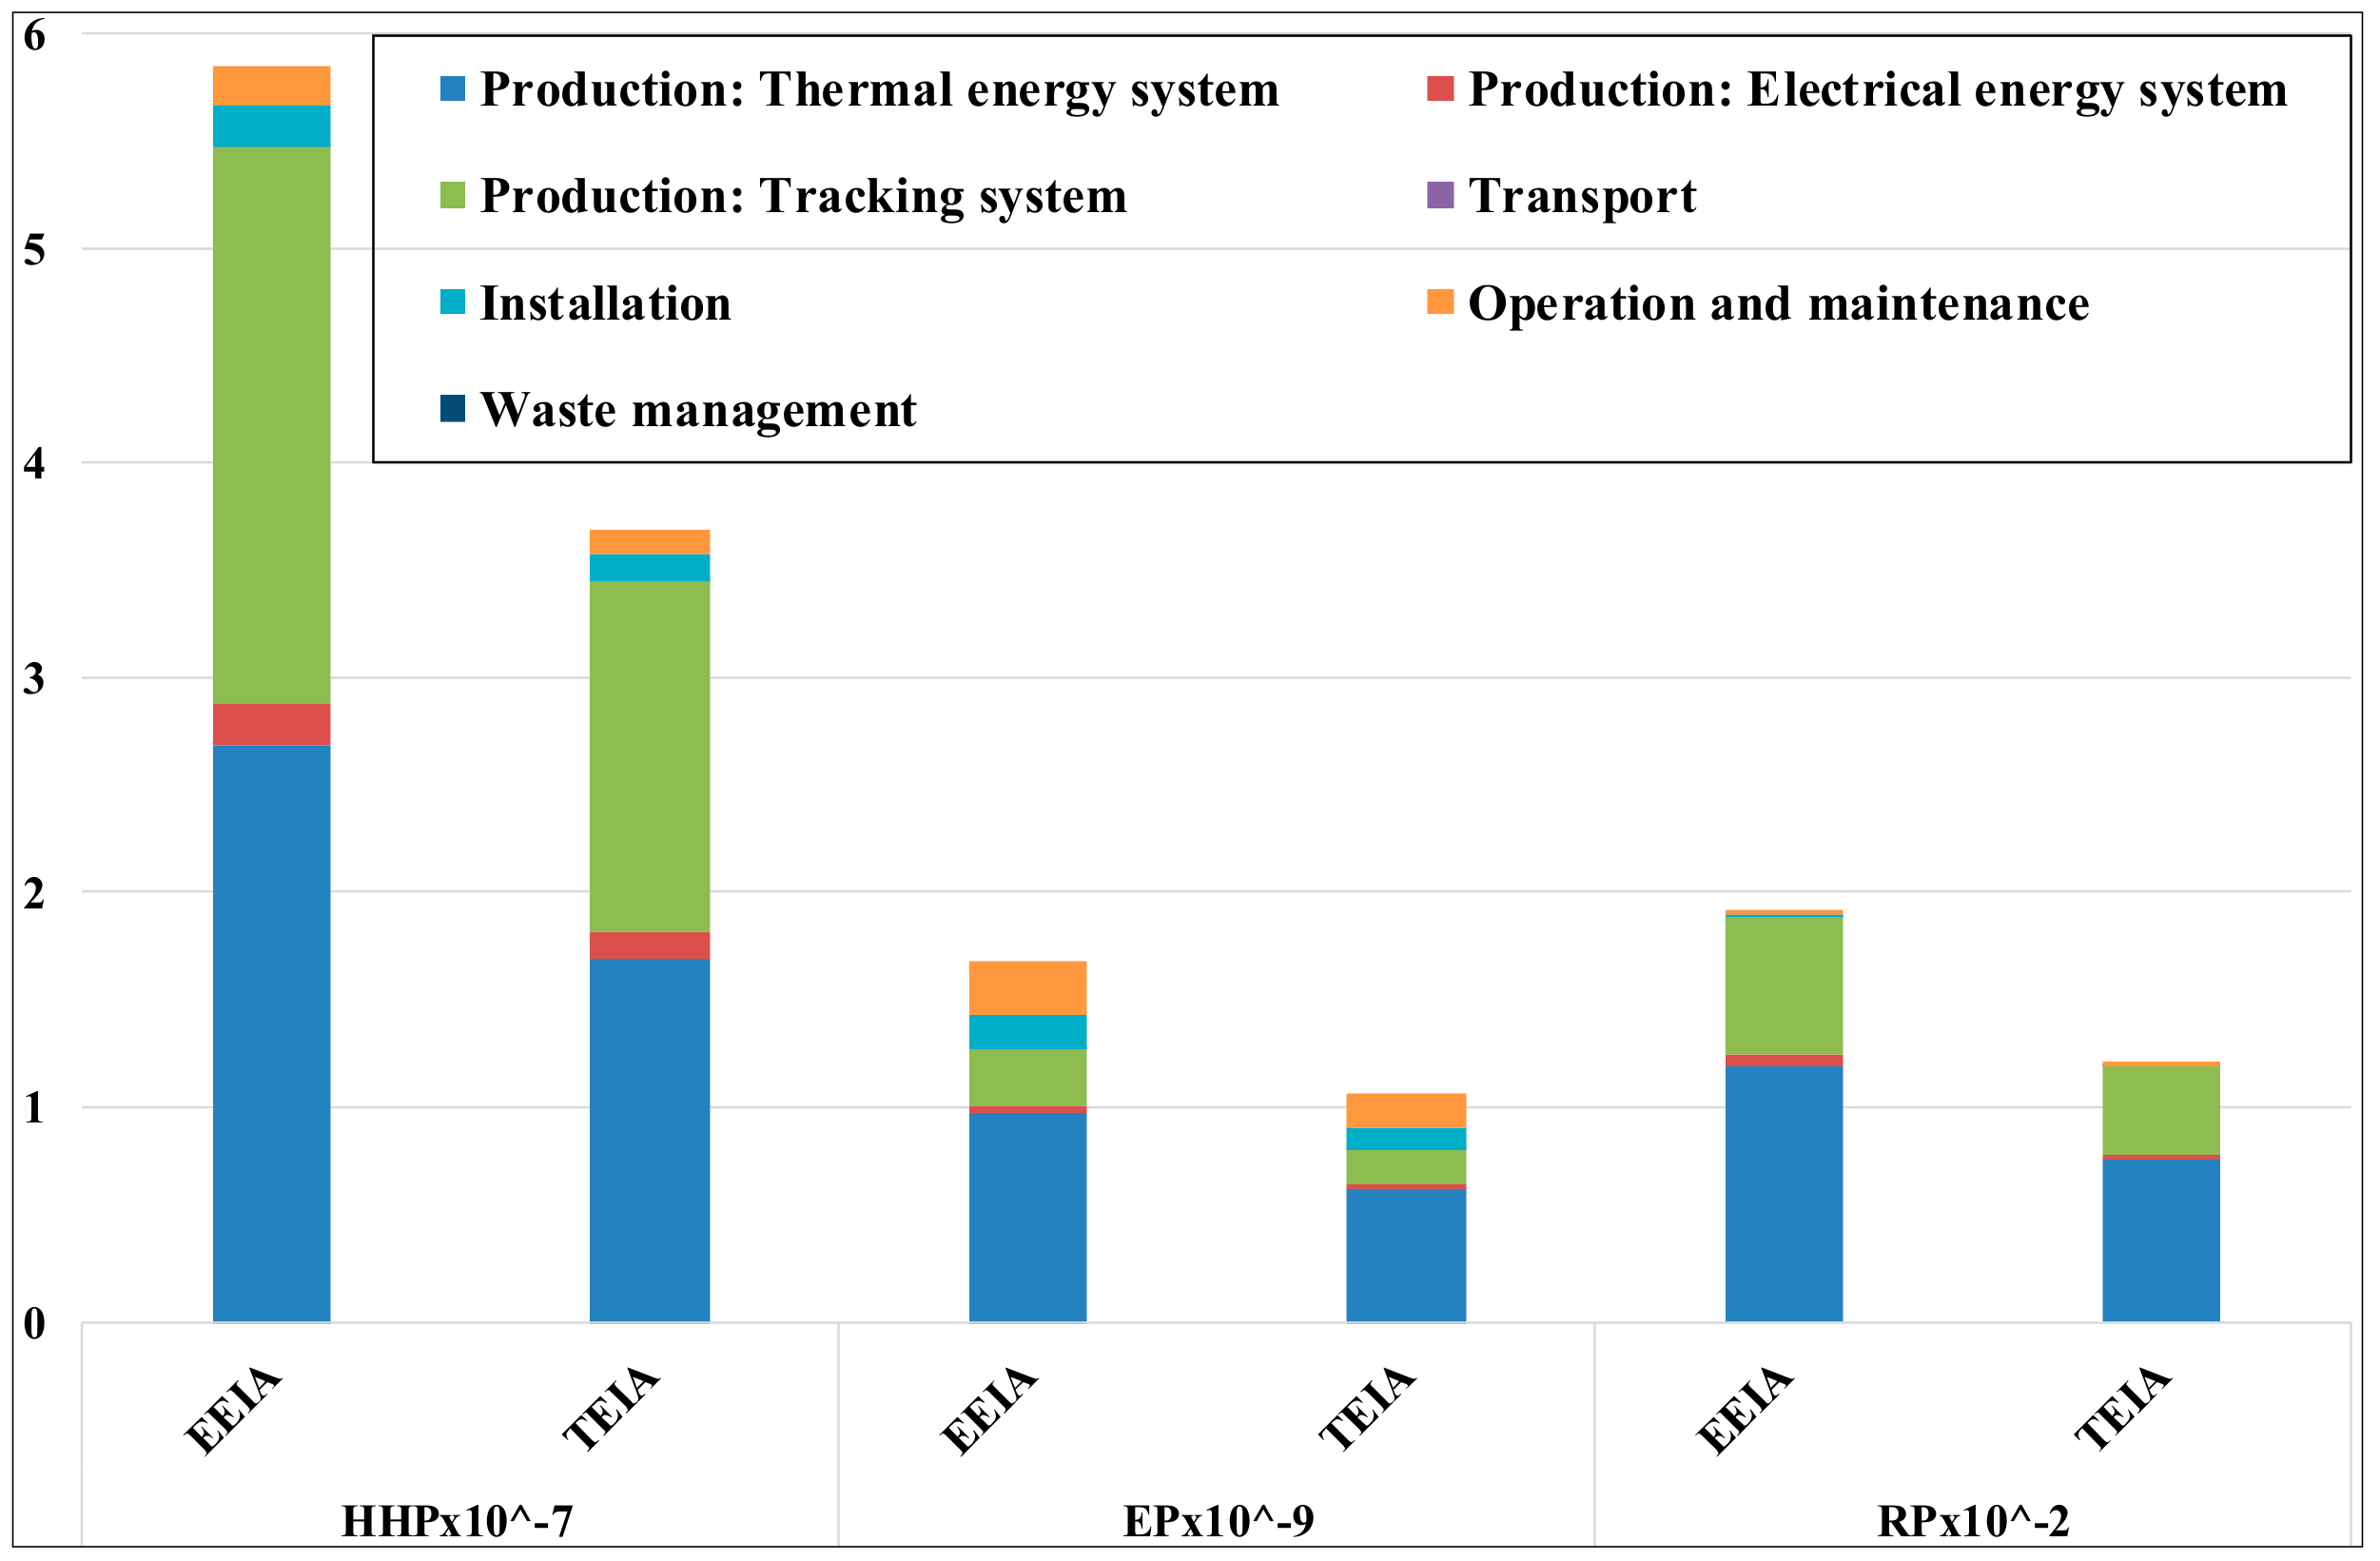
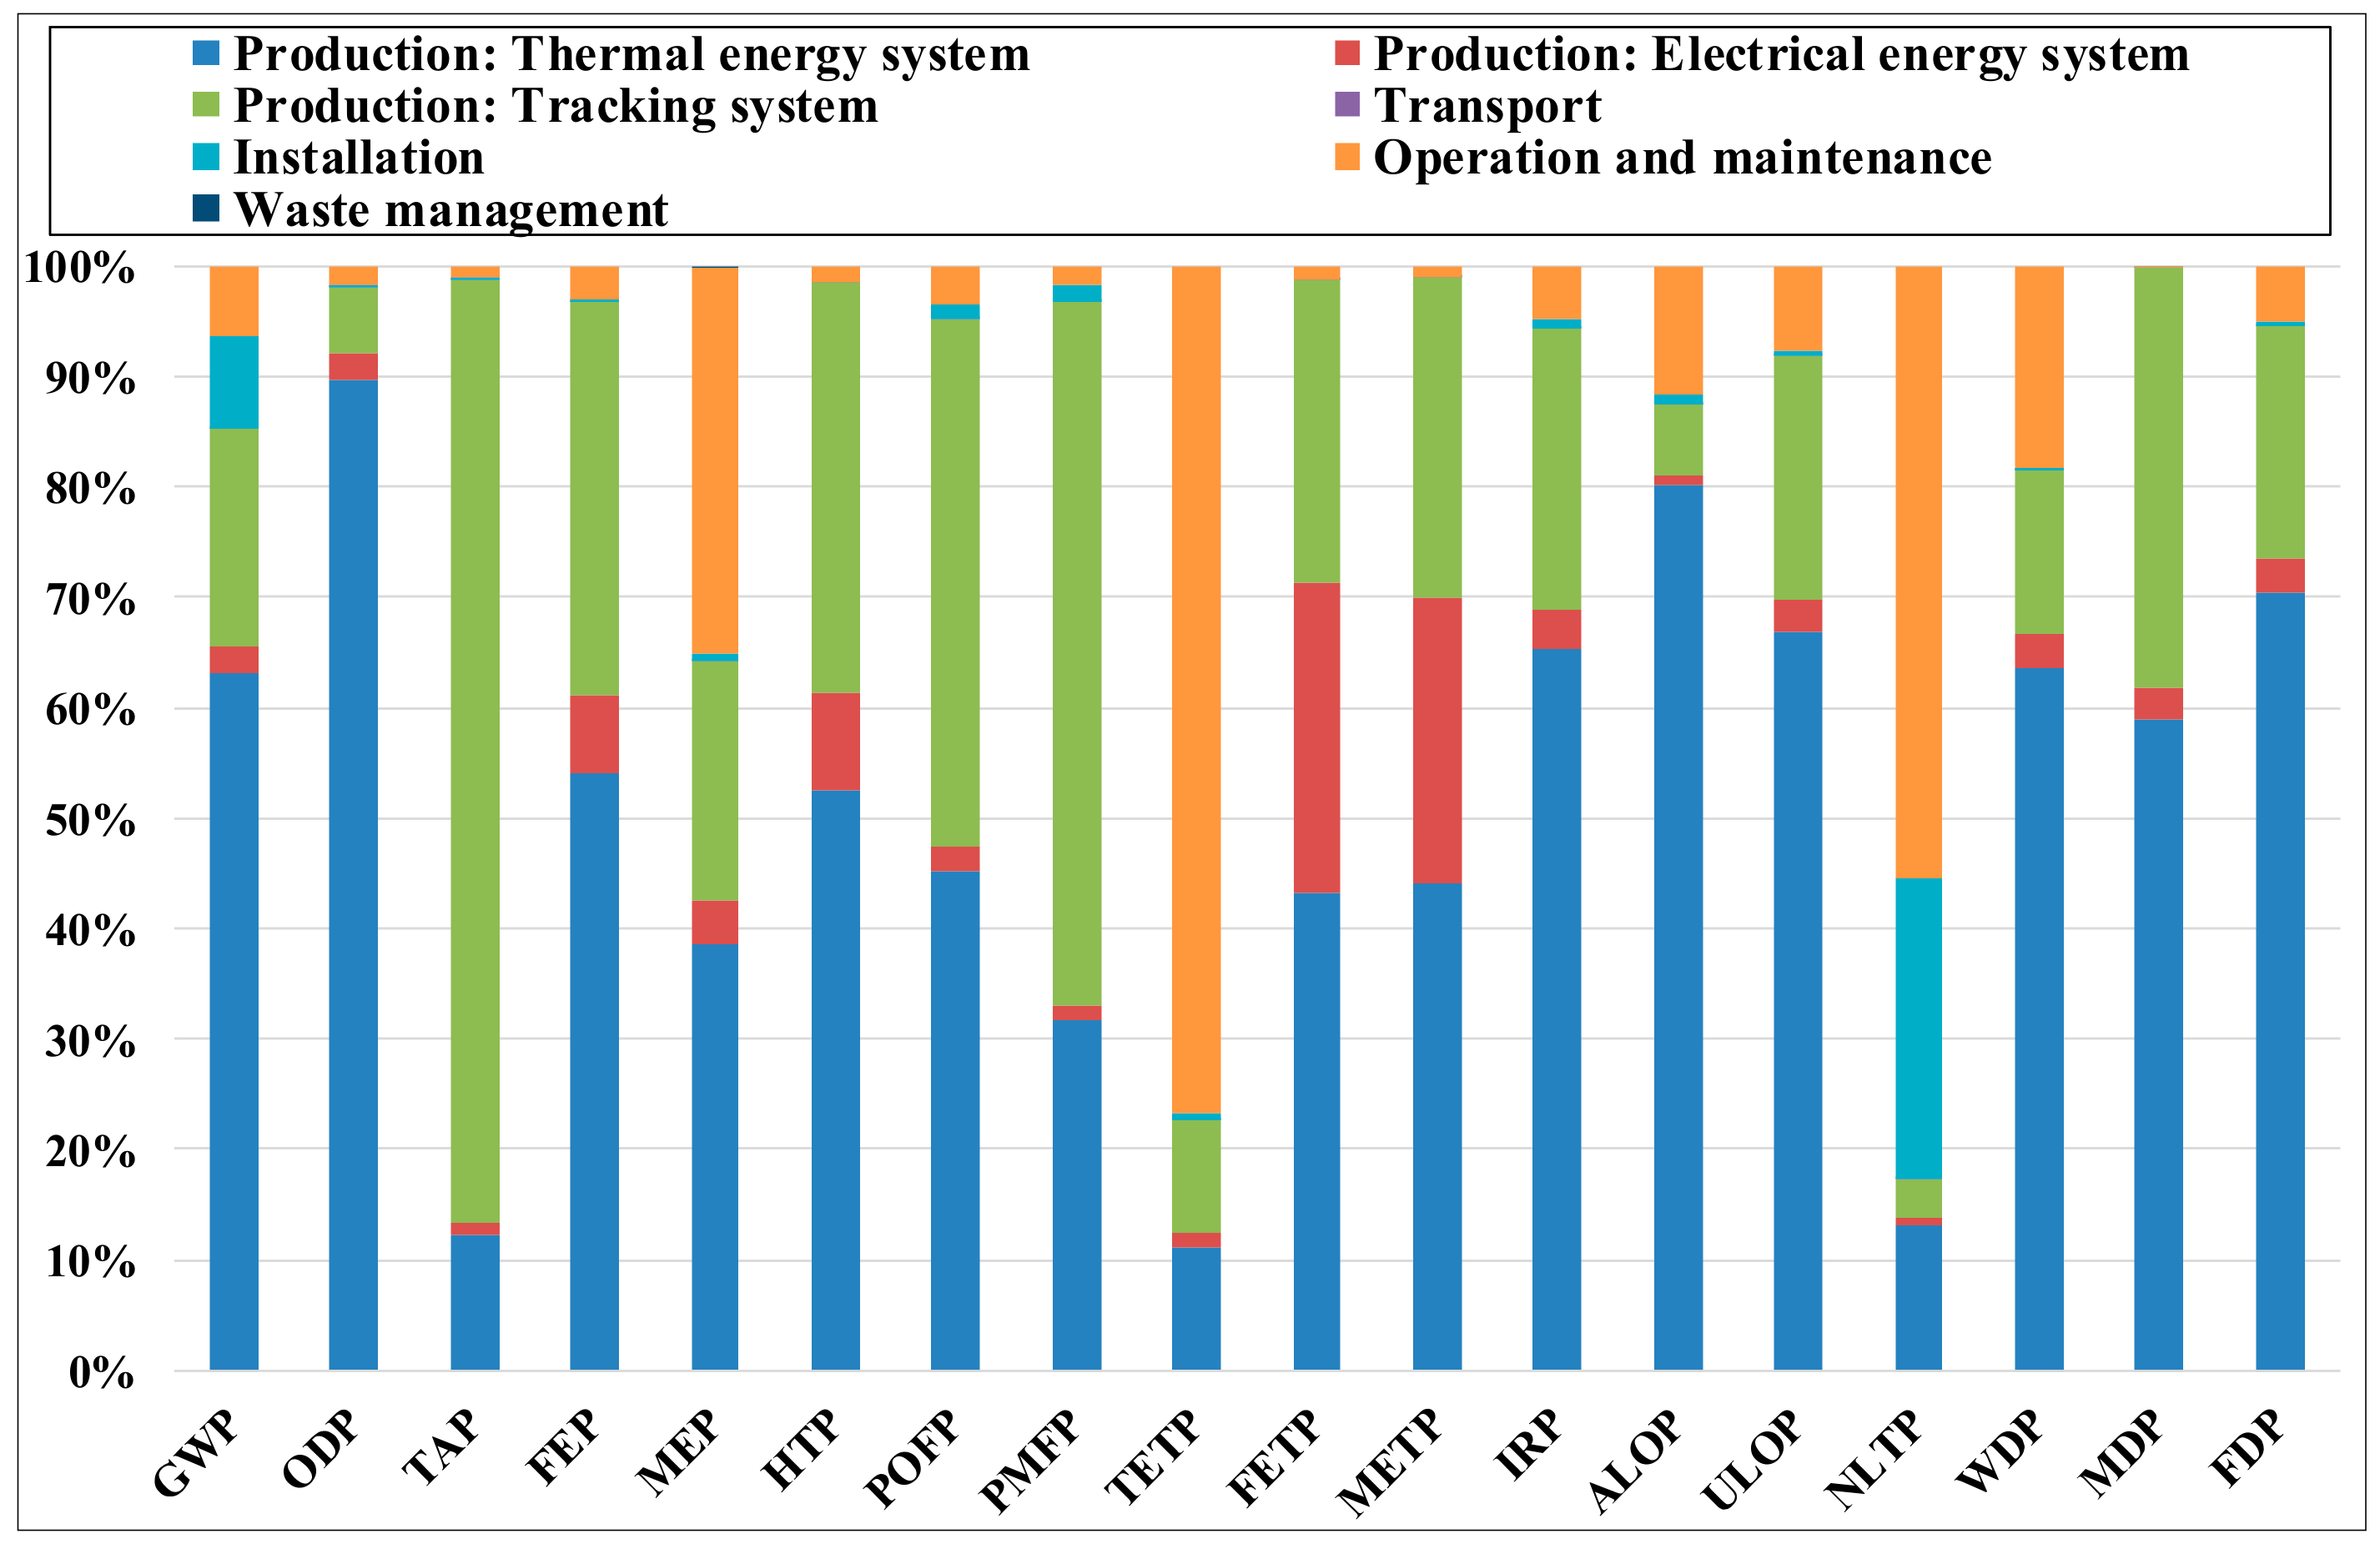
The results of midpoint and endpoint environmental impacts are presented in Table 5 (presented numerically in the first two columns) and Figure 7 respectively. Figure 8 presents the percentage contribution by the subsystem boundaries presented in Figure 6. The results are presented separately for the Electrical Energy Impact Allocation (EEIA) and Thermal Energy Impact Allocation (TEIA) for the defined functional units of 1 kWh for the electrical energy and 1 kWh for the thermal energy. At the midpoint level as shown in Figure 8, the production: thermal energy and tracking systems are the main contributors to the following 13 impact category indicators: GWP, ODP, TAP, FEP, MEP, HTP, POFP, PMFP, FETP, IRP and FDP. The main contributors to TETP, WDP and ALOP are the operation and maintenance and production: thermal energy system. The main contributors to METP are production: thermal and electrical energy and tracking systems. Finally, the main contributors to NLTP are operation and maintenance and installation.
At the endpoint level as shown in Figure 7, the main contributors to HHP and RP are the production: thermal energy and tracking systems while the main contributors to EP are the production: thermal energy system and operation and maintenance. The production: thermal energy system contribution to the environmental impacts are mostly due to the raw materials acquisition/production and manufacturing of the demineralized water storage tank that are mostly accounted for by metalworking (mainly hot steel alloy rolling), welding and glass wool manufacturing process. Also, the production: tracking system contribution is mostly due to the raw materials acquisition/product and manufacturing of the structural support and axle that are mostly accounted for by metalworking (mainly hot steel alloy rolling). The production: electrical energy system contribution can be traced to the raw materials acquisition/production and manufacturing of the electrical wire connections. The contribution towards operation and maintenance was due to the use of on-site land, demineralized water for thermal energy extraction and cleaning of reflective mirror, and lithium for greasing the metallic structural support while installation was due to the use of on-site land and energy consumed by during the installation of the HCPV/T 2000x system.
These results were used to identify the hotspots within the system boundary in accordance to the EC [50,51], which state that the most relevant lifecycle stages are those that contribute over 80% (before normalization and weighting) to any of the baseline impact category indicators. Figure 8 shows that at the midpoint level, the production: thermal energy system, production: tracking system, operation and maintenance subsystem boundaries are the identified hotspots, because on average across the 18 environmental impact category indicators, they are responsible for 92% of the environmental impacts (50%, 29% and 13% respectively). However, Figure 7 shows that at the endpoint level, the production: thermal energy system and production: tracking system subsystem boundaries are the identified hotspots, because on average across the 3 environmental impact category indicators, they are responsible for 87% of the environmental impacts (55% and 32% respectively). The identification of production: tracking system as a hotspot and its cause is in agreement with [15,52] who reported that the LCA study of HCPV system identify the tracking system as a hotspot.

4.2. Comparison of Midpoint Results with Literature

The midpoint environmental impact indicators of the HCPV/T 2000x system from this study were compared with the results reported in the literature that investigated the midpoint environment impact of the cogeneration systems for the case studies in Italy, Mexico and the UK (Table 5 and Table 6). In addition, Table 7 and Figure 9 show the comparison of the lifecycle environmental impacts of this study in comparison to RES and non-RES technologies in six world regions (China, OECD Europe, OECD North America, Latin America, Africa and Middle East), and the global scale. The median values of the literature case studies were reported in Table 5 and Table 7 and Figure 9 because different scenarios (SC) or types of energy system technology were studied and it was less affected by outliers. In order to maintain consistency, the impact indicator units of MWh were converted to kWh.
The following paragraphs discuss the results presented in Table 5, Table 6 and Table 7 and Figure 9 in more detail.
Comparison presented in Table 5.
Table 5 presents several system boundary environmental EEIA of the HCPV/T 2000x system compared with the cradle to grave of the Wood Biomass-Combined Heat and Power (WB-CHP) [46] and Anaerobic Digestion-Combined Heat and Power-Organic Rankine Cycle CHP (AD-CHP-ORC) [47] systems located in Italy. The WB-CHP system uses wood-based biomass from the forest and agricultural activities as a source of heat to produce electrical energy. The analyzed WB-CHP considered four alternative SC of biomass sources: “residues from natural regeneration forestry and industrial activities as feedstock” (SC1), rotation forestry of poplar (SC2), rotation forestry of willow (SC3) and “residues from natural forests and from traditional poplar plantations” (SC4). It was found that the GWP, TAP, FDP, POFP and MEP of the HCPV/T 2000x system were 8–585% lower than the WB-CHP system. In opposite, the remaining impact indicators were 6–89% higher than WB-CHP system. The main reason for the higher environmental impacts seems to be the processes that include: biomass transportation from forest stands to power plant site, biomass combustion in CHP system and diesel consumption in forest machinery for the production of biomass feedstock used in SC2, SC3 and SC4, all of which contributes to the emission of substances; mainly nitrogen oxides (NOx), CO2 and Particulate matter (PM) [46]. The AD-CHP-ORC system uses the AD process as a source of low-grade heat to produce electrical energy. The FDP, TAP, GWP, and MEP of the HCPV/T 2000x system were 30–4224% lower while the remaining impact indicators were 8–94% higher than the AD-CHP-ORC system. The main reason for increasing of the environmental impacts of the AD-CHP-ORC system is probably as a result diesel consumption for feedstock production and transport (resulting in the emission of NOx, CO2, PM), and methane (CH4) and nitrogen dioxide (NO2) emissions from digestate during storage [46,47].
Table 5 also presents system boundary GWP and/or TAP for EEIA and TEIA of the HCPV/T 2000x system compared with the cradle to grave of the Stirling Engine micro-CHP (SE-micro-CHP) [48] and industrial CHP systems [49] for the case studies in the UK. The SE-micro-CHP system is similar in shape and size to a residential domestic gas boiler while the industrial CHP plant is an operational plant that both produces electrical and thermal energy. The system boundary of GWP for EEIA and TEIA of the HCPV/T 2000x system showed to be lower for 182% and 183% respectively while the TAP higher for 90% and 108% comparing to the SE-micro-CHP system. The system boundary GWP for EEIA of the of the HCPV/T 2000x system showed to be 49% lower comparing to the industrial CHP. The main reason for the higher GWP of SE-micro-CHP system is probably as a result of fuel (natural gas) combustion [48,49].
Comparison presented in Table 6.
Table 6 presents several operation and maintenance subsystem boundary environmental EEIA and TEIA of the HCPV/T 2000x system compared with the operational lifecycle stage of the Steam Turbine-CHP (ST-CHP), Gas Turbine- Heat Recovery Steam Generator-CHP (GT-HRSG-CHP), Gas Turbine-Post Combustion Carbon Capture-CHP and (GT-PCC-HRSG-CHP) systems for the case studies in Mexico [54]. The ST-SHP system is a conventional plant, which uses high-pressure steam, while the GT-HRSG-CHP and GT-PCC-HRSG-CHP systems retrofitted from the ST-SHP system are gas turbine systems incorporated with HRSG, and PCC-HRSG respectively. It was found that the HCPV/T 2000x system operation and maintenance subsystem boundary EEIA and TEIA GWP, TAP, POFP, PMFP and FDP were 707–15474% lower than the ST-CHP and GT-HRSG-CHP systems. In addition, the HCPV/T 2000x system operation and maintenance subsystem boundary EEIA and TEIA TAP, HTP, POFP, PMFP, FETP, METP and FDP were 24–6577% lower than GT-PCC-HRSG-CHP system. The main reason for the higher environmental impacts of ST-CHP, GT-HRSG-CHP and GT-PCC-HRSG-CHP systems is probably as a result of fuel (natural gas) combustion, which contributes to the emission of substances; mainly NOx, CO2, carbon monoxide (CO), PM, CH4, and Volatile Organic Compounds (VOC). The ST-CHP and GT-PCC-HRSG-CHP systems have highest and lowest environmental impacts respectively, because of the reduction in fuel (natural gas) for combustion by the GT-PCC-HRSG-CHP systems [54].
Comparison presented in Table 7.
Table 7 presents several system boundary environmental EEIA of the HCPV/T 2000x system compared with the lifecycle environmental impacts of RES (PV, CSP, Hydropower and Wind power) and non-RES (Coal and Natural gas) systems respectively, for six world regions; China—Coal and Natural gas systems, OECD Europe—Wind power systems, OECD North America—PV systems, Latin America—Hydropower systems, and Africa and Middle East—CSP systems. It can be seen that for all impacts, the PV systems are 50%–96%, CSP systems 60%–96%, hydropower systems 43%–98% and wind systems 60%–98% lower than the HCPV/T 2000x system. The higher environmental impact of the HCPV/T 2000x system is probably as a result of higher input of raw materials, energy and heating processes during the production of the thermal energy and tracking systems. The non-RES systems in comparison with HCPV/T 2000x system presented different values for the different EEIA, as follows: the GWP, FEP and POFP of Coal systems were 13%–306% lower while TAP, HTP, PMFP and FDP of the HCPV/T 2000x system 34%–97% higher; the GWP and TAP of Natural gas systems 27%–198% lower while FEP, HTP, POFP, PMFP and FDP of the HCPV/T 2000x system 5%–99% higher [53]. The environmental impact of the HCPV/T 2000x system is higher probably as a result of the higher primary energy demand required during raw materials acquisition/production and manufacturing of the thermal energy and tracking systems.
Comparison presented in Figure 9.
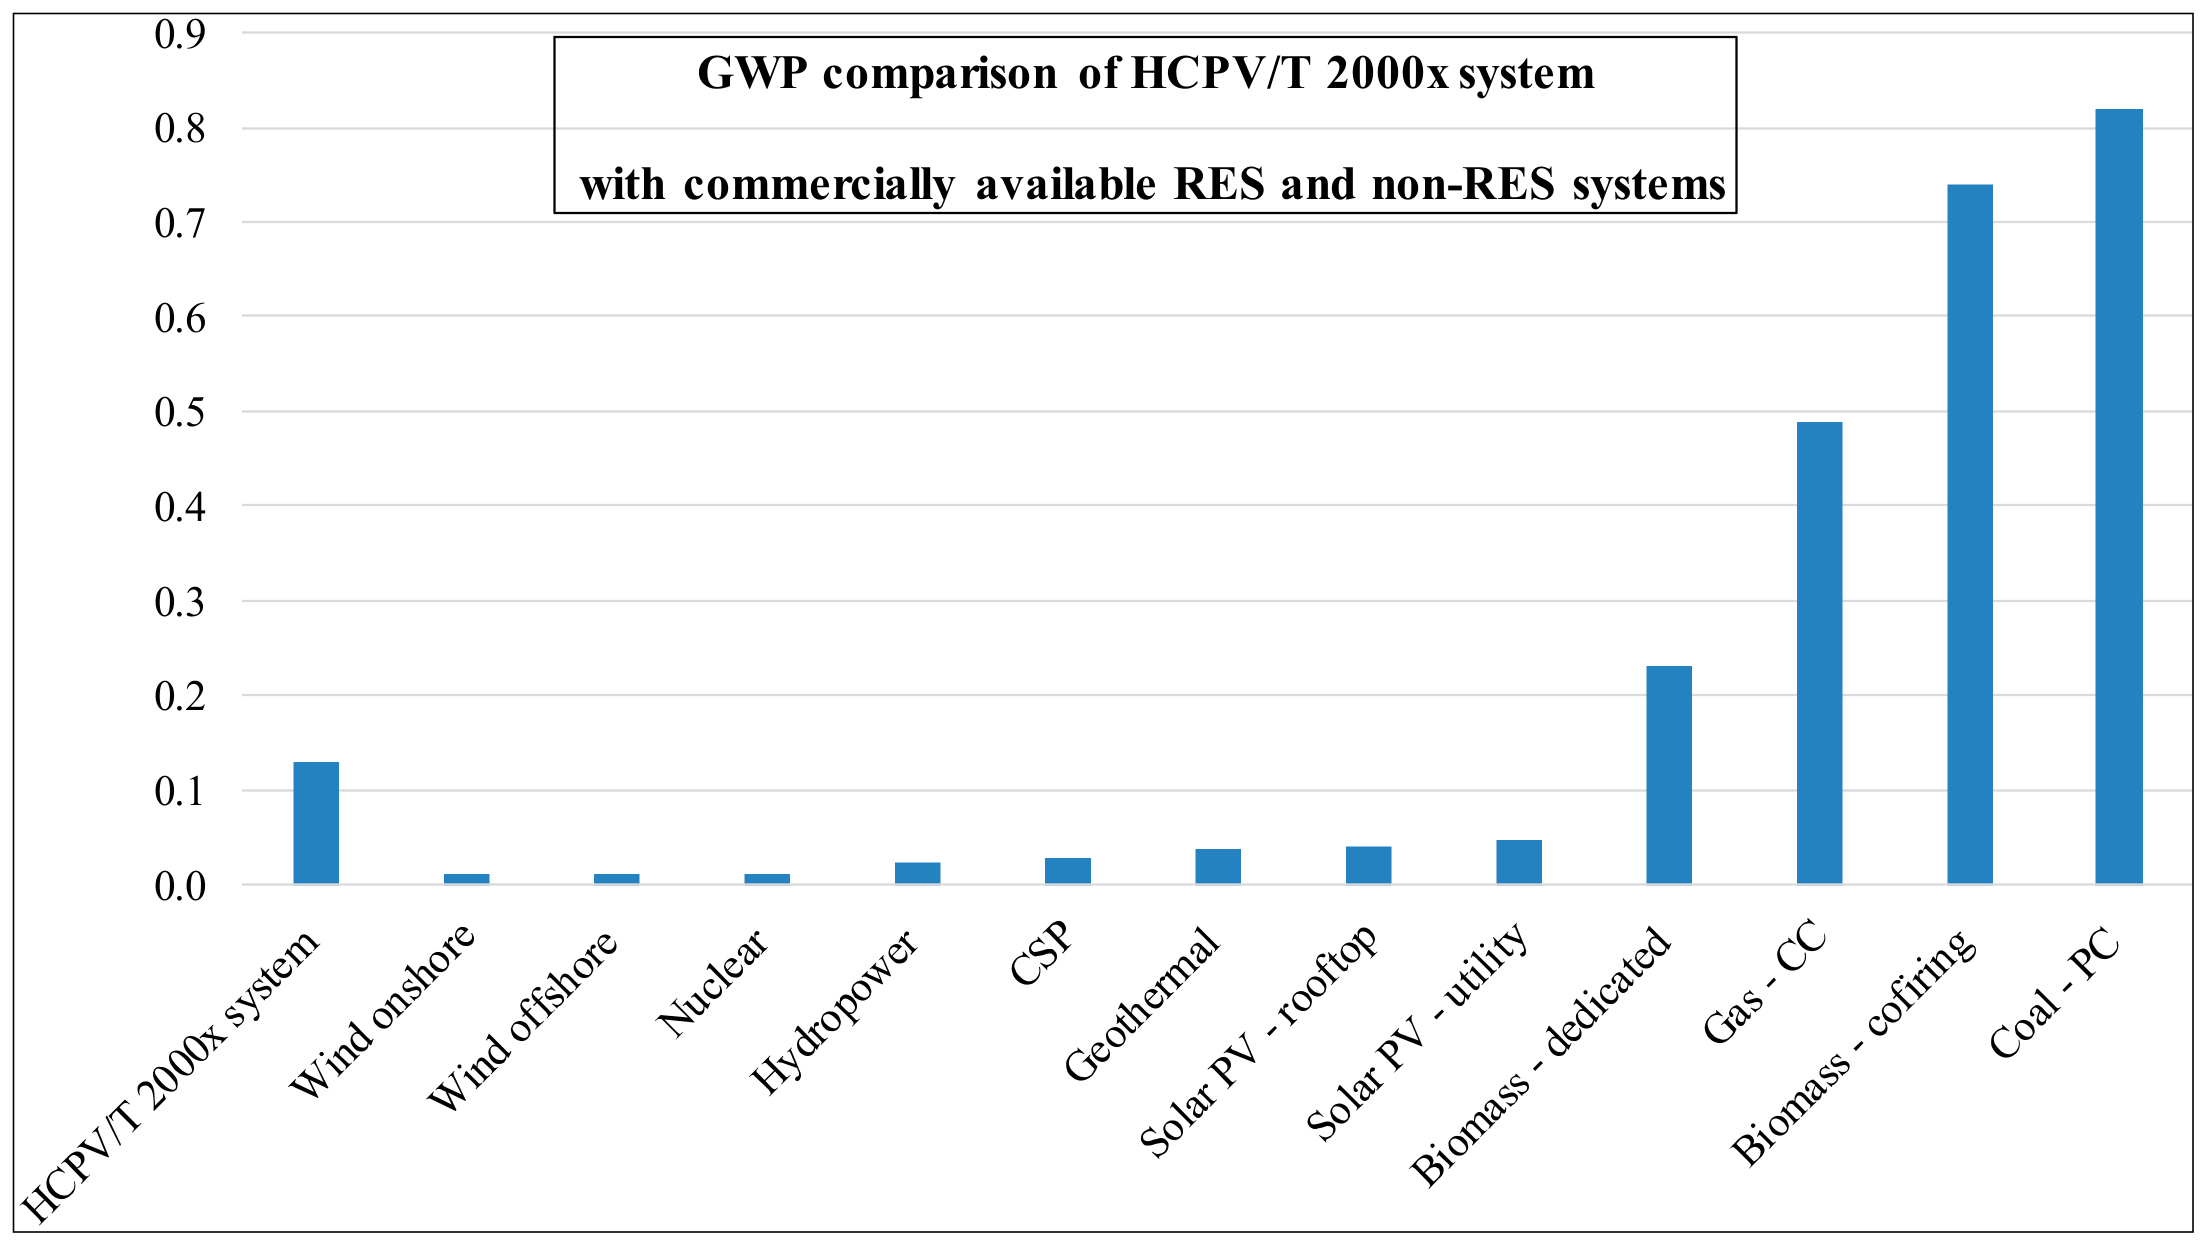
Figure 9 presents the system boundary GWP for EEIA compared with commercially available RES and non-RES systems based on the global average of lifecycle GWP. The RES technologies are wind offshore, solar PV—rooftop, wind onshore, CSP geothermal and solar PV—utility while the non-RES technologies are nuclear, coal power plant (pulverized plant), gas power plant (combined cycle), biomass power plant (co-firing), biomass power plant and hydropower. The GWP of the RES systems is 63–92% lower than the HCPV/T 2000x system. The GWP of the non-RES technologies (except for nuclear) is 77%–532% higher than the HCPV/T 2000x system while the GWP of the nuclear is 91% lower. The main reason for the higher GWP of the non-RES systems is probably as a result of fossil fuel combustion [53] while for the RES systems, it is as a result of the higher primary energy demand required during raw materials acquisition/production and manufacturing of the thermal energy and tracking systems [15,52].
Summary of comparison.
The system boundary (including the operation and maintenance subsystem boundary) environmental impacts (including GWP) of the HCPV/T 2000x system is lower than lifecycle environmental impacts of the non-RES systems (including fuel-based CHP systems). This is mainly due to the fuel (natural gas and diesel) combustion/consumption by the CHP system. However, comparison with RES systems shows higher environmental impacts in most categories. In many cases there are explanations why and need to be looked at system by system.
As an example, the system boundary GWP of HCPV/T 2000x system for EEIA (estimated at 130 g CO2-eq/kWh) was compared with the literature findings. The estimated GWP for HCPV systems was found to be no more than 50 g CO2-eq/kWh [8]. It should be noted that those literature case studies did not include a reverse return system, which is the most significant contributor to the thermal energy system of the HCPV/T 2000x system. As mentioned in Table 1, the reverse return system consists of several components that include active heat sink, and pipes with supply and return connection to the demineralized water storage tank. The demineralized water storage tank is the main contributor to the reverse return system due to the raw materials acquisition/production and manufacturing of the demineralized water storage tank; that are mostly accounted for by metalworking (mainly hot steel alloy rolling), welding and glass wool manufacturing process. The discontinuation of the GWP by the reverse return system (82 g CO2-eq/kWh) leads to the reduced GWP of 48 g CO2-eq/kWh which is similar to CPV/HCPV systems [8].

4.3. Energy and Environmental Impact Performance Gap

One of the problems with commercial grade silicon PV cell is the reduction in efficiency as the cell temperature increases due to the lack of effective cooling of the cells in order to maintain its optimum operating temperature. The temperature coefficient is used to quantify the degree to which the cell temperature influences its efficiency. The review by Dubey et al. [56], estimated the average temperature coefficient of the commercial-grade silicon PV cell to be ~0.45%/°C. The issue of the relatively high temperature coefficient can be overcome by using MJSC with relatively low temperature coefficient. For instance, the temperature coefficient of InGaP/InGaAs/Ge solar cell is 0.04%/°C [57]. However, high concentration ratio increases solar radiation flux density required by the MJSC, which has an influence on the MJSC efficiency. The study by Chen et al. [19], shows an initial increase in electrical and thermal efficiency at low concentration ratio but decreases and increases respectively, at high concentration ratio. Therefore, HCPV/T systems that receive high solar radiation flux requires cooling technology in order to minimize the reduction in electrical efficiency. In this study, the HCPV/T 2000x system has an active cooling system (which consists of active heat sink and reverse return system) that simultaneously cools the InGaP/InGaAs/Ge solar cell, extracts thermal energy and produce electrical energy. As a result, the overall efficiency of the HCPV/T 2000x system is ~80%. The extraction of thermal energy replaces the need for traditional system such as a boiler [10]. In addition to the high efficiency of the HCPV/T 2000x system, the combined lifecycle environmental impact for EEIA and TEIA is lower than fuel-based CHP, traditional non-RES, and potentially lower than RES if the defined thermal energy functionality unit of 1 kWh is met by fuel-based CHP and/or traditional non-RES.
The theoretical study of an HCPV/T system by Renno and Petito [58], showed that the system can be used to satisfy electric, heating and cooling demand for domestic application in the south of Italy. In Italy, the typical annual household electricity and hot water demand in 2016 were ~2000 kWh/household/year each [21,22]. Therefore, the operational HCPV/T 2000x system located in Palermo, Sicily (south of Italy) can be applied as a stand-alone system used to satisfy almost 80% of electricity for a typical residential house as well as 100% of hot water demand. The application of the HCPV/T 2000x system as a stand-alone system instead of grid-connected eliminates the infrastructural challenges of grid connection (including its associated environmental impacts) and replaces the need for traditional system non-RES [58].
The limitation of using HCPV/T systems in regions of high DNI can be mitigated by adopting the prospect highlighted by Islam et al. [6], which is the electricity generation and exportation from desert regions of the MENA to Europe. Therefore, HCPV/T 2000x system can be potentially centralized at a large scale in the regions of MENA, Mediterranean and the Sun Belt, in order to supply electricity to neighboring regions with low DNI. The environmental impact associated with the power transmission from those regions can be potentially mitigated by displacing traditional non-RES systems.
5. Conclusions

The use of LCA to estimate lifecycle environmental impact category indicators of the HCPV/T 2000x system shows that the “production: thermal energy system”, “production: tracking system”, “operation and maintenance” subsystem boundaries are the main hotspots responsible for most environmental impacts at both midpoint (with 50%, 29% and 13% contribution respectively) and endpoint (with 55%, 32% and 7% contribution respectively) categories. The contribution to the environmental impacts are mostly due to the raw materials acquisition/production and manufacturing of the thermal energy and tracking systems.
The findings of this study were compared with some results reported in the literature. It was found that the estimated GWP of HCPV/T 2000x system for EEIA was below the threshold of 50 g CO2-eq/kWh [8]. Also, it was found that the lifecycle environmental impacts (including GWP) of the HCPV/T 2000x system are lower than non-RES (including CHP) systems. Although the lifecycle environmental impact for EEIA of the HCPV/T 2000x system is higher than RES systems, the combined lifecycle environmental impact for EEIA and TEIA is potentially lower if the defined thermal energy functional unit of 1 kWh is met by CHP or non-RES system.
The potential for further research is the improvement of HCPV/T 2000x system environmental impacts via detailed waste management LCA at the raw materials acquisition/production and manufacturing lifecycle stage and end of life, in order to recover materials used for the production of thermal energy and tracking systems.

Author Contributions

Conceptualization, E.S., M.K. and V.S.; methodology, E.S. and V.S.; formal analysis, E.S.; investigation, E.S., M.K. and V.S.; data curation, E.S.; writing—original draft preparation E.S.; writing—review and editing, M.K. and V.S.; funding acquisition, M.K.

Funding

This work is supported by SMART GEMS (H2020-MSCA-RISE-2014 (GA No 645677)) and EPSRC DTP of Brunel University London.

Acknowledgments

Thanks are due to IDEA SRL, Palermo for providing access to the system and data.

Conflicts of Interest

The authors declare no conflict of interest.

Nomenclature

Abbreviation WB-CHPWood Biomass-Combined Heat and Power
HCPV/THigh Concentrator Photovoltaic ThermalAD-CHP-ORCAnaerobic Digestion-Combined Heat and Power-Organic Rankine Cycle
DNIDirect Normal Irradiance (W/m2)NOxNitrogen oxides
LCALife Cycle AssessmentPMParticulate Matter
CHPCombined Heat and Power CH4Methane
non-RESnon-Renewable Energy SourcesNO2Nitrogen dioxides
RESRenewable Energy SourcesSE-micro-CHPStirling Engine-micro-Combined Heat and Power
PVPhotovoltaicST-CHPSteam Turbine- Combined Heat and Power
LCPVLow Concentrator PhotovoltaicGT-HRSG-CHPGas Turbine-Heat Recovery Steam Generator- Combined Heat and Power
HCPVHigh Concentrator PhotovoltaicGT-PCC-HRSG-CHPGas Turbine-Post Combustion Carbon Capture- Combined Heat and Power
LCPV/TLow Concentrator Photovoltaic ThermalCOCarbon monoxide
HCPV/THigh Concentrator Photovoltaic ThermalVOCVolatile Organic Compounds
CSPConcentrator Solar Power
MJSCMulti-Junction Solar Cell
HTFHeat Transfer FluidMidpoint Impact categories
EPBTEnergy Payback TimeGWPGlobal Warming Potential (kg CO2-eq/kWh)
MENAMiddle East and North AfricaODPOzone Depletion Potential (kg CFC-11-eq/kWh)
CO2Carbon dioxideTAPTerrestrial Acidification Potential (kg SO2-eq/kWh)
InGaP/InGaAs/GeIndium-Gallium-Phosphide/Indium-Gallium-Arsenide/GermaniumFEPFreshwater Eutrophication Potential (kg P-eq/kWh)
MPPTMaximum Power Point TrackingMEPMarine Eutrophication Potential (kg N-eq/kWh)
AlAluminiumHTPHuman Toxicity Potential (1,4 DB-eq /kWh)
N-SNorth-SouthPOFPPhotochemical Oxidant Formation Potential (kg NMVOC-eq/kWh)
E-WEast-WestPMFPParticulate Matter Formation Potential (kg PM10-eq/kWh)
SPASolar Position AlgorithmTETPTerrestrial Ecotoxicity Potential (kg 1,4 DB-eq/kWh)
NRELNational Renewable Energy LaboratoryFETPFreshwater Ecotoxicity Potential (1,4 DB-eq /kWh)
CMOSComplementary Metal Oxide Semiconductor METPMarine Ecotoxicity Potential (kg 1,4 DB-eq/kWh)
CADComputer Aided DesignIRPIonising Radiation Potential (kBq U235-eq/kWh)
ECEuropean CommissionALOPAgricultural Land Occupation Potential (m2a/kWh)
LCILife Cycle InventoryULOPUrban Land Occupation Potential (m2a/kWh
LiLithiumNLTPNatural Land Transformation Potential (m2/kWh)
SiSilicon WDPWater Depletion Potential (m3/kWh)
EUEuropean UnionMDPMetal Depletion Potential (kg Fe-eq/kWh)
EEIAElectrical Energy Impact Allocation FDPFossil Depletion Potential (kg oil-eq/kWh)
TEIAThermal Energy Impact AllocationHHPHuman Health Potential (DALY/kWh)
OECDOrganisation for Economic Cooperation and DevelopmentEPEcosystem Potential (species.yr/kWh)
SCScenarioRPResources Potential (€/kWh)

References

  1. Wiesenfarth, M.; Philipps, S.P.; Bett, A.W.; Horowitz, K.; Kurtz, S. Current Status of Concentrator Photovoltaik Technology. Available online: https://www.ise.fraunhofer.de/content/dam/ise/de/documents/publications/studies/cpv-report-ise-nrel.pdf (accessed on 25 November 2019).
  2. Sharaf, O.Z.; Orhan, M.F. Concentrated photovoltaic thermal (CPVT) solar collector systems: Part I—Fundamentals, design considerations and current technologies. Renew. Sustain. Energy Rev. 2015, 50, 1500–1565. [Google Scholar] [CrossRef]
  3. Sharaf, O.Z.; Orhan, M.F. Concentrated photovoltaic thermal (CPVT) solar collector systems: Part II—Implemented systems, performance assessment, and future directions. Renew. Sustain. Energy Rev. 2015, 50, 1566–1633. [Google Scholar] [CrossRef]
  4. Shittu, E.; Paredes, F.; Schiavo, B.; Venezia, L.; Milone, S.; Montagnino, F.; Kolokotroni, M. Comparison of operational performance and analytical model of high concentrator photovoltaic thermal system at 2000 concentration ratio. Proc. E3S Web Conf. 2019, 111, 06007. [Google Scholar] [CrossRef] [Green Version]
  5. Viebahn, P.; Lechon, Y.; Trieb, F. The potential role of concentrated solar power (CSP) in Africa and Europe—A dynamic assessment of technology development, cost development and life cycle inventories until 2050. Energy Policy 2011, 39, 4420–4430. [Google Scholar] [CrossRef] [Green Version]
  6. Islam, M.T.; Huda, N.; Abdullah, A.B.; Saidur, R. A comprehensive review of state-of-the-art concentrating solar power (CSP) technologies: Current status and research trends. Renew. Sustain. Energy Rev. 2018, 91, 987–1018. [Google Scholar] [CrossRef]
  7. Hachicha, A.A.; Yousef, B.A.A.; Said, Z.; Rodríguez, I. A review study on the modeling of high-temperature solar thermal collector systems. Renew. Sustain. Energy Rev. 2019, 112, 280–298. [Google Scholar] [CrossRef]
  8. Lamnatou, C.; Chemisana, D. Concentrating solar systems: Life Cycle Assessment (LCA) and environmental issues. Renew. Sustain. Energy Rev. 2017, 78, 916–932. [Google Scholar] [CrossRef] [Green Version]
  9. Fthenakis, V.M.; Kim, H.C. Life cycle assessment of high-concentration photovoltaic systems. Prog. Photovolt. Res. Appl. 2013, 21, 379–388. [Google Scholar] [CrossRef]
  10. Renno, C.; Petito, F. Choice model for a modular configuration of a point-focus CPV/T system. Energy Build. 2015, 92, 55–66. [Google Scholar] [CrossRef]
  11. Lamnatou, C.; Baig, H.; Chemisana, D.; Mallick, T.K. Life cycle energy analysis and embodied carbon of a linear dielectric-based concentrating photovoltaic appropriate for building-integrated applications. Energy Build. 2015, 107, 366–375. [Google Scholar] [CrossRef]
  12. Lamnatou, C.; Baig, H.; Chemisana, D.; Mallick, T.K. Dielectric-based 3D building-integrated concentrating photovoltaic modules: An environmental life-cycle assessment. Energy Build. 2017, 138, 514–525. [Google Scholar] [CrossRef] [Green Version]
  13. Peharz, G.; Dimroth, F. Energy Payback Time of the High-concentration PV system FLATCON 1. Prog. Photovolt. Res. Appl. 2005, 13, 627–634. [Google Scholar] [CrossRef]
  14. Halasah, S.A.; Pearlmutter, D.; Feuermann, D. Field installation versus local integration of photovoltaic systems and their effect on energy evaluation metrics. Energy Policy 2013, 52, 462–471. [Google Scholar] [CrossRef]
  15. Sturm, M.; Ag, S.I.; Box, P.O.; Butturi, M.A.; Srl, C.; Traversagno, V. Environmental Sustainability of Concentrator pv Systems: Preliminary lca Results of the Apollon Project. In Proceedings of the World Conference on Photovoltaic Energy Conversion, Valencia, Spain, 6–9 September 2010. [Google Scholar]
  16. Burkhardt, J.J.; Heath, G.A.; Turchi, C.S. Life cycle assessment of a parabolic trough concentrating solar power plant and the impacts of key design alternatives. Environ. Sci. Technol. 2011, 45, 2457–2464. [Google Scholar] [CrossRef]
  17. Campbell, E. Response to embodied energy and emergy analyses of a concentrating solar power (CSP) system (2012). Energy Policy 2013, 60, 424–426. [Google Scholar] [CrossRef]
  18. Hu, E.; Yang, Y.P.; Nishimura, A.; Yilmaz, F.; Kouzani, A. Solar thermal aided power generation. Appl. Energy 2010, 87, 2881–2885. [Google Scholar] [CrossRef]
  19. Chen, H.; Ji, J.; Wang, Y.; Sun, W.; Pei, G.; Yu, Z. Thermal analysis of a high concentration photovoltaic/thermal system. Sol. Energy 2014, 107, 372–379. [Google Scholar] [CrossRef]
  20. Meteonorm, v. 7.1. In Global Meteorological Database for Engineers; Planners and 403 Education; Meteotest: Bern, Switzerland, 2017.
  21. CEER Retail Markets Monitoring Report. Available online: https://www.ceer.eu/documents/104400/-/-/56216063-66c8-0469-7aa0-9f321b196f9f (accessed on 24 April 2019).
  22. Terna Monthly Report on the Electricity System. Available online: http://www.terna.it/it-it/sistemaelettrico/statisticheeprevisioni.aspx (accessed on 24 April 2019).
  23. Ruch, R.; Ludwig, P.; Maurer, T. Balancing Hydronic Systems in Multifamily Buildings. Available online: https://www.nrel.gov/docs/fy14osti/62388.pdf (accessed on 26 November 2019).
  24. Kribus, A.; Kaftori, D.; Mittelman, G.; Hirshfeld, A.; Flitsanov, Y.; Dayan, A. A miniature concentrating photovoltaic and thermal system. Energy Convers. Manag. 2006, 47, 3582–3590. [Google Scholar] [CrossRef]
  25. Mittelman, G.; Kribus, A.; Dayan, A. Solar cooling with concentrating photovoltaic/thermal (CPVT) systems. Energy Convers. Manag. 2007, 48, 2481–2490. [Google Scholar] [CrossRef]
  26. BS EN ISO. Environmental Management—Life Cycle Assessment—Requirements and Guidelines; BSI: London, UK, 2018. [Google Scholar]
  27. BS EN ISO. Environmental Management—Life Cycle Assessment—Principles and Framework; BSI: London, UK, 2006. [Google Scholar]
  28. PRé; Goedkoop, M.; Oele, M.; Leijting, J.; Ponsioen, T.; Meijer, E. Introduction to LCA with SimaPro. Available online: https://www.pre-sustainability.com/download/SimaPro8IntroductionToLCA.pdf (accessed on 7 December 2019).
  29. Huijbregts, M.A.J.; Steinmann, Z.J.N.; Elshout, P.M.F.; Stam, G.; Verones, F.; Vieira, M.D.M.; Hollander, A.; Zijp, M.; van Zelm, R. ReCiPe 2016 v1.1 A Harmonized Life Cycle Impact Assessment Method at Midpoint and Endpoint Level Report I: Characterization. Available online: https://www.rivm.nl/en/life-cycle-assessment-lca/downloads (accessed on 19 December 2018).
  30. RIVM LCIA: The ReCiPe Model. Available online: https://www.rivm.nl/en/life-cycle-assessment-lca/recipe (accessed on 13 March 2019).
  31. Huijbregts, M.A.J.; Steinmann, Z.J.N.; Elshout, P.M.F.; Stam, G.; Verones, F.; Vieira, M.; Zijp, M.; Hollander, A.; van Zelm, R. ReCiPe2016: A harmonised life cycle impact assessment method at midpoint and endpoint level. Int. J. Life Cycle Assess. 2017, 22, 138–147. [Google Scholar] [CrossRef]
  32. PRé. SimaPro Database Manual: Methods Library; Creative Commons: San Francisco, CA, USA, 2016. [Google Scholar]
  33. European Commission Communication from the Commission to the European Parliament, the Council, the European Economic and Social Committee and the Committee of the Regions on an EU Strategy for Heating and Cooling. Available online: https://ec.europa.eu/energy/sites/ener/files/documents/1_EN_autre_document_travail_service_part1_v6_0.pdf (accessed on 29 March 2019).
  34. Steubing, B.; Wernet, G.; Reinhard, J.; Bauer, C.; Moreno-ruiz, E. The ecoinvent database version 3 (part II): analyzing LCA results and comparison to version 2. Int. J. Life Cycle Assess. 2016, 3, 1269–1281. [Google Scholar] [CrossRef] [Green Version]
  35. Sanchez, D.; Martinez, M.; Gil, E.; Rubio, F.; Pachon, J.L.; Banda, P. First Experiences of ISFOC in the Maintenance of CPV Plants; American Institute of Physics: New York, NY, USA, 2010; pp. 1970–2012. [Google Scholar]
  36. Gil, E.; Martinez, M.; de la Rubia, O. Operation and maintenance results from ISFOC CPV plants. In Proceedings of the AIP Conference Proceedings, Ottawa, ON, Canada, 1–3 May 2017; AIP: College Park, MD, USA, 2017; Volume 1881, p. 020006. [Google Scholar]
  37. Charles, R.G.; Davies, M.L.; Douglas, P.; Hallin, I.L.; Mabbett, I. Sustainable energy storage for solar home systems in rural Sub-Saharan Africa—A comparative examination of lifecycle aspects of battery technologies for circular economy, with emphasis on the South African context. Energy 2019, 166, 1207–1215. [Google Scholar] [CrossRef]
  38. Diouf, B.; Avis, C. The potential of Li-ion batteries in ECOWAS solar home systems. J. Energy Storage 2019, 22, 295–301. [Google Scholar] [CrossRef]
  39. Spirit Energy Guide to Residential Battery Storage. Available online: https://www.spiritenergy.co.uk/residential-solar-storage (accessed on 19 November 2019).
  40. Costa, F.; Fregonese, D.; Agnello, S.; Cannas, M. Stability of sol-gel silica glass for CPV and ultraviolet LED applications. Glass Technol. Eur. J. Glass Sci. Technol. Part A 2011, 52, 185–189. [Google Scholar]
  41. European Commission Review of Waste Policy and Legislation. Available online: http://ec.europa.eu/environment/waste/target_review.htm (accessed on 20 March 2019).
  42. UNEP; Graedel, T.E.; Allwood, J.; Birat, J.-P.; Reck, B.K.; Sibley, S.F.; Sonnemann, G.; Buchert, M.; Hagelüken, C. Recycling Rates of Metals—A Status Report, A Report of the Working Group on the Global Metal Flows to the International Resource Panel. Available online: https://europa.eu/capacity4dev/unep/document/recycling-rates-metals-status-report (accessed on 18 February 2019).
  43. IAI Global Aluminium Recycling: A Cornerstone of Sustainable Development. Available online: http://www.world-aluminium.org/media/filer_public/2013/01/15/fl0000181.pdf (accessed on 18 February 2019).
  44. FEVE Glass Recycling Hits 73% in the EU. Available online: https://feve.org/wp-content/uploads/2016/04/Press-Release-EU.pdf (accessed on 20 March 2019).
  45. EU Plastic Waste and Recycling in the EU: Facts and Figures. Available online: http://www.europarl.europa.eu/news/en/headlines/society/20181212STO21610/plastic-waste-and-recycling-in-the-eu-facts-and-figures (accessed on 20 March 2019).
  46. González-garcía, S.; Bacenetti, J. Exploring the production of bio-energy from wood biomass. Italian case study. Sci. Total Environ. 2019, 647, 158–168. [Google Scholar] [CrossRef] [PubMed]
  47. Bacenetti, J.; Fusi, A.; Azapagic, A. Environmental sustainability of integrating the organic Rankin cycle with anaerobic digestion and combined heat and power generation. Sci. Total Environ. 2019, 658, 684–696. [Google Scholar] [CrossRef] [Green Version]
  48. Stamford, L.; Greening, B.; Azapagic, A. Life cycle environmental and economic sustainability of Stirling engine micro-CHP systems. Energy Technol. 2018, 6, 1119–1138. [Google Scholar] [CrossRef] [Green Version]
  49. Kelly, K.A.; Mcmanus, M.C.; Hammond, G.P. An energy and carbon life cycle assessment of industrial CHP (combined heat and power) in the context of a low carbon UK. Energy 2014, 77, 812–821. [Google Scholar] [CrossRef] [Green Version]
  50. European Commission Product Environmental Footprint Pilot Guidance—Guidance for the implementation of the EU Product Environmental Footprint (PEF) during the Environmental Footprint (EF) pilot phase—Version 5.2 (p. 95). Available online: http://ec.europa.eu/environment/eussd/smgp/pdf/Guidance_products.pdf (accessed on 29 March 2019).
  51. Zampori, L.; Saouter, E.; Schau, E.; Cristobal, J.; Castellani, V.; Sala, S. Guide for Interpreting Life Cycle Assessment Result; Publications Office of the European Union: Brussels, Belgium, 2016. [Google Scholar]
  52. Nishimura, A.; Hayashi, Y.; Tanaka, K.; Hirota, M.; Kato, S.; Ito, M.; Araki, K.; Hu, E.J. Life cycle assessment and evaluation of energy payback time on high-concentration photovoltaic power generation system. Appl. Energy 2010, 87, 2797–2807. [Google Scholar] [CrossRef]
  53. Edenhofer, O.; Pichs-Madruga, R.; Sokona, Y.; Farahani, E.; Kadner, S.; Seyboth, K.; Adler, A. IPCC Climate Change 2014: Mitigation of Climate Change. Contribution of Working Group III to the Fifth Assessment Report of the Intergovernmental Panel on Climate Change; Cambridge University Press: Cambridge, UK; New York, NY, USA, 2014. [Google Scholar]
  54. Mora, M.A.M.; Vergara, C.F.P.; Delgadillo, S.A.M.; Nolasco, C.I.C. Environmental assessment of a combined heat and power plant configuration proposal with post -combustion -CO2 capture for the Mexican oil and gas industry. Clean Technol. Environ. Policy 2019, 21, 213–226. [Google Scholar] [CrossRef]
  55. Hertwich, E.G.; Gibon, T.; Bouman, E.A.; Arvesen, A.; Suh, S.; Heath, G.A.; Bergesen, J.D.; Ramirez, A.; Vega, M.I.; Shi, L. Integrated life-cycle assessment of electricity-supply scenarios confirms global environmental benefit of low-carbon technologies. Proc. Natl. Acad. Sci. USA 2015, 112, 6277–6282. [Google Scholar] [CrossRef] [PubMed] [Green Version]
  56. Dubey, S.; Sarvaiya, J.N.; Seshadri, B. Temperature dependent photovoltaic (PV) efficiency and its effect on PV production in the world—A review. Energy Procedia 2013, 33, 311–321. [Google Scholar] [CrossRef] [Green Version]
  57. Renno, C.; Petito, F. Experimental and theoretical model of a concentrating photovoltaic and thermal system. Energy Convers. Manag. 2016, 126, 516–525. [Google Scholar] [CrossRef]
  58. Renno, C.; Petito, F. Design and modeling of a concentrating photovoltaic thermal (CPV/T) system for a domestic application. Energy Build. 2013, 62, 392–402. [Google Scholar] [CrossRef]
Figure 1. Typical monthly average global horizontal, direct normal, diffuse horizontal radiations and air temperature (from Meteonorm weather file) in Palermo, Sicily, Italy.
Sustainability 11 07213 g001
Figure 2. Pictorial description of the operating HCPV/T 2000x system; 1–4 are the HCPV/T 2000x system modules (number 2 was the experimentally study module), (a)—reflective mirror, (b)—BK7 frustum optical receiver (integrated with InGaP/InGaAs/Ge solar cell), (c)—2 inlet pipes (it leads to 1 outlet pipe), (d)—2 YF-SF01 volumetric flowmeter, (e)—flow separation point with PT100 platinum thermometer sensor and pipe that leads to the 2 inlet pipes, (f)—close loop pipe, (g)—structural foot support, (h)—demineralized water storage and (i)—2 pressure sensors (1 before and after the Priux master 25–90 circulating pump) [4].
Sustainability 11 07213 g002
Figure 3. HCPV/T 2000x system Computer Aided Design (CAD) model; 11 m2 footprint in area.
Sustainability 11 07213 g003
Figure 4. Electrical and thermal system schematic of the HCPV/T 2000x system.
Sustainability 11 07213 g004
Figure 5. Electrical and thermal power production (upper) and efficiencies (lower) of the HCPV/T 2000 system calculated based on experimental data.
Sustainability 11 07213 g005
Figure 6. The LCA system boundary for HCPV/T 2000x system.
Sustainability 11 07213 g006
Figure 7. Endpoint system boundary EEIA and TEIA of the HCPV 2000x system. The units of the endpoint impacts are; HHP (DALY/kWh), EP (species.yr/kWh) and RP ($/kWh).
Sustainability 11 07213 g007
Figure 8. Midpoint EEIA and TEIA percentage contribution by the subsystem boundaries of the HCPV/T 2000x system.
Sustainability 11 07213 g008
Figure 9. System boundary GWP (kg CO2-eq/kWh) for EEIA comparison with commercially available RES and non-RES systems; based on the global average of lifecycle GWP [53]. The abbreviations CC and PC means Combined Cycles and Pulverized Coal respectively.
Sustainability 11 07213 g009
Table 1. Foreground inventory data for the electrical energy system, thermal energy system and tracking system.
Component (No of Components)ValueMaterial
Thermal energy system
Heat sink (x20)
Top, bottom and side covers1.72 kgAluminium alloy
Internal supporting structure0.17 kgAluminium alloy
Countersunk fasteners (x80)0.0040 kgSteel
Internal and external rings (x40)0.0062 kgSynthetic rubber
G1-8 I-FESTO and G1-8 L-FESTO connectors (x40)0.1700 kgSteel
Reverse return system (1)
12.7 mm and 38.1 mm cylindrical pipes, and 3.2 mm square pipe8.83 kgSteel
6 mm pipe81.65 kgPerfluoroalkoxy (vinyl ether) (PFA)
22 mm corrugated hose0.6243 kgPolyvinyl chloride (PVC)
Circulating pump (x1)5.30 kgVarious: mainly iron, steel and copper
0.2 m3 demineralized water storage tank (x1)86 kgVarious: mainly steel and glass wool
Aignep 1120 fitting (x46)0.8200 kgNickel-plated brass
PT100 platinum thermometer sensor (x4)0.2500 kgVarious; mainly steel and wiring components (Polytetrafluoroethylene (PTFE) insulated screened lead)
0.2 m3 demineralized water (x1)200 kgDemineralized water
Tracking energy system
Axle
Rotational longitudinal axle (2)42.76 kgIron-base superalloy
Upper (x10) and lower (x10) tilting transverse axles15.20 kgIron-base superalloy
Internal (x2) and external (x2) longitudinal transmission rods 24.17 kgIron-base superalloy
Longitudinal transmission rod connector (1)1.68 kgIron-base superalloy
CMOS webcam0.0590 kgVarious (including glass filter)
Electronic and software connections Various
Reflective mirror and optical receiver
Optical receiver (20)0.38 kgBK7 frustum
Reflective mirror (20)23.30 kgUltraclean glass with a silver coating
Rotational and linear motor
Rotational motor0.1600 kgVarious (including steel)
Linear motor0.1500 kgVarious (including steel)
Gearbox1.4400 kgVarious (including steel)
AN8 magnet0.0051 kgVarious (including iron)
Structural support
Axle support17.41 kgIron-base superalloy, nylon and steel
Central, north and south side foot supports122.95 kgIron-base superalloy and steel
CMOS webcam support0.54 kgIron-base superalloy and steel
Electronic connection support11.23 kgIron-base superalloy and steel
Reflective mirror and optical receiver support129.96 kgIron-base superalloy, nylon and steel
Rotational and linear motor support0.7974 kgIron-base superalloy
Electrical energy system
InGaP/InGaAs/Ge solar cell (x20)
Area of one InGaP/InGaAs/Ge solar cell107.90 mm2
Mass of one InGaP/InGaAs/Ge solar cell7.80 × 10−3 kg
Inverter (x1)
Electrical capacity1 kW
Mass2.30 kg
1 Li-ion battery (x1) − 26 kg
Table 2. Transportation modes and distances in the supply of all HCPV/T 2000x system components.
ComponentsValueTransport Mode
InGaP/InGaAs/Ge solar cells325 kmLorry (3.5–7.5 t)
16433 kmTransoceanic ship
The rest of the system components100 kmLorry (3.5–7.5 t)
963 kmTransoceanic ship
Table 3. Operational and maintenance of the HCPV/T 2000x system for a service life of 25 years.
ComponentsValueAssumption
InGaP/InGaAs/Ge solar cells0.0096 kgReplacement of one cell per year caused failure or damaged due to the high CR (=2000) from the reflective mirror
Demineralized water5000 kgAssuming 200 kg of water is used for cleaning the reflective mirror, and for refilling the thermal storage tank
Optical receiver0.38 kgReplacement of all the optical receiver halfway through the service life [40]
Reflective mirror23.3 kgReplacement of all the reflective mirror halfway through the service life
Structural support125 kgAssuming 5 kg of lithium grease is used to grease structural components
Li-ion battery26 kgThe battery is assumed to function for the 25 years of system’s life equipped by a management system to minimise cycles and depth of discharge.
Table 4. Waste management of HCPV/T 2000x system. Due to lack of data, waste treatment of InGaP/InGaAs/Ge solar cell was not assessed.
Components/Material TypeValue
Ferrous metal; waste management
Recycling80% [42]
Landfilling20%
Non-ferrous metal; waste management
Recycling90% [43]
Landfilling10%
Glass; waste management
Recycling73% [44]
Landfilling27%
Plastic, PFA and synthetic rubber; waste management
Recycling30% [45]
Landfilling70%
Li-ion battery, inverter, pump, circulating pump and demineralized water storage tank; waste management
RecyclingThese components were made of different types of material. However, recycling/landfilling was assessed based on main material type and Ecoinvent database.
Landfilling
Table 5. Midpoint system boundary environmental EEIA and/or TEIA comparison with the cradle to grave of the WB-CHP [46] and AD-CHP-ORC [47] systems in Italy and SE-micro-CHP [48] and industrial CHP [49] systems conducted in UK.
Midpoint Impact IndicatorHCPV/T 2000x SystemWB-CHPAD-CHP-ORCSE-Micro-CHPIndustrial CHP
EEIATEIAEEIAEEIAEEIATEIAEEIA
GWP (kg CO2-eq/kWh)1.30E-018.19E-021.41E-012.02E-013.66E-012.32E-011.93E-01
ODP (kg CFC-11-eq/kWh)3.04E-081.92E-08 1.31E-08
TAP (kg SO2-eq/kWh)3.32E-032.09E-033.64E-034.91E-033.44E-04−1.59E-04
FEP (kg P-eq/kWh)1.13E-047.10E-051.27E-053.46E-05
MEP (kg N-eq/kWh)5.38E-053.39E-053.69E-042.33E-03
HTP (kg 1,4 DB-eq/kWh)1.78E-011.12E-014.38E-022.81E-02
POFP (kg NMVOC-eq/kWh)7.26E-044.58E-042.31E-036.70E-04
PMFP (kg PM10-eq/kWh)1.07E-036.75E-041.01E-037.90E-04
TETP (kg 1,4 DB-eq/kWh)1.08E-046.84E-05
FETP (kg 1,4 DB-eq/kWh)8.96E-035.65E-03
METP (kg 1,4 DCB-eq/kWh)8.59E-035.42E-03
IRP (kBq U235-eq/kWh)9.48E-035.98E-03
ALOP (m2a/kWh)2.59E-021.64E-02
ULOP (m2a/kWh)2.59E-031.63E-03
NLTP (m2/kWh)1.14E-047.19E-05
WDP (m3/kWh)2.55E-031.61E-03
MDP (kg Fe-eq/kWh)2.02E-011.27E-01 1.13E-02
FDP (kg oil-eq/kWh)2.89E-021.82E-023.34E-023.76E-02
Table 6. Midpoint operation and maintenance subsystem boundary environmental EEIA and TEIA with operational lifecycle stage of the ST-CHP, GT-HRSG-CHP and GT-PCC-HRSG-CHP systems case studies conducted in Mexico [54].
Midpoint Impact IndicatorHCPV/T 2000x SystemST-CHPGT-HRSG-CHPGT-PCC-HRSG-CHP
EEIATEIAEEIATEIAEEIATEIAEEIATEIA
GWP (kg CO2-eq/kWh)8.27E-035.22E-031.09E-015.17E-018.03E-023.80E-015.95E-033.07E-02
ODP (kg CFC-11-eq/kWh)5.50E-103.47E-10
TAP (kg SO2-eq/kWh)3.81E-052.40E-059.74E-044.61E-036.30E-042.98E-032.55E-041.32E-03
FEP (kg P-eq/kWh)3.51E-062.21E-06 7.09E-063.65E-05
MEP (kg N-eq/kWh)1.88E-051.19E-058.73E-064.13E-055.24E-062.48E-054.25E-062.19E-05
HTP (kg 1,4 DB-eq/kWh)2.61E-031.65E-031.17E-045.53E-045.24E-052.48E-045.37E-032.77E-02
POFP (kg NMVOC-eq/kWh)2.49E-051.57E-055.17E-042.44E-033.35E-041.58E-033.54E-051.83E-04
PMFP (kg PM10-eq/kWh)1.75E-051.11E-052.18E-041.03E-031.41E-046.68E-045.67E-052.92E-04
TETP (kg 1,4 DB-eq/kWh)8.32E-055.25E-05 1.75E-068.25E-065.67E-062.92E-05
FETP (kg 1,4 DB-eq/kWh)1.09E-046.87E-051.57E-057.43E-05 3.83E-041.97E-03
METP (kg 1,4 DCB-eq/kWh)9.11E-055.75E-051.40E-056.60E-05 1.13E-045.84E-04
IRP (kBq U235-eq/kWh)4.60E-042.90E-044.54E-052.15E-04 7.09E-053.65E-04
ALOP (m2a/kWh)3.02E-031.90E-03
ULOP (m2a/kWh)2.02E-041.27E-04 1.42E-057.31E-05
NLTP (m2/kWh)6.33E-053.99E-05
WDP (m3/kWh)4.67E-042.94E-041.89E-048.91E-047.16E-053.38E-041.70E-048.77E-04
MDP (kg Fe-eq/kWh)4.70E-042.96E-048.73E-064.13E-05 9.92E-055.11E-04
FDP (kg oil-eq/kWh)1.45E-039.12E-042.82E-021.33E-011.82E-028.61E-021.18E-026.09E-02
Table 7. Midpoint system boundary environmental EEIA comparison with lifecycle environmental impacts of RES and non-RES systems [55].
Midpoint Impact IndicatorHCPV/T 2000x SystemPVCSPHydropowerWindCoalNatural Gas
GWP (kg CO2-eq/kWh)1.30E-012.25E-022.79E-024.22E-021.11E-025.27E-013.87E-01
TAP (kg SO2-eq/kWh)3.32E-031.40E-041.39E-042.39E-047.23E-051.08E-034.23E-03
FEP (kg P-eq/kWh)1.13E-041.84E-059.04E-062.06E-068.32E-065.30E-047.75E-06
HTP (kg 1,4 DB-eq/kWh)1.78E-012.84E-029.21E-034.32E-031.70E-021.18E-011.00E-01
POFP (kg NMVOC-eq/kWh)7.26E-047.99E-051.14E-044.16E-046.17E-058.21E-046.93E-04
PMFP (kg PM10-eq/kWh)1.07E-034.12E-054.80E-051.13E-043.96E-053.25E-048.37E-04
FDP (kg oil-eq/kWh)2.89E-021.44E-021.17E-022.44E-031.16E-029.60E-043.89E-04