Article

Decomposition Analysis of Factors that Drive the Changes of Major Air Pollutant Emissions in China at a Multi-Regional Level

1
Management School, China University of Mining and Technology, Xuzhou 221116, China
2
School of Computer Science and Technology, Shandong Technology and Business University, Yantai 264005, China
3
State Key Joint Laboratory of Environmental Simulation and Pollution Control, School of Environment, Tsinghua University, Beijing 100084, China
*
Author to whom correspondence should be addressed.
Sustainability 2019, 11(24), 7113; https://doi.org/10.3390/su11247113
Submission received: 8 October 2019 / Revised: 4 December 2019 / Accepted: 5 December 2019 / Published: 12 December 2019

Abstract

:
The regional emission reduction determines the national emission reduction for one country, and the differences in regional economic characteristics may result in regional differences in air pollutant emissions (APEs). In this regard, this study constructs a regional contribution index of different factors through an extended LMDI (Logarithmic Mean Divisia Index) method and investigates regional differences in factors driving the changes of China’s major APEs (SO2, NOx, and PM2.5). It reveals that the regional emission efficiency effect was a key inhibitory factor on APEs, which was more obvious in the eastern and northern regions. The regional energy intensity had greater inhibitory effects on SO2 and NOx than on PM2.5, and these inhibitory effects were more obvious in the eastern region. The regional population structure promoted APEs for northern, southern, northeastern, and eastern regions, and inhibited APEs for central, southwestern, and northwestern regions. The regional relative income had a slight effect, which curbed APEs for northern, eastern, southern, and northern regions. The national economic growth effect was the key factor in promoting APEs, which was obvious in eastern and northern regions, followed by southern, central, and southwestern regions. Policy implications are put forward based on empirical results.

1. Introduction

China’s economic development has led to huge energy consumption and great pressures on the environment. As for the air quality in China, the China Environmental Bulletin said that only 99 cities met air quality standards in 2017, there are 2311 heavy-pollution and 802 serious-pollution days among prefecture-level cities, and the number of days with PM2.5 as primary pollutants accounts for about 74.2% [1]. Severe air pollution does harm to human health and causes serious economic losses [2]. For instance, the severe haze in January 2013 caused economic losses of about 2.538 million US dollars in Beijing, accounting for 0.08% of its gross domestic product (GDP) in the same year [3]; increases in PM2.5 concentration by 5 micrograms per cubic meter may result in decreases in GDP per capita by about 2500 Renminbi (RMB) [4]; China’s economic losses caused by PM2.5 in 2016 amounted to 101 billion US dollars, accounting for 0.91% of its GDP in the same year [5]. China issued the pollution reduction target for the 13th Five-Year Plan (FYP) (2016–2020) that by 2020 the energy consumption per 10,000 RMB GDP would be cut by 15% in comparison to 2015, and SO2 and NOx would be within 15.8 and 15.74 million tons, respectively, which are both 15% lower than the level of 2015. There are regional differences in APEs for China because of its serious imbalances in economic development. As for the air pollutant reduction, the national reduction target should be reasonably allocated to each province and municipality as a regional target, to smoothly realize the national emission reduction target. Therefore, it is urgent and important to study the regional differences in factors that affect APEs in China, which is conductive to offer references for designing policies according to regional differences and effectively reduce air pollutant emissions (APEs).
Many previous studies touched on the issues related to air pollutant emission trends and characteristics [6,7,8,9], and the harm to the economy and human health [10,11,12,13,14,15,16,17,18,19]. Recently, more attention has been focused on analyses of factors influencing APEs. Some studies established econometric models to discuss the relationships between APEs and macroeconomic variables [20,21,22,23] and explore the effects of these macroeconomic variables on APEs [24,25,26,27]. Some scholars analyzed sources of APEs from the sectoral perspective and found that the power and transport sectors were the main sources [28,29,30], followed by the agriculture and household sectors [31,32]. The decomposition method has been widely used to decompose factors influencing energy use or emissions into some effects in recent times. The structural decomposition analysis (SDA) method decomposes influencing factors into direct and indirect effects mainly based on input-output data, so this method is conducive to examine more effects. Compared with the SDA, the Logarithmic Mean Divisia Index (LMDI) does not produce residual terms, which is better for time series analysis. The current literature applying the LMDI to investigate the effects on carbon emissions found that the economic structure, energy structure, industrial structure, income, population size, and renewable energy production capacity had impacts on carbon emission changes [33,34,35,36,37,38]. In analyses of APEs, some studies decomposed SO2 emissions using this method. For example, Wu and Zeng (2013) decomposed SO2 emission intensity and found that the industrial and energy structure adjustment effectively reduced SO2 emissions in the Shijingshan District, Beijing, China [39]. Yang et al. used this method and pointed out that energy consumption contributed to SO2 emissions, whereas advanced treatment technologies curbed the emissions, and the energy mix had a small effect [40]. Wang et al. (2016) analyzed the factors for SO2 in Jiangsu Province, China, and suggested that the end-of-pipe treatment inhibited, but the energy intensity promoted SO2 emissions [41]. He et al. (2016) decomposed SO2 emissions into the population, scale, structure, technology, and governance factors, and the results showed that scale factors were the main promoting effects on SO2 emissions, whereas technology and governance factors curbed the emissions [42]. Lyu et al. (2016) explored the contributions of effects to PM2.5, NOx, and SO2 from 1997 to 2012, and suggested the economic growth and energy intensity were the key promoting factors, and the emission efficiency, production structure, and population growth had small effects [43]. Zhang et al. (2019) analyzed influencing factors for PM2.5 concentration in China, and suggested that emission intensity and energy intensity reduced, but economic output and population promoted PM2.5 concentration [44].
The characteristics of previous studies can be summed up in the following three aspects. First, input-output data were used to analyze the APEs for different sectors [45,46], and econometric models were used to explore the influencing factors [47,48]. As econometric methods have some statistical errors in these analyses, the results may not be accurate. Second, the LMDI can be used to decompose APEs without residual terms for the time series data, which is more suitable for analyzing influencing factors, whereas this method was mostly used for decomposing energy consumption, carbon emissions or single air pollutant (SO2), and was rarely used to comparatively analyze multiple major APEs. Third, the current studies have concentrated on factors affecting APEs in view of a nation or single region, but few articles have touched on this issue in view of multi regions to reveal the regional differences in effects on multiple major APEs, such as SO2, NOx, and PM2.5. In this case, considering that the regional emission reduction determines the national emission reduction for one country, and the differences in regional economic characteristics may result in regional differences in APEs, this study extends the LMDI method from the multi-regional perspective to examine the regional differences in influencing factors on SO2, NOx, and PM2.5 in China during 2005–2015. The contributions for this work are as follows. First, the LMDI method is introduced into the regional decomposition to construct a contribution index for different factors that drive the changes of major APEs in different regions. Second, this study reveals the reasons for the regional differences in factors promoting or curbing APEs through a comparative analysis of these factors. In this regard, this work can provide some insights for formulating different regional emission reduction policies.
The following sections for this article are organized as follows: Section 2 introduces the method and data source, Section 3 provides empirical results, Section 4 discusses the main findings, and Section 5 concludes this study and gives relative policy suggestions.

2. Method and Data

Compared with the econometric analysis, the LMDI does not produce residual terms, so this method is used for the analysis of factors that drive the changes of major air pollutant emissions. The LMDI method can be used for either multiplicative or additive decompositions, where the multiplicative form decomposes the ratio change of emissions whereas the additive form decomposes the number of emission changes. The multiplicative and additive LMDI methods can be found in the research by Ang [49]. As for the analysis of influencing factors, the same conclusion can be drawn even though the results of the two decomposition forms are different. In this study, we used the additive LMDI method because it is easy to examine the number of APE changes influenced by each factor. The LMDI method was usually applied to decompose the factors with respect to different energy types and sectors [50,51,52], but rarely for different regions. As for different regions, APEs can be expressed as Equation (1):
A P = i ( A P i / E i ) ( E i / G i ) ( G i / P i ) ( P / G ) ( P i / P ) G = A P I i E I i R I i N I 1 P I i G
The definition for each variable is shown in Table 1.
Thus, APEs can be decomposed into the effects as follows, applying the additive LMDI method.
Regional emission efficiency effect:
Δ A P I i = L ( A P t , A P 0 ) ( ln A P I i t ln A P I i 0 )  
Regional energy intensity effect:
Δ E I i = L ( A P t , A P 0 ) ( ln E I i t ln E I i 0 )
Regional income effect:
Δ R I i = L ( A P t , A P 0 ) ( ln R I i t ln R I i 0 )
National income effect:
Δ N I = L ( A P t , A P 0 ) ( ln N I t ln N I 0 )
Regional population structure effect:
Δ P I i = L ( A P t , A P 0 ) ( ln P I i t ln P I i 0 )
National economic growth effect:
Δ Y = L ( A P t , A P 0 ) ( ln G t ln G 0 )
For the function “ L ( A P t , A P 0 ) ” in Equations (2)–(7), it is defined as
L ( A P t , A P 0 ) = { ( A P i t A P i 0 ) / ( ln A P i t ln A P i 0 ) , A P i t A P i 0 A P i t , A P i t = A P i 0 0 , A P i t = A P i 0 = 0
where, superscripts 0 and t are the base and target periods, respectively. The subscript i represents the region. In this study, the economic significances for regional emission efficiency effect, regional energy intensity effect, regional income effect, national income effect, regional population structure effect, and national economic growth effect relatively reflect the variations of APEs led by the changes of regional APEs per unit fossil energy use, regional fossil energy use per unit GDP, regional per capita GDP, national per capita GDP, regional population proportion, and national GDP. The total effects can be given as
Δ A P = A P t A P 0 = i [ Δ A P I i + Δ E I i + Δ P I i + ( Δ R I i Δ N I ) + Δ G ] .
The assumption is that Δ S I = Δ R I Δ N I and Δ S I reflects the comprehensive effect of regional income and national income, which is defined as “regional relative income effect.” Thus, Equation (9) can be rewritten as
Δ A P = A P t A P 0 = i ( Δ A P I i + Δ E I i + Δ P I i + Δ S I i + Δ G ) .
The contribution of total effects (CR) is
C R = i ( Δ A P I i | Δ A P | + Δ E I i | Δ A P | + Δ P I i | Δ A P | + Δ S I i | Δ A P | + Δ G | Δ A P | ) × 100 % = { 100 % , Δ A P > 0 100 % , Δ A P < 0
Thus, the contributions of different effects are described as follows.
Contribution of regional emission efficiency effect:
C R A P I = Δ A P I i / | Δ A P | × 100 % .
Contribution of regional energy intensity effect:
C R E I = Δ E I i / | Δ A P | × 100 % .
Contribution of regional population structure effect:
C R P I = Δ P I i / | Δ A P | × 100 % .
Contribution of regional relative income effect:
C R S I = Δ S I i / | Δ A P | × 100 % .
Contribution of national economic growth effect:
C R G = Δ G / | Δ A P | × 100 % .
Equations (12)–(16) indicate one effect increases (decreases) total APEs when its contribution is positive (negative) [53].
Table 2 shows the definitions for air pollutant emission efficiency, energy intensity, population structure, and relative income, and their units.
The data on provincial air pollutants (NOx, PM2.5, and SO2) in China from 2005 to 2015 were from the China environment protection database [54] and the emission inventory by Tsinghua University using an “emission factor method” [55,56]. The data on provincial fossil energy use were collected from the corresponding periods of the China Statistical Yearbook. The unit of fossil energy use was unified into 10,000 tons of coal equivalent (104 tce) according to the conversion coefficients from different units of fossil energy type to tce (2008). The provincial income per capita is denoted by the ratio of provincial GDP to the provincial population at end of the year; the national income per capita is denoted by the ratio of national GDP to the national population at end of the year. The basic data on provincial and national populations at the end of the year, as well as provincial and national GDP, were from the corresponding periods of the China Statistical Yearbook. The data on provincial and national GDP were converted into standard prices using the price index (2005 = 100). In addition, Hong Kong, Macao, Tibet, and Taiwan were not considered because of the lack of relevant data in these regions.

3. Empirical Results

Considering its geographical division, China can be divided into seven regions: the northern region (Beijing, Hebei, Inner Mongolia, Shanxi, Tianjin), eastern region (Anhui, Fujian, Jiangsu, Jiangxi, Shandong, Shanghai, Zhejiang), central region (Henan, Hubei, Hunan), southern region (Hainan, Guangdong, Guangxi), southwestern region (Chongqing, Guizhou, Sichuan, Yunnan), northwestern region (Gansu, Ningxia, Qinghai, Shaanxi, Xinjiang), and northeastern region (Heilongjiang, Jilin, Liaoning).

3.1. Holistic Analysis

As Figure 1 indicates, the regional emission efficiency and regional energy intensity effects reduced national APEs. The reducing effect on SO2 and PM2.5 in regional emission efficiency reduced and then grew, whereas this reducing effect on NOx reduced, grew, reduced, and then grew. The reducing effect on APEs in regional energy intensity grew, reduced, grew, and then reduced, on the whole, and this reducing effect on SO2 and NOx was stronger than on PM2.5. This is because SO2 and NOx emissions are mainly from the fossil fuel combustion, whereas PM2.5 has more sources; PM2.5 emissions are not only from fossil fuel combustion, but also come from the chemical production process, and some physical process (raw material crushing). The regional population structure and national economic growth effects increased national APEs. The promoting effect of national economic growth was stronger than this effect of regional population structure, and presented a weakening, strengthening, and then weakening trend. The regional relative income effect looks slight, but it has different impacts on different APEs. The regional relative income had a promoting effect on SO2 and PM2.5 during 2007–2013, and it had a reducing effect in other periods. The regional relative income had a slightly reducing effect on NOx over the whole study period. As for the total effects on APEs in different periods, the results indicate that SO2 and PM2.5 presented a downward trend on the whole, except for the period 2009–2011. This is because at the end of the 11th FYP (2006–2010) and beginning of the 12th FYP (2009–2011), the potentials of previous emission reduction policies were released, and new policies were not fully formulated. Therefore, SO2 and PM2.5 emissions rebounded. NOx emissions increased during the period 2005–2011 but rapidly decreased after 2011. This is because no clear policy for NOx emissions reduction was issued before 2011, but the explicit emission reduction targets and installation of denitrification devices for power plants and industrial boilers sharply reduced NOx emissions after 2011.

3.2. Regional Analysis

3.2.1. Regional Emission Efficiency Effect

The reducing effect of regional emission efficiency on SO2, NOx, and PM2.5 in most regions over the whole study period grew and then reduced (Table 3), which is different from the trend in the whole nation without considering regional divisions. The contribution of regional emission efficiency effect among all regions was negative during 2005–2007 and 2007–2009, which indicates that an increase in emission efficiency inhibited APEs (Figure 2a). The inhibitory regional emission efficiency effect in the eastern and northern regions was relatively greater, followed by the central, southern and southwestern regions. The statistics from China Statistical Yearbook indicate that the industrial waste-gas treatment facilities in Shandong, Jiangsu, and Zhejiang (the eastern region), and Hebei and Shanxi (the northern region) increased by 9500 during 2005–2009, and 476,000 people were engaged in research and development (R&D) in large- and medium-sized industrial enterprises in 2009. The R&D and industrial pollutant abatement investments in these enterprises accounted for 1.1% and 6.36% of corresponding regional GDP, respectively. The production technology and end-of-pipe treatment in these areas were improved, thereby effectively reducing APEs.
In the period 2009–2011, the reducing effect of regional emission efficiency on APEs reached its maximum in all regions, and the order of the degree to this reducing effect was: eastern region > northern region > southern region > central region > northwestern region > northeastern region > southwestern region (Figure 2a). The emission efficiency effect for each region inhibited PM2.5 more greatly than it inhibited SO2 and NOx during 2009–2011. This is because a series of measures for engineering reduction, structural reduction, and management reduction, and the reduction investment in this period promoted the emission efficiency. For this reason, PM2.5 decreased by 1425 kt (kilotons); SO2 decreased by 14.29% in this period compared with the level in 2005.
In the periods 2011–2013 and 2013–2015, the contribution of regional emission efficiency effect was negative, indicating the emission efficiency effect effectively curbed APEs. The curbing effect of emission efficiency in the eastern and northern regions was still greater than in other regions. This is because China’s government issued the comprehensive air pollution control plan in September 2012 (http://www.gov.cn/zwgk/2012-12/05/content_2283152.htm), and it declared that the APEs would be controlled in key areas, such as East and North China, and SO2, NOx, and industrial root and dust from Jing-Jin-Ji Area, Yangtze River Delta, and Pearl River Delta would decrease respectively by 12%, 13%, and 10% by 2015. For this reason, the industrial structures in the eastern and northern regions had been adjusted, with decreases in the proportion of industrial value added by 5.22 and 7.81%, respectively. Meanwhile, these regional governments focused on the combination of cleaner production and end-of-pipe treatment, decreased fossil energy consumption, and steadily increased the pollution abatement investment, to reduce APEs. However, the degree of the inhibitory effect of emissions efficiency weakened during this period, and the reason is that the reduction potential for this effect was released at the last stage, and this reduction potential became small in this period.

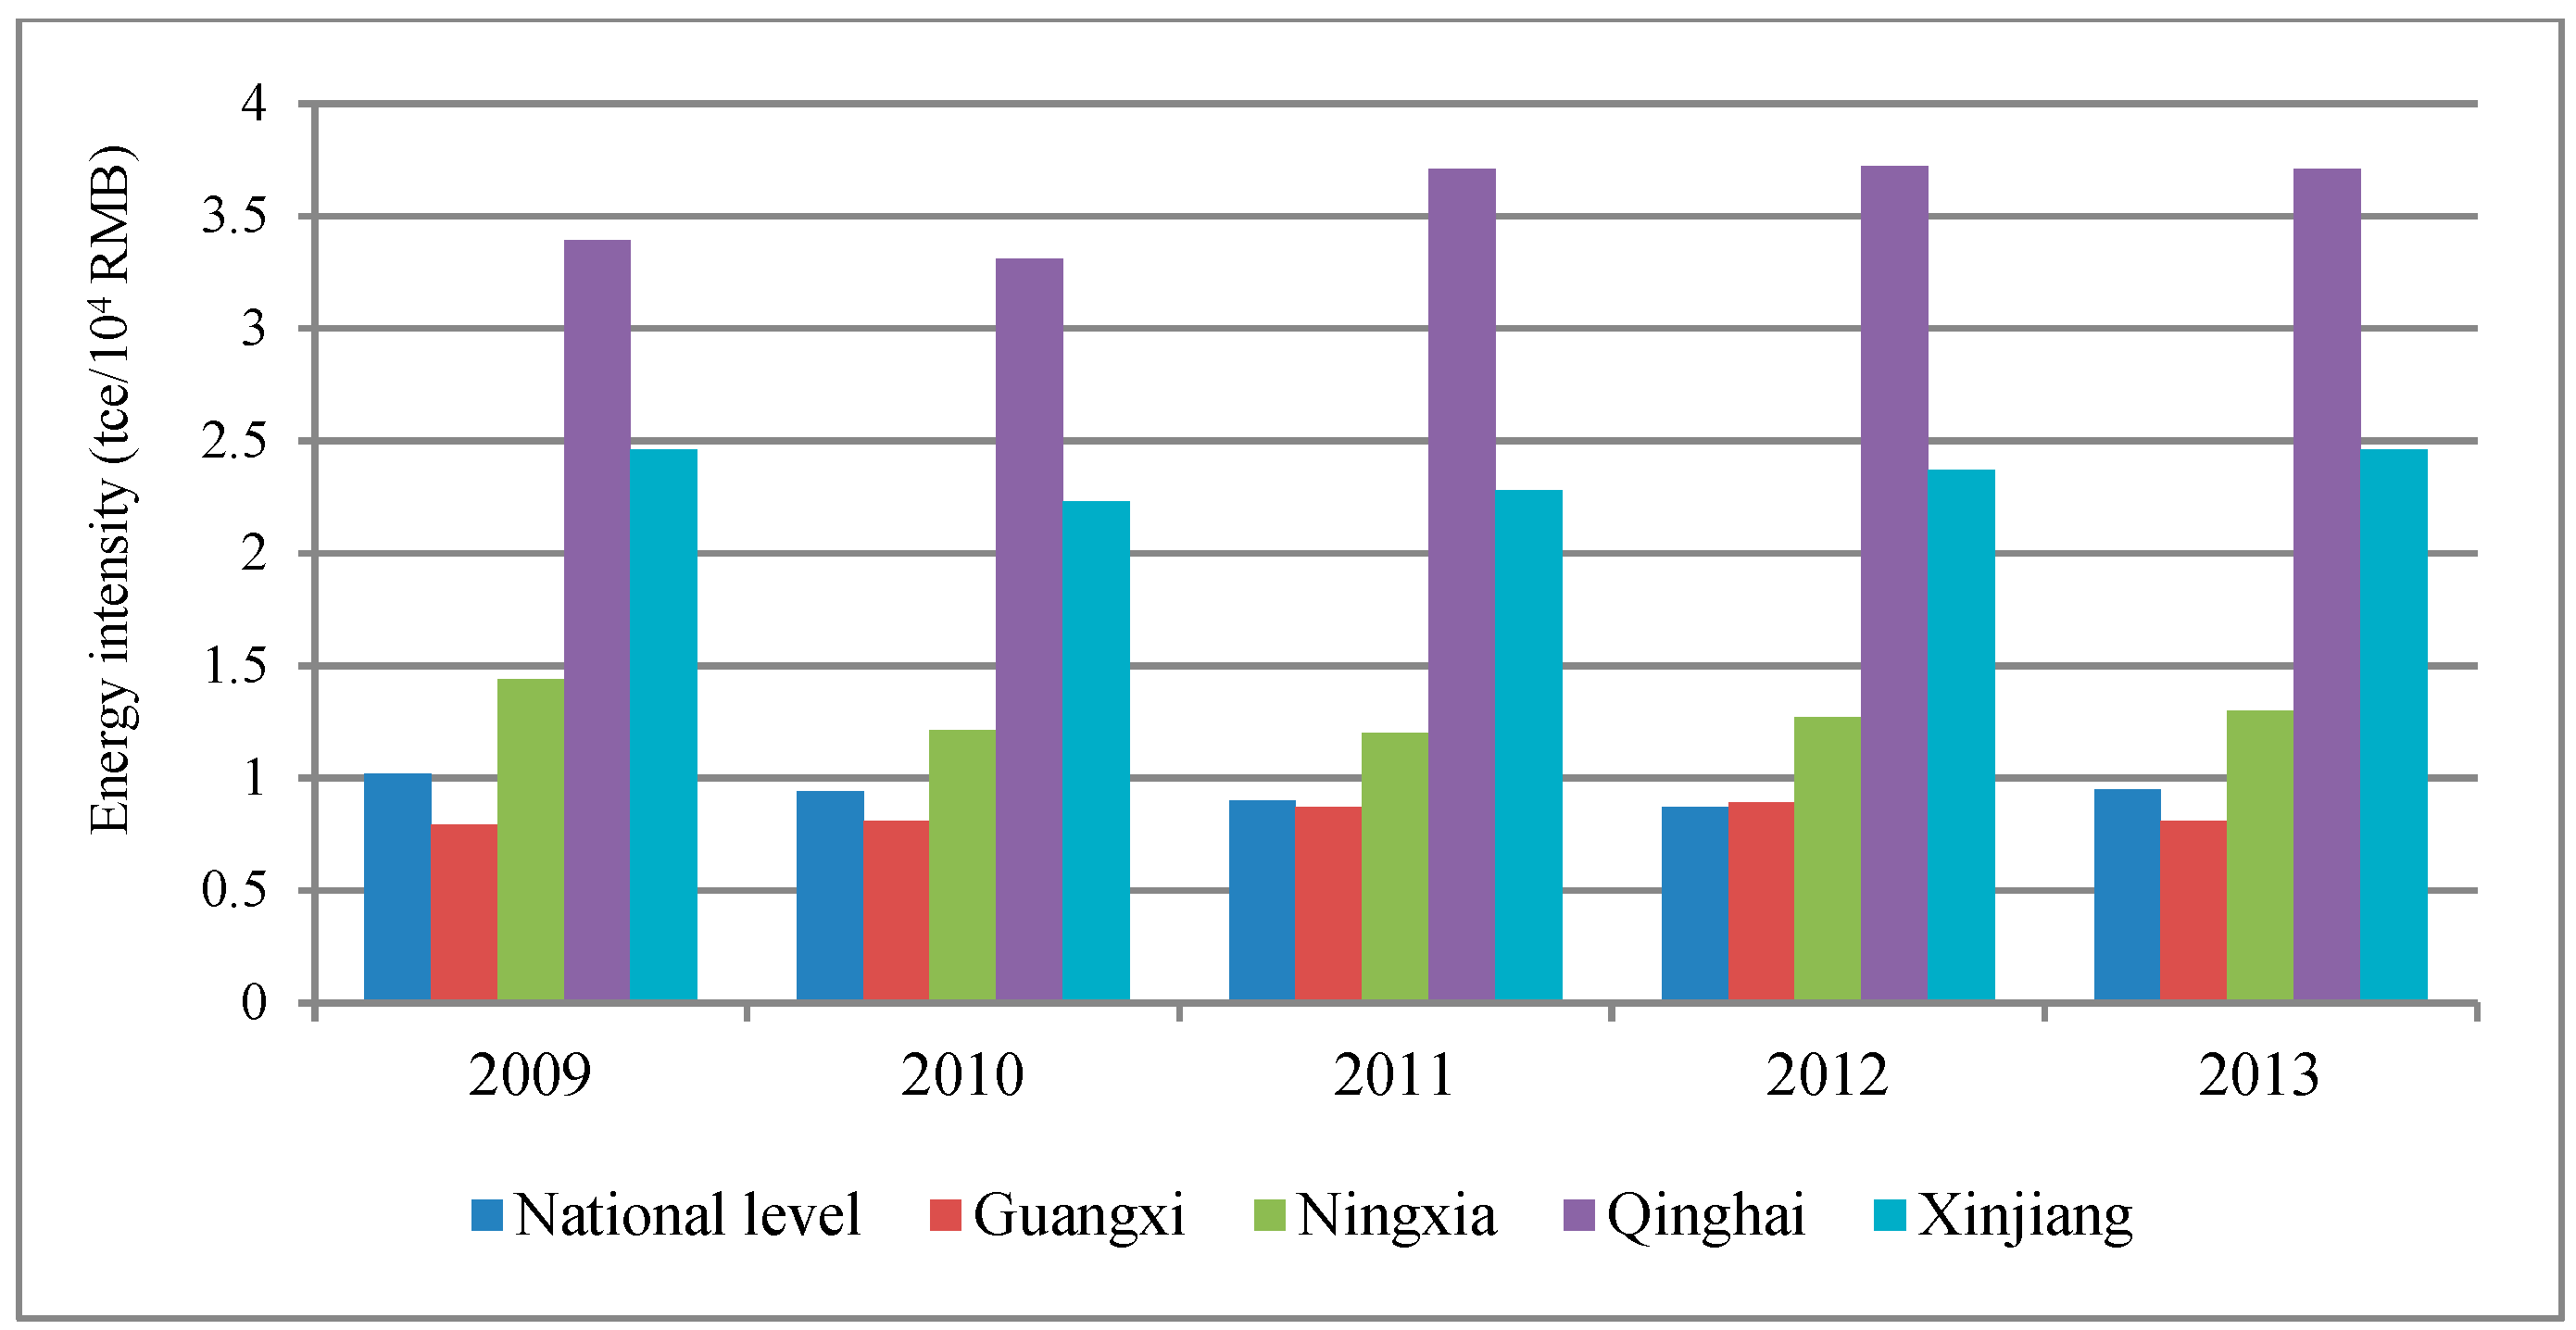
3.2.2. Regional Energy Intensity Effect

Table 4 shows that the reducing effect of regional energy intensity on SO2, NOx, and PM2.5 in most regions grew during periods 2005–2007 and 2007–2009, reduced during the periods 2011–2013 and 2013–2015; the strongest reducing effect occurred during 2009–2011. The contribution of regional energy intensity effect was negative among all regions during the period 2005–2007. This indicates that the energy intensity effect curbed APEs. Especially, the energy intensity effect greatly curbed APEs in the eastern and northern regions (Figure 2b). The reasons for these results are as follows. First, Shandong and Jiangsu in the eastern region had a high level of heavy industry; the industrial share for these provinces declined, and the industrial structure was optimized during this period. Meanwhile, the energy use per 104 RMB GDP declined, and this improved energy efficiency and curbed APEs. The industrial share for Hebei and Shanxi increased by 1.61 and by 4.13%, and the energy consumption per 104 RMB GDP decreased, respectively, by 7.8 and by 11.4% [18]. Therefore, the energy intensity for the two provinces decreased significantly, thereby effectively inhibiting APEs. Second, increases in the industrial proportion and energy consumption per 104 RMB GDP for Qinghai in the northwestern region promoted its APEs.
The regional energy intensity effect in all regions curbed national APEs during 2007–2009. This curbing effect in the eastern region was the greatest, whereas the curbing effect in the northwest region was the smallest. The energy intensity effect for Shanxi in the northern region, Shandong and Jiangsu in the eastern region, Henan and Hunan in the central region, and Liaoning in the northeastern region effectively reduced APEs. The reason is that increases in the energy-saving investment and development of low-energy and high-tech industries in these areas effectively reduced energy use per 104 RMB GDP, during this period (Figure 3). However, because of the Western Development Strategy, increases in the industry proportion and energy use per 104 RMB GDP in the northwestern region promoted APEs. Especially for Xinjiang, the energy use per 104 RMB GDP increased by 11.6%. Thus, the curbing effect in the northwest region was the smallest among all regions.
The regional energy intensity had a relatively greater curbing effect on APEs in the southwestern, central, and eastern regions during 2009–2011 and 2011–2013. The reason is that the industrial structure optimization decreases in the industrial proportion (Figure 4), and increases in the investment for energy-saving and emission-reduction technology improved the energy efficiency in Chongqing (the southwestern region), Hubei and Hunan (the central region), and Shandong (the eastern region) [49]. The regional energy intensity had a small curbing effect and even a slight promoting effect on APEs in the southern and northwestern regions. The reasons are as follows. First, the energy intensity effect for Guangxi in the southern region (2009–2011), and Ningxia, Qinghai and Xinjiang in the northwestern region (2011–2013) were relatively underdeveloped in their economies and had lower energy utilization efficiencies in the corresponding period. Second, these provinces entered the heavy industry stage, and the energy consumption per 104 RMB GDP was almost higher than the national average level (Figure 5).
During 2013–2015, the regional energy intensity had curbing effects on APEs, and this curbing effect in the southwestern region was the greatest. This is because the regional government actively carried out industrial restructuring by increasing the tertiary proportion, such as tourism and other services to lower energy use per 104 RMB GDP during this period [51].

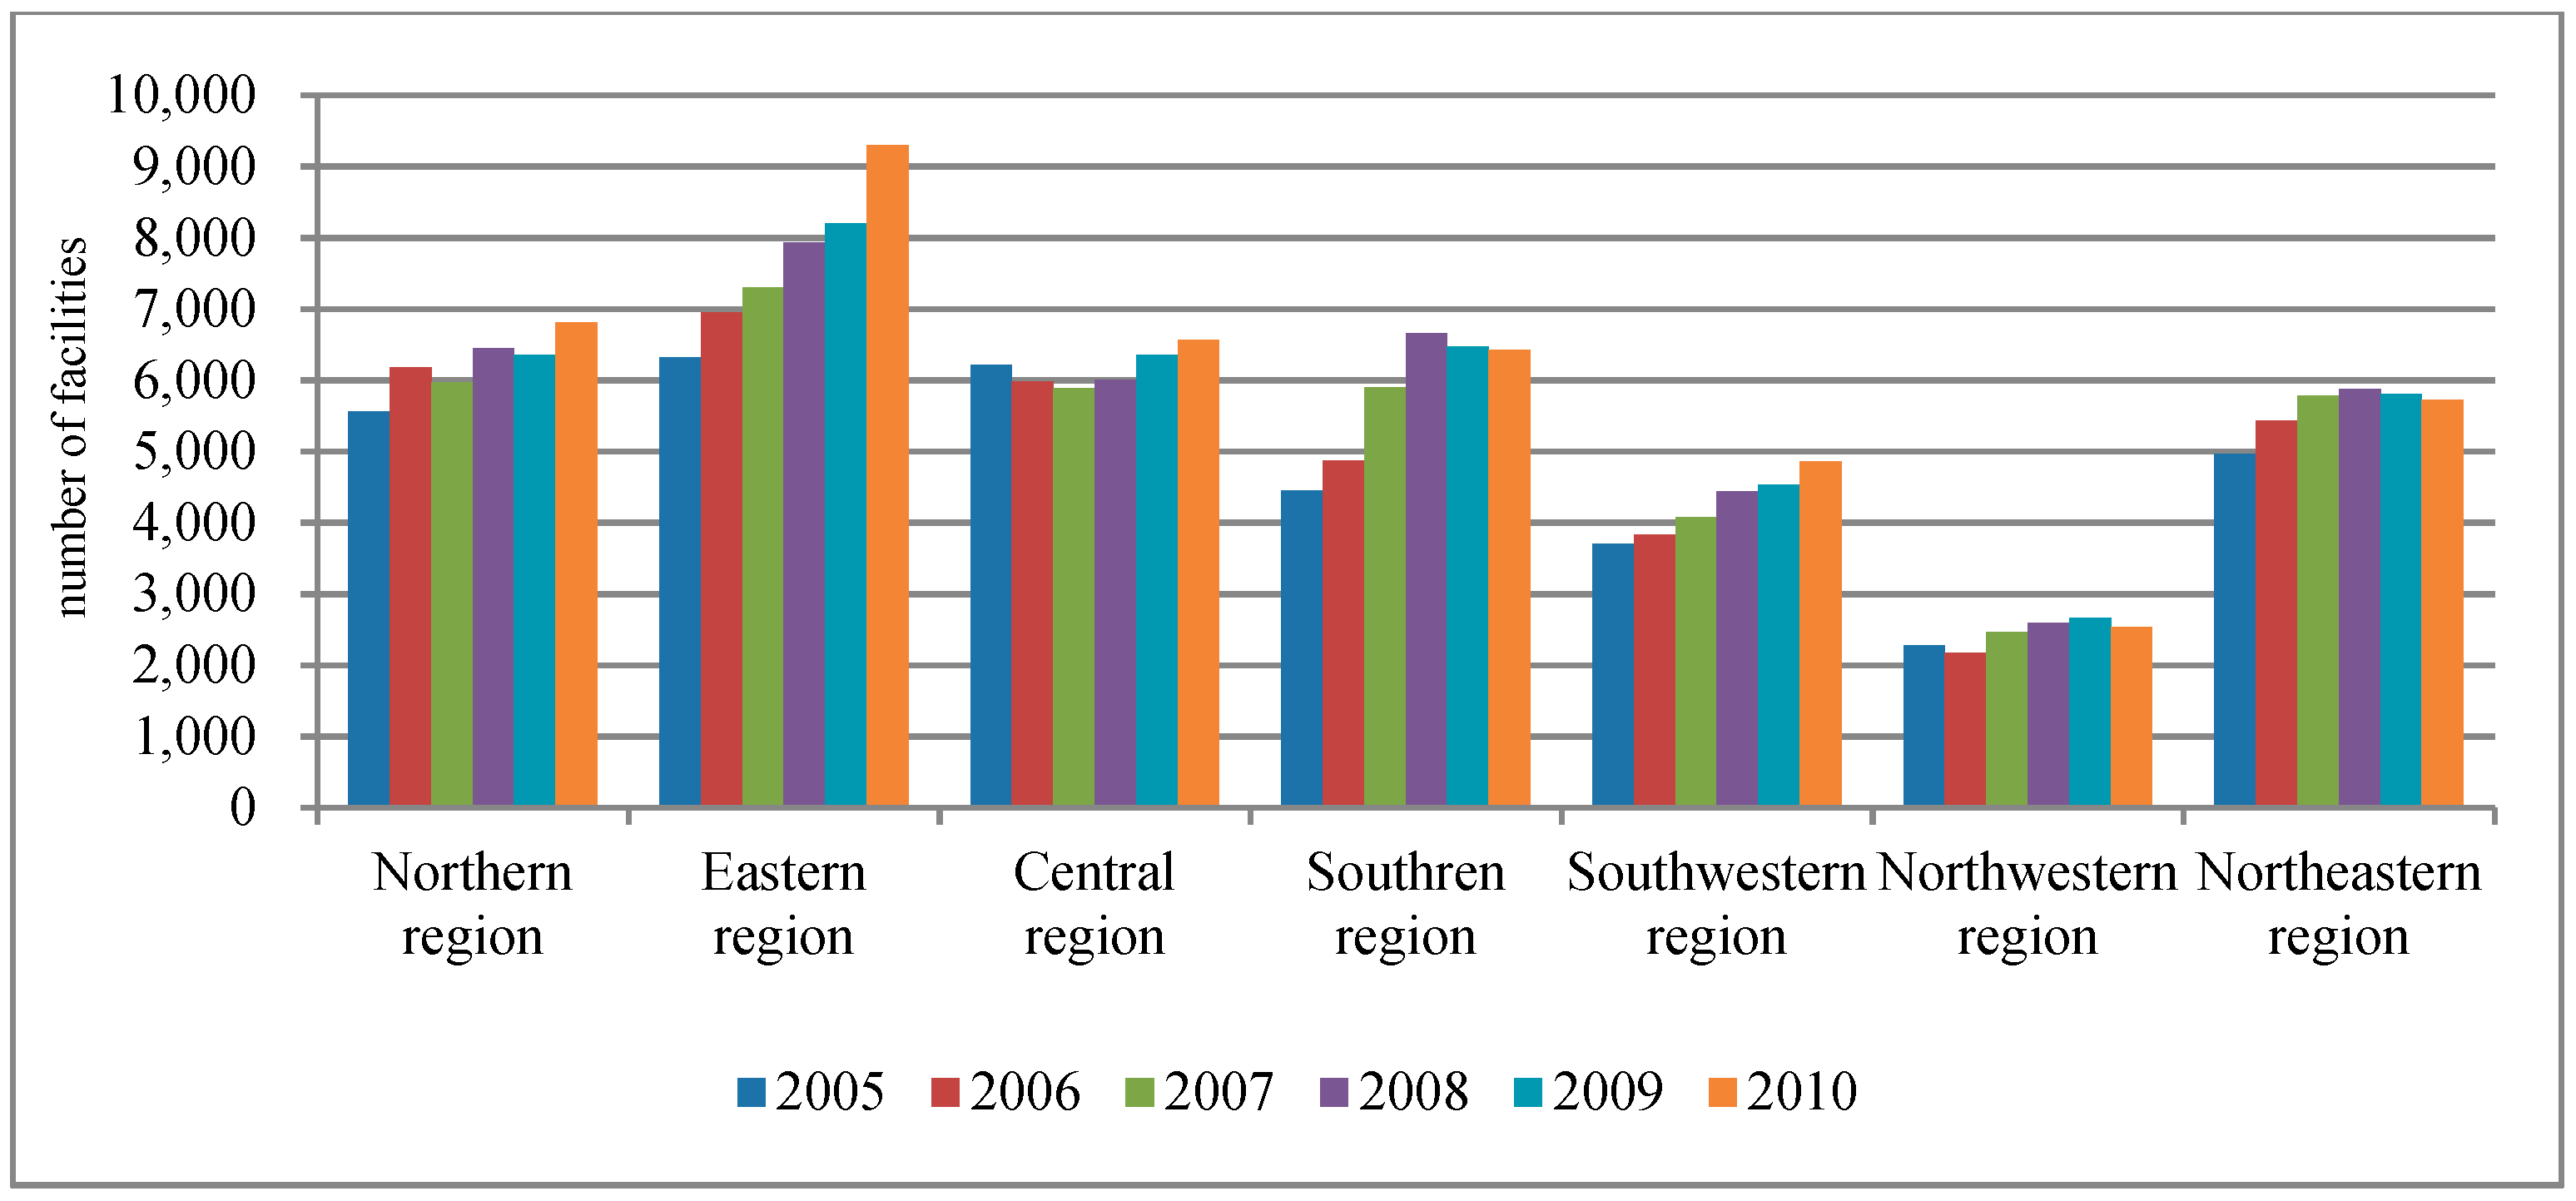
3.2.3. Regional Population Structure Effect

Figure 2c shows the regional population structure had only a small effect on APEs on the whole. During 2005–2007 and 2007–2009, the contribution of regional population structure effect in the eastern, southern, northern, and northeastern regions was positive. This indicates the regional population structure effect in these regions promoted APEs. The contribution of other regions was negative, thereby reducing APEs.
During 2009–2011, the regional population structure effect promoted APEs in the northeastern, northern, eastern, and northwestern regions. The regional population structure effect in the southwestern, central, and southern regions decreased APEs.
During 2011–2013 and 2013–2015, the contribution of regional population structure effect was positive in the northern, southern, northwestern and northeastern regions and negative for other regions, but these contributions seemed near-zero. This indicates that the population structure effect can be considered negligible.

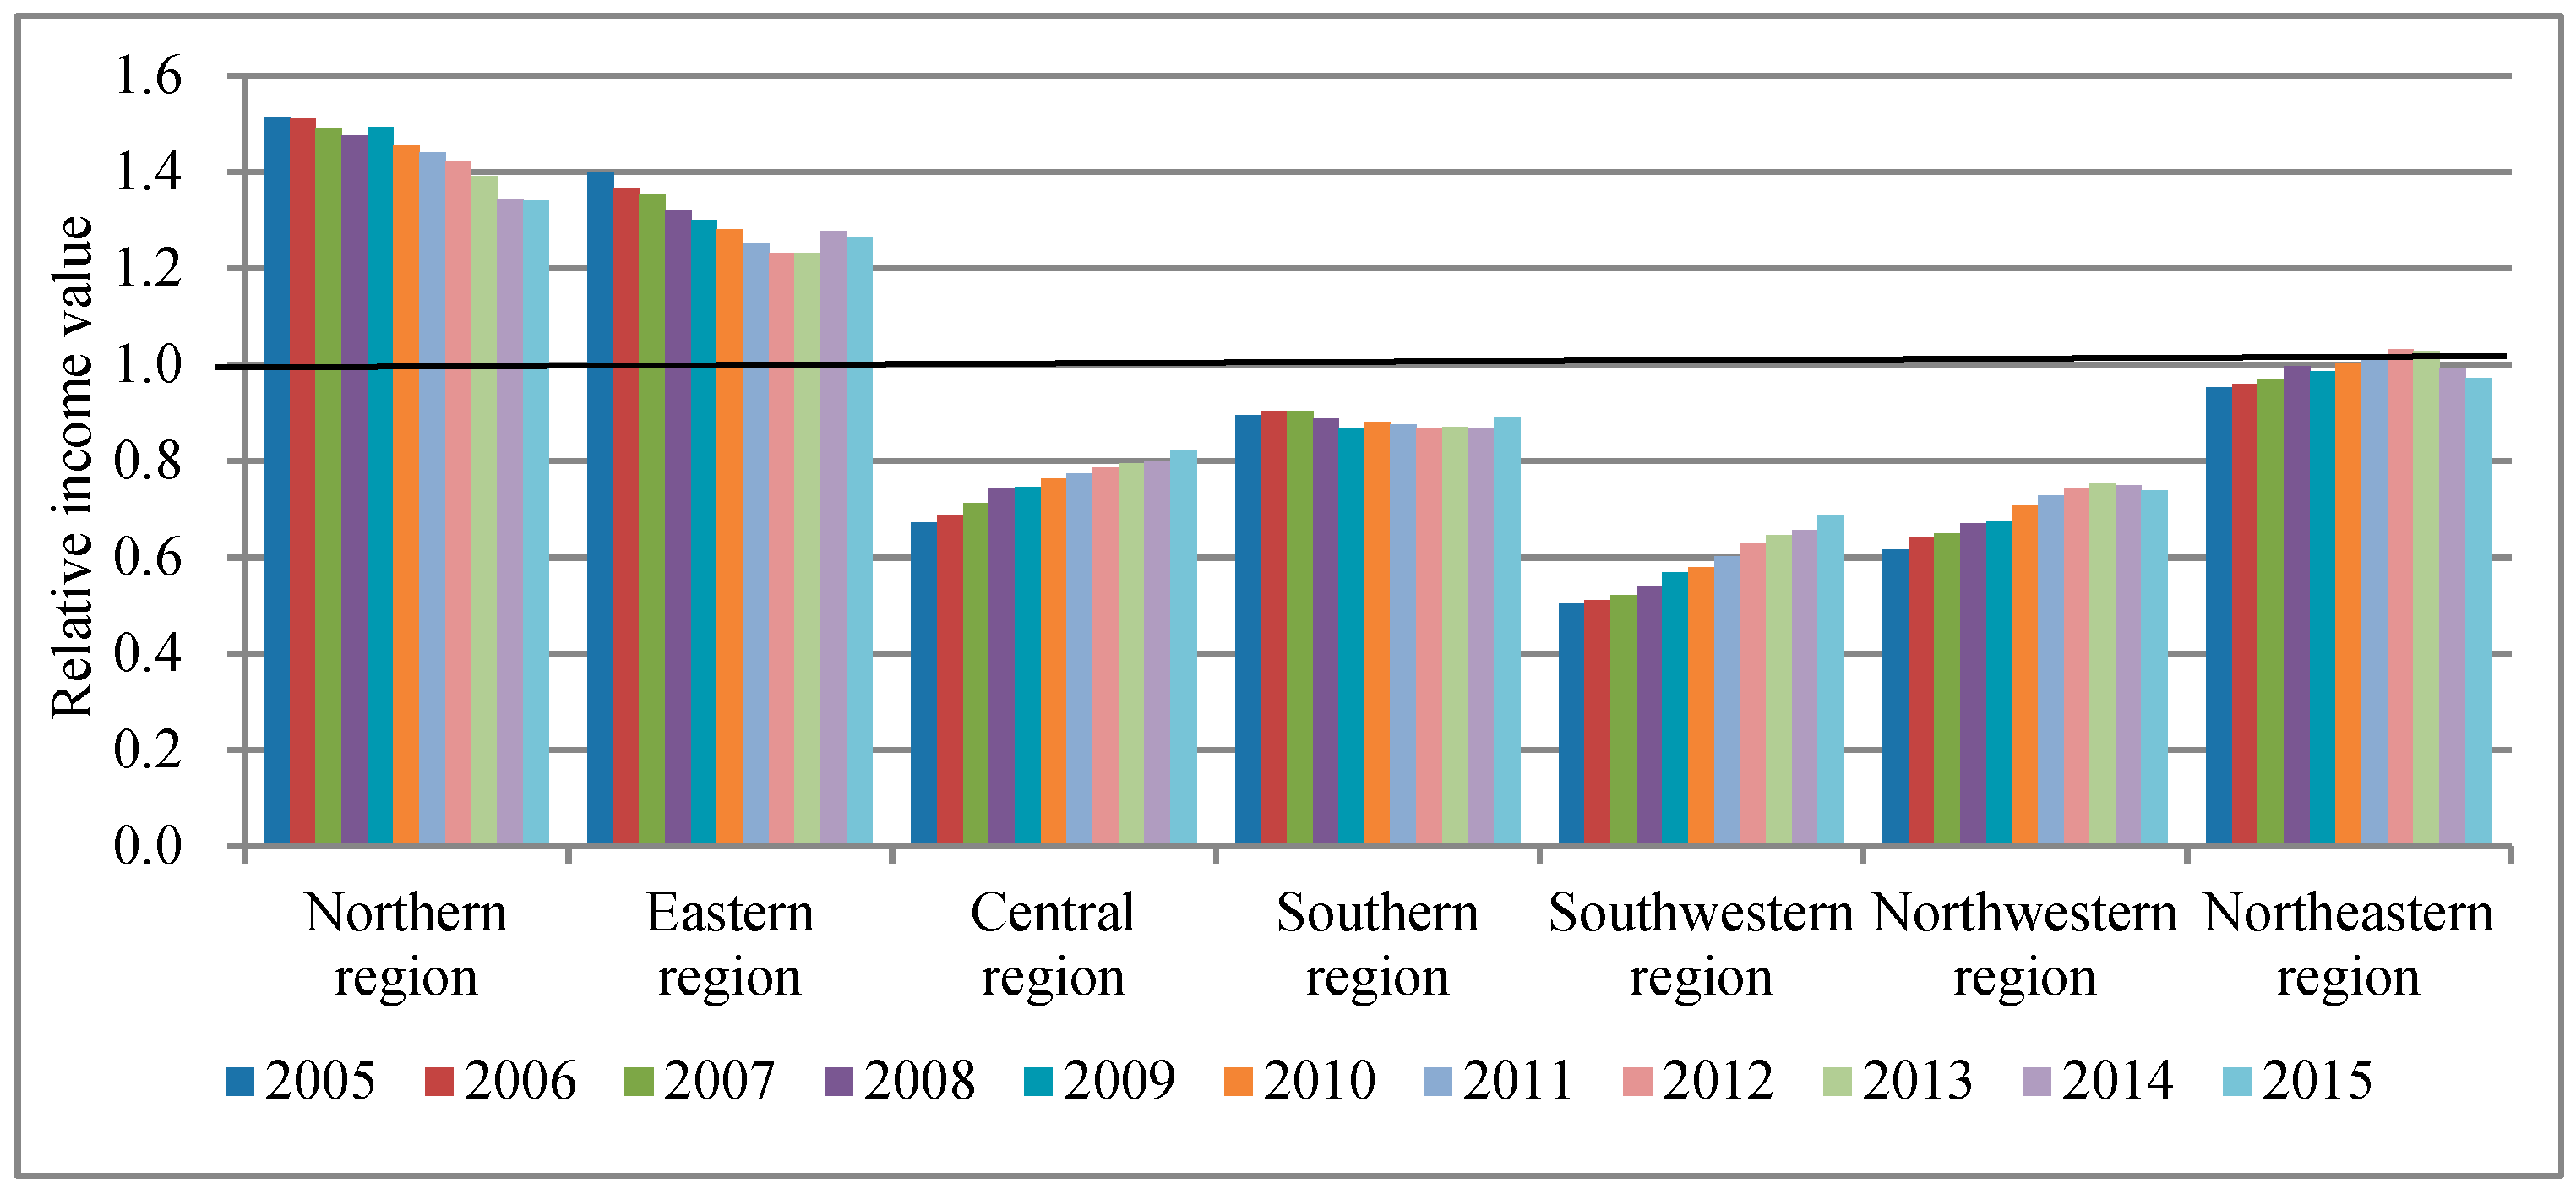
3.2.4. Regional Relative Income Effect

The relative income (compared with the national income) is higher than “1” for the northern and eastern regions, almost equal to “1” for the northeastern region, and lower than “1” for other regions (Figure 6). This indicates that the regional income was relatively high for northern and eastern regions, followed by the northeastern region, and relatively low for other regions. Figure 2d shows that the regional relative income effect in central, southwestern, and northwestern regions promoted APEs during 2005–2007. This is because the regional relative income for regions with low per capita income is easy to increase more rapidly than regions with high per capita income. Moreover, residents with low income paid more attention to the living standard rather than to environmental quality and would consume more high-pollution and high-energy-consuming products [57], which promoted APEs. The contributions of regional relative income effect in northern, eastern, southern, and northeastern regions were negative, and this indicates this effect decreased APEs in these regions. Residents with a high income focus more attention on environmental quality improvement and environmental protection, and are willing to buy environment-friendly products, and accept strict environmental regulations [58], which resulted in structural changes in the economy and decreases in APEs.
During the periods 2007–2009 and 2009–2011, the contributions of regional relative income effect in the eastern, southern, and northeastern regions were negative, and this indicates the regional relative income effect lowered APEs, whereas these contributions in other regions were positive, and it promoted APEs. The reason for regional relative income effect in the northern region promoting APEs is that Shanxi (2009–2011) and Inner Mongolia contributed most to APEs. As a coal-rich province, Shanxi has large coal consumption, leading to APEs. Meanwhile, a large coal heating capacity was needed for the long winter periods with torrential storms because of extreme weather during 2009–2011, thereby increasing energy consumption and APEs in Inner Mongolia.
In the periods 2011–2013 and 2013–2015, the effect of regional relative income still increased APEs in the central and southwestern regions, curbed APEs in the northern and northeastern regions, decreased and then increased APEs in the eastern and southern regions, and promoted and then inhibited APEs in the northwestern region. On the whole, the contributions seemed smaller, and even near-zero during 2013–2015.

3.2.5. National Economic Growth Effect

Figure 2e shows during the periods 2005–2007 and 2007–2009, the national economic growth effect increased APEs for all regions, and the order of the degree to promoting APEs was eastern region > northern region > central region > northwestern region > southern region > northeastern region > southwestern region. The promoting degree to national economic growth effect was most significant for Shandong and Jiangsu in the eastern region, Hebei in the northern region, and Henan and Shanxi in the central region. This is because the GDP for these provinces was relatively large. During this period, the rapid economic growth, increases in industry proportion and unreasonable industrial structure promoted APEs.
During 2009–2011, the national economic growth effect for all regions on APEs (especially PM2.5) was enhanced. As the economic growth rate reached the maximum level in this period, the value added for the secondary industry, accounted for a large proportion, thereby consuming huge fossil energy and emitting more APEs.
During 2011–2013 and 2013–2015, the contribution of national economic growth went down significantly, so this promoting effect was steadily weakened. Generally, the promoting effect of economic growth showed a weakening trend because of the slight decline in the economic growth rate during the periods.

4. Discussions

The following findings can be obtained through the empirical results.

4.1. The Regional Emission Efficiency Effect was the Key Curbing Factor

The regional emission efficiency effect was the most significant curbing factor for APEs. The inhibitory effect on NOx was strengthened and it was weakened on SO2 and PM2.5 and then strengthened over the study period. The curbing effect of regional emission efficiency was greater in the eastern and northern regions, followed by the southern and central regions (Table 3 and Figure 2a).
The curbing effect of regional emission efficiency reflects the continuous decline in air pollution emissions per unit energy consumption and indicates the improvement in end-up-pipe treatment technology [59,60]. Different emission reduction policies and different emission reduction potentials for different periods led to the differences in regional emission efficiency effect. For example, the target was put forward for SO2 emission reduction by 10% at the beginning of the 11th FYP period (2006–2010) [61], so SO2 emissions and particulate matters decreased by 14.3% and by 30% at the end of this period. The sharp decreases in SO2 emissions at the beginning of the 11th FYP period resulted in small SO2 emission reduction potential for the next years. Thus, the inhibitory effect of regional emission efficiency on SO2 decreased significantly at the end of the 11th FYP period (2006–2010). During the 12th FYP period (2011–2015), China’s government proposed emission reduction targets on decreases in SO2 and NOx emissions by 8 and by 10%, and promotions for the construction and renovation of terminal treatment projects, such as installation of desulphurization and denitrification equipment [62], so the inhibitory effect of regional emission efficiency on SO2 was strengthened, and as a consequence, the curbing effect on PM2.5 was strengthened as well. As the denitrification rate was relatively low before 2006, the emission reduction potential for NOx was great during the 11th FYP period (2006–2010). The NOx mission reduction target (NOx emission reduction by 10%) for the 12th FYP period (2011–2015) led to the inhibitory effect of emission efficiency on NOx further strengthened. Although no clear target on PM2.5 emission reduction was proposed, the electrostatic precipitation and more advanced equipment were used in reality, which had decreased dust by 99%. So the emission efficiency improvement for PM2.5 was relatively small, but the emission efficiency improvement potential for PM2.5 was smaller than this potential for SO2 and NOx [63,64].
At the regional level, different economic characteristics, and different emission reduction facilities, investments and policies, led to the regional differences in emission efficiency effect. About 90% of fossil energy was used in the industrial sector in China [17], and the industrial sector covered the highest proportion of GDP (Figure 7). Thus, the pollution end treatment pattern in the regional industrial sector had a direct impact on APEs. Figure 8 shows that during the 11th FYP period (2006–2010) most of the waste-gas treatment facilities were in the eastern and northern regions, followed by the central, south, and northeastern regions, and the least were in the southwestern and northwestern regions. Moreover, the northern and eastern regions had high investments in waste-gas treatment (Figure 9), which made the regional emission efficiency effect effectively inhibited APEs in these regions. Even though the number of facilities in the northeastern region was similar to the number in the southern region, the northeastern region had low emission abatement efficiency as an old industrial base with high proportional industry and fossil energy consumption in China. Thus, increases in reduction facilities were not sufficient for the northeastern region to effectively improve its emission abatement efficiency. The comprehensive air pollution control plan issued in September 2012 declared that the Jing-Jin-Ji Area, Yangtze River Delta, and Pearl River Delta were seriously polluted by compound APEs, and it was necessary to control SO2, NOx, and particulate matter by installing desulfurization and denitrification equipment, and upgrading and renovating abatement facilities. Therefore, during the 12th FYP period (2011–2015), the regional emission efficiency in the northern, eastern, and southern regions had an obvious curbing effect on APEs. During the whole study period, increases in abatement investments in large- and medium-sized industrial enterprises, and the relatively high technology level for abatement treatment in the northern, eastern, and southern regions led to an effectively inhibitory effect of regional emission efficiency. By contrast, the slight curbing effect of regional emission efficiency was associated with the low abatement investments for the southwestern, northwest, and northeastern regions.

4.2. The Regional Energy Intensity Effect Curbed APEs

The regional energy intensity effect was the greatest in the eastern region, and relatively small in southern and northwest regions. The regional energy intensity had an obvious curbing effect on SO2 and NOx than on PM2.5. China’s energy intensity had been declining for a long time, especially in the industrial sector [65]. For the high output and fossil energy consumption in the industrial sector, decreases in energy use per unit output in the industry resulted in significant decreases in APEs, and this result was supported by Zhang et al. (2015) [66]. During the study period, the degree of curbing the effect of regional energy intensity declined, which reflects the dropping trend of promotion of China’s industrial energy efficiency. SO2 and NOx emissions are mainly from fossil fuel combustion, whereas PM2.5 emissions are not only from fossil fuel combustion but also from physical production processes. Therefore, the energy intensity had an obvious curbing effect on SO2 and NOx than on PM2.5.
At the regional level, the eastern region actively adjusted its industrial structure and promoted energy-saving technologies to improve energy efficiency. Thus, the declines in fossil energy consumption and energy intensity in this region effectively curbed APEs, which is consistent with Song et al. (2013a,b,c) and Chen et al. (2015) [67,68,69,70]. The northwestern region had a huge industrial value, unreasonable industrial structure, and massive fossil energy consumption. In addition, the energy use per 104 RMB GDP was relatively high. Thus, more attention should be paid to energy efficiency promotion in the northwestern region, especially in the Ningxia, Qinghai, and Xinjiang provinces in this region. The southern region had low total industrial value and total energy consumption, so the energy intensity effect had a small curbing effect on APEs. The industrial proportion and the energy consumption in the northern region before 2010 were relatively high, whereas the energy use per 104 RMB GDP greatly decreased; after 2010, increases in fossil energy consumption and declines in energy use per 104 RMB GDP slowed down the energy efficiency improvement in the region, thereby weakening the curbing effect of regional energy intensity. On the contrary, the low fossil energy consumption and high energy use per 104 RMB GDP in China’s central and southwestern regions before 2010 decreased the curbing effect of energy intensity; whereas the energy efficiency in these regions after 2010 had been greatly improved, so the curbing effect of energy intensity promoted. The results by Dong et al. (2018), Huang et al. (2017), and Tan and Lin (2018) showed that industrial structure optimization, technological input, and energy prices were decisive factors in reducing energy intensity. In this case, China has a great energy-saving and emission-abatement potential, especially in the central and western regions with unreasonable industrial structure [70,71,72].

4.3. The Regional Population Structure and Regional Relative Income had a Small Effect on APEs

The regional population structure effect increased APEs in the northern, southern, and northeastern regions, whereas it decreased the APEs in the central and southwestern regions, over the whole study period. The regional population structure had a slight promoting and then curbing effect in the eastern region, and it was reverse of this in the northwestern region. Data from the China Statistical Yearbook shows that during 2005–2015, the national population increased by 5.1%, and energy consumption per capita rose from 0.211 to 0.365 tce, which resulted in increases in total energy use and promotion of APEs. In view of different regions, the population size in the northern, eastern, southern, and northeastern regions increased by 14.1, 7.9, 12.8 and 1.8%, respectively, during 2005–2015. The concentrated population aggravated the energy-intensive product demand [73,74], thereby promoting APEs. The result that the population structure had a small promoting effect on primary APEs was supported by Lyu et al. (2016) and Wang et al. (2018) [43,75]. Moreover, the urbanization process was always associated with housing and infrastructure construction, large demand for energy-consuming commodities, and heavy vehicle emissions, thereby promoting APEs. Zhou and Liu (2016) also suggested that the regional urbanization would increase energy consumption and APEs except in the western region [76]. The northwestern region has a relatively small population size during 2005–2011, so a small increased population led to obvious increased APEs in this region during 2011–2015. The slow population growth and reasonable urbanization construction in the eastern region effectively reduced APEs in the period 2011–2015.
The regional relative income effect reduced APEs in the northern, eastern, southern, and northeastern regions, but promoted APEs in other regions. The promoting or curbing effect of regional relative income on APEs can be explained by the environmental Kuznets curve theory [24,41,77]. At relative a low-income level, the economic structure changed from agriculture to energy-intensive industries, and air pollution was becoming serious accompanied by increases in income; the economic structure turned to low-pollution services and knowledge-intensive industries after a certain income level (inflection point), and this then reduced APEs. Moreover, the high-income level was closely related to high-efficiency environmental technology and active environmental awareness, thereby improving environmental quality. In this study, the regional relative income effect curbed APEs in the northern, eastern, southern, and northeastern regions because of slow increases in the relative income, whereas this effect increased APEs in other regions because of the rapid increases in relative income [78,79].

4.4. The National Economic Growth Effect was the Key Promoting Factor

The national economic growth effect was the key promoting factor and showed a weakening–strengthening–weakening trend. This was supported by Chang et al. (2018) and Chen et al. (2018) [80,81]. This promoting effect was more obvious in the eastern and northern regions, followed by southern, central, and southwestern regions. China’s economy was affected by the global economic crisis in 2008. During 2007–2009, the economic growth rate declined, and the proportional secondary industry decreased. This weakened the promoting effect on APEs. China statistics show that the economic growth rate in China rose by 3.4% in 2010 compared with the level in 2009 [17], which led to increases in APEs during this period. During the study period, GDP in the eastern and northern regions was the highest, accounting for more than 50% of China’s GDP [82], so the promoting effect of national economic growth on APEs in these regions was obvious. The economic aggregate in the northwestern and northeastern regions was small, accounting for only about 13% of China’s GDP [18], which resulted in a relatively small promoting effect on APEs in the regions.

5. Conclusions and Policy Implications

This article introduced the LMDI method into the regional decomposition to construct a contribution index for different factors that drive the changes of major APEs in different regions and discussed the reasons for the regional differences in factors promoting or curbing the APEs through comparative analysis. This work came to these conclusions based on the empirical analysis: (1) the regional emission efficiency effect was the most significant curbing factor for APEs; the curbing effect of regional emission efficiency was great for eastern and northern regions, followed by southern and central regions, whereas it was small for southwest, northwestern, and northeastern regions. (2) The curbing regional energy intensity effect was greater on SO2 and NOx than on PM2.5; this curbing effect was great in the eastern region and small in the southern and northwestern regions. (3) The regional population structure had a small promoting effect on APEs on the whole, and it promoted APEs for northern, southern, northeastern, and eastern regions, whereas it curbed these pollutants for central, southwestern, and northwestern regions. (4) The regional relative income effect had a small impact on APEs; it reduced APEs for northern, eastern, southern, and northern regions, but promoted APEs for other regions. (5) The national economic growth effect was the key promoting factor for APEs; the promoting effect of national economic growth was most obvious in the eastern and northern regions, followed by southern, central, and southwestern regions.
The findings of this article can point to the following policy implications. (1) Strengthening the curbing effect of emission efficiency is needed by combining cleaner production with end-up-pipe treatment. On the one hand, there is a need to encourage clean production by using advanced clear production technologies and processes; on the other hand, air pollution treatment facilities and relative capital investment should be increased to improve terminal abatement capability. Different measures should be adopted in different regions. For the eastern region with the obvious curbing effect of emission efficiency, more attention should be paid to cleaner production through strengthening the process control, improving the energy use efficiency, and enhancing the clear industry proportion. For the central and western regions with a small inhibition effect of emission efficiency, more policy, technology, and funding supports are needed to improve the terminal abatement capacity. (2) The energy intensity should be decreased further. China’s government should emphasize the industrial restructuring and supply-side reform for industries with high fossil energy use. It is needed to promote inter-regional cooperation to realize inter-regional technology innovation in energy conservation and emission reduction. More attention should be focused on low energy use efficiency in some industrial sectors [82]. (3) The regional population transfer should be focused on, and some measures should be taken to inhibit the unbalanced population mobility and adjust the current regional population structure, and it is necessary to narrow the regional income gap because the regional population structure and regional relative income effect changes in APEs. (4) The government should coordinate the regional economy to narrow the gap between different regions so as to effectively reduce APEs. As China’s APEs are mainly from the industrial sectors [83], more attention should focus on the improvement of industry structure, especially for the regions with a huge economic aggregate.

Author Contributions

Conceptualization, J.Y. and S.X. Methodology and software, S.X., Y.M. and Y.L. (Yunfan Li) Validation, J.Y. Formal analysis, Y.L (Yiwen Li). Investigation, X.M. Resources, S.X. Data curation, S.W. Writing—original draft preparation, Y.M. Writing—review and editing, J.Y., S.X. and Y.M. Funding Acquisition, S.X.

Funding

This study was financially supported by the National Natural Science Foundation of China (grant no. 71573253) and Key Projects of Philosophy and Social Sciences for Universities by Jiangsu Provincial Department of Education (grant no. 2018SJZDI109).

Conflicts of Interest

The authors declare no conflicts of interest.

References

  1. Ministry of Ecology and Environment of the People’s Republic of China. Available online: http://www.mee.gov.cn/ (accessed on 27 January 2019).
  2. Gao, J.H.; Woodward, A.; Vardoulakis, S.; Kovats, S.; Wilkinson, P.; Li, L.P.; Xu, L.; Li, J.; Yang, J.; Li, J.; et al. Haze, public health and mitigation measures in China: A review of the current evidence for further policy response. Sci. Total Environ. 2017, 578, 148–157. [Google Scholar] [CrossRef] [PubMed]
  3. Gao, M.; Guttikunda, S.K.; Carmichael, G.R.; Wang, Y.; Liu, Z.; Stanier, C.; Saide, P.E.; Yu, M. Health impacts and economic losses assessment of the 2013 severe haze event in Beijing area. Sci. Total Environ. 2015, 511, 553–561. [Google Scholar] [CrossRef] [PubMed]
  4. Hao, Y.; Peng, H.; Temulun, T.; Liu, L.Q.; Mao, J.; Lu, Z.N.; Chen, H. How harmful is air pollution to economic development? New evidence from PM2.5 concentrations of Chinese cities. J. Clean. Prod. 2018, 172, 743–757. [Google Scholar] [CrossRef]
  5. Maji, K.J.; Ye, W.F.; Arora, M.; Nagendra, S.M.S. PM2.5-related health and economic loss assessment for 338 Chinese cities. Environ. Int. 2018, 121, 392–403. [Google Scholar] [CrossRef]
  6. Lu, Q.; Zheng, J.Y.; Ye, S.Q.; Shen, X.L.; Yuan, Z.B.; Yin, S.S. Emission trends and source characteristics of SO2, NOx, PM10 and VOCs in the Pearl River Delta region from 2000 to 2009. Atmos. Environ. 2013, 76, 11–20. [Google Scholar] [CrossRef]
  7. Xue, Y.F.; Tian, H.Z.; Yan, J.; Zhou, Z.; Wang, J.L.; Nie, L.; Pan, T.; Zhou, J.R.; Hua, S.B.; Wang, Y.; et al. Temporal trends and spatial variation characteristics of primary air pollutants emissions from coal-fired industrial boilers in Beijing, China. Environ. Pollut. 2016, 213, 717–726. [Google Scholar] [CrossRef]
  8. Chen, C.X.; Chen, F.; Cheng, Z.; Chan, Q.N.; Kook, S.H.; Yeoh, G.H. Emissions characteristics of NOx and SO2 in the combustion of microalgae biomass using a tube furnace. J. Energy Inst. 2017, 90, 806–812. [Google Scholar] [CrossRef]
  9. Shi, Y.H.; Matsunaga, T.; Yamaguchi, Y.; Zhao, A.; Li, Z.Q.; Gu, X.F. Long-term trends and spatial patterns of PM2.5-induced premature mortality in South and Southeast Asia from 1999 to 2014. Sci. Total Environ. 2018, 631–632, 1504–1514. [Google Scholar] [CrossRef]
  10. Miao, W.J.; Huang, X.; Song, Y. An economic assessment of the health effects and crop yield losses caused by air pollution in mainland China. J. Environ. Sci. 2017, 56, 102–113. [Google Scholar] [CrossRef]
  11. Guo, H.B.; Chen, M.X. Short-term effect of air pollution on asthma patient visits in Shanghai area and assessment of economic costs. Ecotoxicol. Environ. Saf. 2018, 161, 184–189. [Google Scholar] [CrossRef]
  12. Li, L.; Lei, Y.L.; Wu, S.M.; Huang, Z.Y.; Luo, T.J.; Wang, Y.F.; Chen, J.B.; Yan, D. Evaluation of future energy consumption on PM2.5 emissions and public health economic loss in Beijing. J. Clean. Prod. 2018, 187, 1115–1128. [Google Scholar] [CrossRef]
  13. Wei, J.C.; Guo, X.M.; Marinova, D.; Fan, J. Industrial SO2 pollution and agricultural losses in China: Evidence from heavy air polluters. J. Clean. Prod. 2014, 64, 404–413. [Google Scholar] [CrossRef] [Green Version]
  14. Khaniabadi, Y.O.; Polosa, R.; Chuturkova, R.Z.; Daryanoosh, M.; Goudarzie, G.; Borgini, A.; Tittarelli, A.; Basiri, H.; Armini, H.; Nourmoradi, H.; et al. Human health risk assessment due to ambient PM10 and SO2 by an air quality modeling technique. Process Saf. Environ. Prot. 2017, 111, 346–354. [Google Scholar] [CrossRef]
  15. Yin, H.; Pizzol, M.; Xu, L.Y. External costs of PM2.5 pollution in Beijing, China: Uncertainty analysis of multiple health impacts and costs. Environ. Pollut. 2017, 226, 356–369. [Google Scholar] [CrossRef] [PubMed]
  16. Gao, Y.; Ji, H.B. Microscopic morphology and seasonal variation of health effect arising from heavy metals in PM2.5 and PM10: One-year measurement in a densely populated area of urban Beijing. Atmos. Res. 2018, 212, 213–226. [Google Scholar] [CrossRef]
  17. Xu, S.C.; He, Z.X.; Long, R.Y. Factors that influence carbon emissions due to energy consumption in China: Decomposition analysis using LMDI. Appl. Energy 2014, 127, 182–193. [Google Scholar] [CrossRef]
  18. Xu, S.C.; Zhang, W.W.; He, Z.X.; Han, H.M.; Long, R.Y.; Chen, H. Decomposition analysis of the decoupling indicator of carbon emissions due to fossil energy consumption from economic growth in China. Energy Effic. 2017, 10, 1365–1380. [Google Scholar] [CrossRef]
  19. Xu, W.J.; Li, J.X.; Zhang, W.H.; Wang, Z.X.; Wu, J.J.; Ge, X.J.; Wu, J.L.; Gao, Y.; Xie, Y.L.; Ying, D.W.; et al. Emission of sulfur dioxide from polyurethane foam and respiratory health effects. Environ. Pollut. 2018, 242, 90–97. [Google Scholar] [CrossRef]
  20. Liu, Y.S.; Zhou, Y.; Wu, W.X. Assessing the impact of population, income and technology on energy consumption and industrial pollutant emissions in China. Appl. Energy 2015, 155, 904–917. [Google Scholar] [CrossRef]
  21. Liu, C.; Hong, T.; Li, H.F.; Wang, L.L. From club convergence of per capita industrial pollutant emissions to industrial transfer effects: An empirical study across 285 cities in China. Energy Policy 2018, 121, 300–313. [Google Scholar] [CrossRef]
  22. Xu, B.; Luo, L.Q.; Lin, B.Q. A dynamic analysis of air pollution emissions in China: Evidence from nonparametric additive regression models. Ecol. Indic. 2016, 63, 346–358. [Google Scholar] [CrossRef]
  23. Chen, H.; Huang, Y.; Shen, H.Z.; Chen, Y.L.; Ru, M.Y.; Chen, Y.C.; Lin, N.; Su, S.; Zhuo, S.J.; Zhong, Q.R.; et al. Modeling temporal variations in global residential energy consumption and pollutant emissions. Appl. Energy 2016, 184, 820–829. [Google Scholar] [CrossRef]
  24. Xu, S.C.; Miao, Y.M.; Gao, C.; Long, R.Y.; Chen, H.; Zhao, B.; Wang, S.X. Regional differences in impacts of economic growth and urbanization on air pollutants in China based on provincial panel estimation. J. Clean. Prod. 2019, 208, 340–352. [Google Scholar] [CrossRef]
  25. Gill, A.R.; Viswanathan, K.K.; Hassan, S. The Environmental Kuznets Curve (EKC) and the environmental problem of the day. Renew. Sustain. Energy Rev. 2018, 81, 1636–1642. [Google Scholar] [CrossRef]
  26. Dong, K.Y.; Sun, R.J.; Dong, C.; Li, H.; Zeng, X.J.; Ni, G.H. Environmental Kuznets curve for PM2.5 emissions in Beijing, China: What role can natural gas consumption play? Ecol. Indic. 2018, 93, 591–601. [Google Scholar] [CrossRef]
  27. Xu, S.C.; Li, Y.W.; Miao, Y.M.; Gao, C.; He, Z.X.; Shen, W.X.; Long, R.Y.; Chen, C.; Zhao, B.; Wang, S.X. Regional differences in nonlinear impacts of economic growth, export and FDI on air pollutants in China based on provincial panel data. J. Clean. Prod. 2019, 228, 455–466. [Google Scholar] [CrossRef]
  28. Wang, Y.; Lai, N.; Mao, G.Z.; Zuo, J.; John, C.; Crittenden, J.; Jin, Y.; Juan, M.C. Air pollutant emissions from economic sectors in China: A linkage analysis. Ecol. Indic. 2017, 77, 250–260. [Google Scholar] [CrossRef] [Green Version]
  29. Ou, J.M.; Meng, J.; Zheng, J.Y.; Mi, Z.F.; Bian, Y.H.; Yu, X.; Liu, J.R.; Guan, D.B. Demand-driven air pollutant emissions for a fast-developing region in China. Appl. Energy 2017, 204, 131–142. [Google Scholar] [CrossRef] [Green Version]
  30. Shen, S.D.; Wang, C. Decomposition analysis on the air pollutant baseline emission factors in China’s power sector. Energy Procedia 2017, 105, 3355–3362. [Google Scholar] [CrossRef]
  31. Guan, Y.N.; Chen, G.Y.; Cheng, Z.J.; Yan, B.B.; Hou, L.A. Air pollutant emissions from straw open burning: A case study in Tianjin. Atmos. Environ. 2017, 171, 155–164. [Google Scholar] [CrossRef]
  32. Cheng, M.M.; Zhi, G.R.; Tang, W.; Liu, S.J.; Dang, H.G.; Guo, Z.; Du, J.H.; Du, X.H.; Zhang, W.Q.; Zhang, Y.J.; et al. Air pollutant emission from the underestimated households’ coal consumption source in China. Sci. Total Environ. 2017, 580, 641–650. [Google Scholar] [CrossRef] [PubMed]
  33. Wang, W.W.; Zhang, M.; Zhou, M. Using LMDI method to analyze transport sector CO2 emissions in China. Energy 2011, 36, 5909–5915. [Google Scholar] [CrossRef]
  34. Cansino, J.M.; Sánchez-Braza, A.; Rodríguez-Arévalo, M.L. Driving forces of Spain׳s CO2 emissions: A LMDI decomposition approach. Renew. Sustain. Energy Rev. 2015, 48, 749–759. [Google Scholar] [CrossRef]
  35. Gu, B.H.; Tan, X.C.; Zeng, Y.; Mu, Z.K. CO2 Emission Reduction Potential in China’s Electricity Sector: Scenario Analysis Based on LMDI Decomposition. Energy Procedia 2015, 75, 2436–2447. [Google Scholar] [CrossRef] [Green Version]
  36. Shao, S.; Yang, L.L.; Gan, C.H.; Cao, J.H.; Geng, Y.; Guan, D.B. Using an extended LMDI model to explore techno-economic drivers of energy-related industrial CO2 emission changes: A case study for Shanghai (China). Renew. Sustain. Energy Rev. 2016, 55, 516–536. [Google Scholar] [CrossRef] [Green Version]
  37. Mousavi, B.; Lopez, N.S.A.; Biona, J.B.M.; Chiu, A.S.F.; Blesl, M. Driving forces of Iran’s CO2 emissions from energy consumption: An LMDI decomposition approach. Appl. Energy 2017, 206, 804–814. [Google Scholar] [CrossRef]
  38. Moutinho, V.; Madaleno, M.; Inglesi-Lotz, R.; Dogan, E. Factors affecting CO2 emissions in top countries on renewable energies: A LMDI decomposition application. Renew. Sustain. Energy Rev. 2018, 90, 605–622. [Google Scholar] [CrossRef] [Green Version]
  39. Wu, L.Y.; Zeng, W.H. Research on the Contribution of Structure Adjustment on SO2 Emissions Reduction—Case Study Shijingshan District, Beijing. Procedia Environ. Sci. 2013, 18, 849–855. [Google Scholar] [CrossRef] [Green Version]
  40. Yang, X.; Wang, S.J.; Zhang, W.Z.; Li, J.M.; Zou, Y.F. Impacts of energy consumption, energy structure, and treatment technology on SO2 emissions: A multi-scale LMDI decomposition analysis in China. Appl. Energy 2016, 184, 714–726. [Google Scholar] [CrossRef]
  41. Wang, Y.; Han, R.; Kubota, J. Is there an Environmental Kuznets Curve for SO2 emissions? A semi-parametric panel data analysis for China. Renew. Sustain. Energy Rev. 2016, 54, 1182–1188. [Google Scholar] [CrossRef]
  42. He, S.B.; Yan, T.; Zhou, H.R. Decomposition and Spatial Clustering Analysis of China’s SO2 Emissions. Procedia Comp. Sci. 2016, 91, 1064–1072. [Google Scholar] [CrossRef] [Green Version]
  43. Lyu, W.; Li, Y.; Guan, D.; Zhao, H.; Zhang, Q.; Liu, Z. Driving forces of Chinese primary air pollution emissions: An index decomposition analysis. J. Clean. Prod. 2016, 133, 136–144. [Google Scholar] [CrossRef] [Green Version]
  44. Zhang, Y.; Shuai, C.; Bian, J.; Chen, X.; Wu, Y.; Shen, L. Socioeconomic factors of PM2.5 concentrations in 152 Chinese cities: Decomposition analysis using LMDI. J. Clean. Prod. 2019, 218, 96–107. [Google Scholar] [CrossRef]
  45. Song, C.J.; Liu, Q.L.; Gu, S.; Wang, Q. The impact of China’s urbanization on economic growth and pollutant emissions: An empirical study based on input-output analysis. J. Clean. Prod. 2018, 198, 1289–1301. [Google Scholar] [CrossRef]
  46. Antanasijević, D.; Pocajt, V.; Perić-Grujić, A.; Ristić, M. Multiple-input–multiple-output general regression neural networks model for the simultaneous estimation of traffic-related air pollutant emissions. Atmos. Pollut. Res. 2018, 9, 388–397. [Google Scholar] [CrossRef]
  47. Li, M.; Li, C.; Zhang, M. Exploring the spatial spillover effects of industrialization and urbanization factors on pollutants emissions in China’s Huang-Huai-Hai region. J. Clean. Prod. 2018, 195, 154–162. [Google Scholar] [CrossRef]
  48. Zhu, L.; Gan, Q.M.; Liu, Y.; Yan, Z.J. The impact of foreign direct investment on SO2 emissions in the Beijing-Tianjin-Hebei region: A spatial econometric analysis. J. Clean. Prod. 2017, 166, 189–196. [Google Scholar] [CrossRef]
  49. Ang, B.W. The LMDI approach to decomposition analysis: A practical guide. Energy Policy 2005, 33, 867–871. [Google Scholar] [CrossRef]
  50. Kim, S. LMDI Decomposition analysis of energy consumption in the Korean manufacturing sector. Sustainability 2017, 9, 202. [Google Scholar] [CrossRef] [Green Version]
  51. Jia, J.; Jian, H.; Xie, D.; Gu, Z.; Chen, C. Multi-scale decomposition of energy-related industrial carbon emission by an extended logarithmic mean Divisia index: A case study of Jiangxi, China. Energy Effic. 2019, 12, 2161–2186. [Google Scholar] [CrossRef] [Green Version]
  52. Xu, S.C.; Gao, C.; Miao, Y.M.; Shen, W.X.; Long, R.Y.; Chen, H.; Zhao, B.; Wang, S.X. Calculation and decomposition of China’s embodied air pollutants in Sino-US trade. J. Clean. Prod. 2019, 209, 978–994. [Google Scholar] [CrossRef]
  53. Xu, S.C.; Han, H.M.; Zhang, W.W.; Zhang, Q.Q.; Long, R.Y.; Chen, H.; He, Z.X. Analysis of regional contributions to the national carbon intensity in China in different Five-Year Plan periods. J. Clean. Prod. 2017, 145, 209–220. [Google Scholar] [CrossRef]
  54. China Environment Protection Database. Available online: http://hbk.cei.cn/aspx/Left_DB.aspx?ID=5 (accessed on 18 November 2018).
  55. Zhao, B. Assessing the nonlinear response of fine particles to precursor emissions: Development and application of an extended response surface modeling technique V1.0. Geosci. Model Dev. 2015, 8, 115–128. [Google Scholar] [CrossRef] [Green Version]
  56. Zhao, B. Change in household fuels dominates the decrease in PM2.5 exposure and premature mortality in China in 2005–2015. Proc. Natl. Acad. Sci. USA 2018, 115, 12401–12406. [Google Scholar] [CrossRef] [Green Version]
  57. He, Z.X.; Xu, S.C.; Shen, W.X.; Long, R.Y.; Chen, H. Impact of urbanization on energy related CO2 emission at different development levels: Regional difference in China based on panel estimation. J. Clean Prod. 2017, 140, 1719–1730. [Google Scholar] [CrossRef]
  58. Li, W.B.; Chen, N. Absolute income, relative income and environmental concern: Evidence from different regions in China. J. Clean. Prod. 2018, 187, 9–17. [Google Scholar] [CrossRef]
  59. Wang, Z.; Lu, M.; Wang, J.C. Direct rebound effect on urban residential electricity use: An empirical study in China. Renew. Sustain. Energy Rev. 2014, 30, 124–132. [Google Scholar] [CrossRef]
  60. Rafaj, P.; Amann, M. Decomposing air pollutant emissions in Asia: Determinants and projections. Energies 2018, 11, 1299. [Google Scholar] [CrossRef] [Green Version]
  61. Circular of the State Council on printing and distributing the 11th Five Year Plan for National Environmentalprotection. Available online: http://www.gov.cn/zhengce/content/2008-03/28/content_4877.htm (accessed on 8 May 2019).
  62. Circular of the State Council on Printing and Distributing the 12th Five Year Plan for National Environmental Protection. 12 May. Available online: http://www.gov.cn/zhengce/content/2011-12/20/content_4661.htm (accessed on 12 May 2019).
  63. Zhao, B.; Wang, S.X.; Liu, H.; Xu, J.Y.; Fu, K.; Klimont, Z.; Hao, J.M.; He, K.B.; Cofala, J.; Amann, M. NOx in China: Histor ical trends and future perspectives. Atmos. Chem. Phys. 2013, 13, 9869–9897. [Google Scholar] [CrossRef] [Green Version]
  64. Xu, S.C.; Zhang, W.W.; Li, Q.B.; Zhao, B.; Wang, S.X.; Long, R.Y. Decomposition analysis of the factors that influence energy related air pollutant emission changes in China using the SDA method. Sustainability 2017, 9, 1742. [Google Scholar] [CrossRef] [Green Version]
  65. Xu, S.C.; Zhang, L.; Liu, Y.T.; Zhang, W.W.; He, Z.X.; Long, R.Y.; Chen, H. Determination of the factors that influence increments in CO2 emissions in Jiangsu, China using the SDA method. J. Clean. Prod. 2017, 142, 3061–3074. [Google Scholar] [CrossRef]
  66. Zhang, W.; Wang, J.; Zhang, B.; Bi, J.; Jiang, H. Can China comply with its 12th five-year plan on industrial emissions control: A structural decomposition analysis? Environ. Sci. Technol. 2015, 49, 4816–4824. [Google Scholar] [CrossRef] [PubMed]
  67. Song, M.L.; Song, Y.Q.; Yu, H.Y.; Wang, Z.Y. Calculation of China’s environmental efficiency and relevant hierarchical cluster analysis from the perspective of regional differences. Math. Comp. Model. 2013, 58, 1084–1094. [Google Scholar] [CrossRef]
  68. Song, M.L.; Zhang, L.L.; An, Q.X.; Wang, Z.Y.; Li, Z. Statistical analysis and combination forecasting of environmental efficiency and its influential factors since China entered the WTO: 2002-2010-2012. J. Clean. Prod. 2013, 42, 42–51. [Google Scholar] [CrossRef]
  69. Song, M.L.; Song, Y.Q.; An, Q.X.; Yu, H.Y. Review of environmental efficiency and its influencing factors in China: 1998–2009. Renew. Sustain. Energy Rev. 2013, 20, 8–14. [Google Scholar] [CrossRef]
  70. Chen, J.D.; Song, M.L.; Xu, L. Evaluation of environmental efficiency in China using data envelopment analysis. Ecol. Indic. 2015, 52, 577–583. [Google Scholar] [CrossRef]
  71. Dong, K.Y.; Sun, R.J.; Hochman, G.; Li, H. Energy intensity and energy conservation potential in China: A regional comparison perspective. Energy 2018, 155, 782–795. [Google Scholar] [CrossRef]
  72. Tan, R.P.; Lin, B.Q. What factors lead to the decline of energy intensity in China’s energy intensive industries? Energy Econ. 2018, 71, 213–221. [Google Scholar] [CrossRef]
  73. Huang, J.B.; Du, D.; Tao, Q.Z. An analysis of technological factors and energy intensity in China. Energy Policy 2017, 109, 1–9. [Google Scholar] [CrossRef]
  74. Zeng, X.T.; Tong, Y.F.; Cui, L.; Kong, X.M.; Sheng, Y.N.; Chen, L.; Li, Y.P. Population-production-pollution nexus based air pollution management model for alleviating the atmospheric crisis in Beijing, China. J. Environ. Manag. 2017, 197, 507–521. [Google Scholar] [CrossRef]
  75. Wang, W.X.; Yu, B.; Yao, X.L.; Niu, T.; Zhang, C.T. Can technological learning significantly reduce industrial air pollutants intensity in China?—Based on a multi-factor environmental learning curve. J. Clean. Prod. 2018, 185, 137–147. [Google Scholar] [CrossRef]
  76. Zhou, Y.; Liu, Y.S. Does population have a larger impact on carbon dioxide emissions than income? Evidence from a cross-regional panel analysis in China. Appl. Energy 2016, 180, 800–809. [Google Scholar] [CrossRef]
  77. Du, G.; Liu, S.Z.; Lei, N.; Huang, Y. A test of environmental Kuznets curve for haze pollution in China: Evidence from the penal data of 27 capital cities. J. Clean. Prod. 2018, 205, 821–827. [Google Scholar] [CrossRef]
  78. Du, W.; Li, X.Y.; Chen, Y.C.; Shen, G.F. Household air pollution and personal exposure to air pollutants in rural China—A review. Environ. Pollut. 2018, 237, 625–638. [Google Scholar] [CrossRef] [PubMed]
  79. Liu, Y.F.; Zhang, Y.; Li, C.; Bai, Y.; Zhang, D.M.; Xue, C.Y.; Liu, G.Q. Air pollutant emissions and mitigation potential through the adoption of semi-coke coals and improved heating stoves: Field evaluation of a pilot intervention program in rural China. Environ. Pollut. 2018, 240, 661–669. [Google Scholar] [CrossRef]
  80. Chang, M.; Zheng, J.; Inoue, Y.; Tian, X.; Gan, T.T. Comparative analysis on the socioeconomic drivers of industrial air-pollutant emissions between Japan and China: Insights for the further-abatement period based on the LMDI method. J. Clean. Prod. 2018, 189, 240–250. [Google Scholar] [CrossRef]
  81. Chen, J.; Zhou, C.S.; Wang, S.H.; Li, S.J. Impacts of energy consumption structure, energy intensity, economic growth, urbanization on PM2.5 concentrations in countries globally. Appl. Energy 2018, 230, 94–105. [Google Scholar] [CrossRef]
  82. Wang, Z.H.; Feng, C. Sources of production inefficiency and productivity growth in China: A global data envelopment analysis. Energy Econ. 2015, 49, 380–389. [Google Scholar] [CrossRef]
  83. Xu, S.C.; He, Z.X.; Long, R.Y.; Chen, H.; Han, H.M.; Zhang, W.W. Comparative analysis of the regional contributions to carbon emissions in China. J. Clean. Prod. 2016, 127, 406–441. [Google Scholar] [CrossRef]
Figure 1. Effects on China’s air pollution emissions (APEs) at a national level from 2005 to 2015.
Sustainability 11 07113 g001
Figure 2. (a) Contributions of regional emission efficiency effect to China’s APEs at a multi-regional level from 2005 to 2015; (b) Contributions of regional energy intensity effect to China’s APEs at a multi-regional level from 2005 to 2015; (c) Contributions of regional population structure effect to China’s APEs at a multi-regional level from 2005 to 2015; (d) Contributions of regional relative income effect to China’s APEs at a multi-regional level from 2005 to 2015; (e) Contributions of national economic growth effect to China’s APEs at a multi-regional level from 2005 to 2015.
Sustainability 11 07113 g002aSustainability 11 07113 g002b
Figure 3. Energy consumption per 104 Renminbi (RMB) GDP for Shanxi, Shandong, Jiangsu, Henan, Hubei, Hunan, Liaoning, and Xinjiang from 2007 to 2009.
Sustainability 11 07113 g003
Figure 4. Industrial proportion for Shandong, Hubei, Hunan, and Chongqing from 2005 to 2007.
Sustainability 11 07113 g004
Figure 5. Energy consumption per 104 RMB GDP for Guangxi, Ningxia, Qinghai, and Xinjiang from 2009 to 2013.
Sustainability 11 07113 g005
Figure 6. Regional relative income from 2005 to 2015.
Sustainability 11 07113 g006
Figure 7. Regional industrial proportions from 2005 to 2015.
Sustainability 11 07113 g007
Figure 8. Regional waste-gas treatment facilities from 2005 to 2010.
Sustainability 11 07113 g008
Figure 9. Regional waste-gas treatment investments from 2005 to 2015.
Sustainability 11 07113 g009
Table 1. Definition of variables.
VariableDefinition
APTotal air pollutants
APiAir pollutants from region i
EiFossil energy use for region i
GNational GDP
GiRegion i’s GDP
PNational population
PiPopulation in region i
APIiAir pollutant emission efficiency for region i
EIiEnergy intensity for region i
PIiPopulation proportion for region i
RIiGDP per capita for region i
NINational GDP per capita
Table 2. Data for the variables used in the study.
VariableDefinitionUnit
Regional emission efficiencyAir pollutants divided by fossil energy use for a certain region104t/tce
Regional energy intensityFossil energy use divided by GDP for a certain regiontce/104RMB
Regional population structureRatio of regional population to the national total%
Regional relative incomeRegional income per capita divided by national income per capita
Table 3. The trend of reducing the effect of regional emission efficiency on APEs.
SO2Northern RegionEastern RegionCentral RegionSouthern RegionSouthwestern RegionNorthwestern RegionNortheastern
Region
2005–2007🠋🠋
2007–2009🠋🠋🠋🠋🠋
2009–2011🠋
2011–2013
2013–2015
NOxNorthern RegionEastern RegionCentral RegionSouthern RegionSouthwestern RegionNorthwestern RegionNortheastern
Region
2005–2007
2007–2009🠋
2009–2011🠋🠋
2011–2013
2013–2015
PM2.5Northern RegionEastern RegionCentral RegionSouthern RegionSouthwestern RegionNorthwestern RegionNortheastern
Region
2005–2007🠋🠋🠋🠋🠋
2007–2009
2009–2011🠋🠋🠋🠋🠋🠋🠋
2011–2013
2013–2015
Note: The up arrow and down arrow represents the promoting and curbing effect on APEs, respectively. The thick arrow, thin arrow, and dotted arrow describe the strong, average, and slight effect, respectively.
Table 4. The trend of reducing the effect of regional energy intensity on APEs.
SO2Northern RegionEastern RegionCentral RegionSouthern RegionSouthwestern RegionNorthwestern RegionNortheastern
Region
2005–2007🠋🠋
2007–2009🠋🠋🠋🠋
2009–2011🠋🠋🠋🠋
2011–2013🠋🠋🠋🠋
2013–2015
NOxNorthern RegionEastern RegionCentral RegionSouthern RegionSouthwestern RegionNorthwestern RegionNortheastern
Region
2005–2007
2007–2009🠋🠋🠋
2009–2011🠋🠋🠋🠋
2011–2013🠋🠋🠋🠋🠋
2013–2015
PM2.5Northern RegionEastern RegionCentral RegionSouthern RegionSouthwestern RegionNorthwestern RegionNortheastern
Region
2005–2007🠋🠋🠋🠋🠋
2007–2009🠋🠋🠋
2009–2011🠋🠋🠋🠋🠋🠋
2011–2013🠋🠋
2013–2015
Note: The up arrow and down arrow represents the promoting and curbing effect on APEs, respectively. The thick arrow, thin arrow, and dotted arrow describe the strong, average, and slight effect, respectively.

