Article

Measuring Urban Spatial Activity Structures: A Comparative Analysis

1
School of Landscape Architecture, Zhejiang Agriculture & Forestry University, Hangzhou 311311, China
2
Department of Land Management, Zhejiang University, Hangzhou 310058, China
3
Division of Forestry & Natural Resources, West Virginia University, Morgantown, WV 26506, USA
4
Hangzhou City Planning & Design Academy, Hangzhou 310012, China
*
Authors to whom correspondence should be addressed.
Sustainability 2019, 11(24), 7085; https://doi.org/10.3390/su11247085
Submission received: 18 November 2019 / Revised: 9 December 2019 / Accepted: 9 December 2019 / Published: 11 December 2019

Abstract

:
Human activity recognition has been of interest in the field of urban planning. This paper established a general framework by which expected human activity intensity (HAI) measured by the built environment and factual HAI measured by the Baidu thermal chart were estimated and comparatively analyzed so as to identify abnormal human activities in Hanghzou, China. Three elements of the built environment (i.e., residential density, road connectivity, and land-use mixing degree) from multi-source data with high precision are selected to assess the expected HAI. Results indicate Hangzhou has evolved into a polycentric city with three urban clusters. In addition, a significant positive correlation exists between the two types of HAIs. However, there are areas with spatial mismatches, particularly in the “urban village” and new towns, suggesting human activities are not equally distributed all over the city. Research implications, limitations, and future research needs are discussed.

1. Introduction

With increasing urbanization and population growth, there is an excessive demand for natural resources, resulting in the earth’s environment and ecosystem being under increasing pressure from human activities [1,2]. This is particularly true for large cities where human activities are highly concentrated with limited resources [2,3]. It is found that excessive human activities have not only led to serious environmental problems such as air pollution and degradation of ecosystem services [4,5], but have also caused many other social and economic problems, including occupational and residential segregations, increased inequality, and impairment of spatial fairness [6,7]. It is no wonder that the impact of human activities on both the natural and built environments has been extensively examined in the literature, wherein the concept of human activity intensity (HAI) has been proposed as a measure of the extent by which land surface has been affected by human activities.
While HAI is a function of the built environment or spatial configuration as will be discussed in the latter part of this paper, human activities also influence the formation and development of the urban spatial patterns [8] or reflect the land-use types [9]. For example, Pan and associates [8] developed a Land-use Evolution and Impact Assessment Model (LEAM) and used it to simulate land-use change (i.e., future commercial and residential development) for Chicago and Stockholm, based on biophysical and socio-economic factors. Another study by Liu, Kang, and Liu [9] used big data (mobile phone records and tax trips) in Shanghai to understand and classify the land-use of parcels, finding that people’s spatial movements are closely related to land uses and thus can be used to identify urban clusters (i.e., urban commercial and business area, business and industrial area, civic and transportation land-use, urban residential area, etc.)
Arguably, quantifying HAI in an urban area could be more challenging than in a natural environment, in that human activities in the urban area are more complex and dynamic [2], and thus more difficult to measure [2,10,11]. As a result, over the past 20 years, methods developed to measure human activities in natural settings such as land-use intensity [12,13,14] and human footprint have been adopted as alternatives for measuring HAI in cities [12,13,14,15].
Since the spatial distribution of HAI is usually heterogeneous, accurately quantifying the spatial distribution characteristics of HAI is essential for the fine-scale management of cities. Thus, methods developed for measuring HAI on a large spatial scale (e.g., at the regional, national or even global levels) may lack the measurement accuracy at a finer scale (e.g., at the district or neighborhood level of a city), making the research results less useful for urban planners and/or decision-makers.
While research on the direct measure of HAI in cities is still limited, there are a plethora of studies that have used big data to reveal individuals’ spatial and temporal movements and clustering patterns in cities [2,16]. Thus, analyzing individuals’ spatial movement patterns using big data in an urban area is another way to measure HAI in cities. One type of such big data is the Baidu thermal chart (BTC), which can provide representative information on human movements with a huge sample volume and a much finer temporal-spatial scale, making it possible to directly characterize the actual dynamics of human activities in cities [17,18].
Although location-based data such as BTC can accurately illustrate the spatial movement patterns of individuals in cities, it is still unclear if HAI obtained from BTC is spatially distributed in a reasonable manner. Understandably, human activities may largely concentrate in the urban core where infrastructure services are most conveniently located. However, there are urban places that may exist with an abnormal HAI, whereas the concentration of human activities may be unusually higher (i.e., heavy traffic congestions) or lower (i.e., the so-called “ghost city” or “empty city”) than expected/planned [19]. In other words, a gap may exist between what is planned/developed and what is actually used. This should deserve special attention from the perspectives of both planners and decision-makers, given the highly competitive nature of land-use in cities, particularly in the context of China, a country that has experienced rapid urbanization in recent decades with numerous towns and cities of different sizes being developed/expanded across the country. Concomitant with this rapid urbanization is the increasing conversion of agrarian lands into urban areas on the one hand and increasing shrinking and underuse of some cities on the other (i.e., “ghost cites” noted above). A recent study shows that nearly 30% of Chinese cities are shrinking based on the monitoring of the intensity of night lights between 2013 and 2016 [20].
Lew and McKercher argue that individuals’ movement within a destination is determined by the built environment of the destination and individuals’ personal characteristics [21,22]. Previous studies have reported that a high correlation exists between the urban built environment and HAI [2,13,22,23,24]. For example, land-use and transportation planning have proven to have a large impact on people’s choice of travel modes as well as on their social and entertainment activities [24,25]. It can be inferred that built environments can play a guiding and restrictive role in regulating human behavior. In this sense, HAI for a city can exist in two forms: one measured by the built environment (expected HAI) and one measured by the actual behavior of individuals within the built environment (factual HAI).
As aforementioned, the expected HAI can be highly correlated with factual HAI. However, the relationship between the two may not be always one-directional and positive. That is, a higher expected HAI may relate to a lower factual HAI or vice versa. Thus, it is important and necessary to examine both types of HAIs so that a gap, if any, can be identified for the better planning and management of a city. Previous studies have either examined the expected HAI or the factual HAI, few, if any, have simultaneously examined the two. In view of this, the objective of this paper is to examine and compare expected HAI and factual HAI in the city of Hangzhou, one of the most vibrant sub-provincial cities in China. Specifically, this study aims to answer the following three questions:
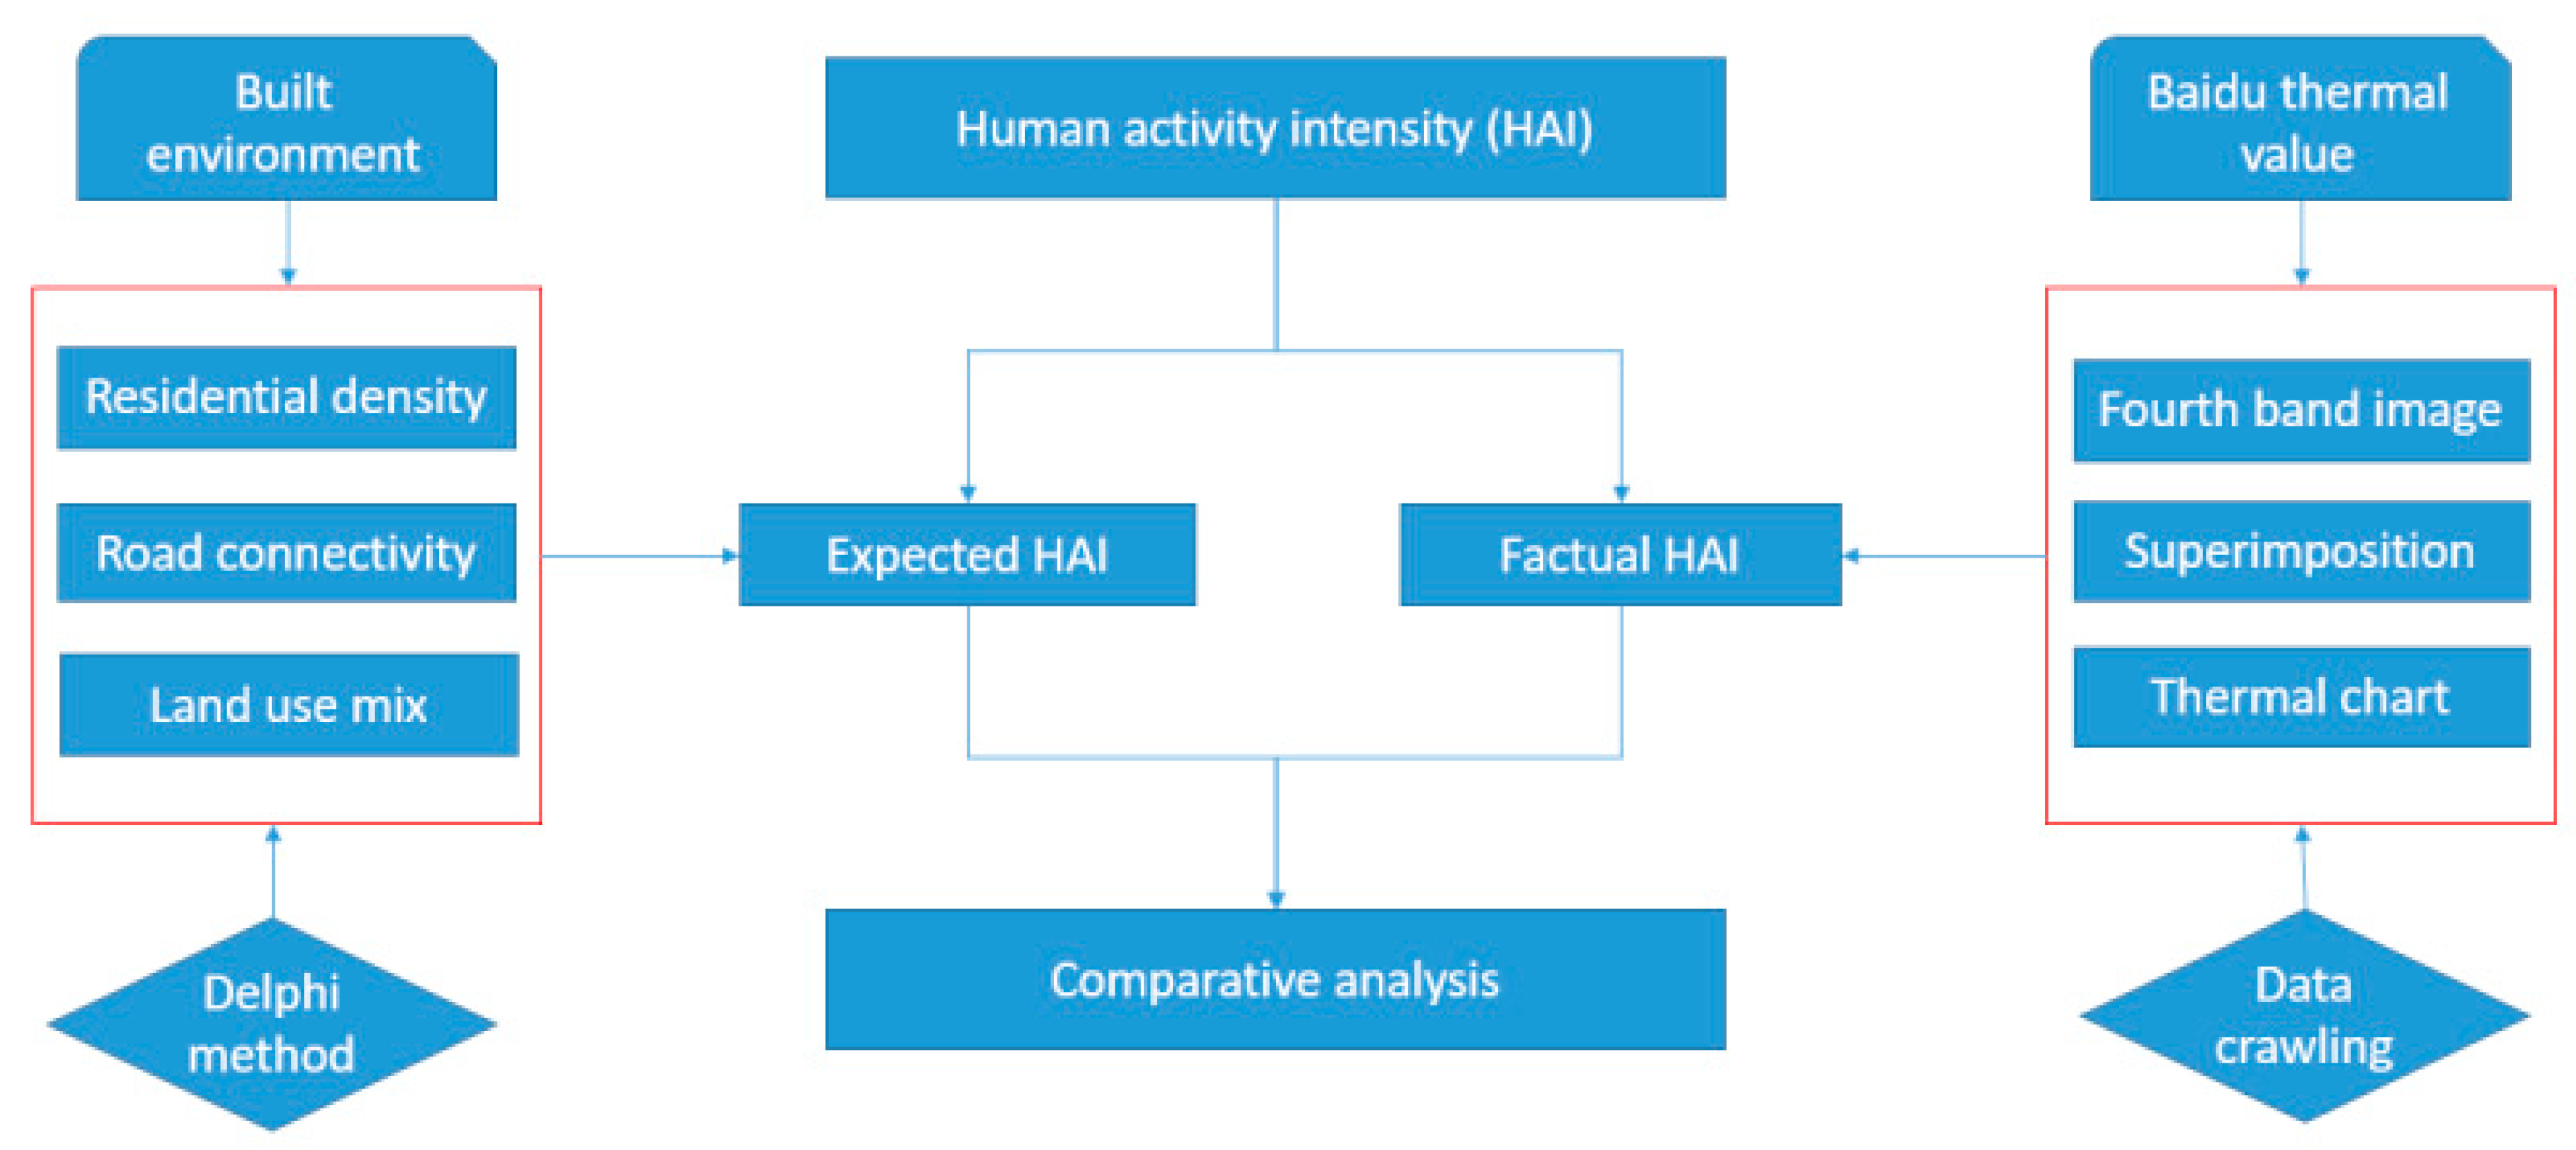
  • What is the best approach to estimate expected HAI in the city?
  • How the factual HAI in the city can be calculated using big data from Baidu? and
  • Are expected HAI and factual HAI highly correlated with each other? Or in other words, to what extent does the expected HAI (a reflection of the city’s spatial configuration/built environment) match the factual HAI (a measurement of people’s spatial movements in Hangzhou)?
It is hoped that areas with unusual HAI can be identified and corresponding strategies for these areas can be developed by comparing the two types of HAIs. It is also the authors’ hope that more studies would be conducted in the future to compare the two types of HAIs in other cities of China and abroad.
The rest of this paper is organized as follows. Section 2 reviews relevant literature on the two types of HAIs. Section 3 introduces methods used Section 4 presents the results for both expected and factual HAIs, Section 5 discusses findings by reference to the relevant literature. Finally, Section 6 wraps up the paper by presenting the main conclusions along with research limitations and future research needs.

2. Literature Review

2.1. Conceptual Frameworks

Two conceptual frameworks, Space Syntax and time geography, have been used to examine spatial and temporal patterns of human activities in an area. Space Syntax considers “space as relatedness, and as it is, and might be, created by buildings and cities, and as it is experienced by the people who use them” [26]. Inferred from this theory, people’s spatial behaviors are constrained to a large extent by how space is laid out. For instance, a garden with only one accessible entrance would receive fewer visits than a park with multiple entrances. Thus, it is anticipated that HAI measured by actual human movements and patterns (factual HAI) would be highly related to and dependent on HAI determined by the built environment (expected HAI).
While the Space Syntax emphasizes the importance of spatial configuration in shaping an individual’s spatial behavior, the actual movement of an individual within a given spatial domain is largely constrained by time and other socio-demographic/economic factors. This so-called time-geography is a conceptual framework developed by Torsten Hagerstraand and his students [27] for analyzing individuals’ time-space behavior. Generally, an individual tends to visit as many places/attractions as possible within a limited time period. Thus, an individual’s spatiotemporal movement patterns are a function of the spatial configuration (i.e., road networks, buildings, etc.), available time, and other factors. Specifically, within a given time-space domain, an individual’s behavior is subject to three types of constraints: capability constraints (i.e., physical needs and abilities), coupling constraints (i.e., alignment and adjustment with other individuals’ needs), and authority constraints (i.e., conformity with laws and norms).

2.2. Expected HAI

As aforementioned, expected HAI is conceptually linked to the Space Syntax theory, and thus its calculation reflects the expected intensity of human activities determined by the physical attributes of a space. Several studies at the regional/national scale have used a variety of spatial attributes to estimate the expected HAI. For example, one paper [28] used three physical attributes—roads, residential settlements, and terrain to calculate the HAI in the upper reach of Minjiang River, China. Some other studies used both the spatial attributes (e.g., size of urban area, density of roads, and slope) and other social, economic, and environmental attributes to calculate HAI [29,30,31]. While a simultaneous consideration of both spatial attributes and non-spatial attributes may be more effective to reflect the HAI for a region as argued by Zheng and his associates [32], such consideration lacks the theoretical foundation as they measure different things, where a causal relationship may exist between the spatial configuration and associated socio-economic activities, resulting in a confounding effect in the HAI calculation.

2.3. Factual HAI

As aforementioned, factual HAI, which reflects the actual human use of urban areas, can be estimated using big data. Thus, a review of using big data to examine people’s spatial movements and patterns in a city deems necessary. People’s movements in a destination can take many different forms, which can be broadly classified into four themes [32]: a single destination with or without side trips, transit leg and circle tour at a destination, circle tour with or without multiple access/egress points, and hub and spoke style. In a metropolitan area, major movement patterns are also named “daily mobility motifs” in urban and transportation planning terms (e.g., home→work→home, home→work→shop→home, home→drop off→work→pickup→home, etc.) [33]. Although people’s movements around a city can be “highly structural-organized by a few activities essential to life” (p. 212) [33], many factors, including the built environment (e.g., spatial configuration), environmental circumstances (e.g., weather), socio-demographics and trip characteristics (e.g., repeaters vs. first-timers, commuters vs. visitors), transportation modes, and perceptions/motives, can largely affect an individual’s behavior. Thus, mapping/modeling/predicting people’s spatial movements is a daunting task, and it deems necessary and important to choose a method that is most appropriate for a study purpose.
There are different ways by which people’s spatial movements in a city can be examined. The traditional way of using pencil-paper questionnaires or travel diaries has been gradually phased out [33,34], or incorporated with more advanced approaches of data collection based on GPS devices, social media, and other big data platforms (e.g., Google, Baidu). However, each method has its own pros and cons. For example, while GPS devices can provide information on an individual’s geolocations, it is difficult to maintain a high level of accuracy of individuals’ locations in urban areas, particularly in cities with high skyscrapers and small venues [34]. Other disadvantages involving the use of GPS devices include study sample sizes being usually small and movement patterns being fundamentally constrained by where survey sites are located (e.g., hotels) [35], resulting in findings being less generalizable. In addition, researchers are increasingly concerned about the ethical aspects of tracking people’s movements using GPS [36].
It seems that the disadvantages inherent to the use of GPS for tracking people’s movements do not apply to online social media, mobile social media, mobile phone data, and other big data platforms such as Google and Baidu, although these big data approaches may also be limited in some other ways. For instance, it is argued [34] that the mobile social media approach is advantageous over the online social media approach, in that the former can provide “detailed contextual information” (p. 2) about an individual’s activities while the latter cannot. As with mobile social media, activity-based mobility patterns can also be extracted using the mobile phone call detail record (CDR) data [33] which can be “obtained at a much lower cost and on a greater scale” (p. 209). However, the accuracy of extracted patterns largely depends on data available from mobile carriers. Obviously, data from one mobile carrier are not enough to reflect the whole picture of people’s movements while obtaining data from more or all service carriers may be logistically complex at a much higher cost. Thus, it is ideal to have a dataset that is rich in information, easily accessible, free or at a low-cost. Baidu is such a desired big data source as described below.
As the largest Chinese search engine, Baidu Company launched Baidu Thermal Value (BTV), Baidu Street Images, Baidu Index, Point of Interests (POIs) and so on, which are publicly available at no cost. Of these tools, BTV is powerful to analyze people’s spatial clustering patterns based on the massive data collected from cell phone users. Compared with the traditional data, the data provided by the Baidu search engine has the advantages of real-time and spatial characteristics. Several studies have used BTV to examine the extent of population agglomeration, associated spatial and temporal behavior [37,38,39]. Specifically, the spatial pattern of the urban population in China can be expressed by BTV, population movement data can be represented by Baidu migration data, and the hot issues of concern to residents can be expressed in the Baidu index [37,38,39]. Given its wide applications, BTV was chosen in this paper to examine the spatial patterns of human movements in Hangzhou.

3. Methods

3.1. Study Area

Located in the Yangtze River Delta and 180 km southwest of Shanghai, Hangzhou, the capital of Zhejiang province, is one of the most urbanized cities in China. The city proper has a total administrative area of 16,596 km2 and a total population of 9.01 million in 2015, including 10 urban districts that cover an area of 3068 km2. The inner suburb includes six districts (i.e., Shangcheng and Xiacheng, Xihu, Gongshu, Jianggan, and Binjiang), and the outer suburb consists of four outside urban districts, namely, Yuhang, Xiaoshan, Fuyang, and Linan. These four districts were not included in the city proper until 2001, and still, have a large area of land being rural with a lower population density. This paper focuses on the city’s inner suburb as the study area. According to the urban master plan of Hangzhou, two main centers (i.e., Wulin commercial circle and Qianjiang new city commercial circle) and two subcenters (i.e., Xisha and Jiangnan) are also located in this study area. In 2016, the average population density in this area is 50 people per ha, which is relatively high. The road density is 83 m per ha and the industrial land-use is relatively small in size (only accounting for 6.83% of the total area). Since the study area features diverse land uses for residential, leisure, commercial and administrative purposes, it offers an excellent case for studying HAI.
In order to better observe the spatial distribution of HAI, the study area was divided into regions centered on the main core of the Hangzhou. According to the radius interval of 5 km, the study area was divided into five circular areas from inside to outside (see Figure 1). From inside out, the five circles are named Circles I, II, III, IV, and V, respectively. Among them, the Binjiang subcenter is located in circle II, and the Xiasha subcenter is located in circle IV.

3.2. Data Collection and Data Analysis

As aforementioned, this study involves two types of HAIs: expected HAI and factual HAI, with the former related to the built environment and the latter to people’s actual spatial movement and distribution. To be consistent with the literature, in this paper, prioritization weights for expected HAI were determined by a panel of experts while factual HAI was estimated based on BTV. The two HAIs were then compared statistically to determine the differences, if any. Figure 2 shows this analytical flowchart.

3.2.1. Determination of HAI Indicators and Associated Weights

The Delphi method, a widely used qualitative method that can be used for deriving weights, was adopted in this study. While it is a common practice to apply the method to “achieve consensus of opinions or forecasting, whereas the next round of survey is largely built upon the previous one”(p. 225) [40], the method has evolved into many different forms, including the one that involves determining indicators in the first round, followed by determining weights of each indicator in the second round [40]—an approach used in this study. Specifically, the Delphi method used in this study involves four steps. First, a panel of 30 experts with expertise on big data, urban planning, and the urban spatial structure was identified from six universities and four planning and design institutes. Second, a questionnaire was developed by drawing upon findings from the literature. This questionnaire consists of two sections: participating experts’ background information and HAI indicator candidates. Third, the questionnaire was mailed to all 30 experts, who were asked to verify or modify HAI indicators, if necessary. Finally, after HAI indicators were identified in the first round, expert panelists were then asked to assign weights (from 0 to 1) to each indicator in the second round.

3.2.2. Expected HAI (Inferring HAI based on Built Environmental Metrics)

Built environments usually refer to a variety of terms in different subfields of urban planning, which makes it a multidimensional concept [41,42]. The rise of new urbanism, which aims to ease urban problems caused by urban sprawl through urban design and planning [43], brings instructive enlightenment to the evaluation of HAI. According to the viewpoints of neo-urbanism scholars and the latest research progress [44,45], the built environment represented by residential density, road connectivity, and land-use mix were selected to infer human activities [46,47,48]. While the posted speed of roads or walking speed has also be used in some studies to examine human movements in urban areas [49], the driving or walking speed was not considered in this study for three reasons. First, the expected HAI in this study is estimated based on the built environment following the theory of Space Syntax, which does not consider the speed-flow relationship of people’s movement patterns. Second, the posted speed does not guarantee uniform operating speeds, making it less accurate and predictable in estimating people’s spatial movements. Finally, the speed limits in Hangzhou city do not vary too much from district to district, and thus can be considered homogenous across different districts within the city boundary.

Residential Density

Residence is the most basic function for urban dwellers, and residential density is the most direct and representative element of the urban built environment [50,51], which largely determines the spatial distribution of HAI in a city. New urbanists support a compact, high-density residential pattern, while low-density diffusion may cause a waste of land, energy and other resources [52].
In this study, the residential population at the neighborhood level in 2016 was adopted, based on the census data provided by the Hangzhou Statistical Bureau. The continuous population density distribution was obtained using the Kriging interpolation method.

Road Connectivity

For a long time, people living in big cities have relied heavily on cars for various travel activities, which limits the activities of the elderly and children who cannot drive [41]. The theoretical literature of New Urbanism argues that the irregular grid road system contributes to the change of the traditional car-dominated mode of travel [53]. With the regional traffic station as the center and the suitable walking distance as the radius, a community will have less traffic volume and better walkability. Therefore, road connectivity (RC) has a very significant impact on community vitality, and to a certain extent determines people’s travel choices.
The road data used in this study were also crawled from the Baidu map, which contains main roads, secondary roads, branch roads, expressways, and highways. In this study, road connectivity was measured by two indicators: road density (RD) and road point density (RPD). RD refers to the ratio of the length of the total road network to the land area within a defined range, which, to some extent, can reflect the development status of the urban traffic road infrastructure [43]. RPD refers to the ratio of the number of points to the area in a certain range while the urban road points are the intersections and junctions between roads in a city [54,55], which reflects the degree of the road patency. Therefore, RC has been assessed to identify the road conditions and convenience of travel in the city by combining the above factors. As can be seen from the formula below, it would be more convenient for people to travel when RC is higher, and less convenient if some roads of the city are blocked. The calculation formula is as follows:
RC = ω1*RD + ω2*RPD
where RC refers to road connectivity, RD and RPD refer to road density and road point density, respectively, ω is the weight.

Land-Use Mix Degree

A mixed-use community has been proved to have a positive relationship with HAI, which refers to the heterogeneity of land uses in geographically-defined areas [42]. Generally, people living in a community with diverse land uses may be more likely to engage in a variety of activities because of their proximity to non-residential areas (such as commercial, institutional, industrial, and recreational locations). Under such circumstances, more intensive and diverse human activities would be observed.
The land-use data in 2016 were revised by combining the map of Google in 2016 with the map in 2014 provided by the city’s Urban Planning Bureau. According to the Bureau’s classification system of urban land uses, there are 15 types of land uses in the study area (see Figure 3).
The study area was divided into grids of 500 m × 500 m, which reflects the diversity of urban surface in more detail [45]. Entropy index, commonly used in the land-use-travel literature [46,47], was used to calculate land-use mix (LUM):
LUM = i = 1 n ( p i · ln p i )
where LUM refers to the land-use mix, n denotes the number of land-use types, and pi is the proportion of land-use type i among all POIs in a single grid. A higher LUM value indicates a higher degree of mixed land-uses, which means that people are more likely to carry out diverse activities within a relatively small area.
Finally, all the metrics were uniformed into grids of 500 m × 500 m using the kernel density approach. The value of each index was linearly rescaled to fit the range 0–1 [30]. The HAI was calculated based on the weights of the three indexes using the following formula:
HAI = ω1 × PD + ω2 × RC + ω3 × LUM
where, HAI denotes human activity intensity, PD, RC, LUM refer to population density, road connectivity, and land-use mix, respectively, while ω1, ω2, and ω3 are associated weights.

3.2.3. Factual HAI (HAI based onBTV)

In this section, BTV is used to describe the spatial distribution of HAI. It is the world’s first free intelligent thermal diagram launched by Baidu company (China’s version of Google) in 2011, and mobile phone users are the main souRCe of its data acquisition [39,56]. Specifically, it collects large volumes of recoRDs that describe where and when a person is exposed through various location-aware apps (such as Baidu maps, QQ, WeChat, weather, etc.). Then a “thermal index”, which represents the level of population crowding and their distribution [57], is rendered with color and visualized on Baidu maps (a desktop and mobile web mapping service application and technology provided by the Baidu company).
The chart was crawled hourly on 14 May 2017 (Sunday) from https://map.baidu.com/. The raw data is preprocessed, that is, the fourth band of the Baidu thermal image is selected for each hour and the data of each time period are superimposed to get the accumulated thermal chart of the day.

4. Results

4.1. Weights Determined Using the Delphi Method

All 30 experts returned their filled questionnaires, including 18 from higher education institutions and 12 from other planning and design institutes. Based on responses from these 30 panelists, the weight for PD, RC, and LUM is 0.2, 0.3, and 0.5, respectively, while RD and RPD are equally important, with a weight of 0.5 for each.

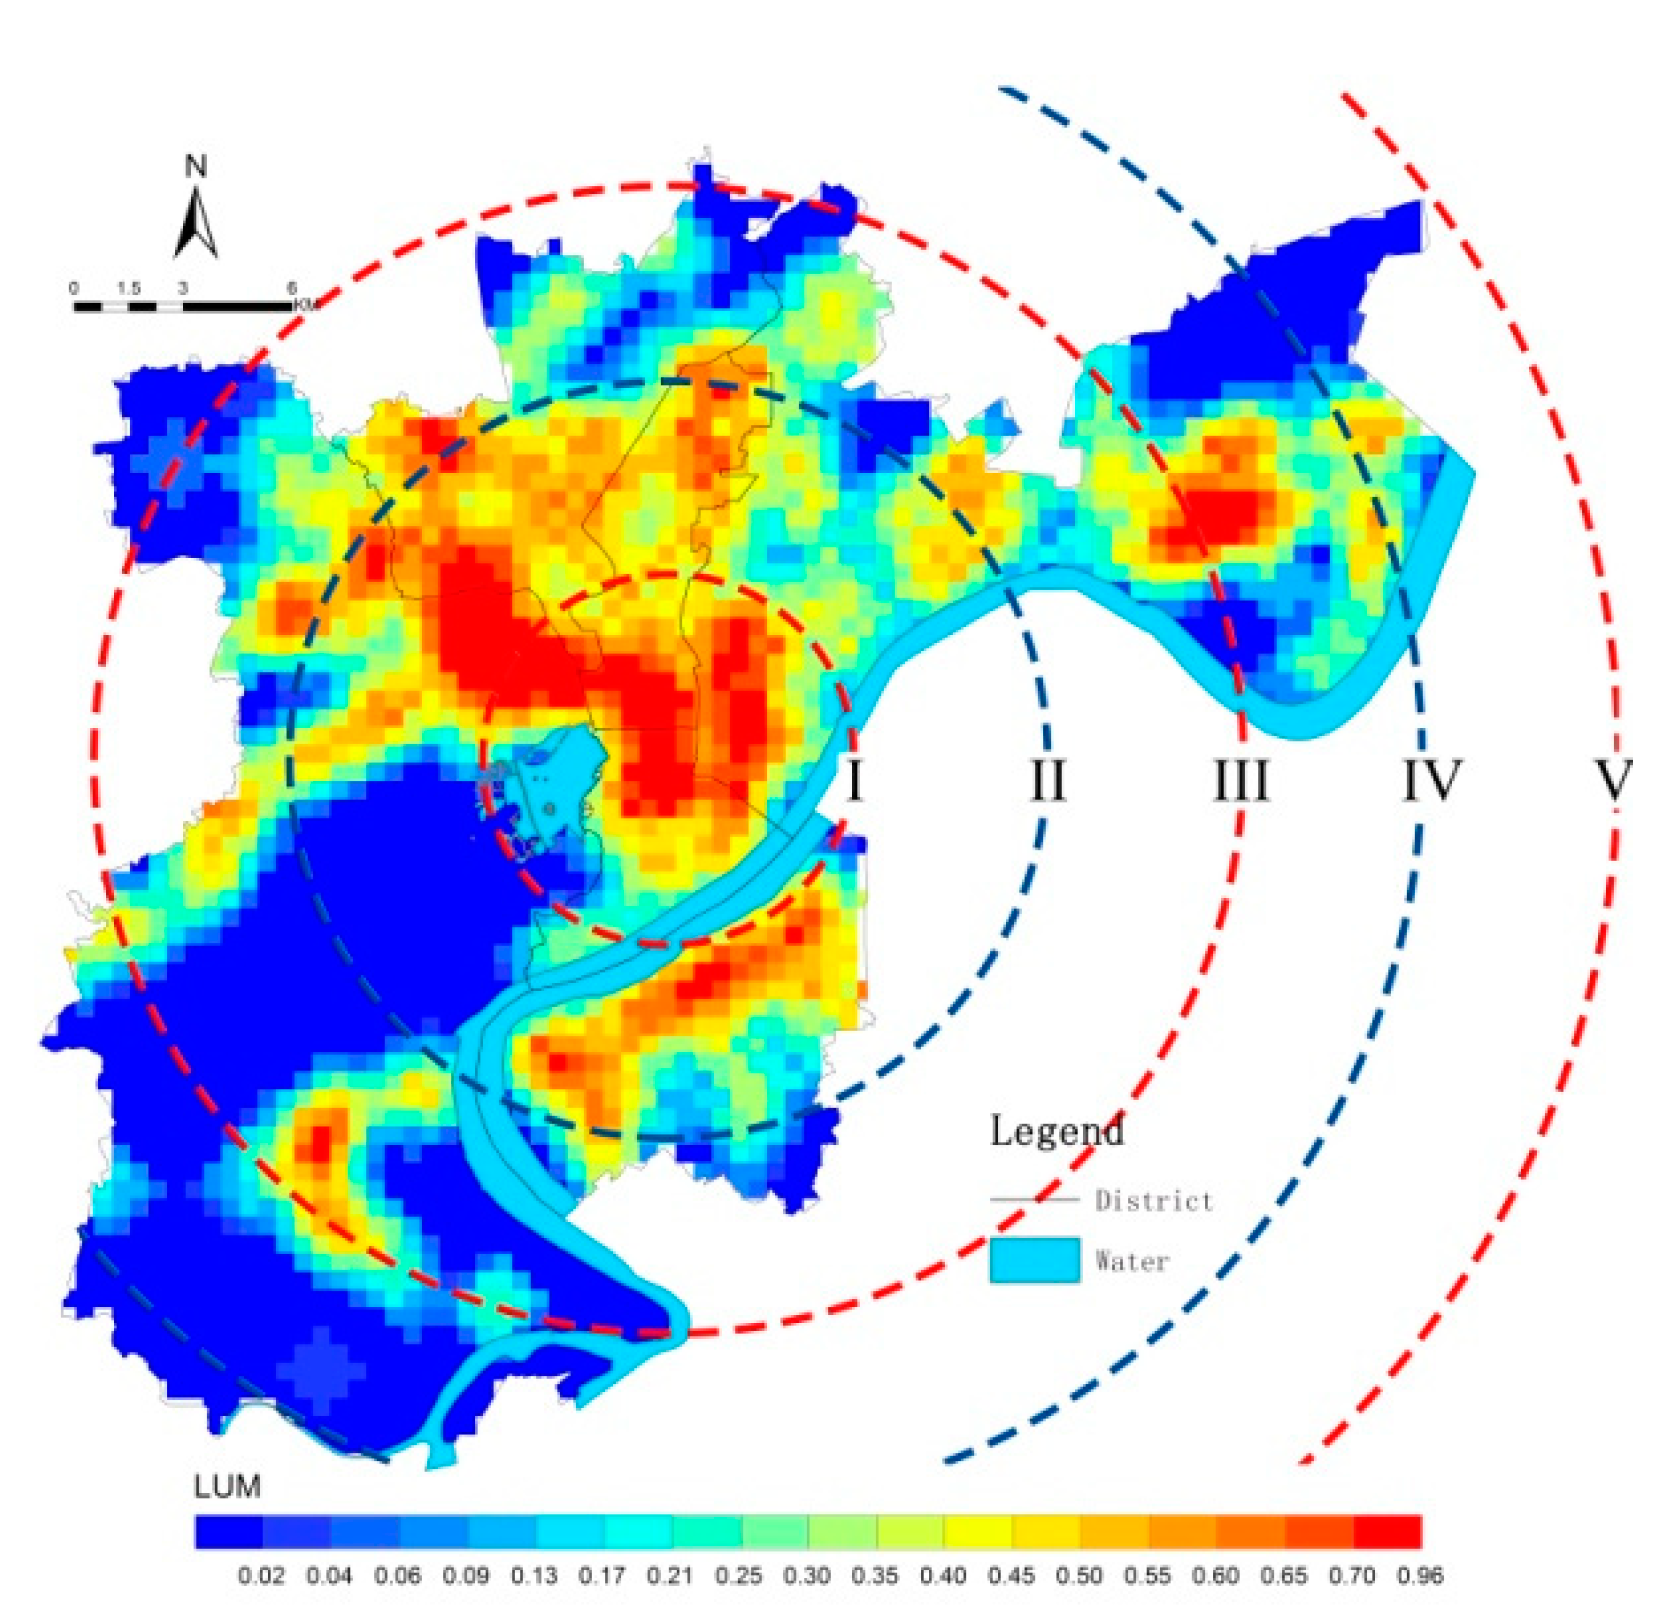
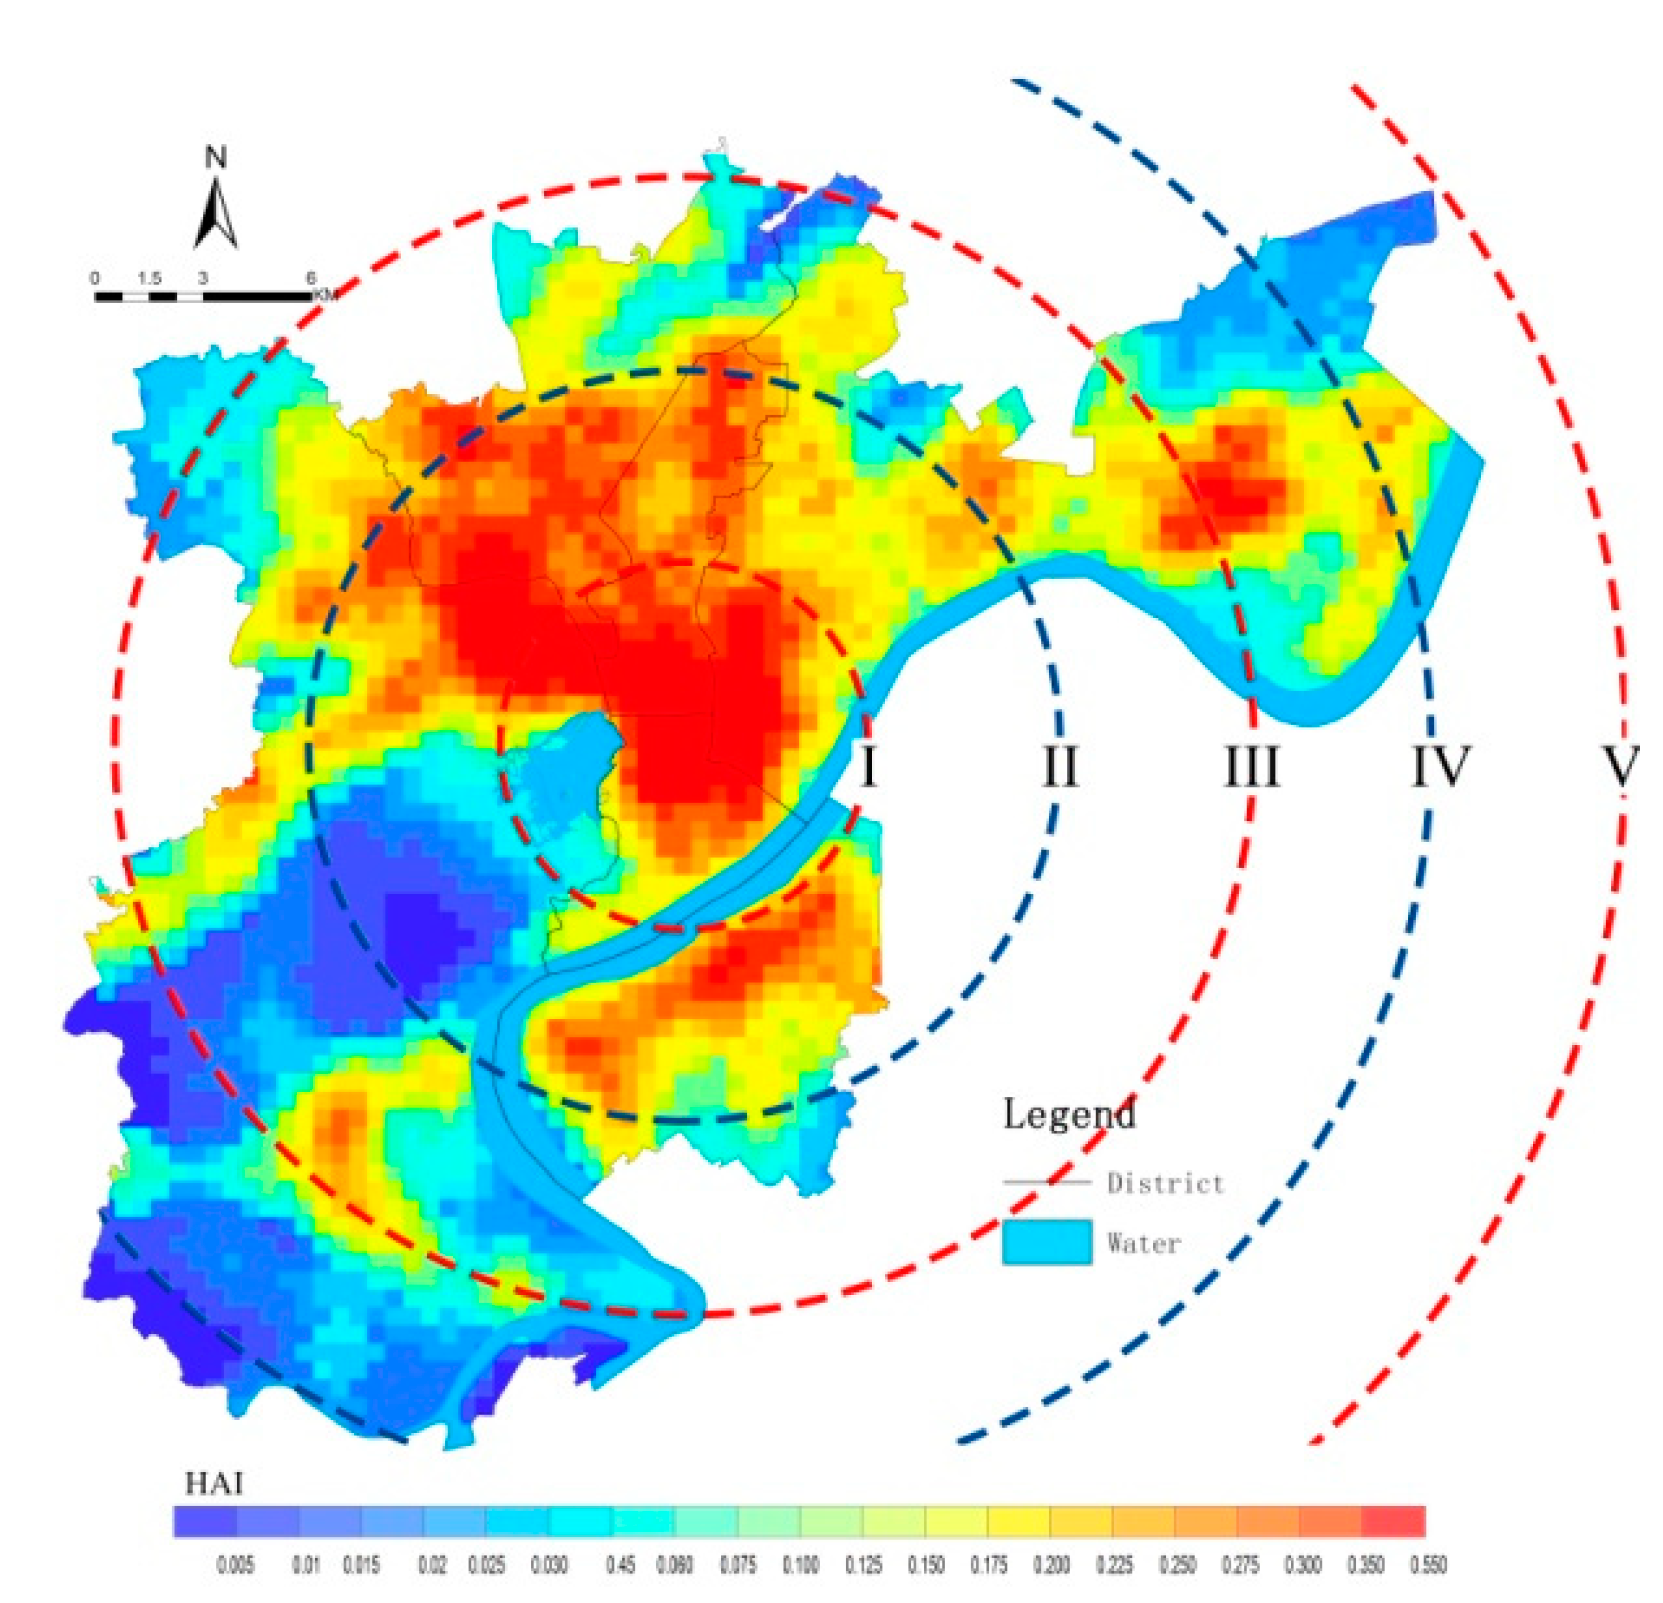
4.2. Expected HAI Estimated through the Built Environment Elements

In this section, the distribution pattern of a single factor and the comprehensive distribution of HAI are depicted. First, the residential density shows an obvious layer distribution pattern, which gradually decreases to the periphery with the West Lake-Wulin business circle as the center (see Figure 4). As indicated in Table 1, the residential density of Hangzhou varies from seven people per ha to 745 people per ha. Specifically, population clusters with a higher density are concentrated in the north and east of the West Lake, which is the heart of the city, and mainly belongs to Circle I and the northwest part of Circles II and III. On the contrary, the average population density in the Circles IV and V is relatively low due to the large coverage of hills, wetlands, and farmlands in the areas.
Second, several hot spots have emerged as measured by RC, including the surrounding area of the West Lake (where Zhejiang provincial government, former Hangzhou municipal government, and the Wulin commercial circle are located), the East Railway Station and the intersection of Desheng Expressway, and Qiushi Elevated Road (see Figure 5). Taking the urban function into account, it is found that the hot spots are mainly concentrated in the comprehensive commercial service area, transportation hubs, administration centers, and other areas where people tend to flow in.
Third, the land-use mix degree in the central area is significantly higher than that in the surrounding area. However, different from the layer distribution of residential density, it is worth noting that the land-use mixing degree in the subcenters are also relatively high, and the subcenters are connected in strips through traffic lines (see Figure 6).
Finally, Figure 7 shows the distribution of HAI combined from the above three factors. There is a large cluster with a high HAI value in the urban core, and a small cluster-like pattern in subcenter of Xiasha, while the subcenter of Binjiang has formed a linear-shape along the Qiantang River. It can be concluded that Hangzhou has formed a polycentric pattern as shown by the spatial distribution of the HAI values. Table 2 reveals that there are several areas with HAI values greater than 0.23 in the first four circles. It is worth noting that areas within Circle I with HAI values greater than 0.23 account for more than 50%.

4.3. Factual HAI Estimated based on Baidu Thermal Value

The Baidu thermal chart characterizing HAI presents an obvious uneven pattern, namely a large dispersion coexists with small agglomerations and areas with high and low values are interlaced (see Figure 8). Large dispersion means land uses with low HAI values dominate the area, while small agglomerations refer to the high-value aggregations with punctate and linear forms. In particular, the spatial distribution pattern of high-value areas is characterized by the following three aspects. First, it generally presents a spatial form of “one main body, two pairs” that the comparative advantage of the main center is not significant. Second, it spreads along expressways and main roads (e.g., the agglomeration along the expressways of Desheng, Qiushi, Liushi, and Zhonghe). Third, the HAI with high values is more prominent at road intersections, universities, and scenic spots (including Huajiachi campus of Zhejiang University in Jianggan district, scientific research and education area in the Xiasha district, Zijingang campus of Zhejiang University, and Xiangshan campus of China Academy of ArtsinXihu district, as well as Xixiwetland, the West lake, Songcheng, and Leifeng pagoda), where feature an open green environment and a high-level humanistic atmosphere. On the contrary, places with low HAI values are concentrated in a large area of natural mountain forests on the southern West Lake and the outskirts of the city (including Xiasha and Qiaosi farms in northeastern Circle III, Banshan and Gongqiao community in north of Circle II, Zhuantang and Shuangpu community in western south of Circle III).
Table 3 presents the distribution of Baidu thermal values in each Circle, which shows an obvious Circle-decreasing effect. For Circle I, more than half of the region’s thermal values are greater than 939, and the area with thermal values greater than 1403 accounts for 6.58%. For the remaining four Circles, although the thermal value range of 832–939 is dominant for each circle, there are still a considerable number of regional thermal values between 939–1946 in Circle II and Circle III, indicating a high level of HAI. However, when it comes to the fourth and fifth layers (Circle IV and Circle V), the area with thermal values ranging from 832 to 939 accounts for more than 90%, and there is hardly any regional distribution with thermal values greater than 1403 in Circle V, indicating that the intensity of human activities has decreased significantly at 15 km from the city center.

4.4. Comparing Expected HAI and Factual HAI

Correlation analysis is used to test the degree of association between BTV and the three urban form metrics across all grids in the sample. Table 4 shows the three indicators and comprehensive HAI are all significantly correlated with the real distribution of human activities reflected by BTV. This further verifies the rationality of the indicators chosen for this study. Specifically, road connectivity has the highest correlation with the factual HAI from BTV, followed by residential density and land-use mix degree.
By comparing the spatial distributions of anticipative and factual HAI, it can be found that HAI obtained by the two methods shows the highest value in the main center due to the distinct advantages of land-use diversity, traffic convenience, and function agglomeration. However, the spatial mismatch occurs in the “urban village” (the outcome of the process of the rapid development of Chinese urbanization, usually located in the old district) and suburbs. For example, “urban village” with poorly built environments is found to have a high BTV, which may be explained by the role of the market that these places usually enjoy lower house rents. By contrast, other places (mainly in industrial zones and new towns) with a high degree land-use mixing and road connectivity, are found to have a relatively low BTV, which indicates a lower attractiveness, mainly resulted from the lack of public services (such as education and medical care). Third, some new hotspots of HAI can also be found from the Baidu thermal chart due to the specialized industries that have been strategically planned in these areas. For example, the subcenter of Xiasha focuses on the international advanced manufacturing industry, while Binjiang on the high-tech industry.

5. Discussion

Several findings of this study deserve further discussions. First, while the expected HAI is not 100% consistent with the factual HAI across areas examined, the high correlation between the two HAIs suggests that people’s actual spatial movements reflected by BTV are largely dependent on the expected HAI estimated by the built environment, supporting the theory of Space Syntax [58]. It also implies that the urban built environment can generally meet the needs of human activities in Hangzhou.
Second, as the time-geography theory implies, people’s spatial movements in a destination are not only subject to the spatial configuration of a city, but also to many other socio-economic, psychological, situational, and cultural factors. Thus, a place with a well-developed infrastructure does not guarantee a good level of use by humans. This may explain why the “new towns” in the city have a lower factual HAI even the expected HAI is higher.
Third, it should be noted that the spatial distribution patterns, verified by both expected HAI and actual HAI, indicate the existence of urban subcenters in Hangzhou city. This supports the theory of multi-center urban layout. That is, as the scale of the city expands, the urban spatial layout gradually develops into multi-centers [59], which have also been reported in other studies in China [60,61] and other countries [62]. It is argued that a city with polycentric characteristics is more sustainable than the traditional metropolis with one central business district (the core of the city) [63]. As one of the most urbanized cities in China, Hangzhou is becoming more polycentric as planned. For example, the Hangzhou metropolitan area was planned to develop into two main centers and six auxiliary centers, with the two main centers (Qiangjiang CBD and Yanhan Road/lakeshore area which are combined as urban core-center in this study) and two auxiliary centers (Binjiang auxiliary city and Xiasha auxiliary city) located within the boundary of the study area. Interestingly, these areas are found to be clustered based on factual HAI estimated with the BTV. Thus, this finding endorses the master plan of the city.
Finally, the traditional top-down model of urban planning usually takes into account the functional aspects/clusters of a city while ignoring the use levels of human activities, although the latter is essential for the sustainable development of urban areas [60]. Therefore, using the actual use levels and patterns from BTV is another way that is more practical and effective to determine/identify urban centers.

6. Conclusions

This paper built a bridge between big data applications and urban management. To do so, Baidu thermal chart was used to directly depict the spatial distribution of HAI. More importantly, the HAI calculated from the perspective of the built environment was also introduced to identify areas with abnormal HAI by comparing the factual human activity depicted by big data. Based on the existing studies, RD, RC, and LUM were selected to infer the spatial distribution of expected HAI. The combination of traditional data for the built environment and big data from Baidu provides a good reference for other urban studies.
In this case study, a high correlation between BTV and the three indexes has been found. Specifically, the correlation between road connectivity and BTV is the highest, followed by the resident population density and land-use mixing degree. Although both types of HAIs are highly correlated, there are still some differences in spatial distribution between the two. For example, the “urban village” shows an overloaded HAI while the suburban area fails to reach the expected HAI. The existence of abnormal HAI relates to the region where the actual HAI is a mismatch with the expected HAI, which may mean costly wastes of resources. It also signals a warning about inappropriate urban development and more attention needs to be paid in the future urban planning.

6.1. Research Limitations

As with many other studies, this study is not without limitations. First, although BTV is chosen as the most appropriate approach to determining HAI in this study, the method itself may suffer from precision issues. That is, BTV is obtained hourly at an interval of one hour, and thus not in a seamless continuous way [38]. Second, BTV represents a simulated frequency signal, not an actual number of people holding mobile phones. As a result, BTV may have no data in the areas with fewer mobile phones. Thus, BTV is sensitive to areas with a sparse population, such as suburbs and villages. Third, as a seminal work, this study only used a one-day observation, which may reduce its power in explaining the research results. Research developed in a one-day observation can be easily contradicted. Finally, it should be noted that HAI derived from BTV in this paper is based on the location of an individual at a certain time point, without considering the social-psychological aspects of people’s behaviors, which, as discussed in the early part of this paper, is subject to many factors other than the built environments. Thus, the discrepancy between expected HAI and factual HAI, to some extent, is reflective of individuals’ behaviors being uncertain and unpredictable.

6.2. Future Research Needs

Given the limitations noted above, future research needs to be conducted in the following four aspects. First, a triangulation method needs to be used by which findings from both expected HAI and factual HAI can be consolidated with the use of one or more data sources. For example, in addition to BTV, night lights can be used to detect human use levels [16,64]. Other types of big data such as Baidu Indexes, POIs, and online check-in data can also be used to complement/substantiate findings obtained based on the built environment and BTV so that the population mobility can be fully considered and revealed. Second, an onsite survey of people’s activities at selected sites is needed to have a better understanding of their spatial movements, which can serve to gauge/caliber the discrepancy between expected and factual HAIs. Third, this study is limited by using data from a one-day observation as noted above, thus, studies involving analyses of observations based on multiple days of different use levels are needed in the future. Finally, an advanced spatial statistical analysis that reflects the correlations or variations at the local level needs to be conducted in future research if data permit. This study only used the correlation analysis because of the limited data.

Author Contributions

Conceptualization, L.X. and T.W.; methodology, H.X.; investigation and formal analysis, W.Y. and J.D.; supervision, L.M.

Funding

This study was undertaken with the support of the national Natural Science Foundation of China (No.41871216, 41871169).

Conflicts of Interest

The authors declare no conflict of interest.

References

  1. Klepeis, N.E.; Nelson, W.C.; Ott, W.R.; Robinson, J.P.; Tsang, A.M.; Switzer, P.; Behar, J.V.; Hern, S.C.; Engelmann, W.H. The national human activity pattern survey (nhaps): A resource for assessing exposure to environmental pollutants. J. Expo. Anal. Environ. Epidemiol. 2000, 11, 231–252. [Google Scholar] [CrossRef] [PubMed] [Green Version]
  2. Jiang, S.; Ferreira, J.; Gonzalez, M.C. Discovering urban spatial-temporal structure from human activity patterns. In Proceedings of the ACM SIGKDD International Workshop on Urban Computing, Beijing, China, 12 August 2012; pp. 95–102. [Google Scholar]
  3. Hasan, S.; Zhan, X.; Ukkusuri, S.V. Understanding urban human activity and mobility patterns using large-scale location-based data from online social media. In Proceedings of the 2nd ACM SIGKDD International Workshop on Urban Computing, UrbComp@KDD 2013, Chicago, IL, USA, 11 August 2013. [Google Scholar]
  4. Wu, K.Y.; Hao, Z. Land use dynamics, built-up land expansion patterns, and driving forces analysis of the fast-growing hangzhou metropolitan area, eastern china (1978–2008). Appl. Geogr. 2012, 34, 137–145. [Google Scholar] [CrossRef]
  5. Wu, K.Y.; Ye, X.Y.; Qi, Z.F.; Hao, Z. Impacts of land use/land cover change and socioeconomic development on regional ecosystem services: The case of fast-growing hangzhou metropolitan area, China. Cities 2013, 31, 276–284. [Google Scholar] [CrossRef]
  6. Wade, R.H. Is globalization reducing poverty and inequality? Int. J. Health Serv. 2004, 32, 567–589. [Google Scholar]
  7. Li, S.; Zhao, P. Restrained mobility in a high-accessible and migrant-rich area in downtown beijing. Eur. Transp. Res. Rev. 2018, 10, 4. [Google Scholar] [CrossRef] [Green Version]
  8. Pan, H.; Page, J.; Zhang, L.; Chen, S.; Cong, C.; Destouni, G.; Kalantari, Z.; Deal, B. Using comparative socio-ecological modeling to support climate action planning (cap). J. Clean. Prod. 2019, 232, 30–42. [Google Scholar] [CrossRef]
  9. Liu, X.; Kang, C.; Gong, L.; Liu, Y. Incorporating spatial interaction patterns in classifying and understanding urban land use. Int. J. Geogr. Inf. Sci. 2016, 30, 334–350. [Google Scholar] [CrossRef]
  10. Chaudhuri, A.; Stenger, H. Survey Sampling: Theory and Methods, 2nd ed.; CRC Press: Boca Raton, FL, USA, 2005. [Google Scholar]
  11. Ewing, R.; Schmid, T.; Killingsworth, R.; Zlot, A.; Raudenbush, S. Relationship between urban sprawl and physical activity, obesity, and morbidity. Am. J. Health Promot. AJHP 2003, 18, 47–57. [Google Scholar] [CrossRef]
  12. Miller, R.B. Interactions and collaboration in global change across the social and natural sciences. AMBIO 1994, 23, 19–24. [Google Scholar]
  13. Ii, B.L.T.; Skole, D.L.; Sanderson, S.; Fischer, G.; Fresco, L.O.; Leemans, R. Land-use and land-cover change, science/research plan. Glob. Chang. Rep. 1995, 43, 669–679. [Google Scholar]
  14. Yong, X.; Xiaoren, X.; Qing, T. Human activity intensity of land surface: Concept, methods and application in china. J. Geogr. Sci. 2016, 26, 1349–1361. [Google Scholar]
  15. Chen, B.; Adimo, O.A.; Bao, Z. Assessment of aesthetic quality and multiple functions of urban green space from the users’ perspective: The case of hangzhou flower garden, China. Landsc. Urban Plan. 2009, 93, 76–82. [Google Scholar] [CrossRef]
  16. Cai, J.; Bo, H.; Song, Y. Using multi-source geospatial big data to identify the structure of polycentric cities. Remote Sens. Environ. 2017, 202, 210–221. [Google Scholar] [CrossRef]
  17. Dunkel, A. Visualizing the perceived environment using crowdsourced photo geodata. Landsc. Urban Plan. 2015, 142, 173–186. [Google Scholar] [CrossRef]
  18. Friasmartinez, V.; Soto, V.; Hohwald, H.; Friasmartinez, E. Characterizing urban landscapes using geolocated tweets. In Proceedings of the 2012 International Conference on Privacy, Security, Risk and Trust and 2012 International Confernece on Social Computing, Amsterdam, The Netherlands, 3–5 September 2012; pp. 239–248. [Google Scholar]
  19. Jin, X.; Long, Y.; Sun, W.; Yang, X.; Tang, J. Evaluating cities’ vitality and identifying ghost cities in china with emerging geographical data. Cities 2017, 63, 98–109. [Google Scholar] [CrossRef]
  20. Leng, S. Almost One-Third of Chinese Cities Are Shrinking, but Urban Planners Told to Keep Building. Available online: https://sg.news.yahoo.com/almost-one-third-chinese-cities-124058122.html (accessed on 18 March 2019).
  21. Lew, A.; Mckercher, B. Modeling tourist movements: A local destination analysis. Ann. Tour. Res. 2006, 33, 403–423. [Google Scholar] [CrossRef]
  22. Ye, H.; Dennis, W. Restructuring for growth in urban china: Transitional institutions, urban development, and spatial transformation. Habitat Int. 2012, 36, 396–405. [Google Scholar]
  23. López, E.; Bocco, G.; Mendoza, M.; Duhau, E. Predicting land-cover and land-use change in the urban fringe: A case in morelia city, mexico. Landsc. Urban Plan. 2001, 55, 271–285. [Google Scholar] [CrossRef]
  24. Waddell, P. Urbansim: Modeling urban development for land use, transportation, and environmental planning. J. Am. Plan. Assoc. 2002, 68, 297–314. [Google Scholar] [CrossRef]
  25. Liu, Y.; Liu, X. Applying sleuth for simulating urban expansion of hangzhou. In Proceedings of the Second International Conference on Earth Observation for Global Changes, Chengdu, China, 9 October 2009. [Google Scholar]
  26. Hillier, B. The art of place and the science of space. World Archit. 2005, 185, 96–102. [Google Scholar]
  27. Ellegård, K.; Svedin, U. Torsten hägerstrand’s time-geography as the cradle of the activity approach in transport geography. J. Transp. Geogr. 2012, 23, 17–25. [Google Scholar] [CrossRef] [Green Version]
  28. Hu, Z.; He, X.; Li, Y.; Zhu, J.; Li, X. Human activity intensity and its spatial distribution pattern in upper reach of minjiang river. Chin. J. Ecol. 2007, 26, 539–543. [Google Scholar]
  29. Liu, S.; Liu, L.; Wu, X.; Hou, X.; Zhao, S.; Liu, G. Quantitative evaluation of human activity intensity on the regional ecological impact studies. Shengtai Xuebao/Acta Ecol. Sin. 2018, 38, 6797–6809. [Google Scholar]
  30. Xu, Z.; Zhuang, D.; Yang, L. Construction and application of regional quantitative model of human activity intensity. J. Geo-Inf. Sci. 2009, 11, 452–460. [Google Scholar] [CrossRef]
  31. Zheng, W.; Zou, J.; Tian, Y.; Deng, Y. Spatial simulation of human activity intensity based on rs and gis. Trop. Geogr. 2011, 31, 77–81. [Google Scholar]
  32. Mckercher, B.; Lau, G. Movement patterns of tourists within a destination. Tour. Geogr. 2008, 10, 355–374. [Google Scholar] [CrossRef]
  33. Jiang, S.; Ferreira, J.; Gonzalez, M.C. Activity-based human mobility patterns inferred from mobile phone data: A case study of singapore. IEEE Trans. Big Data 2017, 3, 208–219. [Google Scholar] [CrossRef] [Green Version]
  34. Vu, H.Q.; Li, G.; Law, R.; Zhang, Y. Tourist activity analysis by leveraging mobile social media data. J. Travel Res. 2018, 57, 883–898. [Google Scholar] [CrossRef] [Green Version]
  35. Shoval, N.; McKercher, B.; Ng, E.; Birenboim, A. Hotel location and tourist activity in cities. Ann. Tour. Res. 2011, 38, 1594–1612. [Google Scholar] [CrossRef]
  36. Shoval, N.; Ahas, R. The use of tracking technologies in tourism research: The first decade. Tour. Geogr. 2016, 18, 587–606. [Google Scholar] [CrossRef]
  37. Feng, Z.; Zhang, Y.; Wei, Y.; Zhao, Z.; Pang, R.; Wang, S. Spatial-temporal pattern and dynamic mechanism of population flow of changchun city during chunyun period based on baidu migration data. Econ. Geogr. 2019, 39, 101–109. [Google Scholar]
  38. Huang, X.; Zhang, L.; Ding, Y. The baidu index: Uses in predicting tourism flows—A case study of the forbidden city. Tour. Manag. 2017, 58, 301–306. [Google Scholar] [CrossRef]
  39. He, S.; Dang, H.; Zhang, M. Research on dynamic changes of urban square space in spatial and temporal based on baidu thermal diagram a case study on the wuyi square of changsha. In Proceedings of the 2017 IEEE 2nd International Conference on Big Data Analysis (ICBDA), Beijing, China, 10–12 March 2017; pp. 517–522. [Google Scholar]
  40. Deng, J.; Selin, S. Application of the delphi method to ecotourism destination evaluations: A rejoinder to brian garrod. J. Ecotour. 2012, 11, 224–229. [Google Scholar] [CrossRef]
  41. Boarnet, M.G.; Crane, R. Travel by Design: The Influence of Urban form on Travel; Oxford University Press on Demand: Oxford, UK, 2001. [Google Scholar]
  42. Handy, S.; Boarnet, M.; Ewing, R.; Killingsworth, R. How the built environment affects physical activity: Views from urban planning. Am. J. Prev. Med. 2002, 23, 64–73. [Google Scholar] [CrossRef]
  43. Katz, P.; Scully, V.J.; Bressi, T.W. The New Urbanism: Toward an Architecture of Community; McGraw-Hill: New York, NY, USA, 1994; Volume 10. [Google Scholar]
  44. Kang, C.; Ma, X.; Tong, D.; Yu, L. Intra-urban human mobility patterns: An urban morphology perspective. Phys. A Stat. Mech. Appl. 2012, 391, 1702–1717. [Google Scholar] [CrossRef]
  45. Buliung, R.N.; Kanaroglou, P.S. Urban form and household activity-travel behavior. Growth Chang. 2010, 37, 172–199. [Google Scholar] [CrossRef]
  46. Lund, H. Testing the claims of new urbanism: Local access, pedestrian travel, and neighboring behaviors. J. Am. Plan. Assoc. 2003, 69, 414–429. [Google Scholar] [CrossRef]
  47. Talen, E. Sense of community and neighbourhood form: An assessment of the social doctrine of new urbanism. Urban Stud. 1999, 36, 1361–1379. [Google Scholar] [CrossRef]
  48. Urbanism, C.F.T.N. Charter of the new urbanism. Bull. Sci. Technol. Soc. 2000, 20, 339–341. [Google Scholar] [CrossRef] [Green Version]
  49. Willis, A.; Gjersoe, N.; Havard, C.; Kerridge, J.; Kukla, R. Human movement behaviour in urban spaces: Implications for the design and modelling of effective pedestrian environments. Environ. Plan. B Plan. Des. 2004, 31, 805–828. [Google Scholar] [CrossRef] [Green Version]
  50. Hoyt, H. The Structure and Growth of Residential Neighborhoods in American Cities; US Government Printing Office: Washington, DC, USA, 1939.
  51. McFadden, D. Modelling the Choice of Residential Location; Cowles Foundation Discussion Papers; Cowles Foundation, Yale University: New Haven, CT, USA, 1977; p. 673. [Google Scholar]
  52. Termote, M. Cities and housing: The Spatial Pattern of Urban Residential Land Use; Muth, R.F., Ed.; University of Chicago: Chicago, IL, USA, 1969; pp. 591–592. [Google Scholar]
  53. Talen, E. The social goals of new urbanism. Hous. Policy Debate 2002, 13, 165–188. [Google Scholar] [CrossRef]
  54. Lämmer, S.; Gehlsen, B.; Helbing, D. Scaling laws in the spatial structure of urban road networks. Phys. A Stat. Mech. Appl. 2006, 363, 89–95. [Google Scholar] [CrossRef] [Green Version]
  55. Ochieng, W.; Quddus, M.; Noland, R. Map-matching in complex urban road networks. Braz. J. Cartogr. 2003, 55, 1–14. [Google Scholar]
  56. Zhou, J.; Pei, H.; Wu, H. Early warning of human crowds based on query data from baidu maps: Analysis based on shanghai stampede. In Advances in Geographic Information Science; Springer: Berlin, Germany, 2018; pp. 19–41. [Google Scholar]
  57. Li, J.; Miaoyi, L.; Ying, D.A. Analysis of chinese multi-center city based on baidu thermogram. Shanghai Urban Plan. 2016, 3, 30–36. [Google Scholar]
  58. Karimi, K. A configurational approach to analytical urban design: ’Space Syntax’ methodology. Urban Des. Int. 2012, 17, 297–318. [Google Scholar] [CrossRef]
  59. He, B.; Liu, L.; Huang, W.C. Urban spatial development strategy of chongqing metropolitan area. City Plan. Rev. 2009, 33, 83–86. [Google Scholar]
  60. Li, J.; Li, M.; Long, Y.; Dang, A. China polycentric cities based on baidu heatmap. Shanghai Urban Plan. Rev. 2016, 30–36. [Google Scholar]
  61. Yang, T.; Pan, H.; Hewings, G.; Jin, Y. Understanding urban sub-centers with heterogeneity in agglomeration economies—Where do emerging commercial establishments locate? Cities 2019, 86, 25–36. [Google Scholar] [CrossRef]
  62. Kloosterman, R.C.; Lambregts, B. Clustering of economic activities in polycentric urban regions: The case of the randstad. Urban Stud. 2016, 38, 717–732. [Google Scholar] [CrossRef]
  63. Zeljic, A.S. Polycentric Cities: The Future of Sustainable Urban Growth. Available online: https://www.gensler.com/research-insight/blog/polycentric-cities-new-normal-manila-finance-centre (accessed on 25 October 2018).
  64. Levin, N.; Kark, S.; Crandall, D. Where have all the people gone? Enhancing global conservation using night lights and social media. Ecol. Appl. 2015, 25, 2153–2167. [Google Scholar] [CrossRef] [Green Version]
Figure 1. The location of the study area.
Sustainability 11 07085 g001
Figure 2. Flowchart of the methodology.
Sustainability 11 07085 g002
Figure 3. The land-use map of Hangzhou in 2016.
Sustainability 11 07085 g003
Figure 4. The residential density.
Sustainability 11 07085 g004
Figure 5. The road connectivity.
Sustainability 11 07085 g005
Figure 6. The land-use mixing degree.
Sustainability 11 07085 g006
Figure 7. The comprehensive HAI calculated from three built environmental factors.
Sustainability 11 07085 g007
Figure 8. The HAI reflected by Baidu thermal chart.
Sustainability 11 07085 g008
Table 1. Human activity intensity (HAI) values within different circles.
PDRCLUMHAI
MaxMinAverageMaxMinAverageMaxMinAverageMaxMinAverage
I745 21 184 38.460.05 8.70 1.32 0.01 0.63 0.51 0.02 0.26
II316 7 91 26.25 0.02 6.90 1.41 0.000.60 0.45 0.01 0.20
III203 737 23.60 0.00 4.60 1.41 0.000.18 0.35 0.01 0.12
IV48 7 24 18.27 0.013.30 1.44 0.000.63 0.39 0.010.08
V46 8 23 11.00 0.02 2.70 1.30 0.04 0.53 0.25 0.01 0.04
Table 2. The anticipative distribution of HAI based on the built environment in different circles.
HAIIIIIIIIVVTotal
AreaRatioAreaRatioAreaRatioAreaRatioAreaRatio
0–0.069.2712.2440.92 21.89 98.9245.12115.0466.4844.38 85.00 308.53
0.06–0.1410.3713.69 32.06 17.15 54.61 24.9129.9917.335.11 9.79132.14
0.14–0.2314.0318.52 48.45 25.91 42.30 19.3016.69 9.652.194.19123.67
0.23–0.3420.2826.7746.5724.9119.078.707.32 4.230.450.8693.69
0.34–0.5521.8028.7818.9710.144.341.98 4.00 2.31 0.080.1649.19
Total75.76100.00186.96100.00219.24100.00173.05100.0052.21100.00707.22
Table 3. Factual distribution of HAI based on the Baidu thermal chart in different circles (area: ha, ratio: %).
HAIIIIIIIIVVTotal
AreaRatioAreaRatioAreaRatioAreaRatioAreaRatio
832–93933.01 43.58 119.44 63.89 187.94 85.73 160.50 92.71 50.12 95.86 551.01
939–105412.89 17.01 34.73 18.57 18.56 8.47 5.02 2.90 0.94 1.80 72.13
1054–120013.52 17.85 22.62 12.10 8.96 4.09 4.36 2.52 0.64 1.22 50.10
1200–140311.35 14.98 8.73 4.67 2.96 1.35 2.42 1.40 0.58 1.12 26.05
1403–19464.99 6.58 1.44 0.77 0.82 0.37 0.82 0.47 0.00 0.01 8.07
Total75.76100.00186.96100.00219.24100.00173.12100.0052.28100.00707.36
Table 4. Correlation of the Baidu thermal values (BTV) and other indicators.
LUMRCPDFactual HAI
BTV0.461 *0.628 *0.565 *0.577 *
* p < 0.01.

