Abstract
Research evidence has shown that innovation systems play crucial roles in the sustainability of a country. Taiwan as a natural resource-restricted society with a unique situation should pay great attention to related topics. Regarding this, scientific and strategic foresight planning is engaged in order to be competitive and sustainable. An advanced plan with evaluation and police research was revealed in this study, which utilized DEA (data envelope analysis) to reform qualitative principles and quantitively evaluate 22 counties of Taiwan, exploring potential opportunities among the counties. Moreover, based on the findings, a rational suggestion of smart healthcare development was investigated to help in decision making. In comparing the practical evidence with results, we conclude following viewpoints: First, sometimes policies have to be made with limited data and time because of the rapidly changing environment, though an effective solution to consistently bridge the conceptual principles with quantitative results is feasible. Second, we show quantitative results derived from qualitative principles that uncover missing phenomena from intuitive discussions. Third, by adapting the observation boundaries with variables, a new scenario can be exposed to meaningfully support decisions in new territories, including sustainability. Compared to intuitive decisions, scientific planning is fruitful according to social consensus in order to lay the foundation for sustainability.
1. Introduction
The concept of sustainable development (SD) deals with humanity’s aspirations of a better life within the limitations imposed by nature, and it was defined as “the development that meets the needs of the present without compromising the ability of future generations to meet their own needs” [1]. To balance economic, social, and environmental development, balancing stakeholder needs and operationalizing and measuring sustainability, the United Nations adopted the 17 Sustainable Development Goals (SDGs), in the 2015 United Nations General Assembly [2]. Researches with evidences indicate the innovation is the crucial key to achieve the goals [3,4,5,6].
How innovation system analyses contribute to sustainable transitions has been evidenced in practical evolution and academic studies [7]. The links between sustainability, innovation, and competitiveness at country level have been investigated, concluding that there is a high correlation (and a possible relationship) between social sustainability, innovation and competitiveness at country level [8]. For Europe to be more innovative and achieve overall progress and sustainability, the maturity and structural advancement of its innovation ecosystems and their determinants should be properly assessed. The Innovation Union Scoreboard [9] is one of the main tools applied to monitor and benchmark innovation across Europe, providing a regular update on the subject [10]. A friendlier context and the stronger support from the government are relevant enablers for the successful implementation of sustainable business models [11]. Research has concluded that the country-specific tradition can influence their development of practices of transparency and accountability with respect to sustainability, and there is the need to improve transparency in that regard [12] this investigation aims to present an innovation system assessment system, particularly tailored to Taiwan [13].
In these, the early policy concepts of innovation can be dated to the mid-1980s. After that decade, the types of innovation systems that were developed included a national innovation system (NIS) [7,14], regional innovation systems (RISs) [15], sectoral innovation (SIS) [16,17], and technological innovation systems (TISs) [18,19,20]. These system approaches are highly interdependent across features, concepts, and boundaries. Various research works have analyzed the complex relationship between individual viewpoints and co-evolution mechanisms in regards to sustainable transitions [21,22]. This article claims to engage innovation system analyses to study the sustainability of transitions in equipping policy makers with a tool to identify system weakness that should be enhanced in order to influence policy directions in the promising growth of the system [7].
Among the types of innovation systems, NIS and RIS are highly emphasized not only in study but also in reports in international organizations and economics. There are well-established indicator systems to evaluate worldwide innovations for countries and economies. For example, The Global Innovation Index (GII) [23] and European Innovations Scoreboard (EIS) [9] aim to track global innovation and compare analyses of innovation performances in EU countries individually. These indictor systems guide the countries with scientific measurement rules to develop their national innovation system to achieve the common goal of worldwide sustainability. On the other hand, major economies and countries have focused on RIS to increase competition in the global economy. OECD (organization for economic co-operation and development), Europe, Japan, and China evaluate their RISs with their own constructs, principles, and relative indicators. These differences have been realized as impacts by the rapid evolution of international situations, and developing a scientific, innovative, and effective evaluation system is necessary in order for a country to be competitive and sustainable.
Taiwan, as a resource-limited society, is aware of the importance of innovation and sustainability. Projects supported by governments that create indictors to evaluate RIS are pushed urgently by policy makers. However, due to the uniqueness of the island environment and international situations, barriers to constructing a reliable indicator system should be considered carefully. Innovative policy making is important in gathering the consensus of people, which will solidify the foundation of promising growth in society. Under the circumstances, effective methodologies are an alternative solution. On the other end, the achievements from other methodologies are also considered as pre-study results to the indicator studies that help to conquer identified barriers in the early stages. This work attempts to achieve the following criteria: (1) Align the same concepts and bases under development in NIS and RIS projects. (2) Analyze quantitative results relative to qualitive principles and requirements identified by the relevant governmental department. (3) Evaluate cross-evidence with practical phenomena and under consensus of research. (4) Extend the methodology so it can be applied in different territories and topics, thereby leveraging the future of policy making.
“Six Special Municipalities” as well as the “5 + 2 Industrial Transformation Plan” are the most important policies and plans according to economic development in Taiwan nowadays. The local government in Taiwan, the highest administrative division units are classified as the province and special municipality since 1998. Taipei, New Taipei, Taoyuan, Taichung, Tainan and Kaohsiung are current special municipalities are also known as “Six Special Municipalities” in Taiwan [24]. The 5 + 2 Major Innovative Industries policy aims to upgrade Taiwan’s industrial from traditional manufacturing to high-value-added business, service and solution [25,26,27]. The 5 + 2 industrial sectors focus on the internet of things, biomedical, green energy, smart machinery and defense then expended into new agriculture and circular economy. A strategical policy, named “Special Act for Forward-Looking Infrastructure”, was constructed to align local industrial development with central government vision. Which strategically empowered “Six Special Municipalities” and “5 + 2 industrial Transformation Plan” with the significant importance of Taiwan [28].
Developing adequate innovation systems will contribute to evaluating scientific exploration of the environmental status. Many projects with various methodologies have been discussed in parallel and tested in academic and practical ways. This study utilized data envelop analysis (DEA) methodology to explore the fitness between the current status and indicators by using data, and it makes a scientific suggestion of smart-health development. This study demonstrates an efficient, practical, and quantified method to resolve the complexity and gap between social phenomena and intuitive arguments in an efficient, comprehensive, and flexible manner. Policy makers can quickly obtain support for feasible and scientific decisions, for instance, if there is a shortage of evidence and data before a completed survey, if there are sudden changes in the situation, or if policy needs to be fine-tuned after environmental scans.
2. Methodology and Data
2.1. DEA Models
The data envelopment analysis (DEA) method was developed by Charnes et al. in 1978 [29]. It can be realized as leveraging the linear programing model in mathematics to approach an optimal efficiency in economic theory. A similar concept can be tracked to the paper by Farrell (1957) [30]. Differences between the concepts were discussed in a recent article [31]. DEA establishes an envelopment surface that is composed of an efficiency frontier among all decision-making units (DMUs), which are measured with user-defined multiple inputs and outputs. Then, the relative efficiency is calculated in numerical values. Manipulating the values and analyzing the trend of relationships help decision makers develop optimal strategies with relative efficiency. In order to approach individual scenarios more properly, various models have been developed with relative assumptions to support more precise decision making.
The early DEA model by Charnes et al. (1978) is known as CCR [29]. It was limited by certain assumptions, for example, its returns to scale (RTS) is constrained by constant returns to scale (CRS) only. However, the returns to scale issues are concerning in academic and practical matters. An extended model to deal with variable returns to scale (VRS) issues, named the BCC model, was invented by Banker et al. (1984). In addition to the BCC model, Tone (2001) proposed a slacks-based measure (SBM) model of DEA (SBM-DEA) to also deal with the issues. In his article, the SBM-DEA has close connections with the CCR and BCC models, evidenced by its validity and compatibility with numerical experiments [32]. Outperforming CCR and BCC models, the SBM model can interpret profit maximization from “dual sides”. The model handles excesses inputs and output shortfalls of DMUs by directly providing an outstanding way to evaluate comprehensive viewpoints while making decisions. Its flexibility contributes to studies that are based on SBM-DEA, for example, super-efficiency DEA [33], network DEA [34], and estimation of RTS [35] studies of DEA.
2.1.1. Relations among Input-Oriented, Output-Oriented, and Non-Oriented SBM-DEA
Referring to the definition and computational scheme by Tone (2001, 2002) [32,33], the SBM model was reorganized according to the following statements.
- Definitions:
When dealing with DMUs with input matrices and input matrices , assume and .
Define the production possibility set as P:
where is a non-negative vector in .
A certain DMU ( is denoted as:
in which , , and . The vectors indicate input excess and means output shortfall, which are called slacks. An index was defined as:
Because and , can be obtained from Equation (2), and it holds that .
- Computational scheme:
From the definition, the SBM is formulated as the fractional program:
In the context of the paper, Equation (5) was transferred to the CCR model, and mathematical equivalents were proven.
If analyzing the fractional equation to index in program (5), input excess and output shortfall were calculated at the same time. The model was also named as a non-oriented SBM model. In relation, this is in dealing with input excess and output shortfall individually, as in programs (6) and (7). The model names are known as input-oriented SBM (SBM-I) and output-oriented SBM (SBM-O), respectively.
- Input-oriented SBM program:
- Output-oriented SBM program:
The concepts of input- and output-oriented models are similar to CCR models and compared in related studies [36,37,38].
2.1.2. Super-Efficiency SBM-DEA and Returns to Scale
The super-efficiency SBM was developed by Tone (2002), which was intended to rank the efficiency of DMUs among efficient frontiers evaluated by SBM. In brief, the model measures the distances between DMUs in one frontier to a new frontier, and subsets excluded DMUs in the original frontier. This makes it possible to rank the DMUs in the frontier with a new efficiency to identify their “super-efficiency” priority. The article also discusses the Super SBM-I (input-oriented super-efficiency SBM) and super SBM-O (output-oriented super-efficiency SBM) in mathematical terms. Program (8) lists the equations in which is noted as the algebraic expression of vector .
Banker et al. (1984) relaxed the radial constraint measure from the origin in CCR, which extended the measurement of scale influences from CRS to VRS [39]. Tone (2002) deals with the scales’ influence of SBM by adding the constraint vector . Wu and An (2013) estimated the SBM return to scale among NDRS (non-decreasing returns to scale), NIRS (non-increasing returns to scale), and VRS under similar concepts with corresponding constraint to . Programs (8) and (9) are the SBM and super SBM in VRS with in algebraic formation, which is consistent with all definition in Tone (2002).
- SBM VRS
Definition 1.
Refers to Equations (1)–(4)
[Program equations]
- Super-SBM VRS
Definition 2.
Define the production possibility set as P\:
Further, define a subsetofas
Indexdefines a weighted distance fromtoas:
[Program equations]
The program is transformed to CCR-I, CCR-O, and discuss the case of zero values to evidence the compatibility of DEA models [33].
2.2. Data
The foundations of the study are based on pioneering surveys of worldwide mainstream innovation indicator systems. One of the purposes is to leverage the concepts and principles from international economy systems with their outstanding viewpoints and investigations as well as to construct an adequate indicator for Taiwan. With a small but unique existence in the regional economics in East Asia, the government pays great attention to the system in order to indicate the right direction to a sustainable society. The consensus between society and the government agrees, that accelerating innovation with increasing efficiency is the key to overcoming the weakness of lacking natural resources compared to neighbor countries.
Regarding this, Taiwan innovation indicator systems were taken into serious consideration. Grupp and Mogee [40] surveyed various indicators systems including OECD in national science indicator report, National S&T (science and technology) indicators reports in Europe and S&T indicators in Japan. The article compared the background and relationship of those indicator systems in early ears. However, the recent reports on individual indicator systems were unified with the guideline of the Oslo Manual [41,42]. The individual systems survey specific topics with their aspects and principles with individual interests and considerations. As this view point, a government support project reviewed individually for their aspects, principles, and indicators among OECD Science, Technology, and Industrial Scoreboard 2015 [43], European Innovation Scoreboard 2017 [44] and Japanese Science and Technology Indicators 2016 [45]. Table 1 is a summary of innovation indicators with relative aspects listed. The framework of a Taiwan innovation system is developed by referring to structures. In this case, three aspects with 20 principles are proposed to be the preliminary framework, and its architecture is shown in Figure 1. In the studies, as the pioneer evaluation project, 12 out of 96 indicators were selected by experts with the viewpoints of representativity, availability, integrity, and operability. The criteria are comparing with aspects of world-wide indicator system in Table 1 as well as the situation in Taiwan. Besides, various variable combinations of same DEA models have been pre-tested and results to agree with the indicators selected by experts. The indicators are coded from (I-1) to (I-12) in this article, and the relative investigated item, description, and source are listed in Table 2. The preliminary framework is showed in Figure 1, and the marked attributes are input and output. The data collected in 2017 are reorganized in Table 2 and Table 3 by type of input and output. Table 4 lists the relative data collected in 2017.

Table 1.
Analysis of major, worldwide innovation indicator systems.
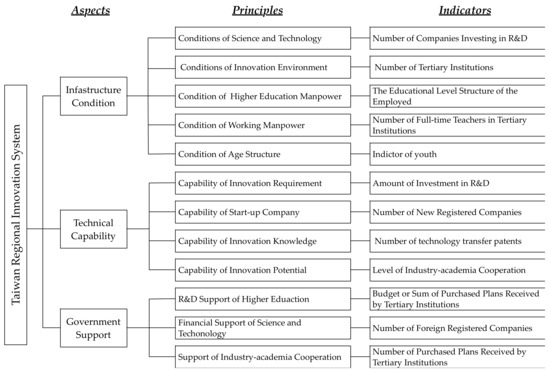
Figure 1.
The preliminary framework and architecture.
Table 2.
Input indicators with descriptions and sources.
Table 3.
Output indicators with descriptions and sources.
Table 4.
Data of input and output indicators of Taiwan in 22 counties and cities in 2017.
3. Results
The data were tested by the DEA model in CCR and BCC to clarify if there were any concerning differences. After the analysis results, the SBM was utilized for integrity in the study. The first part was an empirical analysis to examine the effectiveness of SBM-C and SBM-V as well as the relevance among indicators as valid and reliable markers. In the second part, the suggestions of innovation policies, were promoted by validation and sensitivity tests between data and models. In the last part we added a new medical indicator and extended it to super-DEA models to evaluate promising places to invest in the smart-health industry across 22 counties and cities of Taiwan.
3.1. Empirical Analysis of SBM-DEA
3.1.1. SBM-C and SBM-V Model Analyses
Table 5 is the summary of SBM, including constant RTS (SBM-C) and variable RTS (SBM-V), and makes a remark on the efficiency of counties and cities. Compared to the (efficiency) score between SBM-C and SBM-V, we categorized efficiency into three groups (Lienchiang County and Penghu County were excluded due to insufficient data). The first type is “efficient”, which means DMUs that belong to the group are efficient no matter if they have constant or variable RTSs. The other DMU types were marked as “efficient in VRS”, which means they also reached an efficient frontier by releasing the constant RTS to variable RTS, and the remaining DMUs were the “insufficient” type.
Table 5.
Summary of slacks-based measure (SBM) in constant and variable returns to scale (RTS).
3.1.2. Correlation and Weight among Indicators
Table 6 is the Pearson correlation matrix for indicators. It identified there were highly related indicators which correlation coefficient larger than 0.8 including (I-1) to (I-2), (I-1) to (I-3), (I-1) to (I-4), (I-1) to (O-1), (I-1) to (O-2), (I-1) to(O-4), (I-2) to (O-1), (I-2) to (O-2), (I-4) to (I-5), (I-5) to (O-3), (O-1) to (O-2), (O-1) to (O-4) and (O-2) to (O-4). The reasons can be obtained from the definition and description in Table 2 and Table 3. In addition, the similarity of indicators trims the dimensions of model that satisfies the constraint [46].
Table 6.
Correlation table among indicators.
However, there is no indicator that can be taken out the model to keep the weight of the indicator consistent with its viewpoints.
3.2. Sensitivity Test
A sensitivity test was utilized to identify the effectiveness of individual indicators. This method compares the differences of efficiency scores, excluding the indicator and itself. In Table 7 and Table 8, we defined the as a subset, removed the data belonging to the indicator (IND), then recalculated its efficiency score and rank in the SBM-C model. For example, the score and rank under indicates a rebuilt SBM-C model, excluding the measurement of “number of full-time teachers in tertiary institutions “(I-1). The difference value represents the strength or weakness of the indicator to DMU. In addition, the re-ranking order of the DMU in SBM-C after elimination guides decision makers in discovering the relative contribution from each indicator by comparing original rankings.
Table 7.
Sensitivity test results of input indicators.
Table 8.
Sensitivity test results of output indicators.
3.3. Apply Super SBM to Forecast the Smart-Health Industry
It’s always full of challenges to justify the decisions on public investments are made in fair, scientific way. Satisfying social consensus is uneasy about Taiwan, some policy plans were serious debated as intuitive decisions then fall back that really harmful to social sustainability. Regarding this, the experimental mission endeavored a methodology with limit time and data resource has to be accomplished with scientific results. This project plans to extend the method to forecast the smart-health industry in 5 + 2 industrial policy transformation. The scenario is to choose the most potential county to invest in to increase opportunity for success in international competition. A base assumption was made, that a “highly efficient and innovative environment with a mature medical industry” would be a concrete foundation to invest in smart health. Data from the Medical Institute Assessment by Joint Commission Taiwan were reorganized as indicators [47]. Table 9 lists the statistics of the number of assessed institutes as the input indicator (I-m) and grade A institute as the output indicator (O-m). The institutes include children’s and mental hospitals because of their unique assessments.
Table 9.
Statics of assessed institutes of counties and cities in Taiwan.
3.3.1. Environment Scanning by DEA in CRS Models
RTS is a constraint to CRS because the assumption of this trial was to select the most efficient DMU from 22 counties and cities, which is shown in Table 10. The various models in CRS, including CCR-I, CCR-O, and SBM-C, were investigated and obtained the same results. Chiayi County, Yilan County, and Hsinchu County are the three top-ranked counties.
Table 10.
Summary of data envelope analysis (DEA) models in constant returns to scale (CRS) of medical institutions.
3.3.2. Integrating Innovation and Medical Indicators
Table 11 lists the data with innovation input indictors from (I-1) to (I-6), and the added medical input indicator (I-m) and output indicators are treated in the same way. The purpose of Table 11 was to extend the conceptual assessment from innovative to only medically innovative indicators that are supposed to leverage smart-health development. Table 12a shows the data investigated in SBM-C, and it found 12 DMUs in the efficiency frontier that were not helpful in making decisions. The super SBM relaxed the efficiency score, which was limited in Table 1, then the new rank was obtained as Table 12b. Regarding the unbalanced indicator count between innovation and medical innovation, Table 12c weighs the medical indicators three times to get another rank. The first choice is still Hsinchu County; however, the rest are different.
Table 11.
Summary of SBM-C by integrating innovation and medical indicators.
Table 12.
Ranked DEA model results: (a) ranks in SBM-C, (b) ranks in super SBM-C, and (c) ranks in super SBM-C with adjusted weight.
4. Discussion
The data collected in this study were quantitatively analyzed by DEA models. The indicators selected by exports matched well in practical observations. The discussion will correspond to results and procedures made in the previous section for a better understanding.
4.1. Suggestions from SBM-DEA Results
Figure 2 is a geographic map of Taiwan with the results of Table 5. It contributes to observing the relations of innovation efficiencies among national and regional viewpoints in the discussion.
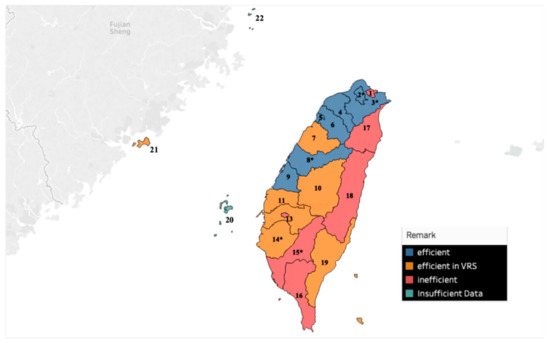
Figure 2.
Results of efficient types in a geographic map of Taiwan.
4.1.1. Strategies Proposed by SBM with RTS
Section 3.1.1 classifies the innovation types of DMUs into inefficient, efficient in VRS, and efficient (in CRS and VRS). From a strategic viewpoint, inefficient DMUs have to eliminate input and increase output, whereas efficient DMUs only in VRS focus on increasing the output and analyzing those efficient DMUs to find out the key success factors to increase development. The data generated from DEA models can construct the guidelines to the counties/cities, respectively:
- Guidelines for inefficient DMUs: Chiayi City, Kaohsiung City, Pingtung County, Yilan County, and Hualien County are listed in the inefficient group. Suggestions are made by the results of SBM-C for the group. Table 13 points out the target county that each inefficient county should refer to. The ratio of the reference set shows the gap between the inefficient city and target city. For example, the efficiency of Pingtung County is closer to Hsinchu County than New Taipei City, which means Hsinchu County is easier to reach within the two reference counties. The uniqueness of DMUs in the reference set can be resolved by the sensitivity test in Section 4.2. Table 14 shows the inputs to be decreased and Table 15 shows the outputs to be increased in order to raise the efficiency of the county/city.
Table 13. Guidelines for inefficient decision-making units (DMUs).
Table 14. Suggestions for decreasing inputs of inefficient DMUs.
Table 15. Suggestions for increasing outputs of inefficient DMUs.
- Guidelines for efficient in SBM-V: Similar strategies to reach efficient DMUs on the front end in constant RTS are listed in Table 16. In addition, those DMUs can focus on the scale’s influence, i.e., increase their output to perform efficiently in variable RTS. In this case, the reference sets are listed in Table 16, and output shortages are listed in Table 17.
Table 16. Guidelines for DMUs efficient in SBM-V.
Table 17. Suggestions for increasing the outputs of efficient SBM-V DMUs.
- Discovery of efficient DMUs: High DMU efficiencies imply success factors that need to be explored. The following points aim to identify reasons with scientific explanations that can be suggested to policy makers, and they also review the current state of policy in Taiwan.
- Urbanization: In 2010, five Special municipalities—Taipei, New Taipei, Taichung, Tainan, and Kaohsiung—were formally established in Taiwan. In 2014, the sixth special municipality was announced as Taoyuan. The results of these polices were highly represented as related to the innovation efficiency in Figure 2. Tainan and Kaohsiung are the only exceptions. Tainan is efficient in VRS, and the trend is growing upwards. Kaohsiung seems to suffer from ongoing inefficiency issues. All the results of DEA highly match with current observations in Taiwan.
- “Technology diffusion” vs. “hidden champions”: Research and practical observations all agree that “Hsinchu Science Park” has dominated economic development in Taiwan [48,49,50]. The high efficiency of Hsinchu county was considered to be due to the effect of “Technology Diffusion”. Miaoli has developed in a similar way and set up “Tongluo Science Park” in 2010. However, a special relationship between Taichung City and Changhua County was noted. It is hard to explain technology diffusion as the leading cause of Miaoli’s development. The relationships of industry are not upstream and downstream, but they are competitive and sometimes independent. For this reason, the concept of “hidden champion” was prompted as one of the explanations. Indeed, unique companies and businesses have been revealed in some reports in Changhua County, but in very low profile, which characterizes the “hidden champion”. As the challenge of capitalization exists in high-tech industry, the Taiwan government is highly attentive towards developing another potential model beyond a science park. A survey of hidden champions is proposed based on these results. An industrial strategy that incorporates less capitalization will likely be sustainable compared to the high consumption of resources for some high technology industries, and it will increase the chances of success.
4.1.2. Effectivity of Indicators
Qualitive principles have to support and consist of the quantitative indicators in a well-established indicator system. Effectiveness is constrained by the related model, which was DEA in this paper. The suitable number of input and output indicators should be no more than half of the DMUs. In this case, there were 22 DMUs, so the number of input and output indicators should be less than 11. The correlation results show highly related indictors that satisfy the assumptions and keep the weighting. However, that also implies that DEA may not be an innovative assessment system because 20 indicators were proposed in the Taiwan Innovation System. A more detailed search will be made on the issues once the system is defined.
4.2. Sensitivity Test
When the number of DMUs under review changes, when different inputs and outputs are selected, or when there are numerical changes in the inputs and outputs, the shape or position of the leading efficiency boundary of the DEA may be affected. In order to make the efficiency measurement more convincing, a sensitivity analysis ensures the credibility of the efficiency measurement results. Figure 3, Figure 4 and Figure 5 are the radar charts describing the variation in efficiencies of individual indicators after a sensitivity test, which are grouped by efficiency types for comparison. The higher positive value means the indicator contributes more efficiency to the DMU, and negative values are the converse way.
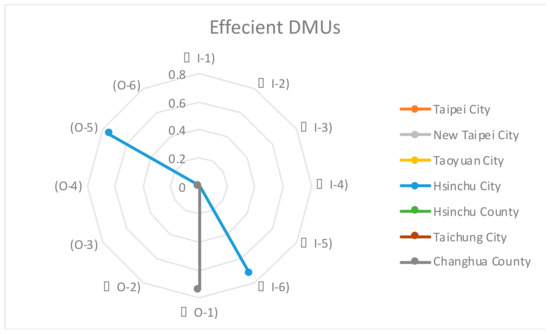
Figure 3.
Comparison of efficient DMU indicators by sensitivity test.
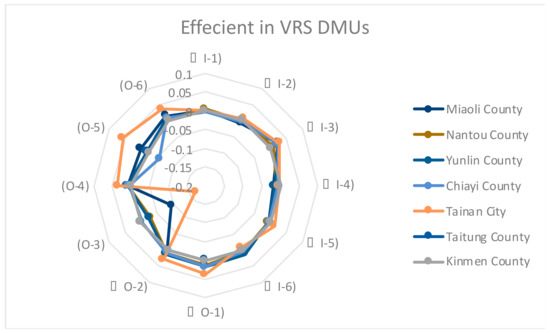
Figure 4.
Comparison of efficient variable returns to scale (VRS) DMU indicators by sensitivity test.
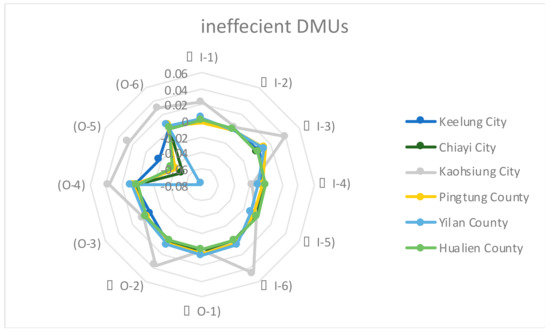
Figure 5.
Comparison of inefficient DMU indicators by sensitivity test.
DMUs in the efficient group show import evidence. Hsinchu City is outstanding in indicator (I-6) “indictor of youth” and indicator (O-5) “amount of companies investing in R&D”. Changhua County leads in indicator (O-1) “number of technology transfer patents”. The findings highly support our inference to characteristics of “technology diffusion” and “hidden champions”. The remaining DMUs had balanced growths.
DMUs that performed efficiently only in VRS varied in indicators (O-3) “number of foreign registered companies” and (O-5) “number of companies investing in R&D”. They are attributed to internationalization and investment. Inefficient DMU statuses are diversified. Chiayi City, Yilan County, and Hualien seemed to suffer from less investment. Kaohsiung City and Pingtung County were inefficient overall. This analysis was highly consistent with the current status in Taiwan.
4.3. Strategic Foresight Innovation System
The plan in 3.3 forecasts the possibility to assess a new industrial investment strategy based on an innovative system. The focus aims to construct a bidirectional methodology between indicator system and strategic policy. “Foresight” has been highly emphasized in the Taiwan government in recent years. It should be possible to apply the methodology in other territories.
4.4. Limitations and Future Studies
As this study is a pioneering project of the Taiwan Innovations System, there are an increasing number of indicators under survey. Not only the 12 out of 97 indicators voted by experts, but also various combinations have been tested and concluded consistency with 12 indicators. Missing data in counties are requested to be filled in the upcoming year. The title of 97 indicators collected form government reports still accumulates yearly, and the panel data are possible to apply in testing other DEA models like 2-stage or network models. The indicators of worldwide innovation systems lean towards economic growth; however, more environmental indicators are necessary in regard to sustainability.
5. Conclusions
Innovation plays a crucial role for a society to develop sustainably. An innovation indicator system is established as a foresight plan to rationalize strategic decisions made by the government. However, as individual countries are unique, it is difficult to directly transfer the system between economies without proper evaluation. This study proposes a DEA assessment processes to align indicators with practical phenomena. The proposed procedures not only evidence its effectivity but also aid in discovering potential opportunities in Taiwan. The contributions include its efficiency, consistency, and extendibility, by cross-referencing DEA models, in making decisions from the early survey stage to forecasts in future policy making.
The article contributes to knowledge advancements in several ways. First, it applied a single methodology DEA but in various models corresponded to individual development stages including construct concepts, data validation, empirical evidence and propose a new plain. Comparing to composite indicator systems of RIS, it takes advantages in simplicity, consistency, robustness and efficiency. Second, it not only assessed the regional innovation among 22 counties in Taiwan but also discovered a promising “hidden champion” model to compensate the over-reliance of high-tech development. In other words, it demonstrates a possible thinking for social sustainability from competing to cooperate development across regions. At last, as foresight innovations with forward-looking plans dominate the future Taiwan. This study proposes operational procedures to extend the established results to foresee the changes in scientific way. That is a guideline on data collection and manipulation bridging from the academical study to practical application.
Author Contributions
Conceptualization, S.-W.H. and S.M.L.; methodology, S.-W.H. and S.M.L.; investigation, C.-L.C.; data curation, C.-L.C. and S.M.L.; writing—original draft preparation, S.M.L.; writing—review and editing, S.-W.H and S.M.L.
Funding
This research received no external funding.
Conflicts of Interest
The authors declare no conflict of interest.
References
- Bruntland, G.H. Our Common Future; The World Commission on Environment and Development: New York, NY, USA, 1987; pp. 45–65. [Google Scholar]
- United Nations General Assembly. Transforming our World: The 2030 Agenda for Sustainable Development; United Nations General Assembly: New York, NY, USA, 2015. [Google Scholar]
- Ogbeibu, S.; Emelifeonwu, J.; Senadjki, A.; Gaskin, J.; Kaivo-oja, J. Technological turbulence and greening of team creativity, product innovation, and human resource management: Implications for sustainability. J. Clean. Prod. 2020, 244, 118703. [Google Scholar] [CrossRef]
- D’Souza, C.; McCormack, S.; Taghian, M.; Chu, M.T.; Sullivan Mort, G.; Ahmed, T. An empirical examination of sustainability for multinational firms in China: Implications for cleaner production. J. Clean. Prod. 2020, 242, 118446. [Google Scholar] [CrossRef]
- Josa, I.; Aguado, A. Infrastructures and society: From a literature review to a conceptual framework. J. Clean. Prod. 2019, 238, 117741. [Google Scholar] [CrossRef]
- He, Q.; Chen, X.; Wang, G.; Zhu, J.; Yang, D.; Liu, X.; Li, Y. Managing social responsibility for sustainability in megaprojects: An innovation transitions perspective on success. J. Clean. Prod. 2019, 241, 118395. [Google Scholar] [CrossRef]
- Jacobsson, S.; Bergek, A. Innovation system analyses and sustainability transitions: Contributions and suggestions for research. Environ. Innov. Soc. Transit. 2011, 1, 41–57. [Google Scholar] [CrossRef]
- Fonseca, L.; Lima, V. Countries three Wise Men: Sustainability, innovation, and competitiveness. J. Ind. Eng. Manag. 2015, 8, 1288–1302. [Google Scholar] [CrossRef]
- Hollanders, H.; Es-Sadki, N. European Innovation Scoreboard 2018; European Union: Luxembourg, 2018; ISBN 9789279776229. [Google Scholar]
- González Fernández, S.; Kubus, R.; Mascareñas Pérez-Iñigo, J. Innovation ecosystems in the EU: Policy evolution and horizon europe proposal case study (the actors’ perspective). Sustainability 2019, 11, 4735. [Google Scholar] [CrossRef]
- Fonseca, M.L.; Domingues, P.J.; Pereira, T.M.; Martins, F.F.; Zimon, D. Assessment of circular economy within portuguese organizations. Sustainability 2018, 10, 2521. [Google Scholar] [CrossRef]
- Navarro Galera, A.; de los Ríos Berjillos, A.; Ruiz Lozano, M.; Tirado Valencia, P. Transparency of sustainability information in local governments: English-speaking and Nordic cross-country analysis. J. Clean. Prod. 2014, 64, 495–504. [Google Scholar] [CrossRef]
- Alcaraz-Quiles, F.J.; Navarro-Galera, A.; Ortiz-Rodríguez, D. Factors determining online sustainability reporting by local governments. Int. Rev. Adm. Sci. 2014, 81, 79–109. [Google Scholar] [CrossRef]
- Lundvall, B.A. National Systems of Innovation: Towards a Theory of Innovation and Interactive Learning; Pinter: London, UK, 1992. [Google Scholar]
- Cooke, P. Regional innovation systems: An evolutionary approach. In Regional Innovation Systems; Baraczyk, C., Heidenreich, P., Eds.; University of London Press: London, UK, 1996. [Google Scholar]
- Negassi, S.; Shiri, G.A. Sectoral innovation systems: Technological regimes, Schumpeterian dynamics and spatial boundaries. In Systems of Innovation: Technologies, Institutions and Organisations; Edquist, C., Ed.; Pinter: London, UK, 1997. [Google Scholar]
- Malerba, F. Sectoral Systems of Innovation, Concepts, Issues and Analyses of Six Major Sectors in Europe; Cambridge University Press: Cambridge, UK, 2004. [Google Scholar]
- Carlsson, B.; Stankiewicz, R. On the nature, function, and composition of technological systems. J. Evol. Econ. 1991, 1, 93–118. [Google Scholar] [CrossRef]
- Cooke, P. Regional innovation systems: Competitive regulation in the new Europe. Geoforum 1992, 23, 365–382. [Google Scholar] [CrossRef]
- Cooke, P.; Gomez, M.; GoioEtxebarria, U. Regional innovation systems: Institutional and organisational dimensions. Res. Policy 1997, 26, 475–491. [Google Scholar] [CrossRef]
- Gaziulusoya, A.I.; Boyle, C.; McDowall, R. System innovation for sustainability: A systemic double-flow scenario method for companies. J. Clean. Prod. 2013, 45, 104–116. [Google Scholar] [CrossRef]
- Markard, J.; Truffer, B. Technological innovation systems and the multi-level perspective: Towards an integrated framework. Res. Policy 2008, 37, 596–615. [Google Scholar] [CrossRef]
- Dutta, S.; Lanvin, B.; Wunsch-Vincent, S. Gloval Innovation Index 2019. Creating Health Lives—The Future of Medical Innovation; Cornell University: Ithaca, NY, USA; INSEAD: Fontainebleau, France; WIPO: Geneva, Switzerland, 2019. [Google Scholar]
- Goverment Organizations. Available online: https://english.president.gov.tw/Page/106 (accessed on 8 July 2019).
- The 5+2 Industrial Transformation Plan. Taiwan Business Topics. 2017. Available online: https://amcham.com.tw/wp-content/uploads/2017/05/May-2017-Taiwan-Business-TOPICS.pdf (accessed on 8 July 2019).
- The 5+2 Industrial Innovation Plan. Available online: https://topics.amcham.com.tw/2017/05/52-industrial-innovation-plan/ (accessed on 8 July 2019).
- 5+2 Innovative Industries Plan. Available online: https://english.ey.gov.tw/iip/B0C195AE54832FAD (accessed on 8 July 2019).
- 5+2 Major Innovative Industries Policy. Available online: https://www.moea.gov.tw/MNS/Ad01/content/ContentDetail.aspx?menu_id=30686 (accessed on 8 July 2019).
- Charnes, A.; Cooper, W.W.; Rhodes, E. Measuring the efficiency of decision-making units. Eur. J. Oper. Res. 1978, 2, 429–443. [Google Scholar] [CrossRef]
- Farrell, M.J. The measurement of productive efficiency. J. R. Stat. Soc. Ser. A 1957, 120, 253–281. [Google Scholar] [CrossRef]
- Førsund, F.R. Economic interpretations of DEA. Socio-Econ. Plan. Sci. 2018, 61, 9–15. [Google Scholar]
- Tone, K. A slacks-based measure of efficiency in data envelopment analysis. Eur. J. Oper. Res. 2001, 130, 498–509. [Google Scholar] [CrossRef]
- Tone, K. A slacks-based measure of super-efficiency in data envelopment analysis. Eur. J. Oper. Res. 2002, 143, 32–41. [Google Scholar] [CrossRef]
- Tone, K.; Tsutsui, M. Network DEA: A slacks-based measure approach. Eur. J. Oper. Res. 2009, 197, 243–252. [Google Scholar] [CrossRef]
- Wu, J.; An, Q. Slacks-based measurement models for estimating returns to scale. Int. J. Inf. Decis. Sci. 2013, 5, 25–35. [Google Scholar] [CrossRef]
- Asbullah, M.A.; Jaafar, A. A new approach to estimate the mix efficiency in data envelopment analysis. Appl. Math. Sci. 2010, 4, 2135–2143. [Google Scholar]
- Puri, J.; Yadav, S.P. A concept of fuzzy input mix-efficiency in fuzzy DEA and its application in banking sector. Expert Syst. Appl. 2013, 40, 1437–1460. [Google Scholar] [CrossRef]
- Avkiran, N.K.; Tone, K. Bridging radial and non-radial measures of efficiency in DEA. Ann. Oper. Res. 2008, 164, 127–138. [Google Scholar] [CrossRef]
- Banker, R.D.; Charnes, A.; Cooper, W.W. Some models for estimating technical and scale inefficiencies in data envelopment analysis. Manag. Sci. 1984, 30, 1087–1101. [Google Scholar] [CrossRef]
- Grupp, H.; Mogee, M.E. Indicators for national science and technology policy: How robust are composite indicators? Res. Policy 2004, 33, 1373–1384. [Google Scholar] [CrossRef]
- OECD; Eurostat. Oslo Manual 2018: Guidelines for Collecting, Reporting and Using Data on Innovation, 4th ed.; Eurostat: Paris, France, 2018. [Google Scholar]
- OECD; Eurostat. Oslo Manual: Guidelines for Collecting and Interpreting Innovation Data, 3rd ed.; Eurostat: Paris, France, 2005. [Google Scholar]
- OECD. OECD Science, Technology and Industry Scoreboard 2015; OECD: Paris, France, 2015. [Google Scholar]
- Hollanders, H.; Es-Sadki, N. European Innovation Scoreboard 2017; Eurostat: Paris, France, 2017. [Google Scholar]
- Kanda, Y.; Murakami, A.; Fukuzawa, N.; Igami, M. Japanese Science and Technology Indicators 2016; National Institute of Science and Technology Policy: Tokyo, Japan, 2016. [Google Scholar]
- Thompson, R.G.; Langemeier, L.N.; Lee, C.-T.; Lee, E.; Thrall, R.M. The role of multiplier bounds in efficiency analysis with application to Kansas farming. J. Econom. 1990, 46, 93–108. [Google Scholar] [CrossRef]
- Joint Commission of Taiwan. Available online: https://www.jct.org.tw/ (accessed on 8 July 2019).
- Lee, W.-H.; Yang, W.-T. The cradle of Taiwan high technology industry development—Hsinchu Science Park (HSP). Technovation 2000, 20, 55–59. [Google Scholar] [CrossRef]
- Hsien-CheLai, Z.; Shyu, J. A comparison of innovation capacity at science parks across the Taiwan Strait: The case of Zhangjiang High-Tech Park and Hsinchu Science-based Industrial Park. Technovation 2005, 25, 805–813. [Google Scholar]
- Chen, S. Creating a knowledge-based city: The example of Hsinchu Science Park. J. Knowl. Manag. 2004, 8, 73–82. [Google Scholar] [CrossRef]
© 2019 by the authors. Licensee MDPI, Basel, Switzerland. This article is an open access article distributed under the terms and conditions of the Creative Commons Attribution (CC BY) license (http://creativecommons.org/licenses/by/4.0/).