Technological Drivers of Urban Innovation: A T-DNA Analysis Based on US Patent Data

Abstract
1. Introduction: The Need for Urban Innovation
2. What Is Urban Innovation?
3. Urban Innovation Reflected in City Infrastructures
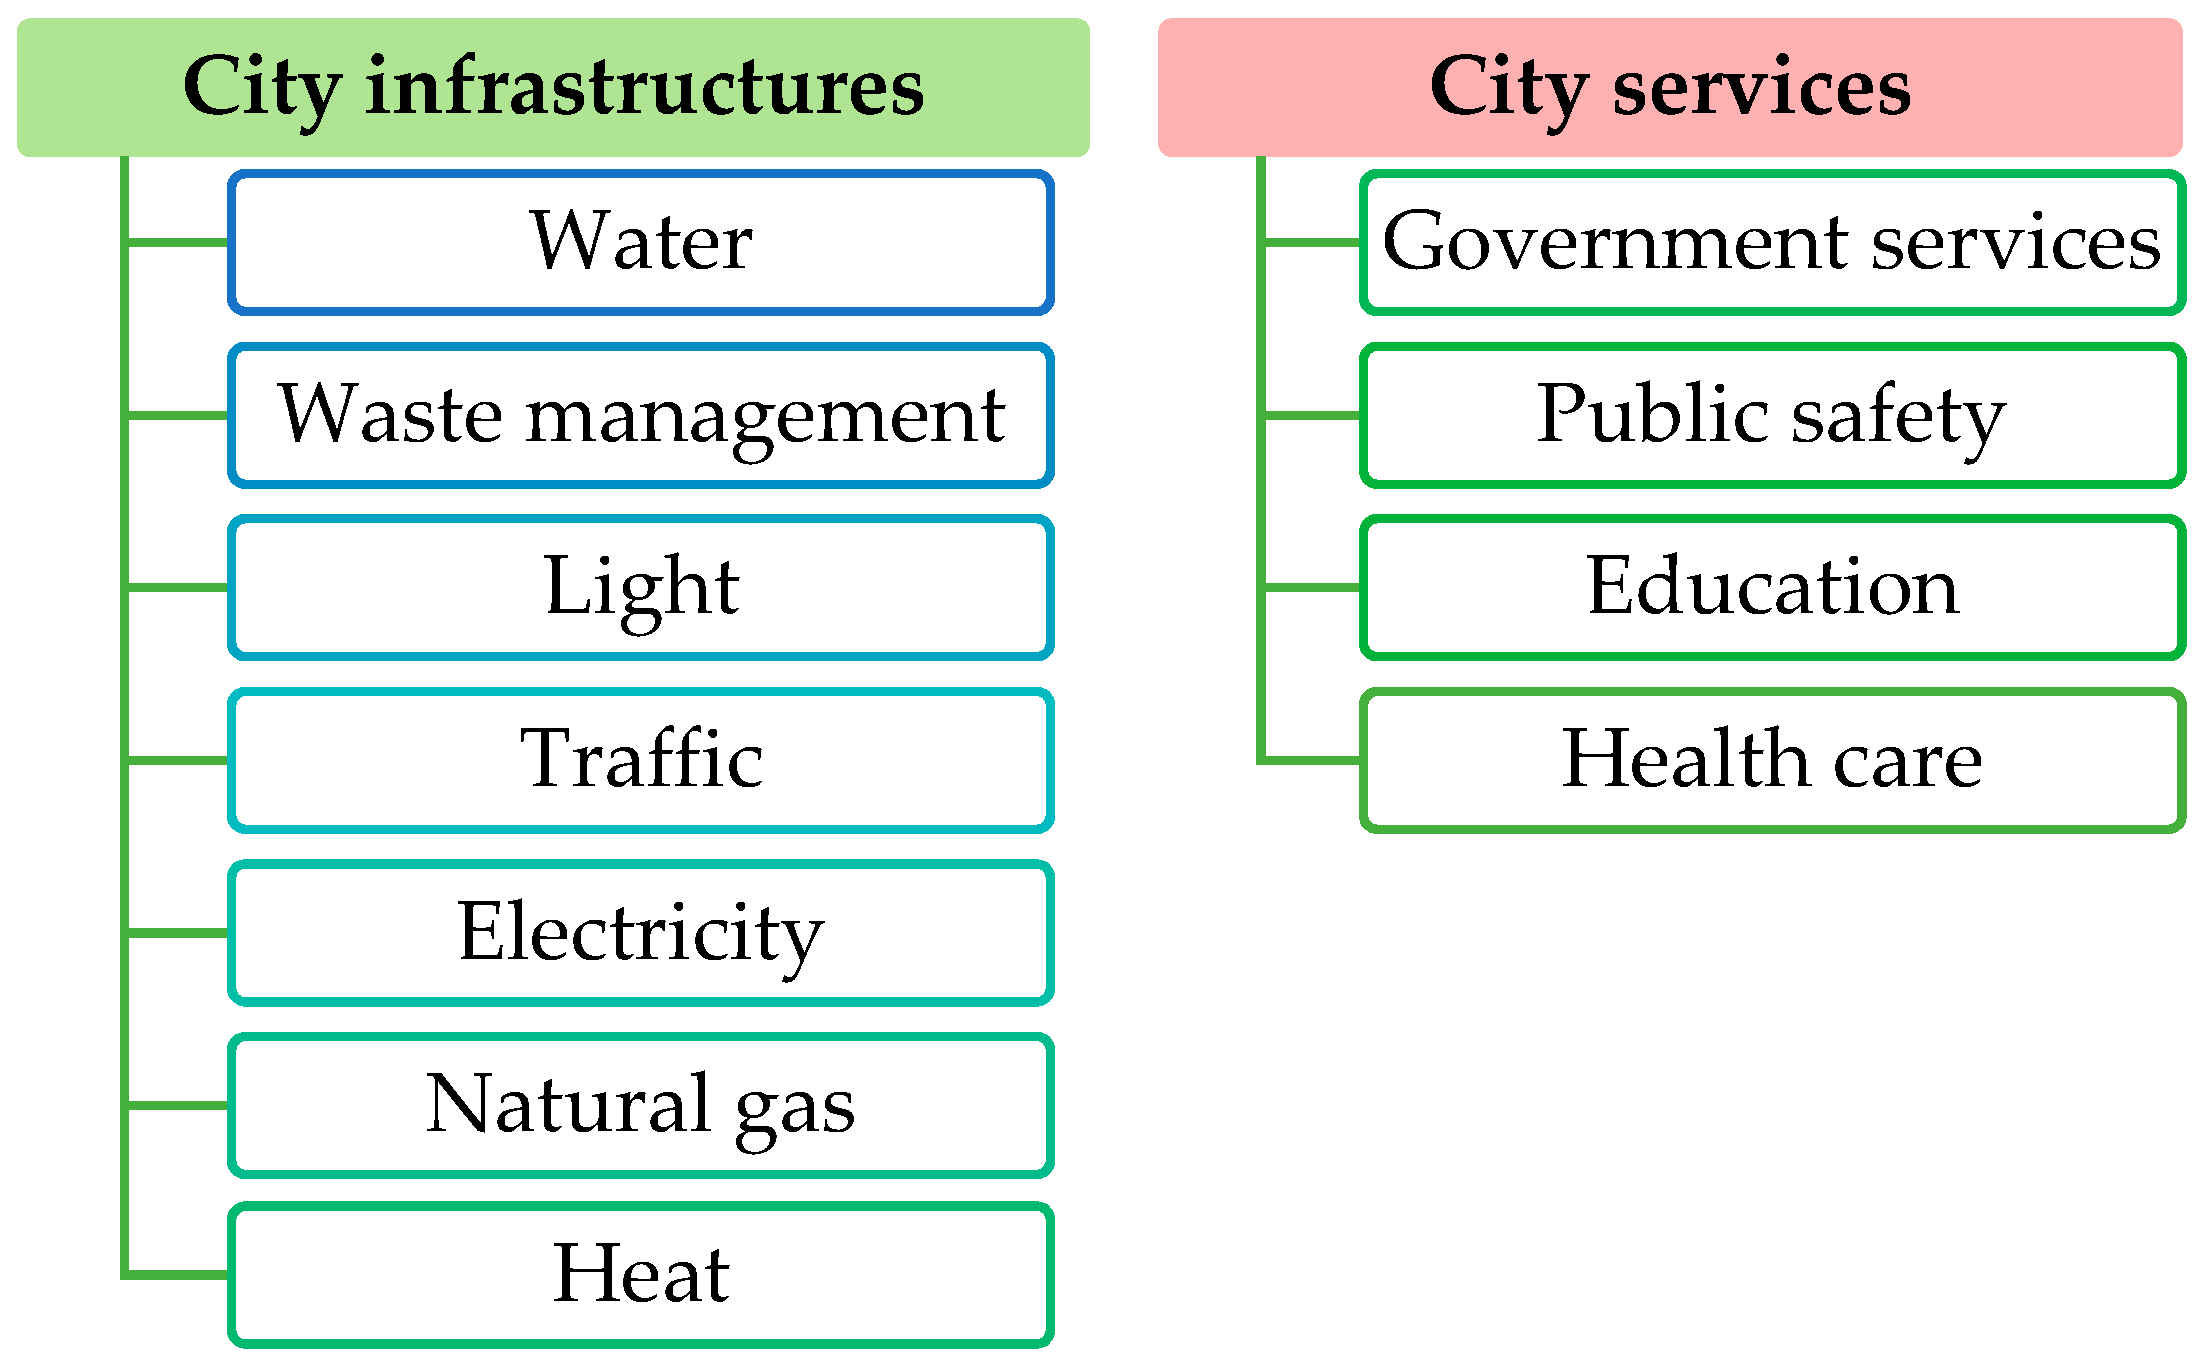
3.1. City Infrastructures
3.2. Technologies as Drivers for Urban Innovation Visions
4. Research Methodology
- The core system level is seen as the central part of the technology sector which is needed to be analyzed in the research and this system level leads to the occurrence of the others. In our case, we focus on construction, so we interpret buildings as the core system level.
- The sub-system level is composed of many parts which combine with each other to form the core system level. In this paper, the sub-system level is buildings’ parts as Bonev, Wörösch, and Hvam [26] propose that the building is the system containing various components such as door, window, foundation, plinth, roof, floor, wall, etc.
- The super-system level includes super-ordinate technologies, and the super-system level operates as the surroundings of the core system one. In buildings, the super-system is the buildings’ embedding environments such as energy supply, infrastructure for transportation, or communication technologies.
- The last system level in T-DNA, the associated one, is not in the hierarchy. It contains technologies that may not be components of the technology sector which is being researched but remarkably influence the activities of this sector. Construction machines/tools and materials are elements of the associated system of construction centered on buildings.
5. Data Source
5.1. The Process of T-DNA of Patents on Construction in the US
5.1.1. Step 1: Coding Patent Classifications
5.1.2. Step 2: Searching Patents and Organizing Patents to the Four System Levels
- Search patents
- Check the super-system
- Calculate precision
- n0
- : sample size,
- Z
- : the value correlating to the confidence level required,
- p
- : the predicted proportion showing the attribute of the population
- q
- : 1 − p
- e
- : the expected level of precision
5.1.3. Step 3: Creating T-DNA (Both Relative and Absolute Values)
5.2. Disaggregation
- The super-system
- The sub-system
- The associated system
5.3. Important Terms in the Core System
- tfij: term frequency of the concept i in the year j;
- idfij: inverse document frequency of the concept i in the year j;
- Sj: the number of patents in the year j;
- dfij: document frequency of the concept i in the year j.
6. Results and Discussion
- (r: compound growth rate (CGR) of patents;
- E: patent count of the end year–2014;
- B: patent count of the beginning year–1976;
- n: the number of years in the period)
7. Conclusions
Author Contributions
Funding
Conflicts of Interest
Appendix A

| System Level/Symbol | Sections/Classes Title | |
|---|---|---|
| Core System (Code B) | ||
| E04H (except E04H 4/00, 7/00 and 17/00) 1 | 1/00 | Buildings or groups of buildings for dwelling or office purposes; General layout, e.g., modular co-ordination, staggered storeys |
| 3/00 | Buildings or groups of buildings for public or similar purposes; Institutions, e.g., infirmaries, prisons | |
| 5/00 | Buildings or groups of buildings for industrial or agricultural purposes | |
| 6/00 | Buildings for parking cars, rolling-stock, aircraft, vessels, or like vehicles, e.g., garages | |
| 9/00 | Buildings, groups of buildings, or shelters, adapted to withstand or provide protection against, abnormal external influences, e.g., war-like action, earthquake, extreme climate | |
| 12/00 | Towers; Masts or poles; Chimney stacks; Water-towers; Methods of erecting such structures | |
| 13/00 | Monuments; Tombs; Burial vaults; Columbaria | |
| 14/00 | Buildings for combinations of different purposes not covered by any single one of main groups E04H 1/00-E04H 13/00 of this subclass, e.g., for double purpose | |
| 15/00 | Tents or canopies, in general | |
| Sub-System (Code C) | ||
| E03C | Domestic plumbing installations for fresh water or waste water | |
| E03D | Water-closets or urinals with flushing devices; flushing valves therefor | |
| E04B | General building constructions; walls, e.g., partitions; roofs; floors; ceilings; insulation or other protection of buildings | |
| E04C | Structural elements; building materials | |
| E04D | Roof coverings; sky-lights; gutters; roof-working tools | |
| E04F | Finishing work on buildings, e.g., stairs, floors | |
| E04H | 4/00 | Swimming or splash baths or pools |
| 17/00 | Fencing, e.g., fences, enclosures, corrals | |
| E05 | Locks; keys; window or door fittings; safes | |
| E06 | Doors, windows, shutters, or roller blinds, in general; ladders | |
| B66B | Elevators; escalators or moving walkways | |
| B66D | Capstans; winches; tackles, e.g., pulley blocks; hoists | |
| Y10S | 4/00 | Baths, closets, sinks, and spittoons |
| 52/03 | Static structures, e.g., buildings: Trailer or mobile home skirt | |
| 52/16 | Static structures, e.g., buildings: Roofing with pressure sensitive adhesive, e.g., shingle | |
| 52/17 | Static structures, e.g., buildings: with transparent walls or roof, e.g., sunroom | |
| 174/00 | Electricity: conductors and insulators | |
| 256/00 | Fences | |
| 439/00 | Electrical connectors | |
| Super-System (Code A) | ||
| E01 | Construction of roads, railways, or bridges | |
| E02 (except E02B 11/00, 13/00, 15/00 and 17/00) 2 | Hydraulic engineering; foundations; soil-shifting | |
| E03B | Installations or methods for obtaining, collecting, or distributing water | |
| E03F | Sewers; cesspools | |
| E21 | Earth drilling; mining | |
| B60M | Power supply lines, or devices along rails, for electrically-propelled vehicles | |
| B61B | Railway systems; equipment therefor not otherwise provided for | |
| B61L | Guiding railway traffic; ensuring the safety of railway traffic | |
| B64F | Ground or aircraft-carrier-deck installations specially adapted for use in connection with aircraft; designing, manufacturing, assembling, cleaning, maintaining or repairing aircraft, not otherwise provided for; handling, transporting, testing or inspecting aircraft components, not otherwise provided for | |
| B65F | Gathering or removal of domestic or like refuse | |
| C02 | Treatment of water, waste water, sewage, or sludge | |
| F21 | Lighting | |
| F24D | Domestic- or space-heating systems, e.g., central heating systems; domestic hot-water supply systems; elements or components therefor | |
| F24F | Air-conditioning; air-humidification; ventilation; use of air currents for screening | |
| H | Electricity | |
| Y02A | 20/00 | Water conservation; Efficient water supply; Efficient water use |
| 30/00 | Adapting or protecting infrastructure or their operation | |
| Y02B | Climate change mitigation technologies related to buildings, e.g., housing, house appliances or related end-user applications | |
| Y02D | Climate change mitigation technologies in information and communication technologies [ICT], i.e., information and communication technologies aiming at the reduction of thir own energy use | |
| Y02E | Reduction of greenhouse gas [GHG] emissions, related to energy generation, transmission or distribution | |
| Y02T | Climate change mitigation technologies related to transportation | |
| Y02W | 10/00 | Technologies for wastewater treatment |
| 30/00 | Technologies for solid waste management | |
| 90/00 | Enabling technologies or technologies with a potential or indirect contribution to greenhouse gas [GHG] emissions mitigation | |
| Y04 | Information or communication technologies having an impact on other technology areas | |
| Y10S | 48/00 | Gas: heating and illuminating |
| 132/902 | Toilet: Liquid treating forms and mandrels | |
| 200/00 | Electricity: circuit makers and breakers | |
| 237/00 | Heating systems | |
| 238/00 | Railways: surface track | |
| 246/00 | Railway switches and signals | |
| 307/00 | Electrical transmission or interconnection systems | |
| 322/00 | Electricity: single generator systems | |
| 323/00 | Electricity: power supply or regulation systems | |
| 343/00 | Communications: radio wave antennas | |
| 348/00 | Television | |
| 362/00 | Illumination | |
| 367/00 | Communications, electrical: acoustic wave systems and devices | |
| 370/00 | Multiplex communications | |
| 372/00 | Coherent light generators | |
| 379/00 | Telephonic communications | |
| 388/00 | Electricity: motor control systems | |
| 474/00 | Endless belt power transmission systems or components | |
| Y10T 307/00 | Electrical transmission or interconnection systems | |
| Associated System (Code D) | ||
| E04G | Scaffolding; forms; shuttering; building implements or other building aids, or their use; handling building materials on the site; repairing, breaking-up or other work on existing buildings | |
| E04H 7/00 | Construction or assembling of bulk storage containers employing civil engineering techniques in situ or off the site | |
| B28 | Working cement, clay, or stone | |
| B66C | Cranes; load-engaging elements or devices for cranes, capstans, winches, or tackles | |
| B66F | Hoisting, lifting, hauling, or pushing, not otherwise provided for, e.g., devices which apply a lifting or pushing force directly to the surface of a load | |
| C04 | Cements; concrete; artificial stone; ceramics; refractories | |
| Y10S | 52/00 (except Y10S 52/03, 52/16 and 52/17) 3 | Static structures, e.g., buildings |
| 187/90 | Temporary construction elevator for building | |
| Y02P 40/00 | Technologies relating to the processing of minerals | |
Appendix B
| Categories | Symbol | Sections/Classes Title | |
|---|---|---|---|
| Super-System | |||
| Traffic | E01 | Construction of roads, railways, or bridges | |
| E02B 5/00 | Artificial water canals | ||
| E02C | Ship-lifting devices or mechanisms | ||
| B60M | Power supply lines, or devices along rails, for electrically-propelled vehicles | ||
| B61L | Guiding railway traffic; ensuring the safety of railway traffic | ||
| Y10S | 238/00 | Railways: surface track | |
| 246/00 | Railway switches and signals | ||
| Water and hydraulic engineering | E02B | 1/00 | Equipment or apparatus for, or methods of, general hydraulic engineering |
| 3/00 | Engineering work in connection with control or use of streams, rivers, coasts, or other marine sites (barrages or weirs E02B 7/00); Sealings or joints for engineering work in general | ||
| 7/00 | Barrages or weirs; Layout, construction, methods of, or devices for, making same | ||
| 8/00 | Details of barrages or weirs | ||
| 9/00 | Water-power plants; Layout, construction or equipment, methods of, or apparatus for, making same | ||
| 2201/00 | Devices, constructional details or methods of hydraulic engineering not otherwise provided for | ||
| E02D | Foundations; excavations; embankments; Underground or underwater structures | ||
| E02F | Dredging; soil-shifting | ||
| E03B | Installations or methods for obtaining, collecting, or distributing water | ||
| E03F | Sewers; cesspools | ||
| Y02A 20/00 | Water conservation; Efficient water supply; Efficient water use | ||
| Treatment of waste | C02 | Treatment of water, waste water, sewage, or sludge | |
| Y10S 132/902 | Toilet: Liquid treating forms and mandrels | ||
| Y02W 10/00 | Technologies for wastewater treatment | ||
| Light | F21 | Lighting | |
| Y10S | 362/00 | Illumination | |
| 372/00 | Coherent light generators | ||
| Heat/cool air | F24D | Domestic- or space-heating systems, e.g., central heating systems; domestic hot-water supply systems; elements or components therefor | |
| F24F | Air-conditioning; air-humidification; ventilation; use of air currents for screening | ||
| Y10S 237/00 | Heating systems | ||
| Electricity and communication | H | Electricity | |
| Y04 | Information or communication technologies having an impact on other technology areas | ||
| Y10T 307/00 | Electrical transmission or interconnection systems | ||
| Y10S | 200/00 | Electricity: circuit makers and breakers | |
| 307/00 | Electrical transmission or interconnection systems | ||
| 322/00 | Electricity: single generator systems | ||
| 323/00 | Electricity: power supply or regulation systems | ||
| 343/00 | Communications: radio wave antennas | ||
| 348/00 | Television | ||
| 367/00 | Communications, electrical: acoustic wave systems and devices | ||
| 370/00 | Multiplex communications | ||
| 379/00 | Telephonic communications | ||
| 388/00 | Electricity: motor control systems | ||
| 474/00 | Endless belt power transmission systems or components | ||
| Climate change and environment protection | Y02B | Climate change mitigation technologies related to buildings, e.g., housing, house appliances or related end-user applications | |
| Y02D | Climate change mitigation technologies in information and communication technologies [ICT], i.e., information and communication technologies aiming at the reduction of thir own energy use | ||
| Y02E | Reduction of greenhouse gas [GHG] emissions, related to energy generation, transmission or distribution | ||
| Others | Y02A 30/00 | Adapting or protecting infrastructure or their operation | |
| Y10S 48/00 | Gas: heating and illuminating | ||
| Sub-System | |||
| Installation or devices related to water | E03C | Domestic plumbing installations for fresh water or waste water | |
| E03D | Water-closets or urinals with flushing devices; flushing valves therefor | ||
| E04H 4/00 | Swimming or splash baths or pools | ||
| Y10S 4/00 | Baths, closets, sinks, and spittoons | ||
| Floor, roof, wall, stairs, fence, etc. | E04B | General building constructions; walls, e.g., partitions; roofs; floors; ceilings; insulation or other protection of buildings | |
| E04C | Structural elements; building materials | ||
| E04D | Roof coverings; sky-lights; gutters; roof-working tools | ||
| E04F | Finishing work on buildings, e.g., stairs, floors | ||
| E04H 17/00 | Fencing, e.g., fences, enclosures, corrals | ||
| Y10S | 52/03 | Static structures, e.g., buildings: Trailer or mobile home skirt | |
| 52/16 | Static structures, e.g., buildings: Roofing with pressure sensitive adhesive, e.g., shingle | ||
| 52/17 | Static structures, e.g., buildings: with transparent walls or roof, e.g., sunroom | ||
| 256/00 | Fences | ||
| Door, window, lock, etc. | E05 | Locks; keys; window or door fittings; safes | |
| E06 | Doors, windows, shutters, or roller blinds, in general; ladders | ||
| Elevator, walkway | B66B | Elevators; escalators or moving walkways | |
| B66D | Capstans; winches; tackles, e.g., pulley blocks; hoists | ||
| Others | Y10S | 174/00 | Electricity: conductors and insulators |
| 439/00 | Electrical connectors | ||
| Associated System | |||
| Tools | E04G | Scaffolding; forms; shuttering; building implements or other building aids, or their use; handling building materials on the site; repairing, breaking-up or other work on existing buildings | |
| E04H 7/00 | Construction or assembling of bulk storage containers employing civil engineering techniques in situ or off the site | ||
| Y10S | 52/01 | Hand tools for assembling building components | |
| 52/02 | Masonry lattice or openwork | ||
| 52/05 | Designed for thermal distortion | ||
| 52/06 | Toothed connecting means | ||
| 52/08 | Imitation beams | ||
| 52/09 | Structure including reclaimed component, e.g., trash | ||
| 52/10 | Polyhedron | ||
| 52/11 | Mobile-structure stabilizing anchor | ||
| 52/12 | Temporary protective expedient | ||
| 52/13 | Hook and loop type fastener | ||
| 52/14 | Shelter shaped to article configuration | ||
| 52/15 | Seal for corrugated sheets | ||
| Materials | B28 | Working cement, clay, or stone | |
| C04 | Cements; concrete; artificial stone; ceramics; refractories | ||
| Y10S | 52/07 | Synthetic building materials, reinforcements and equivalents | |
| 52/90 | Hazardous material permeation prevention, e.g., radon | ||
| Y02P 40/00 | Technologies relating to the processing of minerals | ||
| Machines | B66C | Cranes; load-engaging elements or devices for cranes, capstans, winches, or tackles | |
| B66F | Hoisting, lifting, hauling, or pushing, not otherwise provided for, e.g., devices which apply a lifting or pushing force directly to the surface of a load | ||
| Y10S 52/04 | Magnetic connecting means for building components | ||
Appendix C
| Year | Installation or Devices Related to Water (1) | Floor, Roof, Wall, Stairs, Fence, etc. (2) | Door, Window, Lock, etc. (3) | Elevator, Walkway (4) | Others (5) | Total | The Dominant Code | |||||
|---|---|---|---|---|---|---|---|---|---|---|---|---|
| 1976 | 193 1 | (0.02) 2 | 713 | (0.02) | 778 | (0.02) | 156 | (0.02) | 50 | (0.01) | 1890 | 4 3 |
| 1977 | 207 | (0.02) | 720 | (0.02) | 813 | (0.02) | 134 | (0.02) | 49 | (0.01) | 1923 | 2 |
| 1978 | 182 | (0.02) | 681 | (0.02) | 835 | (0.02) | 124 | (0.02) | 60 | (0.01) | 1882 | 2 |
| 1979 | 171 | (0.02) | 656 | (0.02) | 786 | (0.02) | 130 | (0.02) | 65 | (0.01) | 1808 | 2 |
| 1980 | 156 | (0.01) | 663 | (0.02) | 785 | (0.02) | 128 | (0.02) | 63 | (0.01) | 1795 | 2 |
| 1981 | 143 | (0.01) | 590 | (0.02) | 706 | (0.01) | 118 | (0.01) | 109 | (0.02) | 1666 | 5 |
| 1982 | 136 | (0.01) | 559 | (0.01) | 707 | (0.01) | 139 | (0.02) | 97 | (0.02) | 1638 | 4 |
| 1983 | 150 | (0.01) | 585 | (0.02) | 702 | (0.01) | 147 | (0.02) | 82 | (0.01) | 1666 | 4 |
| 1984 | 156 | (0.01) | 631 | (0.02) | 726 | (0.01) | 127 | (0.02) | 91 | (0.02) | 1731 | 2 |
| 1985 | 160 | (0.01) | 680 | (0.02) | 826 | (0.02) | 132 | (0.02) | 106 | (0.02) | 1904 | 2 |
| 1986 | 178 | (0.02) | 776 | (0.02) | 916 | (0.02) | 148 | (0.02) | 115 | (0.02) | 2133 | 2 |
| 1987 | 217 | (0.02) | 781 | (0.02) | 1020 | (0.02) | 129 | (0.02) | 148 | (0.02) | 2295 | 5 |
| 1988 | 227 | (0.02) | 816 | (0.02) | 1047 | (0.02) | 126 | (0.02) | 143 | (0.02) | 2359 | 5 |
| 1989 | 251 | (0.02) | 970 | (0.03) | 1109 | (0.02) | 170 | (0.02) | 147 | (0.02) | 2647 | 2 |
| 1990 | 292 | (0.03) | 876 | (0.02) | 1183 | (0.02) | 187 | (0.02) | 151 | (0.02) | 2689 | 1 |
| 1991 | 271 | (0.02) | 900 | (0.02) | 1117 | (0.02) | 192 | (0.02) | 183 | (0.03) | 2663 | 5 |
| 1992 | 279 | (0.02) | 790 | (0.02) | 1062 | (0.02) | 175 | (0.02) | 175 | (0.03) | 2481 | 5 |
| 1993 | 301 | (0.03) | 879 | (0.02) | 1083 | (0.02) | 205 | (0.03) | 176 | (0.03) | 2644 | 5 |
| 1994 | 275 | (0.02) | 941 | (0.02) | 1263 | (0.03) | 219 | (0.03) | 159 | (0.03) | 2857 | 4 |
| 1995 | 319 | (0.03) | 1.065 | (0.03) | 1335 | (0.03) | 192 | (0.02) | 160 | (0.03) | 3071 | 1 |
| 1996 | 320 | (0.03) | 1.032 | (0.03) | 1403 | (0.03) | 197 | (0.02) | 171 | (0.03) | 3123 | 3 |
| 1997 | 380 | (0.03) | 1.229 | (0.03) | 1508 | (0.03) | 232 | (0.03) | 279 | (0.05) | 3628 | 5 |
| 1998 | 336 | (0.03) | 1.128 | (0.03) | 1497 | (0.03) | 200 | (0.02) | 289 | (0.05) | 3450 | 5 |
| 1999 | 334 | (0.03) | 1.245 | (0.03) | 1662 | (0.03) | 205 | (0.03) | 323 | (0.05) | 3769 | 5 |
| 2000 | 391 | (0.03) | 1.247 | (0.03) | 1634 | (0.03) | 245 | (0.03) | 313 | (0.05) | 3830 | 5 |
| 2001 | 392 | (0.03) | 1.239 | (0.03) | 1657 | (0.03) | 265 | (0.03) | 308 | (0.05) | 3861 | 5 |
| 2002 | 442 | (0.04) | 1.283 | (0.03) | 1744 | (0.04) | 221 | (0.03) | 299 | (0.05) | 3989 | 5 |
| 2003 | 377 | (0.03) | 1.212 | (0.03) | 1735 | (0.04) | 258 | (0.03) | 263 | (0.04) | 3845 | 5 |
| 2004 | 342 | (0.03) | 1.046 | (0.03) | 1630 | (0.03) | 337 | (0.04) | 254 | (0.04) | 3609 | 5 |
| 2005 | 329 | (0.03) | 918 | (0.02) | 1428 | (0.03) | 272 | (0.03) | 237 | (0.04) | 3184 | 5 |
| 2006 | 315 | (0.03) | 979 | (0.03) | 1406 | (0.03) | 269 | (0.03) | 238 | (0.04) | 3207 | 5 |
| 2007 | 313 | (0.03) | 991 | (0.03) | 1417 | (0.03) | 260 | (0.03) | 172 | (0.03) | 3153 | 4 |
| 2008 | 329 | (0.03) | 945 | (0.02) | 1364 | (0.03) | 272 | (0.03) | 174 | (0.03) | 3084 | 4 |
| 2009 | 309 | (0.03) | 1.037 | (0.03) | 1283 | (0.03) | 270 | (0.03) | 117 | (0.02) | 3016 | 4 |
| 2010 | 335 | (0.03) | 1.213 | (0.03) | 1443 | (0.03) | 248 | (0.03) | 94 | (0.02) | 3333 | 2 |
| 2011 | 414 | (0.04) | 1.318 | (0.03) | 1440 | (0.03) | 273 | (0.03) | 59 | (0.01) | 3504 | 1 |
| 2012 | 387 | (0.03) | 1.398 | (0.04) | 1636 | (0.03) | 325 | (0.04) | 46 | (0.01) | 3792 | 4 |
| 2013 | 505 | (0.04) | 1.628 | (0.04) | 1885 | (0.04) | 354 | (0.04) | 60 | (0.01) | 4432 | 1 |
| 2014 | 473 | (0.04) | 1.600 | (0.04) | 2055 | (0.04) | 335 | (0.04) | 28 | (0.00) | 4491 | 3 |
| Total | 11,287 | 37,960 | 48,626 | 8116 | 6053 | 112,042 | ||||||
Appendix D
| Year | Machines (1) | Materials (2) | Tools (3) | Total | The Dominant Code | |||
|---|---|---|---|---|---|---|---|---|
| 1976 | 311 1 | (0.03) 2 | 676 | (0.02) | 181 | (0.02) | 1168 | 1 3 |
| 1977 | 332 | (0.03) | 702 | (0.02) | 165 | (0.02) | 1199 | 1 |
| 1978 | 337 | (0.03) | 788 | (0.02) | 128 | (0.02) | 1253 | 1 |
| 1979 | 293 | (0.02) | 704 | (0.02) | 133 | (0.02) | 1130 | 1 |
| 1980 | 269 | (0.02) | 728 | (0.02) | 149 | (0.02) | 1146 | 1 |
| 1981 | 237 | (0.02) | 724 | (0.02) | 167 | (0.02) | 1128 | 3 |
| 1982 | 254 | (0.02) | 714 | (0.02) | 133 | (0.02) | 1101 | 1 |
| 1983 | 194 | (0.02) | 696 | (0.02) | 126 | (0.02) | 1016 | 3 |
| 1984 | 245 | (0.02) | 751 | (0.02) | 138 | (0.02) | 1134 | 1 |
| 1985 | 256 | (0.02) | 816 | (0.02) | 154 | (0.02) | 1226 | 1 |
| 1986 | 228 | (0.02) | 914 | (0.02) | 144 | (0.02) | 1286 | 2 |
| 1987 | 225 | (0.02) | 1006 | (0.02) | 168 | (0.02) | 1399 | 2 |
| 1988 | 255 | (0.02) | 1221 | (0.03) | 183 | (0.02) | 1659 | 2 |
| 1989 | 228 | (0.02) | 1258 | (0.03) | 213 | (0.03) | 1699 | 2 |
| 1990 | 261 | (0.02) | 1328 | (0.03) | 180 | (0.02) | 1769 | 2 |
| 1991 | 285 | (0.02) | 1321 | (0.03) | 208 | (0.03) | 1814 | 2 |
| 1992 | 251 | (0.02) | 1202 | (0.03) | 172 | (0.02) | 1625 | 2 |
| 1993 | 256 | (0.02) | 1219 | (0.03) | 180 | (0.02) | 1655 | 2 |
| 1994 | 303 | (0.02) | 1259 | (0.03) | 214 | (0.03) | 1776 | 2 |
| 1995 | 255 | (0.02) | 1457 | (0.03) | 205 | (0.03) | 1917 | 2 |
| 1996 | 306 | (0.02) | 1230 | (0.03) | 230 | (0.03) | 1766 | 3 |
| 1997 | 294 | (0.02) | 1308 | (0.03) | 248 | (0.03) | 1850 | 3 |
| 1998 | 339 | (0.03) | 1143 | (0.03) | 249 | (0.03) | 1731 | 3 |
| 1999 | 344 | (0.03) | 1235 | (0.03) | 263 | (0.03) | 1842 | 3 |
| 2000 | 328 | (0.03) | 1376 | (0.03) | 252 | (0.03) | 1956 | 3 |
| 2001 | 376 | (0.03) | 1515 | (0.03) | 276 | (0.04) | 2167 | 3 |
| 2002 | 355 | (0.03) | 1510 | (0.03) | 301 | (0.04) | 2166 | 3 |
| 2003 | 320 | (0.03) | 1269 | (0.03) | 208 | (0.03) | 1797 | 2 |
| 2004 | 310 | (0.03) | 1286 | (0.03) | 209 | (0.03) | 1805 | 2 |
| 2005 | 296 | (0.02) | 1182 | (0.03) | 150 | (0.02) | 1628 | 2 |
| 2006 | 328 | (0.03) | 1203 | (0.03) | 180 | (0.02) | 1711 | 2 |
| 2007 | 356 | (0.03) | 1271 | (0.03) | 176 | (0.02) | 1803 | 1 |
| 2008 | 319 | (0.03) | 1210 | (0.03) | 138 | (0.02) | 1667 | 2 |
| 2009 | 395 | (0.03) | 1296 | (0.03) | 178 | (0.02) | 1869 | 1 |
| 2010 | 387 | (0.03) | 1330 | (0.03) | 216 | (0.03) | 1933 | 1 |
| 2011 | 424 | (0.03) | 1452 | (0.03) | 178 | (0.02) | 2054 | 1 |
| 2012 | 457 | (0.04) | 1414 | (0.03) | 250 | (0.03) | 2121 | 1 |
| 2013 | 531 | (0.04) | 1419 | (0.03) | 294 | (0.04) | 2244 | 1 |
| 2014 | 564 | (0.05) | 1326 | (0.03) | 282 | (0.04) | 2172 | 1 |
| Total | 12,.304 | 44,459 | 7619 | 64,382 | ||||
References
- Dvir, R.; Pasher, E. Innovation engines for knowledge cities: An innovation ecology perspective. J. Knowl. Manag. 2004, 8, 16–27. [Google Scholar] [CrossRef]
- Bottero, M.; Caprioli, C.; Cotella, G.; Santangelo, M. Sustainable cities: A reflection on potentialities and limits based on existing eco-districts in Europe. Sustainability 2019, 11, 5794. [Google Scholar] [CrossRef]
- Shahidehpour, M.; Li, Z.; Ganji, M. Smart Cities for a Sustainable Urbanization: Illuminating the Need for Establishing Smart Urban Infrastructures. IEEE Electrif. Mag. 2018, 6, 16–33. [Google Scholar] [CrossRef]
- Milošević, M.R.; Milošević, D.M.; Stević, D.M.; Stanojević, A.D. Smart city: Modeling key indicators in Serbia using IT2FS. Sustainability 2019, 11, 3536. [Google Scholar] [CrossRef]
- Naphade, M.; Banavar, G.; Harrison, C.; Paraszczak, J.; Morris, R. Smarter cities and their innovation challenges. Computer (Long. Beach. Calif). 2011, 44, 32–39. [Google Scholar] [CrossRef]
- Moore, M.; Gould, P.; Keary, B.S. Global urbanization and impact on health. Int. J. Hyg. Environ. Health 2003, 206, 269–278. [Google Scholar] [CrossRef]
- Nam, T.; Pardo, T.A. Smart City as Urban Innovation: Focusing on Management, Policy, and Context. In Proceedings of the 5th international conference on theory and practice of electronic governance, Tallinn, Estonia, 26–28 September 2011; ACM: New York, NY, USA, 2011; pp. 185–194. [Google Scholar]
- Han, J.; Fontanos, P.; Fukushi, K.; Herath, S.; Heeren, N.; Naso, V.; Cecchi, C.; Edwards, P.; Takeuchi, K. Innovation for sustainability: Toward a sustainable urban future in industrialized cities. Sustain. Sci. 2012, 7, 91–100. [Google Scholar] [CrossRef]
- Li, C.; Liu, X.; Dai, Z.; Zhao, Z. Smart City: A Shareable Framework and Its Applications in China. Sustainability 2019, 11, 4346. [Google Scholar] [CrossRef]
- Huston, S.; Rahimzad, R.; Parsa, A. ‘Smart’ sustainable urban regeneration: Institutions, quality and financial innovation. Cities 2015, 48, 66–75. [Google Scholar] [CrossRef]
- Yang, J.; Li, S.; Lu, H. Quantitative influence of land-use changes and urban expansion intensity on landscape pattern in Qingdao, China: Implications for urban sustainability. Sustainability 2019, 11, 6174. [Google Scholar] [CrossRef]
- Han, H.; Hawken, S. Introduction: Innovation and identity in next-generation smart cities. City Cult. Soc. 2018, 12, 1–4. [Google Scholar] [CrossRef]
- Ree, J.J.; Kim, K. Smart grid R & D planning based on patent analysis. Sustainability 2019, 11, 2907. [Google Scholar]
- Milanez, D.H.; de Faria, L.I.L.; do Amaral, R.M.; Gregolin, A.J.R. Claim-based patent indicators: A novel approach to analyze patent content and monitor technological advances. World Pat. Inf. 2017, 50, 64–72. [Google Scholar] [CrossRef]
- Brochner, J. Construction patents and university-industry research interaction: An analysis of Nordic region data. Constr. Innov. 2013, 13, 410–423. [Google Scholar] [CrossRef]
- Komninos, N. Intelligent cities: towards interactive and global innovation environments. Int. J. Innov. Reg. Dev. 2009, 1, 337–355. [Google Scholar] [CrossRef]
- Meijer, A.; Bolívar, M.P.R. Governing the smart city: A review of the literature on smart urban governance. Int. Rev. Adm. Sci. 2016, 82, 392–408. [Google Scholar] [CrossRef]
- Washburn, D.; Sindhu, U.; Balaouras, S.; Dines, R.A.; Hayes, N.M.; Nelson, L.E. Helping CIOs understand “smart city” initiatives: Defining the Smart City, Its Drivers, and the Role of the CIO. Growth 2010, 17, 1–17. [Google Scholar]
- Lim, H.S.M.; Taeihagh, A. Algorithmic decision-making in AVs: Understanding ethical and technical concerns for smart cities. Sustainability 2019, 11, 5791. [Google Scholar] [CrossRef]
- Kim, K.; Jung, J.K.; Choi, J.Y. Impact of the smart city industry on the Korean national economy: Input-output analysis. Sustainability 2016, 8, 649. [Google Scholar] [CrossRef]
- De Lotto, R.; Di Popolo, V.G.C.M.; Venco, E.M. From resilience to flexibility: Urban scenario to reduce hazard. In Proceedings of the 11th International Conference on Urban Regeneration and Sustainability, Alicante, Spain, 12–14 July 2016; Volume 12, pp. 789–799. [Google Scholar]
- Nesticò, A.; Sica, F. The sustainability of urban renewal projects: A model for economic multi-criteria analysis. J. Prop. Invest. Financ. 2017, 35, 397–409. [Google Scholar] [CrossRef]
- Nesticò, A.; Somma, P. Comparative analysis of multi-criteria methods for the enhancement of historical buildings. Sustainability 2019, 11, 4526. [Google Scholar] [CrossRef]
- Roepke, S.; Moehrle, M.G. Sequencing the evolution of technologies in a system-oriented way: The concept of technology-DNA. J. Eng. Technol. Manag. 2014, 32, 110–128. [Google Scholar] [CrossRef]
- Bellgran, M.; Säfsten, K. Production System. In Production Development: Design and Operation of Production Systems; Springer Science & Business Media: Berlin, German, 2009; pp. 37–47. [Google Scholar]
- Bonev, M.; Wörösch, M.; Hvam, L. Utilizing platforms in industrialized construction: A case study of a precast manufacturer. Constr. Innov. 2015, 15, 84–106. [Google Scholar] [CrossRef]
- Hung, S.C.; Lai, J.Y. When innovations meet chaos: Analyzing the technology development of printers in 1976–2012. J. Eng. Technol. Manag. 2016, 42, 31–45. [Google Scholar] [CrossRef]
- Moehrle, M.G.; Wustmans, M.; Gerken, J.M. How business methods accompany technological innovations - A case study using semantic patent analysis and a novel informetric measure. R D Manag. 2017, 48, 331–342. [Google Scholar] [CrossRef]
- Buckland, M.; Gey, F. The relationship between Recall and Precision. J. Am. Soc. Inf. Sci. 1994, 45, 12–19. [Google Scholar] [CrossRef]
- Israel, G. Determining Sample Size. Univ. Florida Coop. Ext. Serv. Instititute Food Agric. Sci. 1992, 85, 108–113. [Google Scholar]
- Paquette, L.R. Growth rates as measures of financial performance. J. Account. Educ. 2005, 23, 67–78. [Google Scholar] [CrossRef]
- USPTO. Classification Resources. Available online: https://www.uspto.gov/web/patents/classification/cpc/html/cpc.html. (accessed on 11 October 2018).


| Authors | Important Factors of Urban Innovation |
|---|---|
| Washburn et al. [18] | Technologies |
| Naphade et al. [5] | Integration of interconnected systems in a city in a closed process |
| Komninos [16] | Technologies (intellectual properties), people, and knowledge |
| Han and Hawken [12] | Technologies, businesses, social identity, culture |
| Meijer and Bolívar [17] | Technologies, politics, processes, smart cooperation, government policies, etc. |
| Application Year | Super-System | Core System | Sub-System | Associated System | Total |
|---|---|---|---|---|---|
| 1976 | 12,399 | 135 | 1851 | 1144 | 15,529 |
| 1977 | 12,497 | 135 | 1882 | 1189 | 15,703 |
| 1978 | 12,838 | 139 | 1847 | 1231 | 16,055 |
| 1979 | 12,801 | 155 | 1754 | 1121 | 15,831 |
| 1980 | 13,538 | 104 | 1769 | 1128 | 16,539 |
| 1981 | 12,822 | 102 | 1645 | 1109 | 15,678 |
| 1982 | 13,229 | 114 | 1617 | 1088 | 16,048 |
| 1983 | 12,570 | 92 | 1625 | 1003 | 15,290 |
| 1984 | 13,819 | 110 | 1696 | 1121 | 16,746 |
| 1985 | 14,929 | 124 | 1863 | 1215 | 18,131 |
| 1986 | 15,722 | 155 | 2089 | 1273 | 19,239 |
| 1987 | 16,729 | 154 | 2253 | 1374 | 20,510 |
| 1988 | 19,227 | 208 | 2311 | 1638 | 23,384 |
| 1989 | 21,040 | 190 | 2581 | 1681 | 25,492 |
| 1990 | 21,914 | 207 | 2608 | 1748 | 26,477 |
| 1991 | 23,367 | 220 | 2597 | 1791 | 27,975 |
| 1992 | 24,828 | 199 | 2436 | 1605 | 29,068 |
| 1993 | 25,605 | 192 | 2589 | 1623 | 30,009 |
| 1994 | 30,861 | 231 | 2786 | 1738 | 35,616 |
| 1995 | 36,595 | 225 | 2993 | 1881 | 41,694 |
| 1996 | 41,040 | 302 | 3052 | 1736 | 46,130 |
| 1997 | 49,460 | 277 | 3556 | 1815 | 55,108 |
| 1998 | 51,369 | 278 | 3363 | 1706 | 56,716 |
| 1999 | 56,043 | 273 | 3687 | 1803 | 61,,806 |
| 2000 | 62,271 | 284 | 3731 | 1923 | 68,209 |
| 2001 | 67,321 | 225 | 3709 | 2096 | 73,351 |
| 2002 | 69,167 | 299 | 3908 | 2116 | 75,490 |
| 2003 | 67,626 | 247 | 3767 | 1760 | 73,400 |
| 2004 | 69,962 | 210 | 3535 | 1776 | 75,483 |
| 2005 | 73,208 | 221 | 3123 | 1582 | 78,134 |
| 2006 | 76,722 | 194 | 3125 | 1662 | 81,703 |
| 2007 | 79,524 | 198 | 3070 | 1750 | 84,542 |
| 2008 | 81,140 | 210 | 2993 | 1618 | 85,961 |
| 2009 | 79,010 | 212 | 2925 | 1805 | 83,952 |
| 2010 | 84,623 | 298 | 3226 | 1852 | 89,999 |
| 2011 | 93,527 | 320 | 3378 | 1962 | 99,187 |
| 2012 | 104,122 | 355 | 3626 | 2016 | 110,119 |
| 2013 | 108,566 | 434 | 4235 | 2128 | 115,363 |
| 2014 | 106,121 | 481 | 4222 | 2038 | 112,862 |
| 2015 | 94,261 | 449 | 3641 | 1509 | 99,860 |
| 2016 | 67,764 | 366 | 2753 | 990 | 71,873 |
| 2017 | 31,045 | 169 | 1289 | 435 | 32,938 |
| 2018 | 2457 | 12 | 95 | 44 | 2608 |
| Total | 1,983,679 | 9505 | 116,801 | 65,823 | 2,175,808 |
| Application Year | Super-System | Core System | Sub-System | Associated System | The Dominant Code |
|---|---|---|---|---|---|
| 1976 | 0.01 | 0.02 | 0.02 | 0.02 | D |
| 1977 | 0.01 | 0.02 | 0.02 | 0.02 | D |
| 1978 | 0.01 | 0.02 | 0.02 | 0.02 | D |
| 1979 | 0.01 | 0.02 | 0.02 | 0.02 | B |
| 1980 | 0.01 | 0.01 | 0.02 | 0.02 | D |
| 1981 | 0.01 | 0.01 | 0.02 | 0.02 | D |
| 1982 | 0.01 | 0.01 | 0.01 | 0.02 | D |
| 1983 | 0.01 | 0.01 | 0.01 | 0.02 | D |
| 1984 | 0.01 | 0.01 | 0.02 | 0.02 | D |
| 1985 | 0.01 | 0.01 | 0.02 | 0.02 | D |
| 1986 | 0.01 | 0.02 | 0.02 | 0.02 | D |
| 1987 | 0.01 | 0.02 | 0.02 | 0.02 | D |
| 1988 | 0.01 | 0.02 | 0.02 | 0.03 | D |
| 1989 | 0.01 | 0.02 | 0.02 | 0.03 | D |
| 1990 | 0.01 | 0.02 | 0.02 | 0.03 | D |
| 1991 | 0.01 | 0.03 | 0.02 | 0.03 | D |
| 1992 | 0.01 | 0.02 | 0.02 | 0.03 | D |
| 1993 | 0.01 | 0.02 | 0.02 | 0.03 | D |
| 1994 | 0.02 | 0.03 | 0.03 | 0.03 | D |
| 1995 | 0.02 | 0.03 | 0.03 | 0.03 | D |
| 1996 | 0.02 | 0.04 | 0.03 | 0.03 | B |
| 1997 | 0.03 | 0.03 | 0.03 | 0.03 | C |
| 1998 | 0.03 | 0.03 | 0.03 | 0.03 | B |
| 1999 | 0.03 | 0.03 | 0.03 | 0.03 | C |
| 2000 | 0.03 | 0.03 | 0.03 | 0.03 | A |
| 2001 | 0.04 | 0.03 | 0.03 | 0.03 | A |
| 2002 | 0.04 | 0.04 | 0.04 | 0.03 | A |
| 2003 | 0.04 | 0.03 | 0.03 | 0.03 | A |
| 2004 | 0.04 | 0.02 | 0.03 | 0.03 | A |
| 2005 | 0.04 | 0.03 | 0.03 | 0.03 | A |
| 2006 | 0.04 | 0.02 | 0.03 | 0.03 | A |
| 2007 | 0.04 | 0.02 | 0.03 | 0.03 | A |
| 2008 | 0.05 | 0.02 | 0.03 | 0.03 | A |
| 2009 | 0.04 | 0.02 | 0.03 | 0.03 | A |
| 2010 | 0.05 | 0.04 | 0.03 | 0.03 | A |
| 2011 | 0.05 | 0.04 | 0.03 | 0.03 | A |
| 2012 | 0.06 | 0.04 | 0.03 | 0.03 | A |
| 2013 | 0.06 | 0.05 | 0.04 | 0.03 | A |
| 2014 | 0.06 | 0.06 | 0.04 | 0.03 | A |
| Application Year | Traffic (1) | Water and Hydraulic Engineering (2) | Treatment of Waste (3) | Light (4) | Heat/Cool Air (5) | Electricity and Communication (6) | Climate Change and Environment Protection (7) | Others (8) | Total | The Dominant Code | ||||||||
|---|---|---|---|---|---|---|---|---|---|---|---|---|---|---|---|---|---|---|
| 1976 | 354 1 | (0.02) 2 | 638 | (0.02) | 481 | (0.02) | 228 | (0.01) | 283 | (0.02) | 9770 | (0.01) | 1155 | (0.01) | 74 | (0.02) | 12,983 | 8 3 |
| 1977 | 414 | (0.02) | 619 | (0.02) | 484 | (0.02) | 247 | (0.01) | 333 | (0.02) | 9705 | (0.01) | 1301 | (0.01) | 65 | (0.02) | 13,168 | 2 |
| 1978 | 428 | (0.02) | 562 | (0.02) | 489 | (0.02) | 250 | (0.01) | 342 | (0.02) | 10,092 | (0.01) | 1375 | (0.01) | 83 | (0.03) | 13,621 | 8 |
| 1979 | 409 | (0.02) | 528 | (0.02) | 474 | (0.02) | 266 | (0.01) | 320 | (0.02) | 10,078 | (0.01) | 1339 | (0.01) | 76 | (0.02) | 13,490 | 8 |
| 1980 | 401 | (0.02) | 550 | (0.02) | 480 | (0.02) | 260 | (0.01) | 327 | (0.02) | 10,822 | (0.01) | 1381 | (0.01) | 57 | (0.02) | 14,278 | 1 |
| 1981 | 338 | (0.02) | 449 | (0.02) | 398 | (0.01) | 214 | (0.01) | 328 | (0.02) | 10,535 | (0.01) | 1235 | (0.01) | 73 | (0.02) | 13,570 | 8 |
| 1982 | 279 | (0.01) | 369 | (0.01) | 350 | (0.01) | 243 | (0.01) | 287 | (0.02) | 11,114 | (0.01) | 1101 | (0.01) | 77 | (0.02) | 13,820 | 8 |
| 1983 | 270 | (0.01) | 366 | (0.01) | 337 | (0.01) | 224 | (0.01) | 254 | (0.01) | 10,693 | (0.01) | 932 | (0.01) | 83 | (0.03) | 13,159 | 8 |
| 1984 | 350 | (0.02) | 389 | (0.01) | 366 | (0.01) | 330 | (0.01) | 266 | (0.01) | 11,601 | (0.01) | 1111 | (0.01) | 62 | (0.02) | 14,475 | 8 |
| 1985 | 316 | (0.02) | 441 | (0.02) | 422 | (0.02) | 302 | (0.01) | 300 | (0.02) | 12,667 | (0.01) | 1037 | (0.01) | 66 | (0.02) | 15,551 | 8 |
| 1986 | 368 | (0.02) | 444 | (0.02) | 435 | (0.02) | 327 | (0.01) | 265 | (0.01) | 13,519 | (0.01) | 1003 | (0.01) | 77 | (0.02) | 16,438 | 8 |
| 1987 | 398 | (0.02) | 534 | (0.02) | 520 | (0.02) | 369 | (0.01) | 288 | (0.02) | 14,320 | (0.01) | 922 | (0.01) | 64 | (0.02) | 17,415 | 8 |
| 1988 | 524 | (0.03) | 518 | (0.02) | 513 | (0.02) | 461 | (0.01) | 315 | (0.02) | 16,639 | (0.01) | 987 | (0.01) | 65 | (0.02) | 20,022 | 1 |
| 1989 | 476 | (0.02) | 619 | (0.02) | 615 | (0.02) | 537 | (0.02) | 333 | (0.02) | 18,159 | (0.01) | 1096 | (0.01) | 91 | (0.03) | 21,926 | 8 |
| 1990 | 488 | (0.02) | 632 | (0.02) | 643 | (0.02) | 548 | (0.02) | 348 | (0.02) | 19,044 | (0.01) | 1041 | (0.01) | 67 | (0.02) | 22,811 | 1 |
| 1991 | 485 | (0.02) | 640 | (0.02) | 692 | (0.02) | 537 | (0.02) | 385 | (0.02) | 20,403 | (0.01) | 1164 | (0.01) | 61 | (0.02) | 24,367 | 3 |
| 1992 | 498 | (0.02) | 645 | (0.02) | 704 | (0.03) | 547 | (0.02) | 373 | (0.02) | 21,716 | (0.01) | 1358 | (0.01) | 78 | (0.02) | 25,919 | 3 |
| 1993 | 464 | (0.02) | 609 | (0.02) | 707 | (0.03) | 588 | (0.02) | 415 | (0.02) | 22,506 | (0.01) | 1370 | (0.01) | 54 | (0.02) | 26,713 | 3 |
| 1994 | 539 | (0.03) | 675 | (0.02) | 813 | (0.03) | 631 | (0.02) | 412 | (0.02) | 27,415 | (0.02) | 1723 | (0.01) | 74 | (0.02) | 32,282 | 3 |
| 1995 | 632 | (0.03) | 703 | (0.02) | 892 | (0.03) | 695 | (0.02) | 435 | (0.02) | 32,837 | (0.02) | 1819 | (0.01) | 76 | (0.02) | 38,089 | 3 |
| 1996 | 567 | (0.03) | 730 | (0.03) | 817 | (0.03) | 769 | (0.02) | 473 | (0.03) | 37,356 | (0.02) | 1863 | (0.01) | 79 | (0.02) | 42,654 | 3 |
| 1997 | 594 | (0.03) | 804 | (0.03) | 853 | (0.03) | 826 | (0.02) | 499 | (0.03) | 45,601 | (0.03) | 2021 | (0.02) | 97 | (0.03) | 51,295 | 8 |
| 1998 | 585 | (0.03) | 744 | (0.03) | 826 | (0.03) | 832 | (0.02) | 496 | (0.03) | 47,789 | (0.03) | 2047 | (0.02) | 70 | (0.02) | 53,389 | 3 |
| 1999 | 651 | (0.03) | 813 | (0.03) | 913 | (0.03) | 914 | (0.03) | 478 | (0.03) | 52,184 | (0.03) | 2288 | (0.02) | 91 | (0.03) | 58,332 | 3 |
| 2000 | 627 | (0.03) | 845 | (0.03) | 966 | (0.03) | 1073 | (0.03) | 490 | (0.03) | 58,338 | (0.04) | 2565 | (0.02) | 81 | (0.03) | 64,985 | 6 |
| 2001 | 621 | (0.03) | 794 | (0.03) | 947 | (0.03) | 1107 | (0.03) | 589 | (0.03) | 63,769 | (0.04) | 3312 | (0.03) | 171 | (0.05) | 71,310 | 8 |
| 2002 | 675 | (0.03) | 854 | (0.03) | 963 | (0.03) | 1185 | (0.03) | 561 | (0.03) | 64,421 | (0.04) | 3463 | (0.03) | 75 | (0.02) | 72,197 | 6 |
| 2003 | 572 | (0.03) | 846 | (0.03) | 815 | (0.03) | 1227 | (0.03) | 598 | (0.03) | 63,202 | (0.04) | 3427 | (0.03) | 73 | (0.02) | 70,760 | 6 |
| 2004 | 568 | (0.03) | 776 | (0.03) | 816 | (0.03) | 1139 | (0.03) | 580 | (0.03) | 65,601 | (0.04) | 3838 | (0.03) | 56 | (0.02) | 73,374 | 6 |
| 2005 | 577 | (0.03) | 787 | (0.03) | 862 | (0.03) | 1208 | (0.03) | 538 | (0.03) | 68,876 | (0.04) | 4264 | (0.03) | 72 | (0.02) | 77,184 | 6 |
| 2006 | 548 | (0.03) | 789 | (0.03) | 827 | (0.03) | 1254 | (0.04) | 488 | (0.03) | 72,405 | (0.04) | 4731 | (0.04) | 53 | (0.02) | 81,095 | 6 |
| 2007 | 541 | (0.03) | 843 | (0.03) | 863 | (0.03) | 1338 | (0.04) | 518 | (0.03) | 74,955 | (0.05) | 5705 | (0.04) | 79 | (0.02) | 84,842 | 6 |
| 2008 | 586 | (0.03) | 810 | (0.03) | 857 | (0.03) | 1566 | (0.04) | 507 | (0.03) | 76,127 | (0.05) | 6719 | (0.05) | 67 | (0.02) | 87,239 | 7 |
| 2009 | 485 | (0.02) | 823 | (0.03) | 818 | (0.03) | 1646 | (0.05) | 561 | (0.03) | 73,813 | (0.04) | 7736 | (0.06) | 87 | (0.03) | 85,969 | 7 |
| 2010 | 636 | (0.03) | 963 | (0.03) | 1000 | (0.04) | 1816 | (0.05) | 681 | (0.04) | 78,732 | (0.05) | 9374 | (0.07) | 92 | (0.03) | 93,294 | 7 |
| 2011 | 694 | (0.03) | 1082 | (0.04) | 983 | (0.03) | 2164 | (0.06) | 727 | (0.04) | 87,463 | (0.05) | 10,732 | (0.08) | 121 | (0.04) | 103,966 | 7 |
| 2012 | 810 | (0.04) | 1262 | (0.04) | 1068 | (0.04) | 2390 | (0.07) | 865 | (0.05) | 97,784 | (0.06) | 11,574 | (0.09) | 116 | (0.04) | 115,869 | 7 |
| 2013 | 844 | (0.04) | 1276 | (0.05) | 1105 | (0.04) | 2797 | (0.08) | 907 | (0.05) | 102,383 | (0.06) | 11,426 | (0.09) | 130 | (0.04) | 120,868 | 7 |
| 2014 | 897 | (0.04) | 1377 | (0.05) | 993 | (0.04) | 2546 | (0.07) | 945 | (0.05) | 100,434 | (0.06) | 9621 | (0.07) | 128 | (0.04) | 116,941 | 7 |
| Total | 20,509 | 28,148 | 28,107 | 35,601 | 18,110 | 1,644,868 | 131,156 | 3,161 | 1,909,660 | |||||||||
| Periods | 1976 to 2014 | 2011 to 2014 | |
|---|---|---|---|
| No. | |||
| 1 | side wall | side wall | |
| 2 | panel wall | panel wall | |
| 3 | panel side | panel panel | |
| 4 | panel panel | frame frame | |
| 5 | lower upper | panel side | |
| 6 | portion portion | base plate | |
| 7 | wall wall | panel roof | |
| 8 | panel roof | panel solar | |
| 9 | side side | portion portion | |
| 10 | frame frame | side side | |
| 11 | edge panel | lower upper | |
| 12 | portion upper | floor panel | |
| 13 | edge side | wall wall | |
| 14 | building structure | assembly wall | |
| 15 | floor panel | turbine wind | |
| 16 | lower portion | protective shelter | |
| 17 | outer surface | plate plate | |
| 18 | pole pole | assembly panel | |
| 19 | base plate | frame structure | |
| 20 | portion side | panel plurality | |
© 2019 by the authors. Licensee MDPI, Basel, Switzerland. This article is an open access article distributed under the terms and conditions of the Creative Commons Attribution (CC BY) license (http://creativecommons.org/licenses/by/4.0/).
Share and Cite
Nguyen, N.U.P.; Moehrle, M.G. Technological Drivers of Urban Innovation: A T-DNA Analysis Based on US Patent Data. Sustainability 2019, 11, 6966. https://doi.org/10.3390/su11246966
Nguyen NUP, Moehrle MG. Technological Drivers of Urban Innovation: A T-DNA Analysis Based on US Patent Data. Sustainability. 2019; 11(24):6966. https://doi.org/10.3390/su11246966
Chicago/Turabian StyleNguyen, Ngoc Uyen Phuong, and Martin G. Moehrle. 2019. "Technological Drivers of Urban Innovation: A T-DNA Analysis Based on US Patent Data" Sustainability 11, no. 24: 6966. https://doi.org/10.3390/su11246966
APA StyleNguyen, N. U. P., & Moehrle, M. G. (2019). Technological Drivers of Urban Innovation: A T-DNA Analysis Based on US Patent Data. Sustainability, 11(24), 6966. https://doi.org/10.3390/su11246966